NICE Journal of Business · Prof. Pikay Richardson Manchester Business School Manchester (UK) Prof....
132
ISSN : 0973-449X NICE J ournal of B usiness
Transcript of NICE Journal of Business · Prof. Pikay Richardson Manchester Business School Manchester (UK) Prof....

ISSN : 0973-449X
Volume 3, Numbers 1 & 2
2008
Shobhit Institute of Engineering & Technology, Meerut
A University declared by GoI u/s 3 of UGC Act 1956
NICE Journal of Business
HALF-YEARLY JOURNAL OF SHOBHIT UNIVERSITY, MEERUT (INDIA)
Return and Volatility Spillover betweenIndian and the US Markets
A Study of State Bank of India
for Foreign Exchange Exposure
A Study of Bank Managers in Haryana
From Boom to Bust
Telecom Service-Providers in Dehradun City
The Impact of Market-Orientation on Service Quality:
Appropriate HRM Practices for Small and Medium Enterprises: A Study in Africa
Developing Management Information System
Job Performance and Occupational Stress:
Review of Indian Stock Market during 2007 and 2008:
Service Quality in Telecom Industry: A Study of
RESEARCH PAPERS
COMMUNICATION
Marketing and Economy Interlinkages:A View of Rural India
Consumer Grievance Redress: A Bibliography
BOOK REVIEWS
:
:
Indrani Majumder
Deepa Sharma
K.N. Badhani
and Anil Gupta
and J.P.W. Shunda
and Hemraj Verma
Alka Sharma
Henry Ongori
Nidhi Jain
Nirmala Chaudhary
Harvinder Kaur
Prakash Tiwari
:
:
:
:
:
:
:
Listed in Cabell's Directory, USA

Prof. Abhinandan K. JainIndian Institute of Management, Ahmedabad
Prof. Alok SaklaniDirector
Apeejay School of ManagementDwarka, Delhi
Prof. Balram DograDirector
Apeejay Institute of ManagementJalandhar (Punjab)
Prof. Chris KnowlesOregon State University
Coravallis, USA
Prof. Daleep SinghDepartment of Management Studies
Maharshi Dayanand UniversityRohtak
Prof. H. ChaturvediDirector
Birla Institute of Management TechnologyGreater Noida
Prof. J.P. GuptaVice-Chancellor
J.I.I.T. University, Noida
Prof. J.S. PanwarDean, Faculty of Management Studies
Sardar Patel University,Vallabh Vidya Nagar (Gujarat)
NICE Journal of Business(Half-yearly Journal of School of Business Studies, Shobhit University, Meerut)
ISSN: 0973-449X
Chief Patron : Mr. Shobhit Kumar, Chancellor, Shobhit University, MeerutPatrons : Kunwar Shekhar Vijendra, Pro-Chancellor, Shobhit University, Meerut
Prof. Anoop Swarup, Vice-Chancellor, Shobhit University, Meerut
Editor : Prof. D.P.S. Verma, Advisor, Shobhit University, Meerut
EDITORIAL BOARD
Editorial Assistance: Shilpi Bisht and Upendra Gami
All correspondence pertaining to editorial and circulation matters may be addressed to:The Editor, NICE Journal of Business
School of Business Studies, Shobhit University, Modipuram, Meerut-250 110Phone 0121-257 5091/92; Fax 0121-257 5724
(Dialing code: from Delhi 95-121, from outside India: +91-121)e-mail: [email protected], & [email protected]
Any opinion expressed in the articles, published in the NICE Journal of Business, does not necessarily represent the viewof the Shobhit University/NICE Society, Meerut, or the Editor. Any material published in the Journal should not bereproduced or reprinted in any form, without prior permission from the Editor/Publisher.
Prof. Mukesh DhunnaDepartment of Management Studies
Maharshi Dayanand UniversityRohtak
Prof. P.K. JainDepartment of Management StudiesIndian Institute of Technology-Delhi
New Delhi
Prof. Pikay RichardsonManchester Business School
Manchester (UK)
Prof. Prem VratVice-Chancellor
UP Technical UniversityLucknow
Prof. R.D. SharmaRector, South CampusUniversity of Jammu
Jammu
Prof. Raghbir SinghDean, Academic Affairs
Guru Nanak Dev UniversityAmritsar
Prof. Yogendra VermaDepartment of Management Studies
Himachal Pradesh UniversityShimla

CONTENTS
From the Editor’s Desk ........................................................................................................................................... (iii)
RESEARCH PAPERS
Return and Volatility Spillover between Indian and US Stock Markets ....................................................... 1K.N. Badhani
The Impact of Market-Orientation on Service Quality: A Study of State Bank of India ......................... 17Alka Sharma and Anil Gupta
Appropriate HRM Practices for Small and Medium Enterprises: A Study in Africa ................................ 33Henry Ongori and J.P.W. Shunda
Developing Management Information System for Foreign Exchange Exposure ....................................... 43Nidhi Jain
Job Performance and Occupational Stress: A Study of Bank Managers ..................................................... 53Nirmala Chaudhary
Review of Indian Stock Market during 2007 and 2008: From Boom to Bust ............................................. 63Harvinder Kaur
Service Quality in Telecom Industry: ................................................................................................................ 77A Study of Telecom Service-Providers in Dehradun CityPrakash Tiwari and Hemraj Verma
COMMUNICATIONMarketing and Economy Interlinkages: A View of Rural India ................................................................... 87Indrani Majumder
Consumer Grievance Redress: A Bibliography ............................................................................................. 103Deepa Sharma
BOOK REVIEWS ............................................................................................................................................... 111
The New Age of Innovation: Driving Co-created Value through Global Networks(C.K. Prahalad and M.S. Krishnan)Prem Vrat
Business Statistics (J.K. Sharma)J.B. Singh
Financial Planning: A Ready Reckoner (Madhu Sinha)Harvinder Kaur
Crucial Conversation Tools for Talking when Stakes are High(Kerry Patterns, Joseph Grenny, Ron McMillan, and Al Switzler)Evgeniya Zharikova
A Text Book of Human Resource Management (R.S. Dwivedi)Kamlesh Jain

SHOBHIT UNIVERSITY, MEERUT
Shobhit University, declared by the Government of India, under Section 3 of the UniversityGrants Commission Act, 1956, envisaged and inspired by Babu Vijendra Kumar ji, whowas an eminent agriculturist and social worker from Gangoh (Saharanpur), U.P. ShobhitUniversity stands for going beyond the established standards and for nurturing technocratsand managers that have a global vision and insight in their chosen field and are globallyemployable in emerging areas, with special focus on the 21st century professionalrequirement.
School of Business Studies
School of Business Studies (SBS) is an integral part of the Shobhit University, MeerutCampus. It inherited the academic legacy of NICE Management College (established in1995) and has got a fresh window of autonomy in curriculum-designing and flexibility offoreign collaborations through academic exchange, credit transfer mechanism and bringingin increased industry component.
The SBS offers MBA, with numerous specialisations, like marketing, finance, humanresource management, operations management, supply-chain and retail management,insurance and risk management, etc. It also offers a Ph.D. programme in management.
NICE JOURNAL OF BUSINESS
NICE Journal of Business is a half-yearly journal, earlier published by NICE ManagementCollege, Meerut, and now being brought out by the School of Business Studies, ShobhitUniversity, Meerut. It seeks to provide a platform to research scholars, practicing managers,and academicians in business management, commerce, economics, and allied fields, topresent their research findings and share their views and experiences.
The journal aims at disseminating information about the recent developments in therelevant fields, by way of research articles, book reviews, Ph.D. thesis abstracts, case studies,and bibliographies on relevant topics. Original contributions received for publication inthe journal are subjected to a blind review by experts in the relevant field.
The journal is listed in Cabell’s Directory, USA.

It is a great privilege for me to place before you the present issue of NICE Journal ofBusiness.
This issue of the journal contains research papers, short articles, a bibliographyand book reviews on topics of current interest in business and allied areas. Theresearch papers and short articles pertain to varied business areas: Finance (stockreturn and volatility spillover between Indian and the US stock markets, workingof Indian stock market), Marketing (impact of market-orientation on service qualityin banking, service quality in telecom industry), Human Resource Management andOrganisation Behaviour (appropriate HRM practices for small and mediumenterprises, relationship of job performance and occupational stress, influence ofjob satisfaction on organisational commitment, managerial leadership), InternationalBusiness (MIS for foreign exchange exposure), and Macro-economic Environment andRural Economy (interlinkages of marketing and economy).
In his paper, Dr. K.N. Badhani explores the linkages between the Indian andthe US stock markets, in line with the ‘de-coupling’ hypothesis, using the VAR-BEKK-GARCH technique. The results show that there is a substantive stock returnand volatility spillover from the US to the Indian market and the bond between thesetwo markets has become stronger during the recent years.
In a competitive environment, business firms have to pay adequate attention totheir customers, and orient themselves to the market. Dr. Alka Sharma and Mr. AnilGupta seek to ascertain the extent to which the State Bank of India, the largestpublic-sector bank in the country, has adopted market-orientation. They examinethis important phenomenon on the basis of intelligence generation anddissemination and responsiveness. They also assess the service quality of the bankand the impact of market-orientation on customer perception of the premier bank’sservice quality. They make interesting findings on a topic of common interest.
Most of the studies for developing HRM practices have focused on large andmultinational corporations. Very little research work has been done on developingHRM practices for small and medium enterprises (SMEs), particularly in the contextof the developing African economies. Two scholars from the University of Botswana(Africa), Henry Ongori and J.P.W. Shunda, seeks to develop appropriate HRMpractices for SMEs in Africa. Their findings are likely to benefit the managers andowners of SMEs in developing economies, on the critical dimensions of HRM.
Indian firms have often been sceptical in venturing out to the exciting and oftenmysterious world of global derivatives. Dr. Nidhi Jain seeks to help businessmanagers in India to make informed decisions through new technologies. Sheproposes an MIS system for foreign exchange exposure management in Indianfirms. The findings based on a survey of selected business firms, would be helpfulto managers gain an understanding of the marketplace. The survey has revealedthat Indian companies consider the transaction exposure more important than thetranslation exposure; the economic exposure ranked third in their priority.
Occupational stress often adversely affects an employee’s performance on thejob. Dr. Nirmala Chaudhary examines the relationship of job performance andoccupational stress of bank managers in the State of Haryana. She identifies theF
rom th
e Edit
or’s D
esk

major predictors of occupational stress, which have a negative and significantcorrelation with the job performance of bank managers, who are in for interestingtips based on a survey in an interesting area of their work-life.
The years 2007 and 2008 presented a unique period as regards the performanceof the Indian stock market and as compared to other major world markets. Duringthis period, the Indian market rose steadily to reach historic heights. Thereafter, itfell abruptly towards the end of 2008, owing to the global fallout of the US mortgagecrisis. In her article, Dr. Harvinder Kaur presents a snapshot of the Indian stockmarket performance during the period and compares it with that of the overseasmarkets. A number of parameters used to capture the market performance includethe daily returns, volatility of daily returns, market capitalisation, FII fund flows,and F&O, and mutual fund activity.
Due to unprecedented expansion of telecom services in the urban as well as therural population, the telecom service has attracted the attention of almost everyone.A survey-based study, by Mr. Prakash Tiwari and Mr. Hemraj Verma, seeks toidentify the major factors affecting the telecom service quality of six major mobileservice-providers, operating in Dehradun, the capital city of Uttarakhand. Theyhave sought to measure the service quality on the basis of the factors identified assignificant.
Marketing is said to be concerned with creating and delivering the standard ofliving to the society. It affects almost every area of our life. Indrani Majumder seeksto explore whether the marketing activities of business organisations has reallyempowered the rural Indians. She uses voluminous demographic, economic, andmarketing data for her analysis.
In the section on book reviews, we have five book reviews written by expertsin the relevant fields. The books reviewed pertain to subjects as diverse asinnovation, business statistics, financial planning, effective communication tools,and human resource management.
The subject of redress of consumer grievances by companies and regulatorybodies has received keen attention from scholars, legal practitioners, and consumeractivists, the world over, especially in the US and the UK. Deepa Sharma’scomprehensive bibliography on the subject includes standard text and referencebooks, selected Ph.D theses, research articles, and major pieces of current legislationin India.
I express my gratitude to eminent authors of research articles, scholarlybiography and book reviewers for their valuable contribution to the journal.Moreover, several experts rendered assistance, and made available their expertisein assessing the articles and making critical comments and suggestions forimproving their quality. I owe a word of gratitude to each one of them.
Mr. Shobhit Kumar, Chancellor; Kunwar Shekhar Vijendra, Pro-Chancellor; andProfessor Anoop Swarup, Vice-Chancellor of Shobhit University, took keen interestin this academic endeavour. I express my profound gratitude to them.
Shobhit University D.P.S. VERMAMEERUT Editor
* Dr. K.N. Badhani is an Associate Professor in the Institute of Rural Management, Anand (Gujarat); e-mail: [email protected]
RETURN AND VOLATILITY SPILLOVERBETWEEN INDIAN AND THE US MARKETS
K. N. Badhani*
Abstract
This paper seeks to explore the interaction between the Indian and the US stock markets, from January2000 to December 2007. While the S&P CNX Nifty index represents the stock prices in India, the stockprices in the US are represented by the NYSE Composite index. There is no long-run co-integrationbetween the levels of stock prices in these two markets. However, in the short-run, there is a substantialspillover effect of the price movements in the US market on stock returns and volatility in India. Contraryto the much-acclaimed de-coupling hypothesis, the evidence suggests that the bonds between the Indianand the US stock markets have become stronger during recent years.
Key Words: Integration, De-coupling, Co-integration, VAR, Multivariate-GARCH.JEL Classification: C32, F15, G15
INTRODUCTION
FOR the past 100 years, the rate of growth ofoutput in the developing countries hasdepended on the rate of growth of output
in the developed countries. When the developedcountries grow fast, the developing ones alsogrow fast and when the developed slow down,the developing ones also slow down. Theselinkages are equally strong in the financial sector,as the stock markets in developing countries sinkor swim with the stock markets in the developedcountries. The United States of America's (US)economy has emerged so far as an unchallengedleader of the world economy since World War II.It is by far the largest economy of the world interm of the GDP; the largest importer andexporter, and the largest financial market of the
world, in terms of stock market capitalisation (USmarket capitalisation is about 45 per cent of theworld's total market capitalisation). The USfinancial market has been leading the ups anddowns of the world's financial markets. The tiesamong the financial markets the world overbecame stronger after liberalisation of most of theemerging markets over last two decades. Thisprocess further strengthened the leading role ofthe US economy as being the biggest source ofinvestment flow and the biggest trader of theworld. The strong influence of the US economyon the world economy is often summed up by thesaying: "If the US sneezes, the rest of the worldcatches a cold!"
However, during the last few months of 2007,it appeared that the US economy was about to
01-K.N. Badhani.p65 2/24/2009, 5:15 PM1

K.N. Badhani
2 NICE Journal of Business l Vol. 3 l Nos. 1 & 2 l 2008
lose its leadership role. The US economy startedto slowdown in the middle of 2006, but theemerging financial markets were able to remainamazingly immune till as late as November 2007.The turmoil in the US credit market began as farback as February 2007; but stocks in developingcountries were remarkably resilient and keptpowering ahead. This situation led theeconomists to proffer the hypothesis that theemerging markets, under the leadership of Chinaand India, are de-coupling from the US and otherdeveloped economies and have entered the stageof self-sustained growth (see, for example, IMF,2007, and Akin and Kose, 2007, for discussionson the de-coupling hypothesis). The decouplingis most likely the reality of the future; but fromthe post-September 2007 developments it hasnow become clear that the hypothesis of financialdecoupling was premature and perhapsmisplaced (although there may be some strengthbehind the hypothesis of the real-sector de-coupling). The correlation between the Indianand the US equity markets has been at thehistorically high level during the first quarter of2008.
This study investigates the return andvolatility linkage between the US and the Indianstock markets during the period of eight yearsfrom January 2000 to December 2007, in the lightof the de-coupling hypothesis. The results showno sign of de-coupling. On the contrary, duringthe last two years, the level of correlation betweenthe daily movements in stock prices in the twocountries had substantially increased.
REVIEW OF LITERATURE
The growing international integration of financialmarkets has prompted a vast amount of empiricalresearch to examine the mechanism throughwhich stock market movements are transmittedaround the world. The studies have sought toevaluate how stock returns in one national stockmarket influenced the return in those of anotherstock market and their implications for pricing ofsecurities, management of portfolios, hedgingand other trading strategies, and for regulatory
policies which aimed at curbing the contagion.The earliest studies on the international stockmarket linkage have focused on the identificationof short-term benefits of international portfoliodiversification. For example, Ripley (1973), Solnik(1974), and Hilliard (1979) examined the short-run correlation of stock returns across nationalmarkets and discovered the existence ofsubstantial possibilities to diversifyinternationally, taking benefit of low correlationamong national stock markets. However, duringthe 1980s, strong financial linkages among thecountries started evolving, particularly due to thefinancial liberalisation, adopted by most of thedeveloping countries.
The strong integration of national capitalmarkets came into realisation from the contagionof financial crisis during the last two decades,specifically during the US market crisis of 1987(see, for example, Eun and Shim, 1989; Hamao,Masulis and Ng, 1990, and King, Sentana andWadhwani, 1994, Lee and Kim, 1994), the Asianeconomic crisis of 1997-98 (see, for example,Sheng and Tu, 2000 and Kim, 2005) and, recently,the US sub-prime crisis of 2007. The integrationof national financial markets has reduced thebenefits of international diversification. For adiscussion on this aspect, see Ozun, Turk andCentkin, 2007. Some researchers (for example,Griffin and Karolyi, 1998; Cavaglia, Brightmanand Aked, 2000; Brooks and Negro, 2002 andYang, Tapon and Sun, 2006) claim to the extentthat the cross-industry diversification has cometo dominate the cross-country diversification.
The bourgeoning literature on the integrationof international financial markets is too wide tosurvey here. A comprehensive survey of literatureon this issue may be found in Kearney and Lucey,(2004). The studies have covered various issues,including the magnitude of spillover of theshocks from one market to another, trends in thespillover effect and its determinants, impact ofspillover and its implication for expected return,and risk management of asset-portfolios.
The studies on market integration are basedon different methodological frameworks. The
01-K.N. Badhani.p65 2/24/2009, 5:15 PM2

Return and Volatility Spillover between Indian and the US Markets
NICE Journal of Business l Vol. 3 l Nos. 1 & 2 l 2008 3
first category of the empirical studies haveinvestigated the impact of increasing marketintegration in the context of Capital AssetsPricing Model (CAPM) and factor models (see,for example, Errunza and Losq, 1985; Bekaertand Harvey, 2000; Henry, 2005; and Bekaert,Hodrick and Zhang, 2007).
The second category of the studies have usedthe cointegration analysis to examine the lon g-run relationship among markets (e.g., Taylor andTonks, 1989; Kasa, 1992; Masih and Masih, 2001;and Ewing, Payne, and Sowell, 2001). On theother hand, the third category of the studies haveemphasised on the examination of short-runinteractions among the markets using thetechniques, like vector autoregression (VAR) andunivariate and multivariate GARCH models, forthe analysis (see, for example, Hamao, Masulis,and Ng, 1990; Karyoli, 1995; and Koutmos andBooth, 1995, Worthington and Higgs, 2004,particularly for the application of multivariateGARCH analysis).
Researchers have investigated the interactionamong developed markets and among countriesbelonging to particular economic block orgeographical proximity (such as NAFTA,European Block and Pacific Rim). More recently,particularly with financial liberalisation ofemerging markets, the impact of the spillovereffect from developed markets to emergingmarkets has received prominent research interest(see, for example, Bekaert and Harvey, 2000; andKim and Singal, 2000). The influence of the USeconomy and stock market on global markets ispervasive and well-documented. Among theearlier studies on this aspect, Hamao, Masulis andNg (1990) found that there was a significantspillover effect from the US and the UK stockmarkets to the Japanese market, but not viceversa; whereas Lin, Engle and Ito (1994) reportedbi-directional causality between the US and theJapanese markets. Park and Fatemi (19 93)studied the influence of the US stock market onseveral stock markets the world over. They foundthat the Australian market was the most sensitiveto the shocks in the US market followed by the
stock markets of Singapore, Hong Kong, andNetherlands. Some more recent studies have alsodocumented the leading role of the US market inthe world financial market (see, for example,Jankiramana and Lamba, 1998; Hasiao, Hasiao,and Yamashita, 2003; Kim, 2005; and Canarella,Sapra, and Pollard, 2007).
Although there is a vast amount of literatureavailable on the spillover of information acrossthe markets, the studies focusing on externallinkage of the Indian equity market are rare.Kumar and Mukhopadyay (2002) used Grangercausality test and univariate GARCH model tostudy the return and volatility linkage betweenthe Indian and the US markets. They found asignificant return and volatility spillover from theUS to India. Similarly, Nair and Ramana than(2003) also reported the unidirectional spilloverof returns from the US to the Indian market. Nathand Verma (2003) examined the long-runequilibrium relationship among three major stockmarkets of South Asia, viz., India, Singapore, andTaiwan, and found no cointegration between thestock market indices representing these ma rkets.
Lamba (2004) analysed the dynamicrelationship between the South Asian markets ofIndia, Pakistan, and Sri Lanka, and the majordeveloped markets, during the period July 1997to February 2003. He found that the Indianmarket was influenced by the large developedequity markets, including the US, the UK andJapan, and that this influence had strengthenedduring the more recent period of January 2000 toFebruary 2003.
Choudhry (2004) studied, inter alia, theinterlinks of the Indian stock market with the USand the Pakistani stock markets. He found two-way linkages between the Indian and thePakistani markets, and a one-way influence of theUS market on these two markets. Wong, Agarwaland Du (2005) reported the fractional integrationof the Indian stock market with developedmarkets of the US, the UK, and Japan, withinnovations in the developed marketssignificantly influencing the Indian market, butnot vice versa. Similarly, Chen and Lobo (2006)
01-K.N. Badhani.p65 2/24/2009, 5:15 PM3

K.N. Badhani
4 NICE Journal of Business l Vol. 3 l Nos. 1 & 2 l 2008
reported a fractional integration among theIndian, US and Chinese markets. Their studyrevealed that the US stock market plays adominant role in the relations with the other twomarkets, whereas there was an interactiverelationship between the Indian and the Chinesemarkets.
Mukherjee and Mishra (2007) studied therelationship of the Indian stock market with asample of twenty-two national stock markets,including the US, using vector autoregression andcointegration frameworks, assuming timeinvariant variance-covariance matrix. They usedGeweke-statistics to analyse thecontemporaneous relationship and feedback.Their result shows that the contemporaneousrelationship among the markets is strengtheningwith time, which signifies increasing marketefficiency in the international scenario.
MOTIVATION AND OBJECTIVES
The present study was primarily motivated bythe on-going debate on the decouplinghypothesis. The period of the study pertains tothe period when the hypothesis of decouplingwas being aired (2006-2007). This period was notcovered in the earlier studies referred to above.On the contrary to what was expected, we foundan increased level of interaction between theIndian and the US markets, during this period.Methodologically, this study differs from theearlier studies focusing on the Indian stockmarket in the sense that it explores the possibilityof volatility spillover by including a time-varyingvolatility specification in the BEKK-multivariateGARCH framework. The study, in particular,seeks to answer the following questions:
1. Is there a long-run cointegration between theIndian and the US market?
2. Is there a short-run interaction between thereturns in these two markets? If yes, what isthe direction of the return spillover?
3. Is there any structural change in the natureof interaction of the return-spillover during
recent years? If yes, what is the direction ofthis change? Whether this change isconsistent with the hypothesis ofdecoupling?
4. Is there a volatility spillover between thesetwo markets? If yes, what is the direction ofthis spillover?
DATA AND METHODOLOGY
This study covers a sample period of eight years,from January 2000 to December 2007. The stockprices in India are represented by the dailyclosing value of the S&P CNX Nifty Index.Similarly, the daily closing values of NYSEComposite Index represents the US stock prices.If there had been no trading on a particular day
Table 1
A - Descriptive Statistics
Particulars Ret-NYSE Ret-NSE
Mean 1.88×10⁻⁴ 6.95×10⁻⁴
Standard Deviation 0.0101 0.0159
Skewness -0.0643 -1.2112
Kurtosis 5.0755 13.8532
J-B Statistic 349.92** 10006.10**
B-P, Q Statistic(15)
For Returns 28.03** 46.42**
For Sqr. Returns 1036.30** 155.69**
B - Unit Root Tests
Variable ADF Test PP Test
with without with withoutintercept intercept intercept intercept
Log-NYSE 0.30 1.76 0.98 5.67
Log-NSE 1.37 2.00 1.79 5.15
Ret-NYSE 8.17** 8.99** 1772.48** 1755.54**
Ret-NSE 8.02** 8.41** 1807.51** 1743.33**
C - Johansen's Cointegration Test
(Between LogNYSE and LogNSE)
max Test LR (Trace) Test
H0 (r=) max H0 (r=) Trace
0 8.3 1 5.0
1 5.0 0 13.4
** p<0.01* p<0.05
01-K.N. Badhani.p65 2/24/2009, 5:15 PM4

Return and Volatility Spillover between Indian and the US Markets
NICE Journal of Business l Vol. 3 l Nos. 1 & 2 l 2008 5
in either of the markets, that day was excludedfrom the sample. Thus, the matchingobservations for both the indices constituted thesample for the study. All the figures were log-transformed and differentiated to obtain theindex returns.
Descriptive Statistics
The descriptive statistics of the returns on boththe indices (Ret-NSE and Ret-NYSE) are shownin Table 1, Panel A. The average NSE Nifty returns(Ret-NSE) are higher than the average returns onthe NYSE composite index (Ret-NYSE). The NSEreturns (Ret-NSE) are also highly skewed to theleft-side and are fat-tailed. This shows that thefrequency of large negative returns is higher inthe Indian market than what is implied by thenormal distribution. The high values of theJarque-Bera statistic for both the return seriesindicate their significant departure from normaldistribution; but this departure is much strongerin the case of the NSE returns. The significantvalues of the Box-Pierce statistics, up to 15th lag-order, both for returns and squared returns series,indicate the presence of autocorrelation andARCH effects in returns.
Unit Root Test
The knowledge of stationarity or the order ofintegration of the variables is crucial forconstruction of consistent econometric models.Two popular tests—the Augmented Dickey-Fuller(ADF) unit root test and the Phillips-Perron (PP)unit root test, have been applied to test thestationary of the log-transformed indices(representing the level of stock prices) and theirfirst differences (representing the returns). The PPtest is considered to be more powerful than theADF test but it is also prone to size-distortion;therefore, better results can be obtained if both ofthese tests are applied jointly. The results presentedin Table 1, Panel B, shows that the null hypothesisof unit-root is not rejected for log-transformedindices at level (Log-NSE and Log-NYSE).Therefore, these series are non-stationary. On the
other hand, their first-differences (i.e., returns) arestationary, as the null hypothesis of unit root isrejected for them on the basis of both the ADF andthe PP tests. If a process has unit root at level andits first-difference is stationary, the process is calledintegration of order-1, or the I (1) process.Therefore, both the indices representing the levelof stock prices in India and the US follow the I (1)process.
Co-integration Test
The regression models, with non-stationaryvariables, may produce spurious results (Grangerand Newbold, 1974). Therefore, it is generallyadvised that the variables following the I (1)process should be included in an econometricmodel only after making them stationary throughdifferencing. However, Engle and Granger (1987)show that if two or more variables of the sameorder are integrated (say, I(1)), there may exist aco-integrating relationship among them, and inthat case, the regression model involving theseco-integrated variables can be interpreted in aneconomically meaningful way (that is, it is notspurious). The co-integration occurs between twoor more non-stationary variables, which areassociated with each other with an equilibriumrelationship and, therefore, share a commonstochastic trend.
According to famous Granger representationtheorem, if the variables are co-integrated, theirrelationship can be expressed in the form of anerror correction mechanism (ECM). That is,whenever any disequilibrium takes place, atleast one of the variables, included in theequilibrium relationship, will respond to restorethe equilibrium. The co-integrated variablesmust be modelled in the form of an error-correction model, because valuable informationwill be lost if these are modelled simply in adifferenced-form without accounting for theirequilibrium relationship. On the other hand, ifthe variables are not co-integrated, they must beincluded in an econometric model only aftermaking them stationary through differencing.
01-K.N. Badhani.p65 2/24/2009, 5:15 PM5

K.N. Badhani
6 NICE Journal of Business l Vol. 3 l Nos. 1 & 2 l 2008
Therefore, testing the co-integration among thevariables is an important step of the time-seriesmodelling.
A linear combination of unit-root processes isalso a unit-root process. Therefore, the residualsfrom the regression model involving two non-cointegrated unit-root processes also have a unit-root. However, if two non-stationary variables areco-integrated, they cancel out the stochastictrends of each other and the residuals from theirregression model are stationary. Building on thesame properties of co-integrated variables, Engleand Granger (1987) developed their co-integration test. However, this test has now beenreplaced by more powerful tests developed byJohansen (Johansen, 1988; and Johansen andJuselius, 1990). Johansen's tests are based on thereduced rank vector auto-regression (VAR)model.
Since the log-transformed values of indices(Log-NSE and Log-NYSE) are I (1) processes,there may be a possibility that these two variablesmay be co-integrated. If these two are found tobe co-integrated, they will be modelled in theframework of ECM. Otherwise, their first-differenced stationary processes (i.e., returns) willbe used for econometric modelling. TheJohansen's co-integration test is used to test theco-integration between Log-NYSE and Log-NSE.Johansen suggests two alternative tests foridentifying the number of co-integration relations(r) among the variables - the lambda-max ( max)test and the likelihood ratio (trace) test. If thereare k variables, then there may be minimum zeroand maximum k-1 co-integrating relationshipsamong them.
The max test is used to test the null hypothesisof r co-integrating relations against the alternativehypothesis of r+1, co-integrating relations. On theother hand, trace test examines the nullhypothesis of r co-integrating relations againstthe alternative hypothesis of k (full rank) co-integrating relations. Since, in this study, we haveonly two variables, r can have only two values -0 and 1. We have used Schwarz information
criterion for lag-length selection. The Johansen'stest is sensitive towards specification of interceptsand trends in the VAR equation. Following thePantula principle, we used the test with threepossible combinations of the specifications ofthese deterministic terms. However, the resultsare not found sensitive to specification. Theresults produced in Panel C of Table 1, areobtained from the most restrictive model, viz., themodel containing an intercept not restricted to co-integration space.
The results of the co-integration test show thatthe null hypothesis of zero co-integratingrelationship is not rejected on the basis of boththe tests. Therefore, the stock prices in India andthe US are not co-integrated. That is, these stockprices are not associated with each other, with along-run equilibrium relationship. In thissituation, it is appropriate to constructeconometric models using stock returns (ratherthan the level of stock prices) in these twomarkets.
In order to study the interlinkage between theUS and the Indian stock markets, the standardvector auto-regression (VAR) model was usedand the direction of causality was analysed, usingthe Granger causality (block-significance) test,innovation response analysis, and the variancedecomposition analysis. The stability of therelationship between these two markets wastested, using Chow's test of parameter stability.Finally, the volatility was analysed by extendingthe VAR model with the BEKK-multivariateGARCH model. The details of these models andthe results of the analysis are presented in the nextsection.
RESULTS AND DISCUSSION
The Vector Autoregression
The vector autoregression (VAR) models are thenatural extensions of the univariate ARMAmodels. Sims (1980) suggested the VAR as analternative of dynamic simultaneous equationmodels which, according to him, involve too
01-K.N. Badhani.p65 2/24/2009, 5:15 PM6

Return and Volatility Spillover between Indian and the US Markets
NICE Journal of Business l Vol. 3 l Nos. 1 & 2 l 2008 7
many arbitrary decisions. The simplest VARmodel, known as the standard VAR, can bepresented as an equation given below:
0 1 1...............
p tt t t py y yA A A
… (1)
where,
ty is a vector of all the k variables includedin the system,
0A is k×1 vector of intercepts,
1..... pA A are k×k matrix of coefficients, and
t is the vector of error terms.
In a standard VAR, all the variables aretreated as endogenous and the regressorsinclude only lagged values of these endogenousvariables (these conditions are relaxed in someextensions of VAR model, such as the VARXmodel and the structured VAR model). Sincethe contemporaneous terms of the variables arenot included in the list of independentvariables, this model is based on the implicitassumption that the contemporaneousinnovations in the variables are not correlated.In the present context, this assumption is notvery far from reality. On a particular date, thetrading starts in the US when the Indianmarkets are closed.
Therefore, innovations in the US market cannot cause stock prices in the Indian market onthe same day. On the other hand, generally thestock prices in developed markets cause, but arenot caused by, innovations in the emergingmarkets. It is less likely that innovations in theIndian market will cause stock prices in the USmarket on the same date in a significant manner.Therefore, the issue of contemporaneouscausality may be ignored and the standard VARmodel can be used as a structural VAR model toexplain the interaction between the Indian andthe US markets.
The standard VAR model of Ret-NYSE andRet-NSE can be presented as equation (2) :
1 110 111 12
1 120 121 22
111 12
221 22
Re Re _.....
Re Re
Re _
Re
t t
t t
p pt p t
p pt p t
t NYSE t NYSE
t NSE t NSE
t NYSE
t NSE
..(2)
Before estimating the above system ofequations the order of VAR, p is to be decided. The
Table 2
Vector Auto Regression, VAR (3, 3) Model
A - Regression Estimates
Regressor Equation for Equation forRet-NYSE Ret-NSE
Coeff. t Coeff. t
Constant 0.0002 0.81 0.0006 1.79
Ret-NYSE (-1) -0.0014 0.06 0.2892 8.20**
Ret-NYSE (-2) -0.0205 0.87 0.1109 3.10**
Ret-NYSE (-3) -0.0025 0.10 0.0081 3.30**
Ret-NSE (-1) 0.0022 0.14 0.0271 1.18
Ret-NSE (-2) 0.0150 1.00 -0.0969 4.24**
Ret-NSE (-3) 0.0050 0.34 0.0019 0.08
Diagnostics:
R2 0.00 0.05
Residual Skewness -0.05 -1.22
Residual Kurtosis 5.07 14.21
J-B Statistics 346.60** 10623.50**
B-P Statistics (15)
Residuals 28.05** 19.83**
Sqr. Residuals 973.45** 150.15**
B - Granger Causality (Block Significance) Test
Null-Hypothesis (H0) F-Test Wald Test(2 distri-
bution)
Ret-NSE does not cause Ret-NYSE 0.39 1.00
Ret-NYSE does not cause Ret-NSE 27.92** 12.16**
C - Variance Decomposition
(Up to 10th Lag)
Variance of Percentages of thethe Variable variance caused by
Ret-NYSE Ret-NSE
Ret-NYSE 99.88 0.12
Ret-NSE 4.53 95.48
** p<0.01* p<0.05
01-K.N. Badhani.p65 2/24/2009, 5:15 PM7

K.N. Badhani
8 NICE Journal of Business l Vol. 3 l Nos. 1 & 2 l 2008
Schwarz Bayesian Criterion (SBC) has been usedfor this purpose and, accordingly, p is decided tobe equal to 3. Therefore, three lagged values of bothRet-NYSE and Ret-NSE are used as regressors inthe above model. The model is estimated, usingthe ordinary least squares (OLS) estimator. Theresults are presented in Table 2 Panel A.
In the equation of Ret-NYSE, the individualcoefficients of lagged values of Ret-NSE are notsignificant. On the other hand, all the coefficientsof Ret-NYSE in the equation of Ret-NSE areindividually significant at 0.05 level. The VARmodel explains five-percent variations in Ret-NSE (R2=0.05), but it is unable to explain anysignificant proportion of variability in Ret-NYSE.These results suggest that the causality runs fromRet-NYSE to Ret-NSE. However, sometimes theinterpretation of individual lags-coefficients ofVAR is rather difficult. Therefore, summarystatistics - block significance, innovationresponse, and variance decomposition, are usedfor interpretations of the VAR models.
Granger Causality (Block Significance) Test
The notion of Granger causality (Granger, 1969)is based on the belief that 'the effect can not comebefore the cause'. A variable, say x t, is said to becausing another variable, say y t, if the coefficientsof lagged values of x t are jointly significant in theregression model of y t. In the VAR model, thecausality can be evaluated by examining the jointsignificance of lagged coefficients of one variablein the equation of another variable. This kind ofsignificance testing is called the block significancetest and it can be performed with the usual F-testor the Wald-test, used for evaluation of parameterrestrictions. In the context of the present study,the spillover of returns from one market toanother market can be analysed by testing thefollowing Granger non-causality hypotheses:
Hypothesis 11 2 3
12 12 120 : 0H : Ret-NSE does not causeRet-NYSE.
1 2 312 12 121: 0H : Ret-NSE causes Ret-NYSE.
Hypothesis: 2
1 2 321 21 210 : 0H : Ret-NYSE does not cause
Ret-NSE.
1 2 321 21 211: 0H : Ret-NYSE causes Ret-
NSE.
The results are presented in Table 2, Panel B.Hypothesis 1 is not rejected but Hypothesis 2 isrejected on the basis of the F-test and the Wald-test. Therefore, there is only one-way causalityrunning from Ret-NYSE to Ret-NSE. Thissuggests that there is unidirectional returnspillover from the US market to the Indianmarket. Stock prices in India get affectedsignificantly by information signals coming fromthe US market, but information signals from theIndian market does not affect the US market.
Impulse Response Analysis
Since a univariate AR model can be representedas an infinitive order moving average (MA)process, a stable VAR model of order k can berepresented as an infinitive order vector movingaverage (VMA) process, as given in the followingequation:
1 21 2.............
t t tty … (3)
This representation serves as a key to studythe impulse response function (IRF). An IRFallows one to trace the time path of the impact ofa shock in one variable on all the variablescontained in the VAR. However, the standardimpulse response analysis assumes that the shockoccurs in one variable at a time. Such anassumption may be valid only if the shocks indifferent variables are not correlated. Figure 1presents diagrammatically the IRF of thevariables included in the study (Ret-NYSE andRet-NSE), together with its ±2SE band up to 10thlag-order. The impact of a shock in Ret-NYSE onRet-NSE is significant up to the 3rd lag-order. Ashock of one standardised unit in Ret-NYSE
01-K.N. Badhani.p65 2/24/2009, 5:15 PM8

Return and Volatility Spillover between Indian and the US Markets
NICE Journal of Business l Vol. 3 l Nos. 1 & 2 l 2008 9
produces an impact of +0.015458 standardisedunit in Ret-NSE cumulatively up to the 10th lag-order. On the other hand, one standardised unitshock in Ret-NSE produces an impact of only+0.003633 standardised unit in Ret-NYSE up tothe 10th lag-order, and this impact is notsignificantly different from zero at any lag-orderas suggested by ±2SE band.
Variance Decomposition Analysis
Variance decomposition analysis is anotheralternative representation to show how aninnovation in one variable affects the othervariables included in the VAR. It shows that ifother factors remain unchanged and one of thevariable experiences a shock of one standardisedunit, then what proportion of the variance inother variable can be attributed to that shock aftert periods ahead of the shock. Table 2, Panel C
show the results of variance decomposition at10th lag-order. A shock of one standardised unitin Ret-NYSE can explain 6.45 percent variance inRet-NSE after ten days of the shock. On the otherhand, a shock of one standardised unit in Ret-NSEcan explain only 0.06 per cent of the variance inRet-NYSE after ten days.
Test of Parameter Stability
So far, we have analysed the interaction betweenthe Indian and the US stock markets during theperiod of eight years from 2000 to 2007, with animplicit assumption that the nature of theinteraction would have remained the sameduring this entire period. This assumption maybe flawed and there may be substantial changesin the nature of interaction between these twomarkets. There are contrary claims regarding thischange. On the one hand, it is claimed that the
Fig. 1: Impulse Response Analysis
-0.002
0.000
0.002
0.004
0.006
0.008
0.010
0.012
1 2 3 4 5 6 7 8 9 10-0.002
0.000
0.002
0.004
0.006
0.008
0.010
0.012
1 2 3 4 5 6 7 8 9 10
Response of RET_NYSE to RET_NYSE Response of RET_NYSE to RET_NSE
-0.005
0.000
0.005
0.010
0.015
0.020
1 2 3 4 5 6 7 8 9 10
Response of RET_NSE to RET_NYSE
Response to One S.D. Innovations ± 2 S.E.
-0.005
0.000
0.005
0.010
0.015
0.020
1 2 3 4 5 6 7 8 9 10
Response of RET_NSE to RET_NSE
01-K.N. Badhani.p65 2/24/2009, 5:15 PM9
K.N. Badhani
10 NICE Journal of Business l Vol. 3 l Nos. 1 & 2 l 2008
interdependence between these two marketswould have increased with increasing integrationof world market. The increasing level of the FII-flow and consequently the increasing role of theFIIs in deciding the direction of changes in theIndian market is one of the important sources ofthe strengthening of integration of Indian marketwith the US market. On the other hand, it is alsobeing claimed in some quarters that as theeconomic fundaments of the country gettingstronger, it is gaining more strength to resist toexternal shocks.
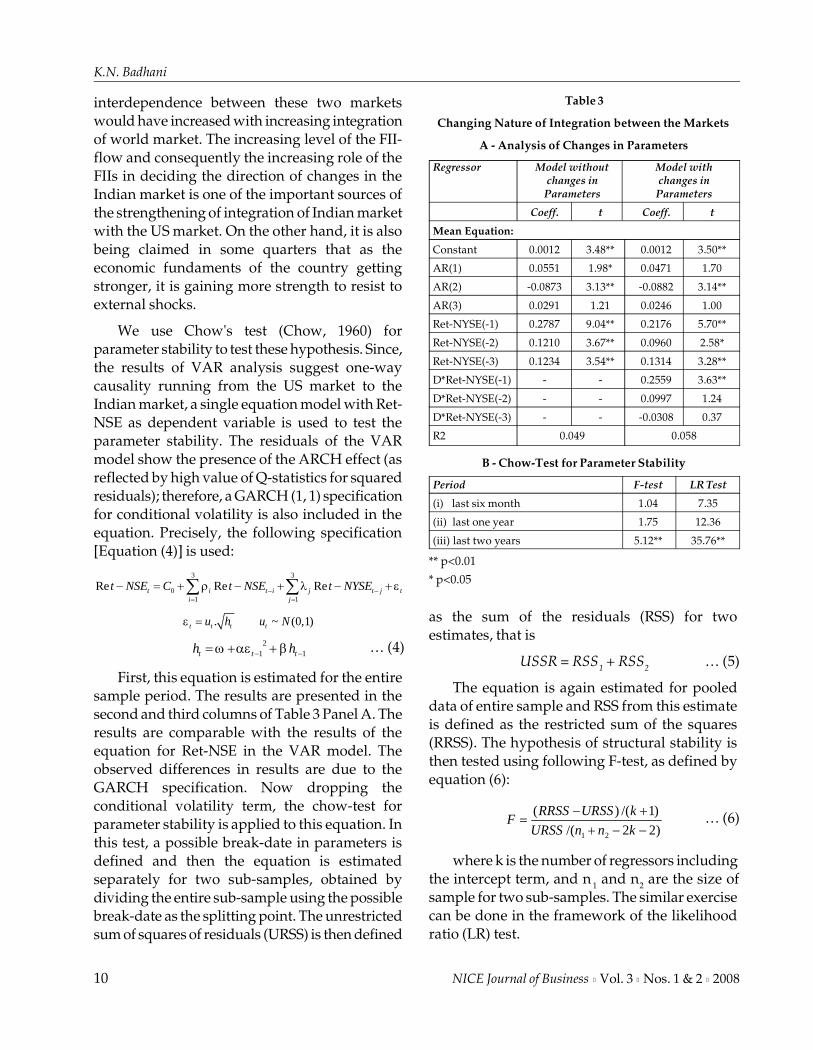
We use Chow's test (Chow, 1960) forparameter stability to test these hypothesis. Since,the results of VAR analysis suggest one-waycausality running from the US market to theIndian market, a single equation model with Ret-NSE as dependent variable is used to test theparameter stability. The residuals of the VARmodel show the presence of the ARCH effect (asreflected by high value of Q-statistics for squaredresiduals); therefore, a GARCH (1, 1) specificationfor conditional volatility is also included in theequation. Precisely, the following specification[Equation (4)] is used:
3 3
01 1
Re Re Ret i t i j t j ti j
t NSE C t NSE t NYSE
. ~ (0,1)t t t tu h u N
21 1t t th h … (4)
First, this equation is estimated for the entiresample period. The results are presented in thesecond and third columns of Table 3 Panel A. Theresults are comparable with the results of theequation for Ret-NSE in the VAR model. Theobserved differences in results are due to theGARCH specification. Now dropping theconditional volatility term, the chow-test forparameter stability is applied to this equation. Inthis test, a possible break-date in parameters isdefined and then the equation is estimatedseparately for two sub-samples, obtained bydividing the entire sub-sample using the possiblebreak-date as the splitting point. The unrestrictedsum of squares of residuals (URSS) is then defined
as the sum of the residuals (RSS) for twoestimates, that is
USSR = RSS1 + RSS2 … (5)
The equation is again estimated for pooleddata of entire sample and RSS from this estimateis defined as the restricted sum of the squares(RRSS). The hypothesis of structural stability isthen tested using following F-test, as defined byequation (6):
1 2
( ) /( 1)
/( 2 2)
RRSS URSS kF
URSS n n k
… (6)
where k is the number of regressors includingthe intercept term, and n 1 and n2 are the size ofsample for two sub-samples. The similar exercisecan be done in the framework of the likelihoodratio (LR) test.
Table 3
Changing Nature of Integration between the Markets
A - Analysis of Changes in Parameters
Regressor Model without Model withchanges in changes in
Parameters Parameters
Coeff. t Coeff. t
Mean Equation:
Constant 0.0012 3.48** 0.0012 3.50**
AR(1) 0.0551 1.98* 0.0471 1.70
AR(2) -0.0873 3.13** -0.0882 3.14**
AR(3) 0.0291 1.21 0.0246 1.00
Ret-NYSE(-1) 0.2787 9.04** 0.2176 5.70**
Ret-NYSE(-2) 0.1210 3.67** 0.0960 2.58*
Ret-NYSE(-3) 0.1234 3.54** 0.1314 3.28**
D*Ret-NYSE(-1) - - 0.2559 3.63**
D*Ret-NYSE(-2) - - 0.0997 1.24
D*Ret-NYSE(-3) - - -0.0308 0.37
R2 0.049 0.058
B - Chow-Test for Parameter Stability
Period F-test LR Test
(i) last six month 1.04 7.35
(ii) last one year 1.75 12.36
(iii) last two years 5.12** 35.76**
** p<0.01
* p<0.05
01-K.N. Badhani.p65 2/24/2009, 5:15 PM10

Return and Volatility Spillover between Indian and the US Markets
NICE Journal of Business l Vol. 3 l Nos. 1 & 2 l 2008 11
Table 3, Panel B shows the results of theanalysis. Parameter stability is evaluated for lastsix months, one year, and two years. The nullhypothesis of parameter stability is stronglyrejected for last two years. To analyse what kindsof changes have taken place in the nature ofinteraction between the Indian and the US stockmarkets during last two years, a dummy variable,Dt is included in equation to represent the periodof two years (from January 2006 to December2007) and the equation is re-estimated with thefollowing specifications [equation (7)]:
3 3
01 1
3
1
Re Re Re
Re
t i t i j t ji j
j t j t j tj
t NSE C t NSE t NYSE
D t NYSE
. ~ (0,1)t t t tu h u N
21 1t t th h … (7)
where, j show the changes in interactionparameter, j during the last two years. Theparameters for the period of six years (2000-2005)are js, while the parameters for last two years(2006-2007) are jj . The results presented in thefourth and the fifth column of Table 3, Panel A,show that the j coefficient is highly significantat lag-order 1. The regression coefficient of Ret-NYSEt-1 is 0.2171 for the period from 2000 to 2005,but for the period of last two years (from 2006 to2007) it rises to the level of 0.4735 (i.e.,0.2176+0.2559).However, for higher lag-orders,there is no significant change in regressionparameters. This shows the increased level ofintegration of Indian stock market with the USmarket, during recent years.
Volatility Spillover
The residuals of the VAR model indicate thepresence of substantial ARCH effect in volatility.Therefore, it is more suitable to model the volatilityof VAR model in the GARCH framework. Abivariate GARCH (1, 1) model may be used for thispurpose. One benefit of using the bivariateGARCH (1, 1) is that it can also be used to test howvolatility in one market transmits to the other
market. Alternatively, the transmission ofvolatility can also be examined using theunivariate GARCH model that includesexogenous variables representing the variance orinnovations of another market in two-stepprocedure (see for example, Hamao, Masu lis, andNg, 1990; Kim and Rogers, 1995). Cheung andNg (1996) suggest a causality-in-variance testbased on the univariate GARCH framework,where causality is tested between squaredstandardised residuals from the GARCH model.We have used these procedures also to examinethe consistency of our results. Since, the resultsobtained using both the procedures were quitconsistent with each other, this section reports theresults of conceptually more sophisticatedbivariate GARCH model.
The most natural extension of the univariateGARCH (p, q) model in bivariate andmultivariate setting is the VECH (p, q) model,proposed by Bollerslev, Engle, and Woodridge(1988). However, two major drawbacks comein the way of popularity of this model. First,the large number of parameters to be estimatedwhich increases rapidly with the fourth powerof the number of variables in the system andmakes the model quickly unmanageable.Second, it is highly complicated to putparameter restrictions in VECH framework toguarantee a positive definite variance-covariance matrix. Therefore, mos t of theliterature on the multivariate GARCH isaddressed to seek plausible restrictions to limitthe number of the parameters and to ensurepositive definite conditional volatility. The mostpopular among different recommendedparameterisations of the multivariate GARCHis the BEKK model. This model was originallyproposed by Baba, Engle, Kraft, and Kroner(1989), and was further developed by Engleand Kroner (1995). The model, by itsconstruction, yields a positive definite varianceand covariance matrix. The BEKKparameterisation for a bivariate GARCH (1, 1)model can be expressed in the form of anequation as follows:
01-K.N. Badhani.p65 2/24/2009, 5:15 PM11

K.N. Badhani
12 NICE Journal of Business l Vol. 3 l Nos. 1 & 2 l 2008
'1 1 1' ' 't t t tH C C B H B A A … (8)
where, Ht is the time varying variance-covariance matrix, C is a lower triangular non-singular n×n matrix, and are n×n parametermatrix. We use this specification of conditionalvolatility with VAR (1, 1) model of stock returnsin India and the US, using the system of equationspresented in equation (9):
0 1 1...............
p tt t t py y yA A A
1/ 2
, ~ ( )0tt t t
iidu uH I
' '' '
1 1 1t t t tC CH B H B A A … (9)
where, the first part of the equation is the VARmodel of stock returns, as described in Equations(1) and (2). The matrices in variance equationhave following specification:
11, 12,
21, 22,
t t
tt t
h h
h hH
,11 12
21 22A
and 11 12
21 22B
The estimates are presented in Table 4, PanelA. The results of the VAR equation arecomparable with the results of constant varianceVAR model presented in Table 2. Due to itscomplex lag-structure the direct interpretation ofthe BEKK-GARCH parameters is rather tedious.However, the hypothesis of volatility spillovercan be tested by imposing appropriate parameterrestrictions as follows:
Hypothesis 1
12 21 12 210 : 0H : There is no volatilityspillover.
12 21 12 211: 0H : There is a significantvolatility spillover.
Hypothesis 2
12 120 : 0H : There is no volatilityspillover from NSE toNYSE.
Table 4
VAR (3, 3), BEKK-GARCH (1, 1)Model for Volatility Spillover
A - Regression Estimates
Regressor Equation Equationfor Ret-NYSE for Ret-NSE
Coeff. t Coeff. t
Mean Equation:
Constant 0.0007 3.89** 0.0018 5.53**
Ret-NYSE (-1) -0.0486 1.82 0.2205 6.12**
Ret-NYSE (-2) -0.0471 1.97* 0.0905 2.54*
Ret-NYSE (-3) -0.0220 0.93 0.1293 3.96**
Ret-NSE (-1) 0.0172 1.23 0.0605 2.33*
Ret-NSE (-2) 0.0185 1.41 -0.0923 3.60**
Ret-NSE (-3) 0.0046 0.36 0.0195 0.82
Variance Equation:
Intercept (SD) 0.0051 - 0.0095 -
Ret-NYSE () 0.2501 12.71** 0.2765 4.91**
Ret-NYSE () 0.9643 124.10** 0.1345 0.97
Ret-NSE () 0.0079 0.52 0.3644 12.78**
Ret-NSE () -0.0583 1.00 0.8547 38.54**
Diagnostics:
R2 0.00 0.05
Residual -0.46 -1.89Skewness
Residual Kurtosis 4.30 20.78
J-B Statistics 206.04** 10252.50**
B-P Statistics (15)
Residuals 22.44* 10.89
Sqr. Residuals 21.78* 0.70
B - Wald Test for Volatility Spillover
Null-Hypothesis (H0) Wald Statistic(2 distribution)
1. There is no volatility spillover between 25.61**NYSE and NSE
2. There is no volatility spillover from 1.00NSE to NYSE
3. There is no volatility spillover from 24.17**NYSE to NSE
** p<0.01* p<0.05
12 121: 0H : There is a volatilityspillover from NSE toNYSE.
01-K.N. Badhani.p65 2/24/2009, 5:15 PM12

Return and Volatility Spillover between Indian and the US Markets
NICE Journal of Business l Vol. 3 l Nos. 1 & 2 l 2008 13
Hypothesis 3
21 210 : 0H : There is no volatilityspillover from NYSE toNSE.
21 211: 0H : There is a volatilityspillover from NYSE toNSE.
The parameter restrictions to test the abovehypotheses are examined using the Wald test. Theresults are presented in Panel B of Table 4. Thenull hypothesis of no volatility spillover isstrongly rejected. However, the null hypothesisof no volatility spillover from the NSE to theNYSE can not be rejected. Thus, there is only oneway volatility spillover between these twomarkets from the NYSE to the NSE.
CONCLUSION
In this paper we have analysed the interactionbetween the Indian and the US stock markets.While the S&P CNX Nifty index represents thestock prices in India, the US stock prices arerepresented by the NYSE Composite index. TheJohansen's cointegration test has shown that thereis no long-term equilibrium relationship betweenthese two stock markets. Therefore, the VARmodel has been used to test the short-runrelationship. The block significance test, based onthe VAR model, shows that there is only one-wayreturn spillover from the US market to the Indianmarket. The innovation of one standardised unitin the US market produces a change of 0.015458standardised units in the Indian stock market.About 6.45 per cent variability in the Indian stockmarket can be explained by changes in the stockprices in the US. Contrary to the much-acclaimeddecoupling hypotheses, the bonds between theIndian and the US stock markets have becomestronger during recent years. Chow's test ofparameter stability has shown that the coefficientof spillover of return innovation from the USmarket to the Indian market has significantlyshifted upwards during the last two years' periodcovered in this study (2006-2007). The
multivariate BEKK-GARCH model shows thatthe spillover effect is not limited to the firstmovement of stock returns, but there is also asignificant spillover of volatility from the US tothe Indian stock market.
REFERENCES
Akin, C., and M.A. Kose (2007), "Changing Nature ofNorth-South Linkage", IMF Working Paper No. 07/280. Source: http://www.imf.org/ external/pubs/ft/wp/2007/wp07280.pdf (Accessed on April 2, 2008).
Baba, Y., R.F. Engle, D.F. Kraft, and K.F. Kroner (1991),"Multivariate Simultaneous Generalised ARCH",University of California, San Diego: Department ofEconomics, Discussion Paper No. 89-57. Source: http://www.econ.ucsd.edu/papers/files/ucsd8957r.pdf (Accessedon April 2, 2008).
Bekaert, G., and C.R. Harvey (2000), "Foreign Speculatorsand Emerging Equity Markets", Journal of Finance ,Vol. 55, No. 2, pp. 465-612.
Bekaert, G., R.J. Hodrick, and X. Zhang (2007),"International Stock Market Co-movements", WorkingPaper, Source: http://finance.wharton.upenn.edu/weiss/wpapers/06-03.pdf (Accessed on April 2, 2008).
Bollerslev, T., R.F. Engle, and J. Wooldridge (1988), "A CapitalAsset Pricing Model with Time Varying Co-variances",Journal of Political Economy , Vol. 96, No. 1, pp. 116-131.
Brooks, R., and M.D. Del Negro (2002), "InternationalDiversification Strategies", Working Paper, FederalReserve Bank of Atlanta, No. 2002-23, Source: http://www.frbatlanta.org/filelegacydocs/wp0223.pdf (Accessedon April 2, 2008).
Canarella, G., S.K. Sapra, and S.K. Pollard (2007),"Asymmetry and Spillover Effects in the NorthAmerican Equity Markets", Economic DiscussionPapers, No. 2007-35, Source: www.economics-ejournal.org/discussionpapers (Accessed on April 2, 2008).
Cavaglia, S., C. Brightman, and M. Aked (2000), "TheIncreasing Importance of Industry Factors", FinancialAnalyst Journal, Vol. 56, No. 5, pp. 41-54.
Chen, H., and B.J. Lobo (2006), "Links between the Indian,US and Chinese Stock Markets", National University ofSingapore, Department of Economics, Working PaperNo. 0602, Source: http://nt2.fas.nus.edu.sg/ecs/pub/wp/wp0602.pdf (Accessed on April 2, 2008).
Cheung, Y.W., and L.K. Ng (1996), "A Causality-in-VarianceTest and its Application to Financial Market Prices",Journal of Econometrics , Vol. 72, No. 1- 2, pp. 33-48.
Choudhry, T. (2004), "International Transmission of StockReturns and Volatility: Empirical Comparison betweenFriends and Foes", Emerging Market Finance and Trade ,Vol. 40, No. 4, pp. 33-52.
01-K.N. Badhani.p65 2/24/2009, 5:15 PM13

K.N. Badhani
14 NICE Journal of Business l Vol. 3 l Nos. 1 & 2 l 2008
Chow, G.C. (1960), "Test of Equality between Sets ofCoefficients in Two Linear Regressions", Econometrica,Vol. 28, No. 3, pp. 591-605.
Engle, R.F., and C.W.J. Granger (1987), "Co-integration andError-Correction: Representation, Estimation andTesting", Econometrica, Vol. 55, No. 2, pp. 251-276.
Engle, R., and K. Kroner (1995), "Multivariate SimultaneousGeneralized ARCH", Econometric Theory , Vol. 11, No. 1,pp. 122-150.
Errunza, V., and E. Losq (1985),"International Asset Pricingunder Mild Segmentation: Theory and Tests." Journal ofFinance, Vol. 40, No. 1, pp. 105-124.
Eun, C.S., and S. Shim (1989), "International Transmissionof Stock Market Movements", Journal of Financial andQuantitative Analysis , Vol. 24, No. 1, pp.41-56.
Ewing, B.T., J.E. Payne, and C. Sowell (2001), "Transmissionof Conditional Stock Return Volatility across NorthAmerican Markets: Evidence from Pre- and Post-NAFTA", International Trade Journal , Vol. 15, No. 4,pp. 409-427.
Granger, C.W.J. (1969), "Investigating Causal Relations byEconometric Models and Cross-Spectral Methods,"Econometrica, Vol. 37, No. 3, pp. 424-438.
Granger, C.W.J., and P. Newbold (1974), "SpuriousRegressions in Econometrics", Journal of Econometrics ,Vol. 2, No. 2, pp. 111-120.
Griffin, J.M., and G.A. Karolyi (1998), "Another Look at theRole of the Industrial Structure of Markets forInternational Diversification Strategies", Journal ofFinancial Economics , Vol. 50, No. 3, pp. 351-373.
Hamao, Y.R., R.W. Masulis, and V.K. Ng (1990),"Correlations in Price Changes and Volatility acrossInternational Stock Markets", Review of FinancialStudies, Vol. 3, No. 2, pp. 281-307.
Hasiao, F.S., M.W. Hasiao, and A. Yamashita (2003), "TheImpact of US Economy on Asia-Pacific Region: Does itMatter?" Journal of Asian Economics , Vol. 14, No. 2,pp. 219-241.
Henry, P.B. (2005), "Stock Market Liberalization, EconomicReform and Emerging Market Equity Prices", Journal ofFinance, Vol. 55, No. 2, pp. 529-564.
Hilliard, J. (1979), "The Relationship between EquityIndices on World Exchanges", Journal of Finance, Vol. 34,No. 1, pp. 103-114.
International Monetary Fund (IMF) (2007), "Decoupling theTrain? Spillover and Cycles in Global Economy", WorldEconomic Outlook, April 2007, Chapter 4, pp. 121-160.
Janakiramanan, S., and A.S. Lamba (1998), "An EmpiricalExamination of Linkages between Pacific-Basin StockMarkets", Journal of International Financial Markets ,Institutions and Money , Vol. 8, No. 2, pp. 155 -173.
Johansen, S. (1988), "Statistical Analysis of CointegrationVectors", Journal of Economic Dynamics and Control ,Vol. 12, No. 2-3, pp. 231-254.
Johansen, S., and K. Juselius (1990), "Maximum LikelihoodEstimation and Inference on Cointegration withApplication to the Demand for Money", Oxford Bulletinof Economics and Statistics , Vol. 52, No. 2, pp. 169-210.
Karolyi, G.A. (1995), "A Multivariate GARCH Model ofInternational Transmissions of Stock Returns andVolatility: The Case of the United States and Canada",Journal of Business and Economic Statistics , Vol. 13, No. 1,pp.11-25.
Kasa, K. (1992), "Common Stochastic Trends inInternational Stock Markets", Journal of MonetaryEconomics, Vol. 29, No. 1, pp. 95-124.
Kearney, C., and B.M. Lucey (2004), "International EquityMarket Integration: Theory, Evidence andImplications", International Review of Financial Analysis,Vol. 13, No. 5, pp. 571-583.
Kim, E.H., and V. Singal (2000), "Stock Market Openings:Experience of Emerging Economies", Journal ofBusiness, Vol. 73, No. 1, pp. 25-66.
Kim, S.J., and J. Rogers (1995), "International Stock PriceSpillovers and Market Liberalization: Evidence fromKorea, Japan, and the United States", Journal of EmpiricalFinance, Vol. 2, No. 2, pp. 117-133.
Kim, S.J. (2005), "Information Leadership in the AdvancedAsia-Pacific Stock Markets: Return, Volatility andVolume Information Spillovers from the U.S. andJapan", Journal of the Japanese and International Economies ,Vol. 19, No. 3, pp. 338-365.
King, M.A., E. Sentana, and S. Wadhwani (1994), "Volatilityand Links between National Stock Markets",Econometrica, Vol. 62, No. 4, pp. 901-933.
Koutmos, G., and G.G. Booth (1995), "Asymmetric VolatilityTransmission in International Stock Markets",Journal of International Money and Finance , Vol. 14, No. 6,pp. 747-762.
Kumar, K.K., and C. Mukhopadyay (2002), "Equity MarketInterlinkage: Transmission of Volatility - A Case of USand India", NSE Research Initiative, Source: http://www.nseindia.com/content/research/Paper39.pdf(Accessed on April 2, 2008).
Lamba, A.S. (2004), "An Analysis of the DynamicRelationships between South Asian and DevelopedEquity Markets", NSE Research Initiative, Source: http://www.nseindia.com/content/research/comppaper_lat83.pdf(accessed on April 2, 2008).
Lee, S.B., and K.J. Kim (1994), "Does the October 1987 CrashStrengthen the Co-movement in Stock Price Indices",Quarterly Review of Economics and Business , Vol. 3,No. 1-2, pp. 89-102.
01-K.N. Badhani.p65 2/24/2009, 5:15 PM14

Return and Volatility Spillover between Indian and the US Markets
NICE Journal of Business l Vol. 3 l Nos. 1 & 2 l 2008 15
Lin, W., R.F. Engle, and T. Ito (1994), "Do Bulls and BearsMove across Borders? International Transmission ofStock Returns and Volatility", Review of FinancialStudies, Vol. 7, No. 3, pp. 507-538.
Liu, Y.A., and M.S. Pan (1997), "Mean and Volatility SpilloverEffects in the US and Pacific-Basin Stock Markets",Multinational Finance Journal , Vol. 1, No. 1, pp. 47-62.
Masih, R., and A.M.M. Masih (2001), "Long and Short termDynamic Causal Transmission amongst InternationalStock Markets", Journal of International Money andFinance, Vol. 20, No. 4, pp. 563-587.
Mukherjee, K., and R.K. Mishra (2007), "International StockMarket Integration and its Economic Determinants:A Study of India and World Equity Market", Vikalpa,Vol. 32, No. 4, pp. 29-44.
Nair, A.S., and A. Ramanathan (2002), "Analysis of CoMovements of Select US and Indian Stock PriceIndexes", Paper presented at Sixth UTI Capital MarketConference, Source: http:// Last www.utiicm.com/Cmc/PDFs/ 2002/abhilashnair%5E13.pdf (Accessed on April 2,2008).
Nath, G.C., and S. Verma (2003), "Study of CommonStochastic Trend and Co-Integration in the EmergingMarkets: A Case Study of India, Singapore and Taiwan",2003. NSE Research Initiative, Source: http://www.nseindia.com/ content/research/Paper72.pdf(Accessed on April 2, 2008).
Ozun, A., M. Turk, and U. Centkin (2007), "Some EmpiricalNotes on Recent Perspectives in International PortfolioManagement", Problems and Prospects in Management,Vol. 5, No. 3, pp. 166-180.
Park, J., and A.M. Fatemi (1993), "The Linkages betweenthe Equity Markets of Pacific-Basin Countries andthose of the U.S., U.K., and Japan: A Vector
Autoregression Analysis" Global Finance Journal ,Vol. 4, No. 1, pp. 49-64.
Ripley, D.M. (1973), "Systematic Elements in the Linkages ofNational Stock Market Indices", Review of Economics andStatistic, Vol. 55, No. 3, pp. 356-361.
Sheng, H.C., and A.H. Tu (2000), "A Study of Cointegrationand Variance Decomposition among National EquityIndices before and During the Period of AsianFinancial Crisis", Journal of Multinational FinancialManagement, Vol. 10, No. 3-4, pp. 345-365.
Sims, C.A. (1980), "Macroeconomics and Reality,"Econometrica, Vol. 48, No. 1, pp. 1-48.
Solnik, B. (1974), "An Equilibrium Model of theInternational Capital Market", Journal of EconomicTheory, Vol. 8, No. , pp. 500-524.
Taylor, M.P., and I. Tonks (1989), "The Internationalisationof Stock Markets and the Abolition of U K ExchangeControl", Review of Economics and Statistics , Vol. 71,No. 2, pp. 332-336.
Wong, W.K., A. Agarwal, and J. Du (2005), "FinancialIntegration for Indian Stock Market, A FractionalCointegration Approach", National University ofSingapore, Department of Economics, Working PaperNo. 0501, Source: http://nt2.fas.nus.edu.sg/ecs/pub/wp/wp0501.pdf (accessed on April 2, 2008).
Worthington, A., and H. Higgs (2004), "Transmission ofEquity Returns and Volatility in Asian Developed andEmerging Markets: A Multivariate GARCH Model",International Journal of Finance and Economics , Vol. 9,No. 1, pp. 71-80.
Yang, L., F. Tapon, and Y. Sun (2006), "InternationalCorrelations across Stock Markets and Industries:Trends and Patterns 1988-2002", Applied FinancialEconomics, Vol. 16, No. 11, pp. 1171-1183.
A company must be viewed not only as a portfolio of productsand services, but as a portfolio of competencies as well.
Gary Hamel and C.K. Prahalad,Competing for the Future
H H H H H
A corporation without a strategy is like an airplane weavingthrough stormy skies, hurled up and down, slammed
by the wind, lost in he thunderheads. If lightning or crushingwinds don’t destroy it, it will simply run out of gas.
Alvin Toffler, The Adaptive Corporation
01-K.N. Badhani.p65 2/24/2009, 5:15 PM15

Guidelines for Writing a Book Review
We invite academicians and others to write reviews of books on management and alliedsubjects.
The book reviewers are requested to follow the guidelines given below:
1. The reviewer should begin with a listing of the bibliographical details of thebook, comprising the names of the authors, full title and sub-title as they appearon the cover, details of the place and name of the publisher, year of publication,the number of pages in the book, and the price, if mentioned.
2. The review can range from 1000-3000 words, depending upon the topic and theimportance of the book.
3. Reviews should engage with the issues, problems, and themes articulated inthe book and make a rigorous attempt to identify and assess the main set ofarguments that have been put forth by the author. It should, in other words,have a strong engagement with the conceptual structure of the book and shouldbring out its strengths and weaknesses.
4. The book under review should have been published recently, preferably in thecurrent or the previous year.
5. The reviewer may also include comments on the stylistic aspects and literarypresentation of the book.
6. References should be avoided altogether. If references are considered essential,the citation style, adopted by NICE Journal of Business, should be used.
The review should be an objective assessment of the book, indicating its specificstrengths and weaknesses, and overall assessment.
01-K.N. Badhani.p65 2/24/2009, 5:15 PM16

THE IMPACT OF MARKET-ORIENTATION ON SERVICE QUALITY
A Study of State Bank of India
Alka Sharma* and Anil Gupta**
Abstract
The study seeks to ascertain the extent to which the largest public-sector bank in India, namely, theState Bank of India, is market-oriented. The main variables on the basis of which the market-orientationhas been examined are intelligence generation, intelligence dissemination, and responsiveness, accordingto the scale developed by Kohli, Jaworski, and Kumar (1993). This study would be useful in developingan understanding of the bank’s strategic orientation towards customers and its readiness to respond tothe shifts occurring in the customers’ needs, tastes, and preferences. This understanding has been usedby the bank in providing quality services to the customers. Accordingly, the service quality of the bankhas also been assessed and an attempt is made to ascertain the relationship between market-orientationof the bank and the service quality perception of the customers.
Key Words: Market-orientation, Service quality, Customers’ responsiveness, Banking,State Bank of India
INTRODUCTION
THE financial-services sector in India haswitnessed a metamorphic growth since theinitiation of the economic-reforms process,
in the early nineties. The banking sector, whichhas been there for long as more or less a money-lending service, has now matured into a complexservice-provider. This new avatar of banking hasemerged as a critical player in the transformationof the Indian economy, as the economic growthis a function of the level of investment, capital-output ratio, and the state of technology (Paliwal
and Harigunani, 2005). A sweep of changes,including financial liberalisation, dis-intermediation, globalisation, and technologicaladvancements, was introduced. Consequently,vast opportunities emerged in the Indianmarket, leading to the entry of a number of newplayers in the banking sector, in the public sectoras well as the private sector, introducing newservices and technology. The erstwhile slow-moving, in-efficient and huge public-sectorbanks, which had dominated the Indianfinancial market for long, were suddenly made
* Alka Sharma is a Reader in The Business School of the University of Jammu, Jammu; e-mail: [email protected]** Anil Gupta is a Lecturer in The Business School of the University of Jammu, Jammu; e-mail: [email protected]
02-Alka Sharma.p65 2/24/2009, 5:19 PM17

Alka Sharma and Anil Gupta
18 NICE Journal of Business l Vol. 3 l Nos. 1 & 2 l 2008
to perform and show results. With theemergence of competition, the banks were givenenough freedom to determine the rate structuresfor deposits and advances, which are the basicservices of the banks. Moreover, the bankingregulations were tightened keeping in view theflexibility being given to the banks. On the otherhand, the customers also have become moredemanding and less loyal. The increasingcustomer expectation has forced the pace ofbusiness innovation. Therefore, the banks, likeother major consumer services, are increasinglybecoming more customer-oriented. A number ofnew concepts, like technology-oriented bankingand relationship marketing, are being adoptedby the banks, which have further increased thecomplexities of the sector.
In this scenario, marketing has emerged as anoverall solution for various players. The banks,irrespective of the fact whether they belong to theprivate sector or the public sector, are adoptingthe marketing tools to compete in the market andearn more business. In this process, it has becomeimperative for the banks to develop close,cooperative relationship with customers, as theyare now more demanding than ever before(Parvatiyar and Sheth, 2004). It is more so due tothe fact that many times the banks do notunderstand the customers’ needs and the desiredservice-output levels. Therefore, in the recenttimes, the focus of the banks has shifted from atypical transactional marketing to relationshipmarketing. This paradigm shift in the businessorientation of the banks is critical, as it helps indeveloping a better understanding of the needsand expectations of the customers and providesan opportunity to them to perform efficiently, earnmore profits, and, most importantly, sustain thecompetition. Thus, in highly personalised andintangible services, the banks have to balance thecustomers’ perception with the requisite servicequality, which in turn requires continuouscustomers’ need assessment and satisfying thatneed. The banks which follow this approach aresaid to be market-oriented.
REVIEW OF LITERATURE
Development of the Concept of Market-orientation
Market-orientation, although being a recentconcept, has elicited considerable interest amongmarketing academicians and practitioners alikeas the market dynamism in the wake ofcompetition, has led the organisations to anincreased focus on performance. It provides a setof values that focuses the efforts of theorganisation on creating superior value for thecustomers, thereby leading to the achievement ofsuperior performance and distinctive advantage.The term ‘Market-Orientation’ was first coined byShapiro in 1988, and was developed conceptuallyin subsequent years. Conceptually, market-orientation has three elements, namely,intelligence generation, intelligencedissemination and responsiveness (Kohli andJaworski, 1990). All these elements together definethe extent of market orientation and also indicatethe level of customer satisfaction. It is so due tothe fact that it takes into account the organisation’scapability to respond to the customers’ shift inneeds, wants, and preferences. The increasedresponsiveness, thus leads to an increasedproductivity, as the organisation understands thecustomers better, thereby, leading to an increasedcustomer satisfaction.
Besides this construct, another alternateconstruct has also been developed, wherein themarket orientation is suggested to have threecomponents, i.e., behavioural, long-term focus andprofitability (Narver and Slater, 1990). Of thesecomponents, the behavioural component is theonly one which the research has proved to bereliable. It is so because, the behavioral componentof an organisation is wholesome and takes intoaccount the customers, competitors andcoordination between the various functional areas.The earlier construct, which has been proposed byKohli and Jaworski, also takes into considerationthese components, although the focus is oninformation about these variables. Thus, both ofthese constructs directly or indirectly lead towards
02-Alka Sharma.p65 2/24/2009, 5:19 PM18

The Impact of Market-Orientation on Service Quality
NICE Journal of Business l Vol. 3 l Nos. 1 & 2 l 2008 19
developing a capability in an organisation toperform better. This construct (Narver and Slater) ,however, has given a new direction to researchersto focus on performance, profit being an importantindicator for the same.
Market-Orientation and Business Performance
The increased focus on performance has led to thedevelopment of other measures, which areconsidered to have an impact on businessperformance. The impact of culture, customer(market) orientation and innovativeness onbusiness performance have also been examinedin later studies (Deshpande, Farley and Webster,1993), wherein the customers’ perception ofmarket-orientation has been identified as the mostrelevant factor. This not only helps inunderstanding how your organisational effortstowards customers are perceived by them(customers), but also helps in analysing theperformance in the market, as customers’perceptions are directly related to theperformance.
As suggested by earlier researches, theperformance variable has emerged as an importantcomponent of market orientation. Differentorganisations, however, are perceived at differentlevels in terms of market-orientation, as someorganisations are perceived to be more market-oriented as compared to others. Therefore, thismarket-orientation requires studying anotherdimension besides customers and profiting, i.e.,employees. The effect of market-orientation onemployees and business performance has beenanalysed and an attempt has been made to developa linkage between business performance andmarket-orientation (Jaworski and Kohli, 1993).This study has helped in developing the MARKORscale, which has also been used in the present study.This scale holds more relevance, as compared tothe other scales because it also considers theemployees’ orientation towards customers, whichis more relevant in case of service organisations. Itis so due to the fact that the employees’ actions havea direct affect on service quality and servicedelivery.
This study has shown that businessperformance is positively related to market-orientation (Deshpande and Farley, 1998; Slaterand Narver, 2000). Market-orientation has beenidentified as the second most important driver ofbusiness performance besides differentialadvantage (Doyle and Wong, 1998).
Although competition has been one of theforemost factors responsible for organisationsbeing more customer–focused, few studies havebeen undertaken to analyze the impact ofenvironment on market-orientation (Slater andNarver, 1994, and Day and Wensley, 1988). Thesestudies have indicated that the environment haslittle effect on the market-orientation andperformance relationship.
This relationship holds true in all theorganisations, even in banks. However, anothervariable that affects the performance is innovation.Innovation in business is an important indicatorof an attempt of an organisation to provide suchoffers that are in line with the changing needs ofthe customers. It has been proven time and againthat innovation is the key to success, therefore, itsrole in market-orientation and performancerelationship has been analysed. The research hasproven that organisational innovativeness ispositively related to market-orientation (Han, Kimand Srivastava, 1998).
Market-Orientation and Customers
In the case of services, marketing is a multi-faceted activity represented by a triangle. Theservices marketing triangle identifies thecompany, employees and the customer as thethree sides of the triangle. The earlier literatureanalysed has focused on company andemployees, and the other dimension of triangle,i.e., customers and market orientation hasremained unfathomed. Market-orientation is, infact, to create a superior value for the customersand adapt the business processes, procedures andstructures based upon the continuous learningfrom actual value-creation and performance(Narver, Slater and Tietje, 1998).
02-Alka Sharma.p65 2/24/2009, 5:19 PM19

Alka Sharma and Anil Gupta
20 NICE Journal of Business l Vol. 3 l Nos. 1 & 2 l 2008
It has been noticed that Indian firms arelargely entrepreneurial and organisations areless market-oriented (Deshpande and Farley,1999). The present study was undertaken toascertain the extent to which a big serviceorganisation, like the State Bank of India (SBI),with a branch network throughout the countryand abroad, and a very large number ofemployees and customers , is market-oriented.This will not only help in understanding theorientation, which the bank has developed inrecent times but will also help in understandingthe bank’s marketing strategy, as one of theearlier studies has identified that market-orientation in smaller firms provides a strongersource of competitive advantage as compared tolarger firms (Pelham, 2000). The study also seeksto ascertain which customer satisfaction is adominant factor in smaller firms.
Customers’ perspective is very much relevantin judging the marketing effectiveness. Thecustomers’ perception of various organisationalinitiatives helps an organisation to developstrategies for being more effective. It is thecustomer whose perception makes anorganisation market-oriented as well as it helpsthe organisation to satisfy the customers moreeffectively by providing quality service. Thus,customers have been identified as the primaryfocus of market-orientation. It is, therefore,necessary to systematically study the consumers’needs, wants, preference and satisfaction, etc., sothat the organisation’s focus on customer ismaintained. Hence, it makes the market-orientedorganisations more proactive and capable ofanticipating the shifts in consumers’ requirementsso as to provide the desired quality service and,therefore, perform better. Hence, it can be statedthat market-orientation is a business culture thatcommits the organisation towards creation ofsuperior value to the customers (Narver andSlater, 1994).
Service Quality
Service quality, which has been the biggestcontributor to the creation of superior value, has
emerged as an area of interest among the researchscholars since 1980s, where they have extensivelyexamined the measurement of service quality tohelp the practitioners effectively manage thedelivery of quality service (Babakus and Boller,1992; Cronin and Taylor, 1992; Parasuraman,Berry, and Zeithaml, 1991). Earlier research inservice quality measured the perceptions as aproxy measure of customer satisfaction; but withits evolution as a strategic factor in determiningthe firm’s competitive advantage (Fitzsimmonsand Fitzsimmons, 1994), the recent researchpositioned service quality as an antecedent ofcustomer satisfaction (Cronin, et al., 2000; Sprengand Mckoy, 1996). The service quality constructhas developed over the years and differentauthors have contributed to it. Variedconceptualizations, from a three-dimensionalconstruct (Gronroos, 1984) to a two-dimensionalaspect (Hedvall and Paltschik, 1989), weredeveloped. While Leblanc and Nguyen (1988)proposed five components of service quality,Garvin (1988) developed another concept withnine dimensions of service quality. The maincontribution in this field, however, came fromParasuraman, Berry, and Zeithaml (1985; 1988;1994). They developed a five-dimensional, 22-item scale, to measure service quality, commonlyreferred to as ‘SERVQUAL’.
SERVQUAL has been extensively used inresearching service quality. Allred and Addams(2000) modified the scale to a 14-item scale toconduct service quality measurement in financialservices in the UK. While studying the servicequality perceptions, Ibrahim, Joseph, and Ibeh(2006) evaluated it on a six-dimension scale.However, in another study, Avasli, Katircioglu,and Smadi (2005) have used the SERVQUALscale. Hence, despite the fact that service qualityconceptualisation has been a highly debatedtopic, the present study has been conducted byusing the SERVQUAL model. It is so due to thefact that there has been an agreement about thefive dimensions of service quality and theirimportance (Fisk, Baron, and Bitner, 1993).
02-Alka Sharma.p65 2/24/2009, 5:19 PM20

The Impact of Market-Orientation on Service Quality
NICE Journal of Business l Vol. 3 l Nos. 1 & 2 l 2008 21
OBJECTIVES AND HYPOTHESIS
As the literature review suggests, customersatisfaction is an antecedent to service quality andno organisation can claim that it is market-oriented, unless it is perceived so by thecustomers. Therefore, for the purpose of the study,the following objectives were formulated:
1. To ascertain the extent of market-orientationof the bank under study.
2. To measure customers’ perception of the levelof service quality provided by the bank.
3. To examine the relationship between market-orientation and the bank’s businessperformance
4. To suggest measures for the bank to becustomer-oriented and to improve thecustomers’ perception of its service quality
In the light of the objectives stated above and theliterature review, the following hypothesis wasformulated:
H0: There is a positive relationship betweenmarket-orientation and businessperformance.
RESEARCH METHODOLOGY
The present study has been conducted in thebiggest public-sector bank, i.e., State Bank ofIndia. This bank was chosen for the study, as it isone of the biggest service organisations in India,and in the recent years it has revolutionised thetraditional banking sector in India. The bank hasadopted new marketing concepts and approachesto be competitive and has initiated a pro-activecustomer-oriented approach. The literaturereview has shown that smaller organisations aremore market-oriented. Therefore, this study willbe helpful in developing an understanding of thebank’s orientation and the various initiatives thatthe bank has taken to be more customer-focused.For the purpose of the study, two diversevariables—employees and customers have beenanalysed. While the employees’ perception wasrecorded in order to analyse the market-
orientation of the bank, the customers’ perceptionwas recorded to gauge the service quality of thebank.
Instruments of the Study
In order to analyse the market-orientation aspect,the MARKOR scale (Kohli, Jaworski and Kumar,1993) has been used. The scale is based on threeelements of market-orientation, namely,intelligence generation, intelligencedissemination, and responsiveness. Whileintelligence generation has six items under it,dissemination has five items and responsivenesshas nine items.
In order to analyse the performance of thebank, five more items have been included in thescale, which are based on the various variablesidentified in the literature. They are: profitability,return on investment, and innovations in the offerand aggression in the approach to do business.The employees’ perceptions, thus, indicate notonly the extent of market-orientation but also thebank’s business performance.
Another main variable that has been analysedin the study is service quality, which is sought tobe measured by using the ‘SERVQUAL’ scale(Parsuraman, Zeithaml, and Berry, 1988). Thisscale is based on five elements, viz., Tangibility,Reliability, Responsiveness, Assurance andEmpathy. It is a 22-item standardised scale, whichhas been used for the study. The customers’perceptions have been recorded to understand asto how the customers perceive the quality of theservice, provided by the bank.
Sample Selection and Rationale
The study is mainly based on primary data and,therefore, the data was collected from theemployees and the customers. As far as theemployees are concerned, the responses werecollected from the middle and the top-levelmanagement upto the level of General Manager.The data was mainly collected from the Jammuand Kashmir zonal office of the bank, which isresponsible for the implementation of strategic
02-Alka Sharma.p65 2/24/2009, 5:19 PM21

Alka Sharma and Anil Gupta
22 NICE Journal of Business l Vol. 3 l Nos. 1 & 2 l 2008
policies in the zone. Out of 100 questionnairesdistributed among the bank employee, only 52were received back.
In the case of customers-respondents, twoleading bank branches with maximum numberof customers were selected, and only thosecustomers were contacted who were coming outof the bank branch. The timing chosen was thepeak hours, so as to make it possible to contact alarge number of customers and to record theirperception during a critical time. Out of more than150 questionnaires distributed to the customers,who visited the bank from 10.30 am to 2 pm, only112 customers responded.
All the items in both the scales, namely,MARKOR and SERVQUAL, were measured on a7-point scale, with only polar categories beinglabeled as “1-strongly disagree and 7-stronglyagree”, so as to ensure the generation of metricdata.
Pre-testing the Questionnaire
The two questionnaires used for the study werebased on two popular standardisedquestionnaires, namely, MARKOR andSERVQUAL. However, the questionnaires werepre-tested before conducting the survey. TheMARKOR questionnaire was administered to 15employees, 10 from the middle level and 5 fromthe senior level of management. The analysis ofthe preliminary data revealed that market-orientation dimensions to be studied were validand the questionnaire required no modification.Similarly, the SERVQUAL questionnaire was pre-tested with 25 customers of the bank. It was foundthat all the dimensions of service quality wererelevant and, therefore, the questionnaires wereaccepted for a detailed survey.
ANALYSIS AND RESULTS
The data collected through the questionnaireswere analysed, using SPSS. The descriptivestatistics (i.e., mean and standard deviation) ofall the items was calculated. The data collected
through the MARKOR scale was subjected toFactor Analysis, with the objective to assesswhether the 3-dimensional structure of market-orientation fits the data. Similarly, theinformation generated from customers onperceived service-quality questionnaire was alsosubjected to factor analysis to assess theunderlying dimensions of the perceived servicequality. The descriptive statistics (i.e., mean andstandard deviation) corresponding to each of theitems were also calculated. Subsequently,multiple regressions were carried out to test therelationship between market-orientation andperceived service quality.
In its initiative to be competitive, the StateBank of India has undertaken several measures,which are directed towards making it morecustomer-oriented and capable of providinghigher value to customers. In order to appreciatethe bank’s efforts, the data collected by using theMARKOR scale, has been analysed.
Dimensional Structure of Market-Orientation
The first step in the process was to analyse thedimensional structure of market-orientation.Therefore, the data was subjected to factoranalysis in order to identify the underlyingdimensions of the construct. The KMO Statisticsand Bartlett’s Test of ‘Sphericity’, as shown inTable 1, suggests that factor analysis can beundertaken for the given data. The factor analysisresult suggests that market-orientation has three-dimensions, which has also been supported bythe MARKOR scale. The factor loadings arepresented in Table 2.
Table 1
KMO Statistics and Bartlett’s Test of ‘Spherecity’
KMO and Bartlett’s Test
Kaiser-Meyer-Olkin Measure of . 7 7 9Sampling Adequacy
Bartlett’s Approx. Chi-Square 781.037
Test of df 190.000Sphericity Sig. .000
02-Alka Sharma.p65 2/24/2009, 5:19 PM22

The Impact of Market-Orientation on Service Quality
NICE Journal of Business l Vol. 3 l Nos. 1 & 2 l 2008 23
Dimensional Analysis of Market-Orientation
While interpreting the data, the descriptivestatistics were analysed. The computations arepresented in Table 3.
Intelligence Generation
The descriptive statistics on this dimension, aspresented in the table, suggests that the bank istaking adequate initiatives and measures to
generate information/intelligence about theircustomers. The mean score on all the dimensionsis greater than that of the mid-point value of 4,suggesting a higher level of agreement on theitems relating to the intelligence generationdimension. Thus, one can draw an inference thatthe bank is working satisfactorily in terms ofunderstanding the future aspirations of thecustomers. The high average score clearlyindicates that the bank is working actively to get
Table 2
Factor Loadings for Market-Orientation Scale
S.No Item Intelligence Intelligence ResponsivenessGeneration Disemination
1. ‘In our bank, we meet with customers at least once a year to .545find out what products/services they will need in future’.
2. ‘We do a lot of in–house market research’. .684
3. ‘We are slow to detect the changes in our customers’ preferences’. .851
4. ‘We conduct a poll of end users at least once a year to assess the .593quality of our products and services’.
5. ‘We are slow to detect fundamental shifts in our sector .886(competition, technology)’.
6. ‘We periodically review the likely effect of changes in our .715business environment (regulation) on customers’.
7. ‘We have interdepartmental meetings at least once every .857quarter to discuss market trends and development’.
8. Marketing personnel in our bank spend time discussing .799customers’ future needs with other departments.
9. ‘When something important happens to a major market or .586customers, the whole bank comes to know about it very soon’.
10. ‘Data on customer satisfaction is disseminated at all .758levels on regular basis’.
11. ‘When one department finds out something important about .392our competitors, it is slow to alert other departments’.
12. ‘It takes us forever to decide how to respond to competitors .843’ strategies’.
13. ‘We tend to ignore changes in customers’ product/service needs’. .789
14. ‘We consistently review our product development efforts to .406ensure that they are in line with what customers want’.
15. ‘All the departments get together periodically to plan a .718response to changes taking place in our business environment’.
16. ‘If a major competitor launches an intensive campaign targeted .393at our customers, we, immediately implement a response’.
17. ‘All the departments in our bank are well coordinated’. .435
18. ‘We are not able to implement a great marketing plan in .560 a timely fashion’.
19. ‘Customer complaints fall on deaf ears in our bank’. .912
20. ‘The departments make concerted efforts to modify a product .684or service, when the customers want’.
02-Alka Sharma.p65 2/24/2009, 5:19 PM23

Alka Sharma and Anil Gupta
24 NICE Journal of Business l Vol. 3 l Nos. 1 & 2 l 2008
Intelligence Dissemination
The descriptive statistics of all the items relatingto this dimension indicate the mean value greaterthan the midpoint value of 4, indicating that thebank has been able to develop processes withinthe organisation that helps to disseminate theinformation generated through their intelligencemechanism. The bank has developed an effectiveintra-organisational mechanism to analyse theshifts in the market and, therefore, developeffective strategies to serve the customersefficiently. It has also been observed through thedata that the marketing people of the bank spend
Table 3
Descriptive Statistics for Market Orientation and Firm Performance
S.No Item Mean Standard Deviation
1. ‘In our bank, we meet with customers at least once a year to find out what 4.5 2.2products/services they will need in future’.
2. ‘We do a lot of in – house market research’. 5.3 1.6
3. ‘We are slow to detect the changes in our customers’ preferences’. 4.2 2.3
4. ‘We conduct a poll of end users at least once a year to assess the quality 5.0 2.0of our products and services’.
5. ‘We are slow to detect fundamental shifts in our sector (competition, technology)’. 4.8 2.2
6. ‘We periodically review the likely effect of changes in our business environment 5.1 1.7(regulation) on customers’.
7. ‘We have interdepartmental meetings at least once every quarter to discuss 5.6 1.7market trends and development’.
8. ‘Marketing personnel in our bank spend time discussing customers’ future 4.9 1.8needs with other departments’.
9. When something important happens to a major market or customers, the 5.5 1.8whole bank comes to know about it very soon’.
10. ‘Data on customer satisfaction is disseminated at all levels on regular basis’. 4.9 1.8
11. ‘When one department finds out something important about our competitors, 4.6 2.1it is slow to alert other departments’.
12. ‘It takes us forever to decide how to respond to competitors’ strategies’. 3.5 1.8
13. ‘We tend to ignore changes in customers’ product / service needs’. 4.2 2.1
14. ‘We consistently review our product development efforts to ensure that 5.5 1.4they are in line with what customers want’.
15. ‘All the departments get together periodically to plan a response to changes 5.8 1.4taking place in our business environment’.
16. ‘If a major competitor launches an intensive campaign targeted at 5.8 1.4our customers, we immediately implement a response’.
17. ‘All the departments in our bank are well coordinated’. 6.0 1.2
18. ‘We are not able to implement a great marketing plan in a timely fashion’. 4.9 2.0
19. ‘Customer complaints fall on deaf ears in our bank’. 6.1 1.3
20 ‘The departments make concerted efforts to modify a product or service, 5.2 1.9when the customers want’.
Note: All items are measured on 7- point scale
a relevant feedback from the customers regardingthe quality of services. The bank, in order to beproactive, is following a two-pronged strategy ofnot only developing quality services in line withcustomers’ requirements, but also ensuring thequality by developing an effective feedbackmechanism. The bank has actually been able toidentify the critical shifts in terms of technologyas well as competition and also to manage iteffectively. This is further corroborated by the factthat despite being the oldest and biggest bank inIndia, it has not only been able to survive the cut-throat competition, but also strengthen itsposition in the market over a period of time.
02-Alka Sharma.p65 2/24/2009, 5:19 PM24

The Impact of Market-Orientation on Service Quality
NICE Journal of Business l Vol. 3 l Nos. 1 & 2 l 2008 25
sufficient time exploring the needs of thecustomers at the right quarters.
It, therefore, helps in the development ofappropriate products and services . Moreover,the marketing people do not merely sell theservices but also play an important role inpassing on the information to the bank , so thatthe bank is able to add value to the offer. Thebank has an effective information-disseminationmechanism. Although, the value for the same hasbeen lesser than the dissemination ofinformation about the market or services, it canbe inferred from the analysis that the finaloutcome of the processes is less effectivelydistributed as compared to the dissemination ofinformation regarding the market trends. Thefindings also suggest that the bank is noweffectively managing its competitors, as theinformation about the competitors is welldisseminated. This also suggests a proactivestrategy the bank has adopted to compete withstrong private players, like ICICI, HDFC andothers, who have emerged as the key players inthe recent past due to their aggressive approach.
Responsiveness
On the responsive dimension, the mean value ofItem no. 12 (mean = 3.56, = 1.85) suggests thatthere is a gap in terms of the bank’s initiative torespond to the competitors’ moves.
The bank is not working effectively to reducethe time gap to respond to the competitors in themarket. This may prove to be a big hurdle in thebank’s market-orientation initiatives. Themoderate average value for Item no. 13 clearlysuggests that the bank has not ignored thecustomers’ preferences and changes in theirneeds. It has been receptive to such changes and,therefore, develops competitive products in themarket place. From the data, we can also infer thatbank products are in line with customers’requirements. Moreover, it also suggests thebank’s willingness to include customers’requirements and needs in the productdevelopment process.
The analysis of the business environment isnecessary to understand the trends and shiftstaking place in the present time. The nextstatement regarding the responsiveness of thebank towards environmental change has beenanalysed and the average value has beencalculated to be 5.86 (std. dev. – 1.48), which isfairly high. It clearly suggests that the bank hasbeen able to develop such mechanism, where theresponses to such changes are more holistic, as allthe departments together develop a strategy forresponse to an environmental shift.
The bank has restructured itself into a numberof new departments to be more customer-friendlyand provides efficient and qualitative services tocustomers. While analysing the statementregarding the coordination of these departments,the average value has been calculated at 6.08 (std.dev. – 1.23), which is very high. The high valueclearly suggests that the bank has been able todevelop the market-orientation approacheffectively, as all the departments are equallyfocused and synchronised with each other,working effectively towards providing highervalue to the customers.
Since all the departments of the bank are well-coordinated, the next statement regardingimplementation of marketing plan in a timelyfashion has also scored a high average value of4.9 (std. dev. - 2.08). It indicates that the bank hasbeen able not only to develop effective marketingplans but also to implement them in an effectiveand efficient manner.
As given in Table 4, it can further be deducedfrom the analysis that of the three components,the bank has recorded a minimum average valuefor the intelligence generation parameter at 4.87.On the other hand, the value for the other two
Table 4
Overall Mean Score of Market-Orientation
Item Score
Intelligence-Generation 4.87
Intelligence-Dissemination 5.16
Responsiveness 5.27
Market-Orientation 5.10
02-Alka Sharma.p65 2/24/2009, 5:19 PM25
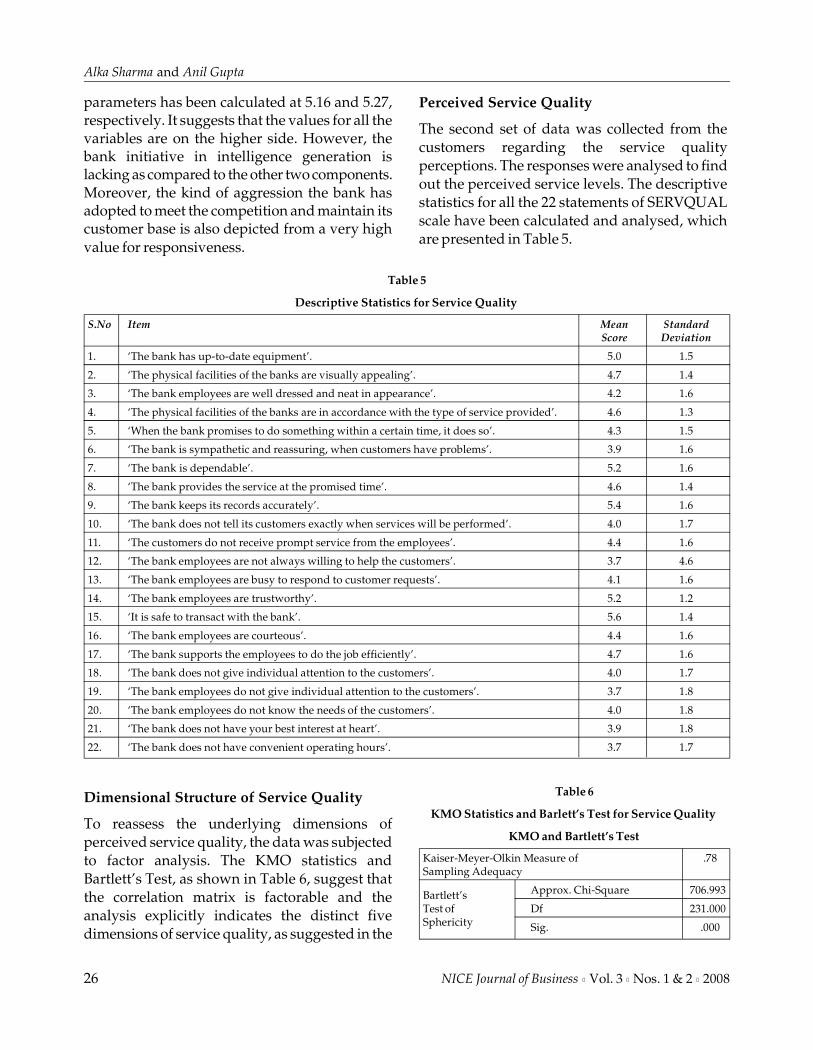
Alka Sharma and Anil Gupta
26 NICE Journal of Business l Vol. 3 l Nos. 1 & 2 l 2008
parameters has been calculated at 5.16 and 5.27,respectively. It suggests that the values for all thevariables are on the higher side. However, thebank initiative in intelligence generation islacking as compared to the other two components.Moreover, the kind of aggression the bank hasadopted to meet the competition and maintain itscustomer base is also depicted from a very highvalue for responsiveness.
Perceived Service Quality
The second set of data was collected from thecustomers regarding the service qualityperceptions. The responses were analysed to findout the perceived service levels. The descriptivestatistics for all the 22 statements of SERVQUALscale have been calculated and analysed, whichare presented in Table 5.
Table 5
Descriptive Statistics for Service Quality
S.No Item Mean StandardScore Deviation
1. ‘The bank has up-to-date equipment’. 5.0 1.5
2. ‘The physical facilities of the banks are visually appealing’. 4.7 1.4
3. ‘The bank employees are well dressed and neat in appearance’. 4.2 1.6
4. ‘The physical facilities of the banks are in accordance with the type of service provided’. 4.6 1.3
5. ‘When the bank promises to do something within a certain time, it does so’. 4.3 1.5
6. ‘The bank is sympathetic and reassuring, when customers have problems’. 3.9 1.6
7. ‘The bank is dependable’. 5.2 1.6
8. ‘The bank provides the service at the promised time’. 4.6 1.4
9. ‘The bank keeps its records accurately’. 5.4 1.6
10. ‘The bank does not tell its customers exactly when services will be performed’. 4.0 1.7
11. ‘The customers do not receive prompt service from the employees’. 4.4 1.6
12. ‘The bank employees are not always willing to help the customers’. 3.7 4.6
13. ‘The bank employees are busy to respond to customer requests’. 4.1 1.6
14. ‘The bank employees are trustworthy’. 5.2 1.2
15. ‘It is safe to transact with the bank’. 5.6 1.4
16. ‘The bank employees are courteous’. 4.4 1.6
17. ‘The bank supports the employees to do the job efficiently’. 4.7 1.6
18. ‘The bank does not give individual attention to the customers’. 4.0 1.7
19. ‘The bank employees do not give individual attention to the customers’. 3.7 1.8
20. ‘The bank employees do not know the needs of the customers’. 4.0 1.8
21. ‘The bank does not have your best interest at heart’. 3.9 1.8
22. ‘The bank does not have convenient operating hours’. 3.7 1.7
Dimensional Structure of Service Quality
To reassess the underlying dimensions ofperceived service quality, the data was subjectedto factor analysis. The KMO statistics andBartlett’s Test, as shown in Table 6, suggest thatthe correlation matrix is factorable and theanalysis explicitly indicates the distinct fivedimensions of service quality, as suggested in the
Table 6
KMO Statistics and Barlett’s Test for Service Quality
KMO and Bartlett’s Test
Kaiser-Meyer-Olkin Measure of .78Sampling Adequacy
Bartlett’s Approx. Chi-Square 706.993
Test of Df 231.000Sphericity Sig. .000
02-Alka Sharma.p65 2/24/2009, 5:19 PM26

The Impact of Market-Orientation on Service Quality
NICE Journal of Business l Vol. 3 l Nos. 1 & 2 l 2008 27
SERVQUAL scale. The data also suggests an equalnumber of dimensions. The factor loadings arepresented in Table 7.
Dimensional Analysis of Service Quality
Tangibility
The mean value of the items corresponding to thisdimension is greater than the mid-point value of4, indicating that the customers perceive the bankpositively on this dimension. The customers
perceive that the bank has the latest equipmentslike computers and other physical facilities. Thisalso reflects that the bank is working upon theimprovement in its image among the customers.The higher mean value suggests that the bank hasan improved infrastructure in terms of thephysical facilities. The bank has been workingupon the tangibility aspect of service quality.Further, the customers perceive the employees tobe good in appearance and professional inoutlook. Thus, the employees project a goodimage among customers.
Table 7
Factor Loadings for Service Quality
S.No. Statement Factor 1 Factor 2 Factor 3 Factor 4 Factor 5
1. ‘The bank has up-to-date equipment’. .856
2. ‘The physical facilities of the bank are visually appealing’. .650
3. The bank employees are well dressed and neat in .650appearance’.
4. The banks physical facilities are in accordance with the .509type of service provided’.
5. ‘When the bank promises to do some thing by a certain .754time, it does so’.
6. ‘The bank is sympathetic and reassuring, when you have .712problem’.
7. ‘The bank is dependable’. .813
8. ‘The bank provides the service at the promised time’. .813
9. ‘The bank keeps its records accurately’. .586
10. ‘The bank does not tell its customers exactly when .481services will be performed’.
11. ‘The customers do not receive prompt service from .765the employees’.
12. ‘The employees are not always willing to help the .749customers’.
13. ‘The bank employees are busy to respond to .729customer requests’.
14. ‘The bank employees are trustworthy’. .604
15. ‘It is safe to transact with the bank’. .802
16. ‘The bank employees are courteous’. .618
17. ‘The bank supports the employees to do the job efficiently’. .746
18. ‘The bank does not give individual attention to the .832customers’.
19. ‘The bank employees do not give individual attention to .914the customers’.
20. ‘The bank employees do not know the needs of the .863customers’.
21. ‘The bank does not have your best interest at heart’. .670
22. ‘The bank does not have convenient operating hours’. .706
02-Alka Sharma.p65 2/24/2009, 5:19 PM27

Alka Sharma and Anil Gupta
28 NICE Journal of Business l Vol. 3 l Nos. 1 & 2 l 2008
Reliability
The descriptive statistics corresponding to thisdimension presented mixed results. The meanvalue of item no. 5 shows that although thebank tries to perform the promised job, thecustomers do not perceive it to be anencouraging performance. They are notsatisfied enough with the bank in terms of itscommitment to customers. Further , thecustomers’ perception of the bank to handle anyproblem in a sympathetic and reassuringmanner is very low. The statement also throwslight on the inefficient efforts of the bank interms of providing quality service in terms ofbeing reliable enough. Despite these issues,however, the customers’ perceive the bank tobe highly dependable. Since the bank is inpublic sector and is one of the oldest banks inthe country, customers perceive the bank hashigh ability to respond to their needs and havethe capability to keep their records accurately.
Responsiveness
The descriptive statistics of the itemscorresponding to this dimension suggest thatgenerally the bank performs moderately in termsof responsiveness. Regarding the promptness ofthe service, the average score indicates that thecustomers’ perceive that the bank is providingprompt service. This may be due to the fact thatthe bank has improved in terms of technologicalinput at customer interface levels, which mayhave reduced considerably the waiting time forthe customers. The lowest score corresponds toemployees’ willingness to help the customershas scored an average value of 3.79 (std. dev. –1.66). It shows that the customers’ perceptionregarding the employees’ willingness to help islow. They perceive that the employees are notflexible in their approach; so the kind of helpthey should provide is not readily available. Thecustomers’ perceptions further suggest that thereis an ample scope for the bank and its employeesto be more responsive and provide qualityservices.
Assurance
The descriptive statistics of the itemscorresponding to this dimension suggest thatgenerally the bank performs reasonably high onthe assurance dimension. The mean values ofitems are greater than the midpoint value of 4.The results indicate that the customers perceivethe bank and the employees to be highlytrustworthy. The trustworthiness of the bankunder study has been further analyzed in thenext statement dealing with the customers’perceptions about the safety to transact with thebank. The analysis suggests that the customershold the bank as very trustworthy and considerit very safe to transact with the bank. Thecustomers’ perception about the individualattention paid by the bank is not enough. Itsuggests that the bank should work towardsdeveloping customized services for thecustomers. Further, the low mean score of 3.7shows that the employees lack in showingempathy for the customers. The customersperceive that the employees do not giveindividual attention to them.
Empathy
The descriptive statistics of the itemscorresponding to the empathy dimension suggestthat the mean value of majority items is less thanor close to the mid-point value of 4, which is amatter of concern. The customers perceive thatemployees’ knowledge of customers is average.According to the customers, the bank does nothave their interest at heart. This may be due tothe fact that the customers believe that the bankhas an inflexible approach. It follows its processesand procedures strictly, without considering thecustomers’ point of view. Further, the customersare not satisfied with the operating hours of thebank. This may be due to the fact that almost allthe private sector banks have extended operatinghours for the convenience of the customers.
Continuing the analysis further, the meanscores of the various factors have been calculated,which are presented in Table 8.
02-Alka Sharma.p65 2/24/2009, 5:19 PM28

The Impact of Market-Orientation on Service Quality
NICE Journal of Business l Vol. 3 l Nos. 1 & 2 l 2008 29
Regression Results
Regression analysis was undertaken betweenmarket orientation dimensions and perceivedfirm performance. The results are presented inTable 9.
Perceived firm performance was measuredusing 7 – item scale and the employees of the bankwere asked to provide response. The mean scoreof the perceived firm performance is 5.97 (std.dev.- 1.11). The regression results suggest that thethree dimensions of market orientation, i.e.,intelligence generation, intelligencedissemination and responsiveness are related toperceived firm performance. Findings suggestthat intelligence dissemination (b = 0.384, t= 0.011)and responsiveness (b = 0.685, t= 0.00) aresignificantly and positively related to perceivedfirm performance. Findings indicate thatintelligence generation (b = -0.109, t= 0.478) is notsignificantly related to perceived firm
The results suggest that the bank hassubstantially improved its service qualityperceptions among the employees. Of all thedimensions, the empathy dimension has scoredthe lowest, which indicates the rigid serviceperformance by the employees. Theresponsiveness dimension has also scored belowaverage. This further indicates the gap betweenthe responsiveness dimension as perceived by theemployees and the customers.
Table 8
Mean Scores of Service Quality Dimensions
Dimensions Mean Score
Tangibility 4.83
Reliability 4.73
Responsiveness 4.12
Assurance 5.02
Empathy 3.93
Mean Average 4.53
Table 9
Regression Analysis
Model Summary
Change Statistics
Mode R R Square Adjusted Std. Error of R Square F Change df1 df2 Sig. DurbinR Square the Estimate Change F Change Watson
1 .789a .623 .598 370560 .623 25.300 3 46 .000 1.241a
ANOVA (b)
Model Sum of Squares Df Mean Square F Sig.
1 Regression 37.789 3 12.596 25.300 .000(a)
Residual 22.902 46 .498
Total 60.691 49
a. Predictors: (Constant), VAR00003, VAR00002, VAR00001b. Dependent Variable: VAR00004
Coefficientsa
Model Unstandardized StandardizedCoefficients Coefficients
B Std. Error Beta t Sig.
1. Constant .918 .642 1.430 .160
Intelligence Generation -.109 .153 -.136 -.715 .478
Intelligence Dissemination .384 .145 .474 2.642 .011
Responsiveness 0.685 .161 .525 4.250 .000
a. Debendent Variable: Firm Performance
02-Alka Sharma.p65 2/24/2009, 5:19 PM29

Alka Sharma and Anil Gupta
30 NICE Journal of Business l Vol. 3 l Nos. 1 & 2 l 2008
performance. This basically indicates that theemployees in the organization do not believe thatintelligence generation has any relation with thefirm performance. This finding can also besubstantiated by the fact that on the servicequality measure the customers believe that thebank is not responsive towards the need of thecustomer, whereas the bank employees believedthat the bank is responsive. Therefore, the bankneeds to strengthen the intelligence generationaspect and sensitize the employees towards theimportance of this function. Furthermore, thevalue of adjusted R2 is 0.598 or 59.8 per centindicating that all these three dimensions togetherexplain 59.8 per cent of the total variance inperceived firm performance.
DISCUSSION
Dynamic and hostile market conditions haveforced the business firms to be market-oriented.Market-orientation is a business culture, which isfocused on creating superior value for thecustomers. In the recent past, this concept hasreceived increasing research attention. However,most of it has focused on the US market. The studyfurther suggests that market-orientation is notmerely being customer focused, but it is alsorelated to business performance and the learningcapabilities of the organisation to change.
The organisation under study has beenanalysed for its market-orientation initiative andfor the same its performance has been studied.The study shows that the bank has recorded agrowth of 21.23 per cent in its operating profit,and an increase of 40.36 per cent in interest onloans. Despite this tremendous performance, thebank’s operating expenses have increasedmarginally by 0.84 per cent only. The bank haswitnessed a remarkable growth in the recentyears. Moreover, it has to its credit a number ofother initiatives, which are largely responsiblefor the bank’s performance , like the largestnumber of bank ATMs and the largest card basein India. Besides this, the bank’s more than 90per cent business is on core banking. Theseinitiatives have helped in improving to a large
extent the bank’s customers service level andretaining the customer base.
The above data analysis has revealed a fewmore facts about the State Bank of India, whichare indicative of the objectives of the study. Whileidentifying the extent of market-orientation of thebank, it has been seen that the employees perceivethat the bank is highly market oriented, as it hasscored an average value of 5.10. This furtherreveals that according to the employees, thebiggest factor contributing to the bank’s market-orientation initiative is responsiveness, followedby intelligence dissemination. However, the bankhas scored lower on intelligence generationaspect. It suggests that the employees believe thatthey are highly responsive to customers’ needs.Moreover, the bank is lacking in its effort togenerate information about the market and thecompetitors, which may result in affecting theother two components of market-orientation inthe long run.
The second objective of the study focused onthe analysis of customers’ perceptions regardingthe service quality level of the bank. The dataanalysis suggests that according to the customers’perceptions, the service quality level has been highbut considering the kind of competition , thebanking sector is witnessing, the value is notenough, as the market is increasingly becomingmore dynamic and complex in terms of thecustomer needs. Further, the customers perceivethat the bank is in fact a trustworthy and safeinstitution to deal with, it is so due to the fact thatthe bank has scored the highest value on assurancedimension. The empathy factor has been the leastcontributor to the service quality, which is alsosuggestive of the public sector approach of thebank to deal with the customers. This is furthercorroborated with the fact that even the responsivedimension of the service quality has scored lowervalue. These two are largely responsible for lowercustomer perception scores for the bank.
The research in market-orientation has largelyfocused on the impact of market-orientation onperformance. Statistically, the bank has achieved
02-Alka Sharma.p65 2/24/2009, 5:19 PM30

The Impact of Market-Orientation on Service Quality
NICE Journal of Business l Vol. 3 l Nos. 1 & 2 l 2008 31
a number of distinctions in the past year.Moreover, the employees also perceive that thebank’s performance has improved due to themarket-orientation, as the score for theperformance has been recorded at 5.97, which isvery high. The performance has been perceivedon the basis of profit, returns, innovations, etc.
The study has been conducted with ahypothesis that there is positive relationshipbetween market-orientation and performance.Further, in order to validate the hypothesis of thestudy, the regression analysis has been used. Theresults suggest that 59.8 per cent variance in theperformance is caused by market-orientation.This leads us to the conclusion that market-orientation is an important strategic orientationto gain competitive advantage in the presentcompetitive context.
FINDINGS
The current competitive scenario beingwitnessed by the bank has necessitated thatimportant steps are taken by it to sustain thesituation and also exploit it in the bank’s favour.Some strategies have been formulated forimproving the market-orientation and servicequality of the bank. The earlier analysis hasidentified that intelligence generation is an areawhere the bank lacks effort. It needs to developa concerted effort to develop mechanisms andprocedures for intelligence generation.Intelligence generation may be made a part ofthe process in the bank and the employees bemade aware of this process and participate in it.The employees have not shown awareness andkeenness for this component, which may makethem as well as the bank obsolete anduncompetitive in the long run.
Secondly, it has been observed that there is agap in the perceptions of the employees and thecustomers in terms of their responsiveness. Theemployees perceive that the bank is highlyresponsive to the customers’ needs, whereas thecustomers perceive vice-versa. The bank,therefore, needs to strategise the responsiveness
factor. While analysing the empathy factor, it hasalso been concluded that the bank does not showany empathy to the customers. It is necessary forthe bank to develop such methods of conductingbusiness which are not rigid and give theemployees enough opportunity to understandand serve the customer effectively. Flexibility inthe processes should be included which wouldhelp the bank improve in terms of perceptions.
Further, the bank has invested huge amountsin technology, which has put it at par with theother leading public and private sector banks. Asmentioned earlier, the bank’s 90 per centbusiness is on core banking platform. Thisinitiative should be exploited further toimplement customer relationship programmes,which would not only help the bank to providequality services to them but also effectivelymanage them.
Finally, the bank should initiate the trainingof the employees to inculcate a better customerservice climate among them. If the bank is alreadyworking on this aspect, then some parametersshould be introduced to judge the effectivenessof such programmes.
CONCLUSION
Market-orientation is highly influenced by theway the organisation operates. If it perceives thata business can get away with minimalcommitment to market-orientation under high-growth conditions, the decrease in the pace of thegrowth and competitive advantage is lost and thecompetitive hostility intensifies. Hence, it isimperative for the organisations to have such aperspective for the long run, as it relates positivelyto innovations and profitability. The presentstudy, which has analysed the impact of market-orientation on service quality in State Bank ofIndia, suggests that the relationship betweenthese two is not only significant but also positive.It further suggests that this changed approach tobusiness by the bank has helped in developing asustainable competitive advantage for the bankin comparison to its competitors.
02-Alka Sharma.p65 2/24/2009, 5:19 PM31

Alka Sharma and Anil Gupta
32 NICE Journal of Business l Vol. 3 l Nos. 1 & 2 l 2008
REFERENCES
Allred, Anthony T., and H. Lon Addams (2000), “ServiceQuality at Banks and Credit Unions: What do theCustomers Say?” International Journal of BankMarketing, Vol.18, No. 4, pp. 200-207.
Arasli, Haseyin, Salih Turan Katircioglu, and SalimeMehtap Smadi (2005), “A Comparison of BankingIndustry – Some Evidence from Turkish and GreekSpeaking Areas in Cyprus”, International Journal of BankMarketing, Vol. 23, No. 7, pp. 508-526.
Babakus, E., and G.W. Boller (1992), “An EmpiricalAssessment of the SERVQUAL Scale”, Journal ofBusiness Research, Vol. 24, pp. 253-268.
Cronin, J.J., and S.A. Taylor (1994), “SERVPERF VsSERVQUAL: Reconciling Performance based andPerceptions-minus Expectations Measurement ofService Quality”, Journal of Marketing , Vol. 58, No. 1(January), pp. 125-131.
Deshpande, Rohit, John. U. Farley, and Fredrick, Jr. Webster(1993), “Corporate Culture, Customer Orientation &Innovativeness in Japanese Firms: A QuadradAnalysis”, Journal of Marketing , Vol. 57, No. 1 (January),pp. 23-37.
Deshpande, Rohit, and John U. Farley (1998), “MeasuringMarket-Orientation, Generalisation and Synthesis”,Journal of Market-Focused Management , Vol. 2, No. 3,pp. 213-232.
Deshpande, Rohit, and John U. Farley (1999), “CorporateCulture and Market-Orientation: Comparing Indianand Firms”, Journal of International Marketing , Vol. 7,No. 4, pp. 1-18.
Doyle, P., and V. Wong (1988), “Marketing and CompetitivePerformance: An Empirical Study, European Journal ofMarketing, Vol. 32, No. 5/6, pp. 514-535.
Fitzsimmons, J.A., and M.J. Fitzsimmons (1994), ServiceManagement for Competitive Advantage (New York:McGraw-Hill).
Garvin, David A. (1988), Managing Quality: Strategic andCompetitive Edge, in Dale H. Besterfield and MaryBesterfield (eds.), Total Quality Management (New York:Free Press/Prentice-Hall)
Gronroos, C. (1984), “A Service Quality Model and ItsMarketing Implications”, European Journal of Marketing ,Vol. 18, No. 1, pp. 36-44.
Han, Jin K., Namwoon Kim, and Rajendra K. Srivastava(1998), “Market-Orientation and OrganizationPerformance: Is Innovation a Missing Link?’ Journal ofMarketing, Vol. 62, No. 1, pp. 30-45.
Hedvall, M.B., and M. Paltschik (1989), “An Investigation inand Generation of Service Quality Concepts,” in G.J.Avolonitis, et al. (eds.), “Marketing Thought andPractice in the 1990s,” European Journal of MarketingAcademy, Athens, pp. 473-483.
Ibrahim, Essam E., Mathew Joseph, and Kevin I.N. Ibeh(2006), “Customers’ Perceptions of Electronic Service
Delivery in the UK Retail Banking Sector”, InternationalJournal of Bank Marketing , Vol. 24, No.7, pp. 475-493.
Jaworski, Bernard J., and Ajay Kohli (1993), “Market-Orientation: Antecedents and Consequences”, Journalof Marketing, Vol. 57, No.3, pp. 53-70.
Kohli, Ajay, and Bernard J. Jaworski (1990), “Market-Orientation: The Construct, Research Proposition andManagerial Implications,” Journal of Marketing , Vol. 54,No. 4, pp. 1-18.
Kohli, J.K., Bernard J. Jaworski, and A. Kumar (1993),“MARKOR: A Measure of Market-Orientation”, Journalof Marketing Research , Vol. 30, No. 1, pp. 467-477.
Leblanc, G., and N. Nguyen (1988), “Customers’ Perceptionof Service Quality in Financial Institutions”,International Journal of Bank Marketing , Vol. 6, No.4,pp. 127-139.
Narver, John C., and Stanley F. Slater (1990), “The Effect ofMarket-Orientation on Business Profitability”, Journalof Marketing, Vol. 54, No. 10, pp. 20-35.
Narver, John C., Stanley F. Slater, and Brian Tietje (1998),“Creating a Market-Orientation”, Journal of Market-Focused Management , Vol. 2, No. 3, pp. 241-255.
Paliwal, Pramod, and Pratima Harigunani (2004), “TacklingPanic Withdrawals: Some Lessons”, Journal of ServicesResearch, Vol. 4, No. 2, pp. 157-174.
Parasuraman, A., L.L. Berry, and V.A. Zeithaml (1988),“SERVQUAL: A Multiple-item Scale for MeasuringConsumer Perceptions of Service Quality,” Journal ofRetailing, Vol. 63, No. 1, pp. 12-37.
Parasuraman, A., L.L. Berry, and V.A. Zeithaml (1991),“Refinement and Reassessment of the SERVQUALScale”, Journal of Retailing , Vol. 67, No. 4, pp. 420-450.
Parvatiyar, Atul, and Jagdish N. Sheth (2004), “ConceptualFramework of Customer Relationship Management”,Customer Relationship Management: Emerging Concepts,Tools and Applications , edited by Jagdish N. Sheth, AtulParvatiyar, and G. Shainesh (New Delhi: Tata McGraw-Hill Publishing Company).
Pelham, Alfred M. (2000), “Market-Orientation and OtherPotential Influences on Performance in Small andMedium Sized Manufacturing Firms”, Journal of SmallBusiness Management , Vol. 38, No. 1, pp. 48-67.
Shapiro, B.P. (1988), “What the Hell is Market-Orientation?”Harvard Business Review , Vol. 66, Nov-Dec, pp. 119-125.
Slater, S.F., and J.C. Narver (1994), “Does CompetitiveEnvironment Moderate the Market-Orientation –Performance Relationship?” Journal of Marketing ,Vol. 58, No. 1, pp. 46-55.
Webb, Dave, Cynthia Webster, and Areti Krepapa (2000),“An Exploration of the Meaning and Outcomes of aCustomer Defined Market-Orientation”, Journal ofBusiness Research, Vol. 48, No. 2, pp. 101-112.
Zeithaml, V.A., L.L. Berry, and A. Parasuraman (1993), “TheNature and Determinants of Customer Expectations ofService”, Journal of Academy of Marketing Science , Vol. 21,No. 1, pp. 1-12.
02-Alka Sharma.p65 2/24/2009, 5:19 PM32

APPROPRIATE HRM PRACTICES FORSMALL AND MEDIUM ENTERPRISES
A Study in Africa
Henry Ongori* and J.P.W. Shunda**
Abstract
Although several studies have shown that the survival and success of firms depend, to a large extent, onthe effectiveness of their HRM practices, most of the studies have focused on the HRM practices of largecorporations. Very little research has been done on the HRM practices of small and medium enterprises(SMEs), particularly in the developing African economies. The main cause of business failure in SMEs is,among others, the lack of sound HRM practices. Large and small firms differ in respect of resources andexpertise. Since an SME is not a mere miniaturised form of a large firm; it needs unique and customisedHRM practices that suit its unique conditions, resource endowments and environment. An SME needs acustomised approach for designing appropriate organisational structure, communication channel, flow ofinformation, selection and recruitment procedure, performance appraisal system, and a training anddevelopment scheme. Application of HRM practices and policies of large, multi-product, multi-divisionaland multi-national corporations (MNCs) may have serious implementation problem unless they arethoroughly modified and customised to the objective conditions in which an SME is operating. This paperanalyses the various HRM practices in general; the characteristics and current HRM practices of SMEsin particular; and develop a conceptual framework integrating the best HRM practices with characteristicsof SMEs in a developing economy, like Botswana. The paper presents new insights in the development ofappropriate HRM practices for SMEs. Some suggestions are also made for owners, managers, and trainersof SMEs on the critical dimensions of HRM practices and on customising them for situations in whichSMEs operate. Implications for future research in the area are also indicated.
Key Words: HRM practices, SMEs, Developing economies, Botswana
CONCEPTUAL FRAMEWORK ANDLITERATURE REVIEW
RESEARCH on human resourcemanagement practices (HRM), which isvital for the survival of small and medium
enterprises (SMEs) in a competitive environment,
has gained prominence in recent years. Recenttrends in globalisation of business havecompelled SMEs to have a re-look on their HRMpractices and strategies. In a changing businessenvironment, employers feel encouraged toexperiment innovative HRM practices to ensure
* Henry Ongori is with the University of Botswana, Department of Management, P.B. 00701, Gaborone, Botswana;e-mail: [email protected]
** J.P.W. Shunda is with the University of Botswana, Department of Management, P.B. 00701, Gaborone, Botswana;e-mail: [email protected]
03-Ongori.p65 2/24/2009, 5:20 PM33

Henry Ongori and J.P.W. Shunda
34 NICE Journal of Business l Vol. 3 l Nos. 1 & 2 l 2008
increased efficiency in SMEs (Okpara and Wynn,2008). Most of the researchers in the field areunanimous on the premise that HRM practicesare vital to the success of SME (Costea, 2002; andTanova and Nadiri, 2005). SMEs that have beensuccessful in managing their HRM practiceseffectively are likely to have high level ofprofitability, productivity and market share. SuchSMEs also gain in stature and strength to meetthe demands of their stockholders, investors,customers, employees and ultimately the needsof the society, like the economic revival of theregion and locality by creating new economiccentres and diffusing capital among the lowersocial strata (Costea, 2002; Coskun and Altnisik,2002; Tanova and Nadiri, 2005). SMEs, thereby,play a greater role in the economy, especially inthe diversification of the economic activities, insupplying the necessary raw material to largefirms, in creating a competitive environment, andin providing flexibility in adoption of newtechnology and production systems. SMEs needto be globally competitive, more productive andeconomically sustainable in any environment. Inorder to achieve this, SMEs require a highlyskilled, knowledgeable, innovative, andrelatively stable workforce. Studies, worldwide,have addressed HRM practices and problems oflarge, multinational companies, with littleattention to the study of the HRM practices inSMEs, particularly in developing countries.
HRM practices have been defined as ‘a newway of thinking about how people should bemanaged as employees in the work place’ (Reid,et al., 2002); as ‘practices involved in managinghuman resources to achieve better knowledge-related outcomes in retaining personnel,building their expertise into organisationalroutines through learning processes andestablishing mechanisms for the distribution ofbenefits aiming at the utilisation of thisexpertise’ (Minbaeva, 2005); and as ‘formalstrategies developed by organisations for peoplemanagement in line with organisationalstrategies, such as manpower planning, skill-mix, policies of equal opportunities, skill
retention, job security, industrial relations andredundancies’ (Sheridan and Kotey, 2004). HRMpractices contribute enormously to employees’job satisfaction and commitment. They boost upthe organisation success by minimisingemployees’ intention to quit. Some researchershave attempted to identify such of the HRMpractices as are beneficial to SMEs to beemployment security, selective hiring, extensivetraining, performance appraisal, sharing anddiffusion of information, incentives andemphasis on promotion and development(Wickramasinghe, 2007; Mazzarol, 2003; andPfeffer, 1997).
This study seeks to investigate the HRMpractices in SMEs, with a special reference torecruitment and selection, training anddevelopment, performance management,compensation to employees for their efforts toenhance organisational performance, andminimisation of employees’ intentions to quit.
Recruitment and Selection Practices
The owners/managers of the SMEs need to builda long-term commitment to retain theirworkforce. In order to be strategically positionedand globally competitive in a dynamicenvironment, SMEs need to adopt scientificrecruitment and selection practices. Employeesecurity policies should be based on scientificrecruitment and selection. The SMEs managersand policy-makers need to have a long-termstrategic view to HRM resources, rather than ashort-term operational cost-cutting approach(Fisher and Dowling, 1999). Mak (1995) observesthat bad hiring practices are caused by pooranalysis of job function, personality skills profile,inadequate interviewing and questioningtechniques. Recruitment and selection processeshelp in the selection of right kind of persons,having the right kind of qualifications and skills(Mazzrol, 2003).
Abdulai (2000) suggests that recruitment andselection processes are intended to identifyprospective employees who will fit well with
03-Ongori.p65 2/24/2009, 5:20 PM34

Appropriate HRM Practices for Small and Medium Enterprises
NICE Journal of Business l Vol. 3 l Nos. 1 & 2 l 2008 35
organisational needs. A good employee istrustworthy; can do a good job quickly andefficiently, with a steady background; he is in agood health; he is honest and pleasant to workwith others (Wyatts, 1989). Similarly, employersshould pay close attention to the behaviouraltraits of prospective employees duringrecruitment and selection process (Sheridan andKotey, 2004). In recruitment and selection ofemployees, due care should be taken to avoidcommon pitfalls, such as discrimination on thebasis of race, sex or marital status. Moreover,employment advertisements should not bediscriminatory in terms of gender-bias. Asking allapplicants the same questions should also beavoided.
Informal recruitment is still widely practisedin SMEs as complementary to the formalrecruitment (Barber, et al., 1999; Carroll, 1999).Formal procedures attract, acquire and evaluateapplications which will lead to selecting the rightcandidate for the job (Tanova and Nadiri, 2005).Recruitment methods, such as realistic jobpreviews, provide accurate and detailedinformation about the applicant and can behelpful in making decisions for accepting orrejecting the offer because the applicants will bein a position to understand the job expectations(Watson, 1999). On the other hand, formalrecruitment methods, such as pressadvertisements, job-centre and other agencies,could be used besides the informal ones,including recommendations from the existingstaff and word of mouth publicity.
Training and Development Practices
Training and development refers to any activitythat is intended to develop skills, knowledge andbehaviour of employees. Training of employeesis very important to both the employees andorganisation, as it equips them with necessaryskills for the present and future tasks andprovides an opportunity to share theirexperiences with others and increases the degreeof organisation cohesiveness (Tanova and Nadiri,2005). Proper training will minimise their
intention to quit and improve their habit ofabsenteeism (Jackson and Schuler, 2000).
Traditional expectation has been that aworker should receive his education and trainingbefore he enters the workforce. However, theincreasing pace of technological changes impliesthat workers will need to update and expandtheir productive knowledge and skill throughouttheir working life. Some of this upgrading shouldbe done within the institutions of highereducation. In general, training providesemployees with knowledge and skill applicablewithin and outside the current organisation.These act as an incentive to the employees (Reid,et al., 2002). Training enables employees to dotheir current job in a better way. In the later life,the skills learnt while in service will help theemployee even outside the organisation.
Training and development of employeesimprove customer services of SMEs. Trainingprovides a mix of on-the-job and formal training,building team relationship and new ways ofworking (Minbaeva, 2005). Training toemployees, in addition, leads to high-performance in SMEs. This means that employeesshould be equipped with necessary skills toenable the organisation to achieve its goal.Knowledge and intellectual capital are becomingincreasingly important in SMEs in this era ofcompetitive global markets (Abdulai, 2000).
Compensation Practices
Compensation takes the shape of monetary andnon-monetary rewards which an employee getsin exchange for the services rendered by him.Thus, a well designed pay structure of theorganisation sends a clear message to SMEsworkforce that employees are truly valued asassets of the business. Compensation can take anyform such as increase in the basic pay, shareownership, stock options, profit sharing,commissions, bonuses, paying for skillsacquisitions and individual or group incentives.Similarly, compensation can be in the form ofpromotion based on certain accepted policies ofthe organisation. Promotion of employees which
03-Ongori.p65 2/24/2009, 5:20 PM35

Henry Ongori and J.P.W. Shunda
36 NICE Journal of Business l Vol. 3 l Nos. 1 & 2 l 2008
is done properly in line with the human capitalstrategy of the organisation motivates employees.In addition, in designing pay structure or policiesrelated to compensation, the management shouldconsult employees, trade unions and thestakeholders. Similarly, the pay structure of SMEsshould be both internally and externallycompetitive to minimise employee turnover.Employees should also be motivated by intrinsicrewards for challenging work, autonomy of thework, task significance and job enrichmentamong others.
Individual employees should be rewarded atthe team level, unit level, and at the organisationlevel (Zobal, 1999). Many researchers agree thatcompensation should be in line with theindividual’s effort to enhance organisationalperformance (Okpara and Wynn, 2008; Schusterand Zingham, 1999). They also agree thatextrinsic rewards, such as money, are extremelyimportant in the short run, but intrinsic rewardsare more meaningful in nature because they haveeffect of motivating employees in the long run(Zobal, 1999). HRM practitioners feel thatincentives have positive effect in motivatingemployees and non-financial rewards have manyadvantages, like flexibility (Pascerella, 1997).
In designing compensation schemes foremployees, one should consider benefits, like on-site day-care, on-call baby-sitters for sick-carechildren, domestic partner benefits, on-site fitnessand yoga classes, three-day week end mini-vacations in company-owned cottages, mortgagefinancing, work visa and other kind of legalassistance will motivate employees if they areprovided by the employers (Lockwood andAnsari, 1999).
Performance Appraisal Practices
Performance appraisal is a process that involvesidentifying the strengths and weaknesses ofemployees. It is a yardstick to measure theprogress of each employee’s performance, and iscentred on individual employee and his/hercontribution to the organisation, as measured
against the expected standard of performance.The procedures of performance appraisal alsovary from organisation to organisation.Consequently, discussing a person’s performanceopenly is likely to clash head-on with the society’snorm of keeping harmony and may be felt by asubordinate as an unacceptable loss of face.
Managers and employees engage in twotypes of performance appraisal discussions. Thatis, a top-down discussion in which thecandidate’s performance is judged by hisimmediate supervisor, a bilateral discussion inwhich employee and supervisor explore together“how things are going” and “where the problemsare”, and during which an employee is allowedto “say his piece of mind” on performance. Themanager should be responsible for correctingpoor quality work so that employees with anyweakness are identified.
The type of appraisal instrument used tomeasure performance is also important. Theappraisal form should be easy to understand forthose who appraise as also for those who arebeing apprised and should provide an adequatelevel of behavioural richness to encouragemeaningful discussion. A study by Wiersma andBerg (1999) shows that managers preferbehavioural observation scales (BOS) to traitscales and to behaviourally-anchored ratingscales (BARS) because the BOS yield moreinformation to provide feedback and setsubsequent goals. The BOS are algebraically-summated, Likert-type scales, based on ‘criticalincident job analysis’ and the appraiser indicatethe frequency with which the employee hasengaged in specific behaviour.
Proposed Conceptual Model
The conceptual framework for this paper is basedon the available literature on human resourcemanagement practices. The framework, depictedin Figure 1, suggests that if managers and ownersof SMEs take HRM practices seriously, the SME swill be in a position to achieve organisationalneeds by increasing profitability, productivity, and
03-Ongori.p65 2/24/2009, 5:20 PM36

Appropriate HRM Practices for Small and Medium Enterprises
NICE Journal of Business l Vol. 3 l Nos. 1 & 2 l 2008 37
the market share. Thus, in the long run, an SMEwill be in a position to satisfy the stockholders,government, investors, trade unions, employees,bankers, and the society at large.
RESEARCH METHODOLOGY
The research design, employed for this study,was a cross-sectional survey. The surveyinstrument used in collecting data was aquestionnaire. A questionnaire was the mostpopular instrument used in the previous relatedstudies (Okapara and Wynn, 2008; Yaganesh andSu, 2008; Ongori and Agolla, 2008; Tanova andNadiri, 2005). The research instrument wasdivided into five parts: Part 1 comprised thedemographic information of the respondent,Part II dealt with recruitment and selectionpractice, Part III with training and development,Part IV with compensation, and Part Vcomprised performance management. A pilotstudy was conducted with a few managers ofSMEs to test the reliability and validity of theinstrument. Their suggestions wereincorporated before final administration of thequestionnaire to the sample of the study. Tomeasure their perception, the Five-point Likertscale (using strongly agree=5 to stronglydisagree=1) was developed.
Out of the 360 questionnaires randomlydistributed to SME managers and owners inGaborone, only 155 questionnaires were receivedback duly completed; giving a response rate of43 per cent of respondents. The response rate isconsistent with similar surveys involving smallfirms (Desphande and Golhar, 1994; Uyargil, etal., 2001; Yaganesh and Su, 2008; and Tanova andNadiri, 2005).
Respondents’ Profile
The data was collected mostly from themanufacturing SMEs (60 per cent) and serviceSMEs (40 per cent). Most of the SMEs were ownedby corporations (63 per cent), partnership firms(22 per cent), and sole proprietor (15 per cent).Thus, partnership and company ownershipaccounted for 85 per cent of the sample SMEs.Moreover, most of the SMEs surveyed (64 percent) indicated that they had been in existence forover 6 years and those less than 6 years accountedfor (36 per cent) of the respondents.
The sample consisted of 98 males and 57females. The age of the managers/ownersparticipated in the survey was between 26 and35 years (41 per cent) 36 and 45 years (34 per cent),18 to 25 years (20 per cent), and 46 to 55 years (4per cent). Most of the sample SMEs were
Figure 1
Conceptual framework
Recruitment andSelection
Training andDevelopment
Compensation
PerformanceManagement
OrganisationFit
Organisational
NeedsProfitabilityProductivityIncrease inmarket shareGrowthEmployeesRetentionSurvivalDevelopment
03-Ongori.p65 2/24/2009, 5:20 PM37
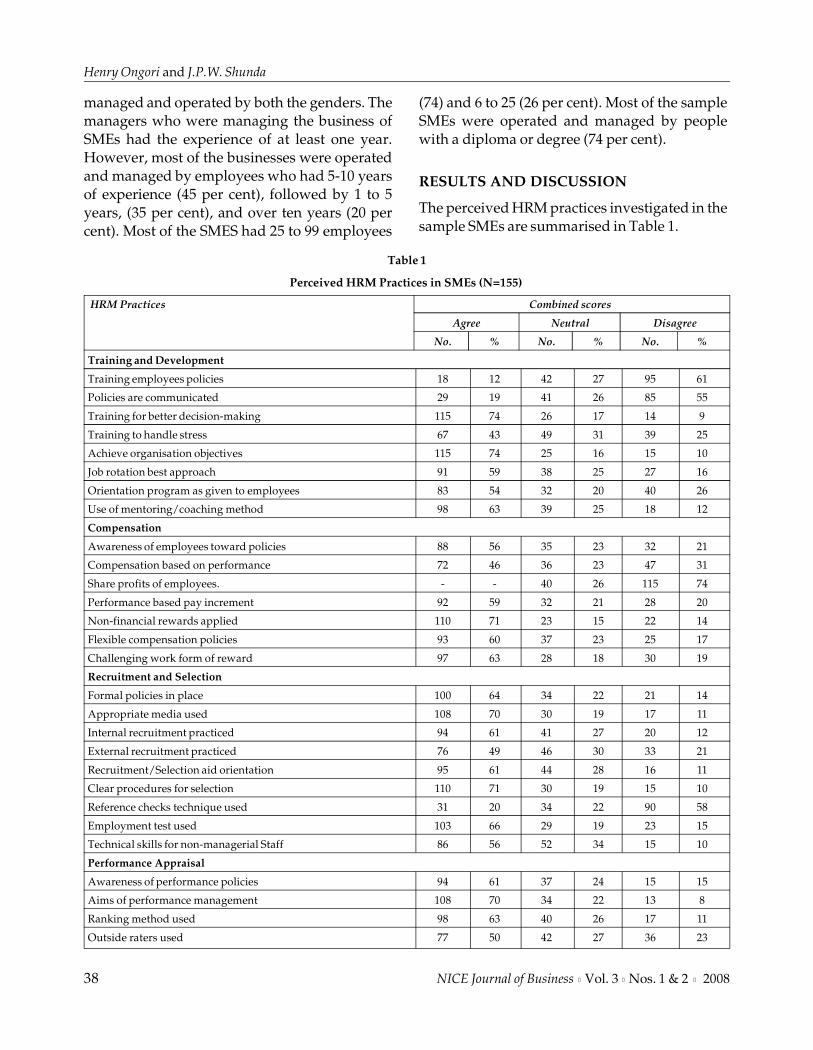
Henry Ongori and J.P.W. Shunda
38 NICE Journal of Business l Vol. 3 l Nos. 1 & 2 l 2008
managed and operated by both the genders. Themanagers who were managing the business ofSMEs had the experience of at least one year.However, most of the businesses were operatedand managed by employees who had 5-10 yearsof experience (45 per cent), followed by 1 to 5years, (35 per cent), and over ten years (20 percent). Most of the SMES had 25 to 99 employees
(74) and 6 to 25 (26 per cent). Most of the sampleSMEs were operated and managed by peoplewith a diploma or degree (74 per cent).
RESULTS AND DISCUSSION
The perceived HRM practices investigated in thesample SMEs are summarised in Table 1.
Table 1
Perceived HRM Practices in SMEs (N=155)
HRM Practices Combined scores
Agree Neutral Disagree
No. % No. % No. %
Training and Development
Training employees policies 18 12 42 27 95 61
Policies are communicated 29 19 41 26 85 55
Training for better decision-making 115 74 26 17 14 9
Training to handle stress 67 43 49 31 39 25
Achieve organisation objectives 115 74 25 16 15 10
Job rotation best approach 91 59 38 25 27 16
Orientation program as given to employees 83 54 32 20 40 26
Use of mentoring/coaching method 98 63 39 25 18 12
Compensation
Awareness of employees toward policies 88 56 35 23 32 21
Compensation based on performance 72 46 36 23 47 31
Share profits of employees. - - 40 26 115 74
Performance based pay increment 92 59 32 21 28 20
Non-financial rewards applied 110 71 23 15 22 14
Flexible compensation policies 93 60 37 23 25 17
Challenging work form of reward 97 63 28 18 30 19
Recruitment and Selection
Formal policies in place 100 64 34 22 21 14
Appropriate media used 108 70 30 19 17 11
Internal recruitment practiced 94 61 41 27 20 12
External recruitment practiced 76 49 46 30 33 21
Recruitment/Selection aid orientation 95 61 44 28 16 11
Clear procedures for selection 110 71 30 19 15 10
Reference checks technique used 31 20 34 22 90 58
Employment test used 103 66 29 19 23 15
Technical skills for non-managerial Staff 86 56 52 34 15 10
Performance Appraisal
Awareness of performance policies 94 61 37 24 15 15
Aims of performance management 108 70 34 22 13 8
Ranking method used 98 63 40 26 17 11
Outside raters used 77 50 42 27 36 23
03-Ongori.p65 2/24/2009, 5:20 PM38

Appropriate HRM Practices for Small and Medium Enterprises
NICE Journal of Business l Vol. 3 l Nos. 1 & 2 l 2008 39
The respondents were asked to indicatewhether they have training policies for theiremployees. The results indicated that 95 (61 percent) of the respondents disagreed. This suggeststhat some SMEs were operating without properpolicies for training their employees. This isdetrimental to organisational performance.Training of human capital is critical for thesurvival, growth and sustainability of SMEs. Lackof well-defined policies to train employees inorganisation will affect employee relations (Tanovaand Nadiri, 2005). In previous empirical studies,training of employees was considered as one of thestrategies in enhancing employee loyalty andcommitment (Jackson and Schuler, 2000; Okparaand Wynn, 2008; Schuster and Zingham, 1999). Onthe variable whether training policies arecommunicated to all employees, it was found that85 (55 per cent) of the respondents had disagreed.This indicates that although some SMEs hadpolicies on how to train their employees, they didnot communicate the fact to their employees. Thisis not a good strategy for promoting employeerelations in SMEs. Management should keep theiremployees informed of the policies which affectthem. Failure to encourage open communicationin organisation will lead to organisational conflicts(Ongori, 2008).
A large majority of the respondents (74 percent) felt that training should be taken seriouslyby the management, since it enabled employeesto make better decisions and perform better. Thisfinding is consistent with that of Reid, et al. (2002),who argued that training provided employeeswith knowledge and skills to enable them tomake quality decisions. In addition, Ongori(2007) argued that the lack of training ofemployees was a major contributing factor toemployee turnover in organisations. In the faceof many challenges in the present era ofglobalisation, SMEs stand to benefit if they investin the development of the human capital.
On the variable whether training ofemployees will help employees to cope up withstress, only 67 (43 per cent) of the respondentsagreed. Needless to stress, occupational stress
should be managed properly to promoteemployee relations and minimise their intentionsto quit. In fact, training of employees helps themin developing stress-coping skills. To a largemajority of the respondents, (74 per cent)employee training is important for theorganisation, especially in enhancingorganisational performance. The results alsoindicated that training is critical for the survivalof SMEs. This finding is consistent with that ofWright, et al. (1994), who argued that knowledgeand intellectual capital development inorganisation were becoming increasinglyimportant in highly competitive global markets.
A majority of respondents (59 per cent) isconsidered job rotation as one of the best methodsof training employees. Orientation of employeeespecially the new ones, was favoured as an aidto training in organisation, by a majority ofrespondents (54 per cent).
Thus, all new as well as the existingemployees who have been given addedresponsibilities should be oriented. Most of themanagers in SMEs (63 per cent) felt thatmentoring of employees should be takenseriously. This suggests that managers andowners of SMEs realise the importance ofsuccession planning in organisations.
On the variable of compensation ofemployees, the results indicated that a majorityof employees (56 per cent) were aware of theircompensation policies. This highlighted thatemployees of SMEs were aware about theintrinsic and extrinsic rewards in place. Thispromotes good employees relations and reducesemployees’ intentions to quit. Only 42 per centof the respondents felt that the employees werecompensated on the basis of their performance.In this connection, it must be noted that certainscholars (Schuster and Zingham, 1999 and Zobal,1999) have argued that compensation should bein line with an individual’s effort.
On the variable whether the employees sharepart of the profits, a large majority (74 per cent)of the respondents disagreed with the policy. This
03-Ongori.p65 2/24/2009, 5:20 PM39

Henry Ongori and J.P.W. Shunda
40 NICE Journal of Business l Vol. 3 l Nos. 1 & 2 l 2008
suggests that most of the SMEs need to changetheir approach in compensating their employees.Although sharing of profits may be risky toemployees, management should consider it asone of the strategies to minimise employeeturnover in organisations.
A majority of respondents (59 per cent) feltthat pay increment of employees was based ontheir performance. Whether non-financialrewards were used in SMEs, a majority of (60 percent) of the respondents agreed. This finding isconsistent with that of Zobal (1999) who statedthat since extrinsic rewards would have a short-term effect on the employees, in the long-run,intrinsic rewards should be considered. Forinstance, employees should be given achallenging work and promotional avenues.Hence, SMEs should apply both intrinsic andextrinsic rewards judiciously in compensating theemployees.
The respondents were asked whether therewere flexible compensation policies in theirorganisation. A majority (60 per cent) indicatedtheir affirmation. This finding is consistent withthat of Pascerella (1997), who argued that flexiblecompensation policies were good for theorganisation since they can accommodate anychanges which might arise due to inflationaryadjustments. On the variable whetherchallenging work was considered as a reward, amajority (63 per cent) of the respondents agreedwith the statement. Challenging work hasundoubtedly a long-term impact on employees’performance and commitment.
On the recruitment and selection variable, theresults indicated that formal policies were inplace for recruiting employees (64 per cent). Thisreflected that both formal and informal policieswere practised in the SMEs. Although formalpractices were considered to be the best, SMEsprefered informal practices (Barber, et al., 1999).In recruiting employees, a majority (70 per cent)of the respondents found newspapers to be theappropriate medium. This finding is consistentwith that of Mak (1995), who argued that for
SMEs to survive, grow and develop in this era ofglobalisation there is need for good recruitmentpractices. A majority (61 per cent) of the SMEssurveyed agreed that for recruitment ofemployees the internal sources were givenpriority. This finding is consistent with that ofWatson (1999), who stated that internalrecruitment provided accurate and detailedinformation about the applicant and minimisesthe recruitment expenses. In addition, externalrecruitment is also practised in SMEs in only 49per cent of cases. Thus, managers of SMEssurveyed realised the importance of externalrecruitment, especially in injecting new skills inthe organisation.
On whether recruitment and selection processaids orientation, a majority (61 per cent) of therespondents agreed.
Having a clear and proper procedure ofrecruitment and selection enabled theorganisation to have the right quality andquantity of employees. This was favoured by alarge majority (71 per cent) of the respondents.Reference-check technique was not commonlyused in 58 per cent of the sample SMEs. Failureto cross-check and verify the information givenby the applicants will be classified as bad hiresin organisation (Mak, 1995). Reference-check isindeed important in organisation in order to havethe right human capital.
Employment tests are used in SMEs’ selectionprocess although they are not widely practised(66 per cent). There are various tests which canbe applied to aid selection process, likeproficiency and aptitude tests. This would helpthe managers and other personnel entrusted withthe responsibility of selection process to makebetter hiring decisions. Technical skills werehighly favoured for non-managerial positions (56per cent). This practice is good for the operationsof SMEs. The performance of SMEs, especially onlower levels of the organisation, depends largelyon the technical skills of their employees.
On the performance management variable, amajority (61 per cent) of respondents indicated that
03-Ongori.p65 2/24/2009, 5:20 PM40

Appropriate HRM Practices for Small and Medium Enterprises
NICE Journal of Business l Vol. 3 l Nos. 1 & 2 l 2008 41
the employees were aware about the firm’s policiesof performance management system. Therefore,the standards set should be specific, measurable,achievable, and realistic and timed (SMART). Theperformance aims should be clearly spelt out. Thismotivates employees to work towards achievingthe performance standards set since they are basedon the SMART principle. Performance appraisalsfor the employees should highlight their strengths,opportunities to be developed and weakness to becorrected (68 per cent). This approach is good forthe SMEs employees because they will be in aposition to know their strengths and weaknesses.In evaluating the employees’ performance, theranking method was considered as the mostappropriate, by a majority of respondents(63 per cent).
Other methods can also be used. On thevariable whether outside raters are used in ratingthe employees, 50 per cent of the respondentsagreed to the statement. This approach, ifpractised, is good for promoting employeerelations in SMEs and will minimise employees’intention to quit.
CONCLUSIONS
HRM practices are critical to SMEs’ survival,growth and development, and, at the same time,these help the organisation in increasingprofitability, productivity and retention ofemployees. The policies pertaining to training ofemployees which are in place are notcommunicated to the employees. The training ofemployees in SMEs has a great impact on theirretention and on organisational performance.Although various approaches are available fortraining the employees of SMEs, on-the-jobtraining is considered to be the best for impartingnecessary skills to the employees; pre-serviceapproaches can play only a supplementary role.It has been formed that the managers/owners ofSMEs apply both intrinsic and extrinsic rewardsin compensating their employees. These rewardsdo have a positive effect on employeeperformance and retention in SMEs.
For recruitment and selection of employees,the managers/owners of SMEs use both theinternal and external sources and both of themare found to be so useful for the organisationbecause they promote employee relations andinject new talent in the organisation. Poorrecruitment can be avoided by conductingdetailed job analysis, using appropriate mediafor advertisement, adequate interviewing, andquestioning techniques, employment tests andreference checks (Mak, 1995). Performancemanagement is used as a controlling strategy toassess employees’ strengths and weaknesses inSMEs. Performance standards should bespecific, measurable, achievable, and realistic,and time-bound. Ranking method has beencommonly used in evaluating the employees.Other methods, like point system, should alsobe used. This will enable the management toassess the employees’ strengths andweaknesses. This study is expected to makecontribution to the body of knowledge if itprompts the managers of SMEs to come up withappropriate strategies and promote good HRMpractices in their organisation. The majorlimitation of this study is that the sampleselected on the basis of convenience sample didnot comprise all SMEs in Botswana and,therefore, the suggested premises cannot begeneralised for all the SMEs, which were notpart of this study. Therefore, there is a need of alongitudinal research to be conducted in future,which has large sample to have a clearerviewpoint on HRM practices in SMEs. Inaddition, triangulation method needs to beapplied in future research to validate thesefindings.
REFERENCES
Abdulai, A. (2000), “Human Resource Management”,Journal of Public Sector Management, Vol. 13, No. 5,pp. 5-7.
Barber, A., M. Wesson, Q. Roberson, and S. Taylor (1999),“A Tale of Two Job Markets: Organisational Size andIts Effects on Hiring Practices and Job SearchBehaviour”, Journal of Personnel Psychology, Vol. 52,No. 4, pp. 841-67.
03-Ongori.p65 2/24/2009, 5:20 PM41

Henry Ongori and J.P.W. Shunda
42 NICE Journal of Business l Vol. 3 l Nos. 1 & 2 l 2008
Carroll, M., M. Marchington, J. Earnshaw, and S. Taylor(1999), “Recruitment in Small Firms: Processes,Methods, and Problems”, Journal of Employee Relations ,Vol. 8, No. 6, pp. 272-91.
Coskun, R., and R. Altunisik (2002), “ManagementConcerns about Issues faced by Turkish SMEs”,International Journal of Small Business Management ,Vol. 8, No. 6, pp. 272-91.
Costea, E.S. (2002), “The Role of HRM in Today’sOrganisation: The Case of Cyprus in Comparison withEuropean Union”, Journal of European IndustrialTraining, Vol. 26, No. 6, pp. 261-268.
Deshpande, S., and D. Golhar (1994), “HRM Practices inLarge and Small Manufacturing Firms: A ComparativeStudy”, Journal of Small Business Management , Vol. 32,No. 2, pp. 49-56.
Huselid, M.A. (1995), “The Impact of Human ResourceManagement Practices Turnover, Productivity andCorporate Financial Performance”, Academy ofManagement Journal, Vol. 38, No. 3, pp. 35-72.
Jackson, S.E., and R.S. Schuler (2001), Managing HumanResource: A Partnership Perspective , (London: South-Western College Publishing).
Karl, J.M. (2002), “Human Resource Practices and ServiceQuality in Parks”, International Journal of ContemporaryHospitality, Vol. 14, No. 4, pp. 6-17.
Lockwood, D. and A. Ansari (1999), “Recruiting andRetaining Scarce Information Technology Talent”,Journal of Industrial Management and Data Systems,Vol. 99, No. 6, pp. 251-256.
Mak, C. (1995), “Successful People Selection in Action”,Journal of Health Manpower Management, Vol. 21, No. 5,pp. 12-16.
Matt, V. (2004), Manufacturing Empowerment, ‘EmployeeInvolvement’ in the Labour Process after Fordism ,University of Wisconsin-Madison, pp. 5-9.
Mazzarol, T. (2003), “A Model of Small Business HR GrowthDevelopment”, International Journal of EntrepreneurialBehaviour and Research , Vol. 9, No. 1, pp. 27-49.
Minbaeva, D.B. (2005), “HRM Practices and MNCKnowledge Transfer”, Personnel Review, Vol. 34, No. 1,pp. 125-144.
Okpara, J.O., and Wynn (2008), “Human ResourceManagement Practices in a Transition Economy”,Management Research Review , Vol. 31, No. 1, pp. 56-76.
Ongori, H. (2008), “Organisational Conflicts and Its Effectson Organisational Performance”, Research Journal ofBusiness Management, Vol. 2, No. 1, pp. 16-24.
Ongori, H. (2007), “A Literature Review on EmployeeTurnover”, African Journal of Business Management,Vol. 1, No. 3, pp. 049-54.
Ongori, H., and J.E. Agolla (2008), “Occupational Stress inOrganizations and Its Effects on OrganizationalPerformance”, Indian Journal of Management Research,Vol. 8, No. 3, pp. 123-135.
Pascarella, P. (1997), Compensating teams , Across the Board,pp. 16-22.
Reid, R., T. Morrow, B. Kelly, and Pat Carton (2002), “PeopleManagement in SMEs”, Journal of Small Business andEnterprise Development , Vol. 9, No. 3, pp. 249-259.
Shuster, J.R., and P.K. Zingheim (1999), “Building PayEnvironments to Facilitate High Performance Teams”,American Compensation Journal, pp. 40-50.
Sheridan, A., and A. Kotey (2004), “Changing HRMPractices with Growth”, Journal of Small Business andEnterprise Development , Vol. 11, No. 4, pp. 474-485.
Tanova, C. and H. Nadiri (2005), “Recruitment and TrainingPolicies and Practices”, Journal of European IndustrialTraining, Vol. 29, No. 9, pp. 694-711.
Watson, T. (1989), “Recruitment and Selection”, PersonnelManagement, Blackwell, Oxford.
Wiersma, U.J., T. Peter Berg (1999), “Influences and Trendsin Human Resources Management Practices in theNetherlands”, Employee’s Relations, Vol. 21, pp. 63-79.
Wright, P.M., G.C. McMahan, and A. McWilliams (1994),“Human Resources and Competitive Advantage: AResource-based Perspective,” International Journal ofHuman Resource Management, Vol. 5, No. 2, pp. 303-326.
Wickramasinghe, V. (2007), “Staffing Practices in the PublicSector in Sri Lanka”, Journal Career DevelopmentInternational, Vol. 12, No. 2, pp. 108-128.
Yeganesh, H., and Z. Su (2008), “An Examination of HumanResource Management Practices in Iranian PublicSector”, Journal of Personnel Review , Vol. 37, No. 2,pp. 203-221.
Zobal, C.L. (l999), “The Ideal Term Compensation SystemOverview”, Journal of Team Performance Management,Vol. 5, No. 1, pp. 23-45.
03-Ongori.p65 2/24/2009, 5:20 PM42

DEVELOPING MANAGEMENT INFORMATIONSYSTEM FOR FOREIGN EXCHANGE EXPOSURE
Nidhi Jain*
Abstract
Indian firms have often been hesitant in venturing out to the exciting and often mysterious world ofglobal derivatives. The paper is an attempt to induce practitioners in India to attempt informed decisionmaking, through the use of new and improved technologies. Through a structured questionnaire approach,corporate objective; attitude to risk; corporate techniques, organisation structure, and the design ofmanagement information system, are studied. The information has been elicited from the Directors(Finance) of various Indian companies. The findings, given in the paper, are not only interesting butuseful as well.
Key Words: Foreign exchange risk, Hedging methods, Management information system,Transaction exposure, Economic exposure, Multinational company
THEORETICAL FRAMEWORK
THE study of management informationsystems started in the 1970s to focus oncomputer-based information systems
aimed at managers. A Management InformationSystem (MIS) combines the theoretical work ofcomputer science, management, and operationsresearch, with a practical orientation towardbuilding a system and its application. It alsoexamines the behavioural issues raised bysociologists, economists, and psychologists. MISrefers to the study of information systems inbusiness and management. It also designates aspecific category of information systems, servingmanagement-level functions. The managementinformation system serves the management of theorganisation, providing managers with reports or
with on-line access to the organisation’s currentperformance and past records. Typically, they areoriented almost exclusively to internal, notenvironmental or external, events. The MISprimarily serves the managerial functions ofplanning, controlling and decision-making.Generally, it depends on the underlyingtransaction-processing systems, for the data.
MIS, essentially, summarises and reports onthe company’s basic operations. MIS usuallyserves managers interested in weekly, monthly,and yearly results – not day-to-day activities, andprovides answers to routine questions that havebeen specified in advance and have a pre-definedprocedure for answering them. These systems aregenerally not flexible and have little analyticalcapability. They use simple routines, such as
* Dr. Nidhi Jain is a Reader in the Department of Financial Studies, Delhi University, South Campus, New Delhi – 110 021;e-mail: [email protected]
04-Nidhi.p65 2/24/2009, 5:21 PM43
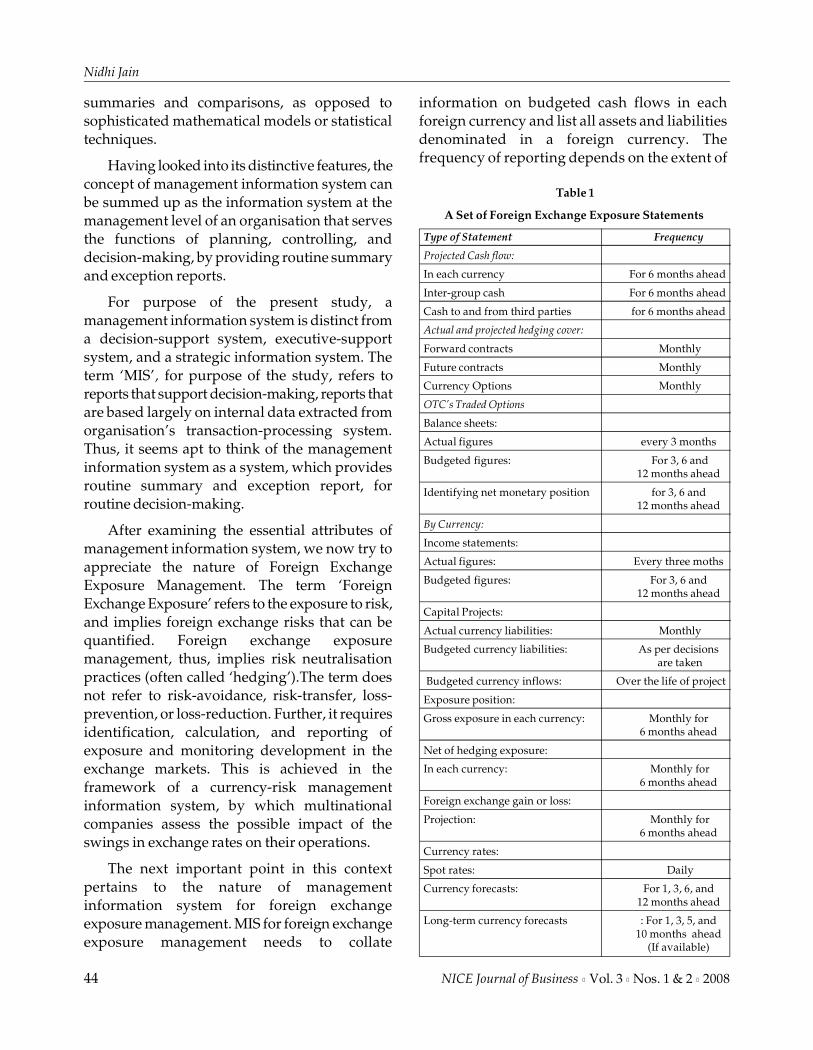
Nidhi Jain
44 NICE Journal of Business l Vol. 3 l Nos. 1 & 2 l 2008
summaries and comparisons, as opposed tosophisticated mathematical models or statisticaltechniques.
Having looked into its distinctive features, theconcept of management information system canbe summed up as the information system at themanagement level of an organisation that servesthe functions of planning, controlling, anddecision-making, by providing routine summaryand exception reports.
For purpose of the present study, amanagement information system is distinct froma decision-support system, executive-supportsystem, and a strategic information system. Theterm ‘MIS’, for purpose of the study, refers toreports that support decision-making, reports thatare based largely on internal data extracted fromorganisation’s transaction-processing system.Thus, it seems apt to think of the managementinformation system as a system, which providesroutine summary and exception report, forroutine decision-making.
After examining the essential attributes ofmanagement information system, we now try toappreciate the nature of Foreign ExchangeExposure Management. The term ‘ForeignExchange Exposure’ refers to the exposure to risk,and implies foreign exchange risks that can bequantified. Foreign exchange exposuremanagement, thus, implies risk neutralisationpractices (often called ‘hedging’).The term doesnot refer to risk-avoidance, risk-transfer, loss-prevention, or loss-reduction. Further, it requiresidentification, calculation, and reporting ofexposure and monitoring development in theexchange markets. This is achieved in theframework of a currency-risk managementinformation system, by which multinationalcompanies assess the possible impact of theswings in exchange rates on their operations.
The next important point in this contextpertains to the nature of managementinformation system for foreign exchangeexposure management. MIS for foreign exchangeexposure management needs to collate
information on budgeted cash flows in eachforeign currency and list all assets and liabilitiesdenominated in a foreign currency. Thefrequency of reporting depends on the extent of
Table 1
A Set of Foreign Exchange Exposure Statements
Type of Statement Frequency
Projected Cash flow:
In each currency For 6 months ahead
Inter-group cash For 6 months ahead
Cash to and from third parties for 6 months ahead
Actual and projected hedging cover:
Forward contracts Monthly
Future contracts Monthly
Currency Options Monthly
OTC’s Traded Options
Balance sheets:
Actual figures every 3 months
Budgeted figures: For 3, 6 and12 months ahead
Identifying net monetary position for 3, 6 and12 months ahead
By Currency:
Income statements:
Actual figures: Every three moths
Budgeted figures: For 3, 6 and12 months ahead
Capital Projects:
Actual currency liabilities: Monthly
Budgeted currency liabilities: As per decisions are taken
Budgeted currency inflows: Over the life of project
Exposure position:
Gross exposure in each currency: Monthly for6 months ahead
Net of hedging exposure:
In each currency: Monthly for6 months ahead
Foreign exchange gain or loss:
Projection: Monthly for6 months ahead
Currency rates:
Spot rates: Daily
Currency forecasts: For 1, 3, 6, and12 months ahead
Long-term currency forecasts : For 1, 3, 5, and10 months ahead
(If available)
04-Nidhi.p65 2/24/2009, 5:21 PM44

Developing Management Information System for Foreign Exchange Exposure
NICE Journal of Business l Vol. 3 l Nos. 1 & 2 l 2008 45
foreign trading and the stability of the currenciesbeing monitored.
A list of suggested statements that need to beprepared on a regular basis if the finance officerwishes to monitor and control the currencyexposure of his company is given in Table 1.
Some of the findings of McRae and Walker(1980) are pertinent in this context. They, forexample, after studying several currencyinformation systems suggest that the followingprinciples should be employed in setting up aneffective foreign exchange information system.One, the information should be anticipatory. Inother words, the system should concentrate onfuture not past events. Two, the frequency of thereporting period is important. So, the financeofficer must tailor the frequency of reporting tothe specific needs of the company and the stabilityof the currencies used by the company. A standardreporting period for every subsidiary is not likelyto work efficiently. Three, the information shouldbe sent directly to the officers controlling foreignfinancial operations. Some companies, it wasfound, send all currency information first to thechief accountant or controller who redirects it tothe relevant foreign exchange department. Thisapproach, it was felt, shows the control systemdown and makes it inflexible. The reaction periodto new information is slowed down. Themanagers who need the information must beclearly identified and the information sentdirectly and speedily to those individuals. Four,the benefits of the foreign exchange informationsystem must be carefully explained to all users ofthe system. There is evidence that many managersdo not fully understand the impact of foreigncurrency on profit. If the importance of efficientcurrency management is explained to staff, thisshould improve the accuracy and speed withwhich the information is processed through thesystem. Five, the same type of information systemshould not be applied to all foreign operations. Itis wise to tailor the system to the specific needsand size of each individual foreign operation. Thiswill improve the relevance of the informationprocessed and ensure better co-operation from the
foreign operators. A 20-line monthly balance sheetexposure report from a subsidiary, with Rs. 250crore annual sales may be worthwhile; if the samereport is requested from the Rs. 5 crore units, thenthe management time and motivation areneedlessly wasted.
Having understood some noteworthy aspectsof the ‘management information system forexposure management’, as enumerated inliterature, we would for the time being, sum upour stance as: The above points thoughnoteworthy, seem to be the general reportingprinciples; yet, these should be the basis of allexposure information systems.
LITERATURE REVIEW
Previous research has concentrated on studyingthe hedging practices of some US and UKcompanies. These include Davis (1989), BelkandGlaum (1990), Bodnar and others (1995), Clifford(1995), and Edelshen (1995). However, only a fewof them have examined such practices for Indiancompanies, e.g., Yadav and Jain, etc. Moreover,little or no empirical research has been carried outto investigate foreign exchange risk managementpractices of Indian multinational companies.Finally, no study conducted so far has attemptedto develop a structured routine decision-supportsystem for exposure management. The paperseeks to fill the research gap.
OBJECTIVES AND HYPOTHESIS
The main objective of the paper is to propose ageneric foreign exchange exposure managementinformation system. In particular, the paper seeksto identify and evaluate the following, in respectof select Indian companies:
1. Foreign exchange risk management practices
2. Need for a management information system,where none exists
3. The existing management information systemand to determine the most important problemailing such a system, if any; and
04-Nidhi.p65 2/24/2009, 5:21 PM45

Nidhi Jain
46 NICE Journal of Business l Vol. 3 l Nos. 1 & 2 l 2008
4. Whether the exposure is formally calculatedby the management information system(transaction, translation, economic).
The paper also attempts to test the followingnull hypothesis:
H0: The size of a company has no associationin the exposure formally calculated by theCompany Information System.
It is hoped that on the basis of generalisationsdrawn, a generic management informationsystem can be developed.
RESEARCH METHODOLOGY
A questionnaire was sent by post to the FinanceDirectors of selected Indian companies, includedin the Prowess database. The companies selectedhad significant foreign involvement.
Significant foreign involvement is definedmathematically as:
(Exports +Imports)/Sales > 0.5
The questionnaire had four sections, viz.(i) profile of sample companies, (ii) foreignexchange risk exposure management practices ofIndian companies, (iii) nature of managementinformation system; and (iv) Indian practitioners’opinion on some theoreticians’ view.
Given the nature of the task-problem, anIndian multinational company is defined as ‘acompany which has subsidiaries abroad, but initself, it is not a subsidiary, of an overseascompany.
The Indian multinational companies studiedhad their subsidiaries in the USA, Mauritius,Thailand, China, the U.K., Central Asia, Cyprus,Malaysia, Nepal, Vietnam, Russia, and Europe.The SPSS package was used for analysis of thesurvey data. The choice of a tool is dependenton the objective of the enquiry and the datacollected. Finally, a case study is analysed inorder to have some understanding of a real-lifesituation.
SURVEY FINDINGS
Information System for Exposure Management
The first question in the series of questions on thissection related to the existence of an informationsystem in the company for the management offoreign exchange risk exposure. In this regard, theresponses of all the finance directors, and theresponses of Indian Multinationals, shows that avast majority of respondents answered in theaffirmative, viz., 76.9 per cent Majority of therespondents that answered in the negative werefrom Multinational Companies (as out of the totalnumber of respondents who said ‘no’ to thequestion 77.8 per cent were CFO’s ofmultinational companies).This question wasfollowed by another one to know whether thecompanies which did not have an informationsystem for the management of foreign exchangeexposure felt the need for one. Of the samplecompanies that fell in this category andresponded to the query, a large majority (75 percent) felt that they needed such a system. Only25 per cent of such companies expressed theopinion that they did not need an informationsystem for exposure management. A furtherenquiry into the response of Indian multinationalcompanies on the issue revealed that this questionwas responded by multinational companies only.The information in respect of the non -multinational companies, asked to respond to thequestion was missing.
The study also sought to find the state of theinformation system for management of foreignexchange risk exposure. By asking a series ofquestions to the companies which had such asystem in place, it was found that 96.7 per cent ofall the respondents felt their information systemwas cost-effective. Likewise, an overwhelmingmajority of the respondents, (viz., 89.7 per cent)said that their information system was regularlyreviewed to ensure its cost effectiveness and a vastmajority of all the respondents, (viz., 93.1 per cent)said that they had a formal system for calculationof foreign exchange exposure. The per cent ofmultinational companies that gave positive
04-Nidhi.p65 2/24/2009, 5:21 PM46

Developing Management Information System for Foreign Exchange Exposure
NICE Journal of Business l Vol. 3 l Nos. 1 & 2 l 2008 47
response to these questions were found to be 100per cent, 91.7 per cent, and 91.7 per cent,respectively. The companies that said that theyhad a formal system for calculation of foreignexchange exposure were further asked to indicatewhich type of exposure their company calculated.The enquiry revealed that a majority of companies(73.1 per cent) calculates the transaction exposureonly, followed by 19.2 per cent companies thatcalculate transaction and translation exposure.While, no company was found to be calculatingeconomic exposure, only a very small percentageof companies (7.7 per cent) calculated ‘translationexposure only’. The responses of Indianmultinational companies revealed similar picture.Surprisingly, the information system of one non-Multinational company was found to calculatetranslation exposure only while two non -multinational companies said that they calculatedtransaction as well as translation exposure.Further, the results revealed that majority ofcompanies that calculated both transaction andtranslation exposure were Indian multinationalcompanies, as out of total, 60 per cent suchcompanies were multinational companies.
Some Theoretical Propositions Explored
Proposition 1: “All hedging measures have a cost,whether easily discernible or not. The expectedcosts associated with internal measures may belower than external measures of hedging. Also,in the present global environment a variety ofinnovative tools are available for hedging foreignexchange risk. A new discipline called financialengineering has emerged that allows companiesto consider a variety of means of hedging and tocontrast and compare the consequences ofdifferent hedging vehicles”.
Given this, the study asked finance directorsto indicate, whether in choosing a particularhedging alternative, their information systemtook into account, the cost associated with thehedging alternatives. This query revealed that:One-fifth of the total relevant sample companiesinformation system did not take into account thecosts associated with hedging alternatives. None
of these companies was, however, a Multinationalcompany, as 100 per cent of the relevantMultinational companies, finance directorsopined that their information system took intoaccount, the cost associated with hedgingalternatives.
Proposition 2: “Determining regulatoryconstraints is important in foreign exchange riskexposure management. This would basicallyinclude the technical parameters within which thecompany and its affiliates operate and comprisethe exchange control, monetary and fiscalrestrictions imposed by each government. Someprincipal regulatory constraints to be consideredare: restrictions on leading, lagging, forwardcover restrictions, inflow-outflow matchingrestrictions, restrictions on currency of billing etc.If this information is not available, it results incorporate losses”. Given this piece of information,the finance directors were asked to indicate,whether their information system, includedinformation on constraints (if any), and on the useof hedging alternatives. The survey results in thisrespect revealed that: While majority ofrespondents (both multinational company andnon-multinational company) opined that theirinformation system took into account theconstraints, if any, on the use of hedgingtechniques; the percentage figures were muchhigher for Indian Multinational companies. In thisrespect, it is important to mention, that manyexchange controls, have been lifted by theGovernment, thereby reducing the constraints, onthe use of hedging techniques.
Proposition 3: “An organisations informationsystem for foreign exchange risk exposuremanagement may range from rudimentary tovery complex”. The study, accordinglyattempted, to identity the typical problem, ailinginformation systems that are present in Indiancompanies, for management of foreign exchangerisk exposure. A review of literature revealed thatthe information systems may suffer from:insufficient detail and forecasting; it maygenerate more information than that is neededfor good risk management in a single company
04-Nidhi.p65 2/24/2009, 5:21 PM47

Nidhi Jain
48 NICE Journal of Business l Vol. 3 l Nos. 1 & 2 l 2008
with resultant strain on personnel, inefficiencyin compilation and unnecessary expense [Prindl(1976)]. Accordingly, five problems wereenumerated in the questionnaire and therespondents were asked to rank these problemsfrom 1 to 5 where rank 1 stood for mostimportant problem and rank 5 stood for leastimportant problem. The survey result in thisregard for all sample companies reveals that themost important problem ailing the informationsystem for exposure management was that theinformation was not anticipatory. Themultinational companies response on problemailing their information system revealed thatmost important problem was information notanticipatory followed by information overloadand information not timely, in that order. Themean scores and standard deviation for the fiveproblems besetting the information system forcompanies and Indian multinational companiesare given in Table 2.
Since the most important problem is ranked1 and the least important one is ranked 5, theimportance attached by a company to the problemis in the ascending order of the mean scores. Themost important problem is the one with the lowestmean score.
Proposition 4: A few questions were asked tothe finance directors of multinational companieswho had a centralised set-up for foreign exchangerisk exposure management. One, they were askedto indicate whether a group exposure statementwas prepared (by the centralised treasury) on thereceipt of currency exposure schedules from allaround the world. The responses of financedirectors to this query are summarised in Table 3.
Proposition 5: Another question posed to thefinance directors of multi-national companieswith centralised treasury was whether thesubsidiary reports distinguish between: intra-company and third-party flows (distinctionrelevant for lead/lag decision), capital vs. tradingflows (distinction relevant because of exchangecontrol restriction, e.g., netting of financial withcommercial flows, etc.). Firm’s contractual andprobable flows (relevant for exposuremanagement purposes because of the exchangecontrols on, e.g., forward cover and foreigncurrency borrowing), and covered and uncoveredflows (relevant for exposure managementpurposes). The responses of the finance directorsto this query revealed that a majority ofmultinational company do distinguish betweenintra-company and third-party flow (relevant for
Table 2
Major Problems of the Information Systems Prevalent in Companies
(N=20)
S.No Problems of the All Co. Response (N=21) MNC Response (N=9)
Information System Mean S.D. Rank Mean S.D. Rank
1. Information not timely 2.67 1.46 II 3.22 1.64 III
2. Information not anticipatory 1.95 1.07 I 2.22 1.39 I
3. Information Overload 3.14 1.15 III 2.89 1.62 II
4. Information not oriented to decision-making 3.90 1.41 V 2.89 1.05 II
5. Inadequate Information 3.50* 1.15* IV* 3.78 1.20 IV
Table 3
Preparation of Group Exposure Statement
Is a group exposure statement prepared on receipt of ? Per cent of all Per cent of Indian MNC’scurrency exposure schedules from all subsidiaries MNC’s (N=13) (with centralized set-up) Response (N=7)
Yes 53.8 85.7
No 46.2 14.3
Total 100 100
04-Nidhi.p65 2/24/2009, 5:21 PM48

Developing Management Information System for Foreign Exchange Exposure
NICE Journal of Business l Vol. 3 l Nos. 1 & 2 l 2008 49
lead/lag decision). But, the majority ofmultinational companies were not found todistinguish between: probable vs. contractual(firm) flows (relevant for exposure managementpurposes because of the exchange controls on,among others, forward cover and foreigncurrency borrowing); and covered and uncoveredflows. However, 100 per cent of samplemultinational companies, distinguished betweentrading and capital flows (relevant for exposuremanagement decisions because of exchangecontrols, like restrictions on the netting offinancial with commercial flows and on theforward purchase or sale of foreign currency).
Hypothesis Testing
To ascertain if there is any association between thesize of a company and the exposure formallycalculated by the companies’ information system,the statistical tool of cross-tabulation and chi-square test for independence were used. Theaggregate results of cross tabulation revealed thatthe following: (i) Small companies calculatetransaction exposure only, (ii) amongst themedium companies, one-half calculate translationexposure only while another one-quartercalculate both translation and transactionexposure; (iii) Majority of large companies’information system formally calculatestransaction exposure only; and (iv) About one-fifth of the sample respondents calculate bothtranslation and transaction exposure .
Further, in order to test whether the type ofexposure formally calculated by the informationsystem is dependent on the size of the company,chi-square test of independence was conductedat the aggregate level. The null hypothesis wasthat the size of company and the exposureformally calculated by the companies’information system are independent. The resultsof the Pearson chi-square test of independence aresignificant at the 5 per cent level since p-value is0.012 < 0.05 (for N=26, df=4). Consequently, thenull hypothesis is rejected implying that companysize and type of exposure formally calculated bythe information system for exposure management
are not independent. To sum up, hypothesis-testing on the data suggests that company size hasbearing on the type of exposure formallycalculated by the information system.
Foreign Exchange Risk Exposure ManagementPractices: Findings
As it was intended to develop MIS for foreignexchange exposure management based ontheoretical research and survey findings, a surveyof Indian companies was attempted to find themost popular foreign exchange exposuremanagement objective, the attitude of majority ofpractitioners on risk management and the mostpopular hedging method, most popular hedgingtool, and the most important exposure. The surveyrevealed that a majority of companies in India hadfollowing stance: the companies approach toforeign exchange risk exposure management wasidentified; to minimise losses from fluctuations inexchange rates. But, in case of multinationals - toprofit from fluctuations in exchange rates; theirattitude to risk was found as to be risk averse, viz.,risk is unacceptable, take hedging action ;theirobjective was to reduce cash flow volatility; theirstance was ascertained as selective hedging;external hedging was most popular hedgingmethod in use and the most frequently usedhedging tool was found to be the forward contract;further, the most important exposure was foundto be the transaction exposure and the organisationstructure was such that an executive of the financedepartment was fond to have been entrusted withthe task of foreign exchange risk management.Moreover, the treasury was in most of the casesfound to be centralised.
Given the above survey findings and thesuggestions made in the relevant literature, viz.,separate MIS is needed for managing transactionexposure, translation exposure and economicexposure; MIS turns out hard copy, routine reports,summary reports drawn from the Company’stransaction processing system to support routinedecision-making; we take up on the task ofdeveloping a management information system, forhedging transaction exposure.
04-Nidhi.p65 2/24/2009, 5:21 PM49

Nidhi Jain
50 NICE Journal of Business l Vol. 3 l Nos. 1 & 2 l 2008
Developing MIS for Exposure Management
As is usual in any research exercise, conceptualframework was first attempted. There are certainmanagement information systems which areproposed in the literature.
Prindl (1976) provides an outline of reportsnecessary to analyse a company’s present andprojected exposure, to ascertain the potentialimpact on its financial statements and operationsand to determine the constraints imposed on itsresponse to that potential impact. It suggests thatthe exchange risks are measurable, if a logical andstructured information system is used. It outlinesreporting in export/import Company, reportingin company with consolidated subsidiaries,reporting for unconsolidated subsidiaries, reportsfor forecasting future positions. From thecombination of exposure identification reports,the group treasury should be able to depict: (i) thepresent balance sheet position, by currency of thegroup and each affiliate; (ii) the future balancesheet position by currency similarly, if morecrudely; (iii) a perception of economic exposure,again by currency, faced by the subsidiaries; thefuture income or dividend stream and theircurrency breakdown.
The summary position of the group from atranslation viewpoint can then be plotted bycurrency over several time periods. Prindl suggestsa model information system with a series ofinterlocking elements, like:(i) Basic translationexposure reports-detailed balance sheets, balancesheet forecasts, exchange exposure reports, reportson a cash-flow basis, hedging reports ;(ii) economicexposure elements-cash forecasts, and inventoryanalysis; (iii) ability to adjust inter-companyposition; (iv) basic constraints on positionadjustments; and (v) rolling report on exchangegains and losses. Further, it suggests that thetreasurer will wish to have a combination of reportsat the following frequencies: (i) Translation Data-present balance sheet by currency, monthly;present income statement, monthly; Exposurereports, including hedges, monthly. (ii) Forecastdata-future balance sheet projections, on a monthlyor quarterly rolling basis; coming year’s income
projections, at least by quarter. (iii) Liquidityforecast – cash budget by currency: 5 weeksforward; quarterly by month; annually by quarter;(iv) Reports to understand economic exposure,inventory analysis, etc.; and (v) Structuralconstraint reports; data bank on parametersupdated as change occurs; leading/lagging report,monthly or more frequently.
Buckley (1996) too presents a transactionexposure information system for a multinationalcompany. The reports here distinguish four keydata, viz., inter-company vs. third-party flows,capital vs. trading items, firm contractual vs.probable flows and finally, details of covered anduncovered flows. According to him, followingreports may be prepared: (i) an exposure forecast:prepared monthly (material changes can later beimmediately communicated by telex to the grouptreasury); (ii) Group exposure statement:prepared monthly (In this table currencies arecategorized according to whether a forwardmarket exists or not) according to membership ofjoint floats such as ERM currencies. Further, hesuggests that histogramming techniques may beused by group treasurer to decide what action totake once the company’s transaction exposure ona group basis has been identified.
Rathore (1996) prescribed a sample exposurereport, on the basis of IFAC’s Exposure Draft 3,on proposed International ManagementAccounting Practice on Foreign CurrencyExposure Risk Management. The report shouldcomprise, according to him, (i) an IncomeStatement Exposure Forecast, (ii) Balance SheetExposure Forecast, and (iii) transactional cash-flow exposure forecast. Even Bhalla (2000) hascategorised the exposure information system intotwo functional components. The exposureidentification system, which supplies informationon the accounting and/or cash flow exposuresgenerated by group companies and the exposuremanagement information system, which providesdetails of the decision parameters and constraintsto be considered in deciding what exposuremanagement action is required. According to him,a comprehensive exposure information system
04-Nidhi.p65 2/24/2009, 5:21 PM50

Developing Management Information System for Foreign Exchange Exposure
NICE Journal of Business l Vol. 3 l Nos. 1 & 2 l 2008 51
should include: (a) Balance Sheet ExposureForecast - long term; (b) Balance Sheet ExposureForecast - short term; (c) Quarterly IncomeStatement Exposure Forecast; (d) Group ExposureProjection; Exchange Rate Histogramming -individual forecast and summary forecast; and(e) Foreign Exchange Gain/Loss Projection
In the light of the above survey findings andthe literature reviewed, the task of developingMIS for foreign-exchange exposure managementappears to be meaningful. Further, a few in-depthinterviews were also conducted to facilitate thechief objective task. Some meetings were heldwith Indian practitioners and academicians to gettheir valuable inputs that would shape theexercise of developing an MIS for foreign-exchange risk exposure management. Thesemeetings/interviews revealed that this dauntingtask would be futile because an informationsystem for foreign exchange risk exposuremanagement has to be firm specific and it musttake into account the size of the company, itsconstituent units, and personnel strengths. It was,thus, found that both scholars and practitionersare of the view, that no single managementinformation systems will be universallyapplicable to every business. So, a generictransaction exposure information system cannotbe developed was the conclusion of the entirepresent work.
Given this understanding, then, a case studyapproach was used to develop a MIS for foreignexchange risk exposure management.
Case Study: Some Findings
A company from the public sector was selected.The company neither had a foreign exchange riskmanagement policy, nor had a managementinformation system for foreign exchangeexposure management and the process inprogress to lay down such a policy and developmanagement information system. Keeping trackof the developments in the area at the point oftime, the management information system asdeveloped for the company was studied.
An attempt was made to find out why certainsystems proposed in the literature have not beenimplemented in the company. It was felt thatcertain reports and formats suggested in theliterature for exposure management [Prindl(1976), Buckley (1976), Rathore (1996), Bhalla(2000)] cannot be applied to the public sectorcompany under study, for the reasons givenbelow:
1. The company is not a multinationalcompany
2. Receipts and payments cannot be clubbedtogether in case of the Company.
3. Financial Services Department is notfunctioning as a full-fledged treasuryalone. It has other responsibilities, viz.,management of surplus cash,development of suitable financial packagefor project finance, etc.
The development of an MIS for foreignexchange exposure management in this companywas guided by the recommendations made by theExpert Committee for Formulating CurrencyExposure-Related Risk of Public-SectorEnterprises, set up on January 13, 1998.
On the development of the MIS for foreignexchange risk exposure management, the studyconcluded that the reports/computer formatsused by the company were quite distinct fromthose suggested in the existing literature [See, forexample, Bhalla (2000), Buckley (1998), Prindl(1976)]. This is because the company has adoptedbenchmark hedge ratio-based approach formanagement of currency risk and that meant asignificant change vis-à-vis the existing practiceand procedure. This approach had beenrecommended by the Expert Committee forFormulating Approach to Management ofForeign Currency Exposure-Related Risks ofPSE’s. The Committee recommended twobenchmark hedge ratios for currency riskexposure, viz., US $ – Rupee Benchmark HedgeRatio (DRBHR) and Cross Currency BenchmarkHedge Ratio (CCBHR)
04-Nidhi.p65 2/24/2009, 5:21 PM51

Nidhi Jain
52 NICE Journal of Business l Vol. 3 l Nos. 1 & 2 l 2008
The findings of the study by Yadav and Jain(2004) on international operations of public-sectorcompanies are also noteworthy in this context.The major findings of this study include Public-sector companies are not using internaltechniques of exchange-risk management in anysignificant manner ; exchange risk managementbeing done by internal teams as well as with thehelp of institutional consultants ; imports causingmost significant exchange risk in public sectorcompanies. Further, the study revealed thatamongst the basic hedging strategies (against thedepreciation of local currency that samplecompanies used (in order of importance) are:
1. Borrowing locally;
2. Invoicing exports in foreign currency andimports in local currency; and
3. Selling local currency forward.
CONCLUSION
In certain respects, Indian companies are radicallydifferent from their U.K and U.S counterparts; insome other respects their stances are the same.
The paper is a modest attempt in the directionof disseminating practices of some companiesbelonging to the sectors as diverse as IT, steel,chemicals, and marine. Just like any otherresearch effort, the work is subject to certainlimitations. The study is intended as a priori study,as a means to an end. To conclude, the need of thehour is to develop a structured decision-supportsystem that can respond to changes in theregulatory landscape, changes in tax laws, andchanges in financial and business risks, withfurther innovations in derivatives and financialengineering. This task, though complex anddaunting, is nonetheless achievable, given theright mindset and the necessary pool of talent.
REFERENCES
Bhalla, V.K. (2000), International Financial Management Textand Cases (New Delhi: Anmol Publications).
Bradley, K. (1996), “The Strategic Management of Foreign-exchange Exposure: An Empirical Study”, Centre forFinancial Markets Research Management School, WorkingPaper 96.14 (December).
Chowdhry, B. (1995), “Corporate Hedging of Exchange RateRisk when Foreign Currency Cash-flow is Uncertain”,Management Science , Vol. 41, No. 3, pp. 1083-1090.
Collier, P., E.W. Davis, J.B. Coates, and S.G. Longden (1999),“The Management of Currency Risk: Case Studies ofUS and UK Multinationals”, Accounting and BusinessResearch, Vol. 20, No. 6, (Summer).
Deana, R. Nance, Clifford W. Smith, Jr., and Charles W.Smithson (1993), “On the Determinants of CorporateHedging”, The Journal Of Finance, Vol. 48, No. 1,pp. 267-284.
Gregory W. Brown (2001), “Managing Foreign-exchangeRisk with Derivatives”, Journal of Financial Economics,Vol. 60, pp. 401-448.
Jain, Nidhi (2007), Foreign Exchange Risk Management (NewDelhi: New Century Publications).
McRae, T., and D. Walker (1980), Foreign ExchangeManagement, Prentice-Hall.
Phillippe, Jorion (1990), “The Exchange-Rate Exposure ofU.S. Multinationals”, Journal of Business, Vol. 63, No. 3,pp. 143-157.
Prindl, A.R. (1976), Foreign Exchange Risk , John Wiley andSons.
Shehzad, L. Mian (1996), “Evidence on Corporate HedgingPolicy”, Journal of Financial and Quantitative Analysis ,Vol. 31, No. 3 (September).
Steil, B. (1993), “Corporate Foreign Exchange RiskManagement: A Study in Decision-making underUncertainty”, Journal of Behavioral Decision Making,Vol. 6, No. 2, pp. 1-31.
Verrier, Mike (1985), “Is Foreign Exchange Risk DamagingYour Health”?, Reading in currency Hedging Strategies,edited by Gillespie I., A Eurostudy Special Report ,Eurostudy Publishing Company Limited.
Yadav, S.S., and P.K. Jain (2004), “Risks in InternationalTransactions: A Survey of Management Practices inPublic-sector Enterprises in India”, Need the Dough?,Vol. 7 (June), No. 1, pp. 44-55.
04-Nidhi.p65 2/24/2009, 5:21 PM52

JOB PERFORMANCE AND OCCUPATIONAL STRESSA Study of Bank Managers in Haryana
Nirmala Chaudhary*
Abstract
Several studies have been conducted on job satisfaction, job performance and related topics but hardlyanyone has ascertained the relationship between occupational stress and job-performance. The presentstudy attempts to identify the critical occupational factors that trigger job-related stress and are responsiblefor deterioration in job performance. The respondents were the bank managers of selected nationalisedbanks of Haryana. The respondents were surveyed through tested and standardised questionnaires forthe purpose of data collection. The study has revealed that there is a significant negative correlationbetween the major sources of occupational stress and job performance. Among the demographic variables,only income has shown positive and significant correlation with job performance. The relationship ofother occupational and demographic variables was in expected direction, though not significant enough.The policy implications of the findings for the management are also attempted.
Key Words: Job Performance, Occupational Stress, Neustress, Distress and Eustress
INTRODUCTION
IT is necessary to keep the employee underminimum stress. The lesser the stress, the moreis the productivity. So, occupational stress has
occupied a place of importance in everyorganisation as we are moving towards thetwenty-first century. With the advancement intechnology, mushrooming trend of privatisation,the government’s liberalisation policy, thecompetition in industrial sector has immenselyincreased. As a result, stress has increasedenormously. It is not so that stress is onlyincreased in private sectors; it has also increasedin public organisations, however, indirectly.
Accepting stress as an inevitable part ofeveryday life, excessive and persistent stress isharmful. An optimum amount of arousal isaccompanied by increased efforts in a morefocused direction. Since stress accelerates arousal,a little amount of stress may help the individualfor adaptation to the changing environmentaldemands (Selye, 1936). Stress at the optimumlevel has a functional value and motivationalsource for the employees.
Although too much stress is obviouslyundesirable, total absence of stress can also leadto unexpected problems. For example, too littlestress may result in boredom and apathy, and be
* Dr. Nirmala Chaudhary is Reader in University School of Management, Kurukshetra University. Kurukshetra; e-mail: [email protected]
05-Nirmala.p65 2/24/2009, 5:23 PM53

Nirmala Chaudhary
54 NICE Journal of Business l Vol. 3 l Nos. 1 & 2 l 2008
accompanied by low performance. Although toomuch stress can cause tension, stress, and low jobperformance, an optimal level of stress results inhigh energy, motivation, and high performance.
Just as stress accumulates in our bodies, stressaccumulates in organisations, also. At higherlevels, it destroys organisational climate, lowersorganisational performance and weakensorganisational effectiveness. The impact of stresson organisational performance is no lessdramatic. Many executives feel that they couldmake better decisions and perform moreeffectively if they work under less stress.
When there is no stress, job challenges areabsent and performance tends to be low. Asstress increases, performance tends to increase,because stress helps a person call up resourcesto meet job requirements. Stress is a healthystimulus that encourages an employee torespond to challenges. Eventually stress reachesa plateau that corresponds approximately witha person’s day to day performance capability. Atthis point additional stress tends to produce nomore improvement. Finally, if stress becomes toogreat, performance begins to decline, becausestress interferes with job performance and theperson becomes unable to make decisions anderratic in behaviour. If stress increase to abreaking point, performance becomes zero; theemployee has a break down, becomes too ill towork, is fired, quits or refuses to come to workor to face the stress.
CONCEPTUAL FRAMEWORK
Job Performance
Job performance can be defined as defining intwo parts ‘job’ and ‘performance’. While ‘job’ isa collection of individual tasks that a workerperforms, ‘performance’ refers to employee’smanifest behaviour at work. Thus, ‘jobperformance’ is the degree to which anindividual executes his or her role with referenceto certain specified standards set by theorganisation (Nayyer, 1994). Performance (or
outcome or productivity) is a consequence of aset of some factors, such as, employees’attributes which include aptitude, ability,training, experience and psychological make-up,his or her inclination, the organisational supportsystem, and occupational stress. These variableswhen combined multiplicatively determine theperformance outcomes. So performance is notonly a function of the environment itself but alsoof the interaction of the individual with his orher environment.
Occupational Stress
Stress is derived from the Latin word ‘stringere’,which means – to draw tight, and was used in the17th century to describe hardships or afflictions.The term ‘occupational stress’ refers to both to theemployee’s strain or reactions to the workenvironment and to job stressors or elements ofenvironment itself. In psychology, ‘stress’ refersto a state of the organism, which results from itsinteraction with the environment. Coffer andAppley (1964) viewed stress as a state of theorganism where he perceives his well-beingendangered and that he must direct all hisenergies to its protection. Wolff (1968) considersstress as a dynamic state within the organism inresponse to a demand for adaptation. Thesedemands may be higher or lower than theresources at hand. However, adaptation to stressdepends upon the nature and magnitude of thestressor, type of the strategy adopted, or theindividual’s perception of the threat elementposed by the stressor.
Nuestress, Distress and Eustress
The process of stress was for the first timediscussed in scientific terms by Hans Selye (1936),where he talked about three types of stress.
Nuestress: Where the stress response isnecessary for day-to-day adaptability of theindividual to his environment.
Distress: Where the stress response isunfavorable and potentially disease-producing.
05-Nirmala.p65 2/24/2009, 5:23 PM54

Job Performance and Occupational Stress
NICE Journal of Business l Vol. 3 l Nos. 1 & 2 l 2008 55
Eustress: Where the stress response isfavourable and the individual experiencespleasant feeling. Eustress has a Greek prefix of ‘eu’which means good; the positive stress is relatedto psychological well-being and high jobperformance (Pamperin, 1983; Mathew, 1985).
REVIEW OF THE LITERATURE
Productivity, efficiency, and performance havebeen the concerns of all practitioners, policy-makers and researchers. It has amply beendemonstrated that individuals feeling moderatelevel of occupational stress are more productive,better motivated, and more satisfied than theemployees who work under little or more stress.Major studies on the subject are reviewed in thefollowing paragraphs. Anxiety, irritation,depression and annoyance in combination withunpleasant emotional experience of work areconsidered occupational stress. Unchallenging andmonotonous tasks produce stress (Gardell, 1976).
A number of studies (see, for example, Vroom,1964, Harigopal, 1979; Singh, Agarwal andMalhan, 1981; and Hossain, 1997) indicated thatincreased tense state of mind adversely affects thework efficiency. Moreover, occupational stress isone of the important predictors of jobperformance.
Srivastva (1983) attempted to explore thestress relationship between performance,considering the latter as a determinant of theformer, rather than vice versa. The studyhypothesised that employees with highproductivity would perceive and experience mildrole stress as compared to those with lowproduction capacity. The study was conducted onworkers with equal number of high (N=30) andlow producers (N=30). Role stresses weremeasured by administering the occupationalstress scale (Srivastva and Singh, 1981), whereasproductivity was assessed on the basis of officialproduction record and ‘hours saved’ by anemployee in completing the assigned task over aperiod of six months. The findings of the studyrevealed that the employees who maintained
constantly a high production level experiencedless role stress as compared to the employees withlow production capacity.
Jobs having less impact and less involvementalso produce stress. Those who reported greaterparticipation in decision making perform theirjobs efficiently (French and Caplan, 1972)
Muhammad (1985) studied the relationshipbetween performance and job stress. He obtainedfour types of relationship between performanceand job stress. These relationships are: curvilinear‘U’ shaped, negative linear, positive linear, and norelationship. The analysis supported that therewas prevalence of a negative linear relationshipbetween job stress and supervisory ratings of theperformance.
Glaser, et al. (1991) conducted a worksimulation to test the effects of workload on stressand performance. Social support was alsoinvestigated as a moderate variable. Twohypotheses were tested: (i) Stress is an interveningvariable between workload and performance, and(ii) Social support moderates the work load stressrelations such that workload leads to lower stresswhen social support is high. The subjects were 19to 52 years old temporary employees. For the firsthypothesis, a path analysis showed an indirectrelation between workload and performance,with stress as an intervening variable. For thesecond hypothesis, there was a significant 3-wayinteraction between workload, social support,and time. The interaction showed that, in the earlystages of the experiment, high social support ledto higher (rather than lower) stress. This “reversebuffering effect” does not occur during laterstages of experiment. One practical implicationof this study is that managers may need to takeinto consideration the employee’s workloadwhile developing performance goals.
Schuster, et al. (1997) studied the managementpractice, organisational climate and performance.The study used a single time-series quasi-experimental design to measure the effect of aseven-step intervention strategy on thedependent variable of operating income. It is
05-Nirmala.p65 2/24/2009, 5:23 PM55

Nirmala Chaudhary
56 NICE Journal of Business l Vol. 3 l Nos. 1 & 2 l 2008
evident that in some instances, organisationperformance can be significantly enhancedthrough the participation and contribution ofemployee in problem-solving and decision-making process. The findings of the studyrevealed that 75 per cent of the variation infinancial performance was due to changes in theconditions of the human organisation.
Wright and Bonett (1997) observed thatburnout is related to a decline in workperformance. They studied the relationshipamong three dimensions of burnout and workperformance. They concluded that there is anegative relationship between the dimensions ofburnout, emotional-exhaustion, and subsequentwork performance.
Hoque (1998) sought to assess theinterrelationships between work performance andsome variables. The sample consisted of 200production workers of two textile mills inBangladesh. The data concerning the performanceof each worker were collected from the assistantmanager (production) of each mill. The assistantmanager (production) was requested to provideactual production records of the sample of workerson the basis of their last three months records ofproduction. Results indicated that all but two ofthe variables selected are significantly correlatedwith performance and are relevant for explainingvarious in the level of performance. Motivationand performance have the highest correlation(0.48). Performance has significant positivecorrelation with both perceived degree ofemployee-oriented supervision (0.39). The twovariables, which are not significantly related toemployee performance, are: (1) Production-oriented supervision, and (2) group cohesivenessof the workers.
Tuber, et al. (2000) conducted a meta-analysisof correlations between role ambiguity and jobperformance, and between role conflict and jobperformance. The study revealed a negativerelationship between role ambiguity and jobperformance and the influences due to job typeand rating source. A negligible relationship was
observed for the role conflict and the jobperformance.
OBJECTIVES OF THE STUDY
The major objectives of the study are four, namely:
1. To ascertain the relationship between jobperformance and occupational stress ofmanagers of nationalised banks,
2. To examine the relationship among psycho-demographic variables, occupational stressand job performance of managers of selectednationalised banks.
3. To find out the predictive value of varioussources of occupational stress for jobperformance of managers of selectednationalised banks.
4. To suggest some specific workable measuresfor improvement of job performance and tocontrol occupational stress in nationalisedbanks.
HYPOTHESES
On the basis of the objectives of the study and theliterature available on the subject, the followingthree null hypotheses were formulated.
H01: There is no correlation between jobperformance and measures ofoccupational stress of bank officials.
H02: There is no relationship among jobperformance, occupational stress anddemographic measures of bank officials.
H03: Various dimensions of occupationalstress together do not account for thevariance in job performance of bankofficials.
RESEARCH METHODOLOGY
Population Framework and QuestionnairesUsed.
For the study, a fragment random sample of 175bank officers (Scale I, II, III, and IV) was drawn
05-Nirmala.p65 2/24/2009, 5:23 PM56

Job Performance and Occupational Stress
NICE Journal of Business l Vol. 3 l Nos. 1 & 2 l 2008 57
from the selected nationalised banks in the stateof Haryana. In order to have a fair assessment ofjob performance and occupational stress, thestandardised tests were used, to arrive at fairassessment of the variables included in the study.The data were collected by administering the twostandardised measures. The Job PerformanceRating Scale (JPRS) developed by Singh andPestonjee (1988) and the Occupational StressIndex (OSI) prepared by Srivastava and Singh(1981) were used to collect the data for the study.There were 14 parameters of job performanceincluded in the scale to measure job performance.
Reliability Check of the Scales Used
The reported Cronbach’s alpha coefficient of theJPRS is 0.99, which indicates high-level reliabilityof the scale. The Occupational Stress Indexincludes 46 items, which measures occupationalstress. The odd-even method was used tocompute split-half reliability, which was found tobe 0.94, which indicates high level of reliabilityof the scale.
Data Analysis Techniques
In order to achieve the main objectives of thestudy, the data were processed for thecomputation of mean, product-momentcorrelation, and multiple regression correlation.
MAJOR FINDINGS
Independent Correlation of Each Variablewith Job Performance
The major objective of the present study was toinvestigate the relationship of job performanceand occupational stress. The inter-correlationsamong the scores of total 18 variables, including12 variables of occupational stress, along with onevariable of total occupational stress, 4demographic variables, and job performance,were computed by applying Pearson’s ProductMoment method of correlation. These correlationswere computed for 175 bank officers.
The inter-correlation matrix for officers ispresented in Table l. It may be noted that thedegrees of freedom being 173, correlation co-efficient of 0.143 and 0.194, are significant at 0.05and 0.1 level, respectively. The table also revealsthe inter-correlations among the 16 measures ofoccupational stress and one measure of totaloccupational stress of officers. A careful inspectionof the table reveals that the inter correlationsamong 16 variables of occupational stress and onevariable of job performance range from -0.002 to-0.234. Out of total 16 inter-correlations, only 3 aresignificant at 0.05 level, and 3 at the 0.01 level.Moreover, all the significant correlations arenegative except 1. The highest correlation is -0.234(P<0.01) between job performance and poor peerrelations; whereas the lowest correlation is -0.002(P> 0.05), between job performance and strenuousworking conditions. Job performance correlatestotal income 0.177 (P < 0.05) with role overload -0.194 (P <0.01), role ambiguity -0.218 (P <0.01)with role conflict -0.153 (P< 0.05), and intrinsic
Table 1
Correlation between Job Performance andOccupational Stress of Bank Managers
Sr. Dimensions of Correlations withNo. Occupational Stress job performance
1. Age 0.107
2. Job experience 0.124
3. Number of dependents -0.013
4. Total Income 0.177*
5. Role overload -0.194**
6. Role ambiguity -0.218**
7. Role conflict -0.153*
8. Group and political pressure -0.098
9. Responsibility for persons 0.127
10. Under participation -0.104
11. Power lessons -0.034
12. Poor peer relations -0.234**
13. Intrinsic impoverishment -0.170*
14. Low status -0.019
15. Strenuous working conditions -0.002
16. Unprofitability -0.091
Total occupational stress -0.197**
Note: **significant at 0.01 level = 0.194
*Significant at 0.05 level = 0.143
05-Nirmala.p65 2/24/2009, 5:23 PM57

Nirmala Chaudhary
58 NICE Journal of Business l Vol. 3 l Nos. 1 & 2 l 2008
impoverishment -0.170 (P <0.05) with overalloccupational stress -0.197 (P< 0.01). Thus, thesignificant negative relationship between themeasure of job performance and six measures ofoccupational stress, namely, role overload, roleambiguity, role conflict, poor peer relations,intrinsic impoverishment, and overalloccupational stress, suggest that under highstressful conditions, performance of officerswould decrease.
Among demographic variables, the highestcorrelation is (0.177) between job performanceand total income. This suggests that higher thetotal income better will be the job performance.The value of inter-correlations between jobperformance and other three demographicvariables (age, job experience and the number ofdependents) are too short to qualify even the 0.05level of significance. This suggests that thesevariables have nothing to do with the jobperformance of officers.
However, the very low level of inter-correlations between job performance and somemeasures of occupational stress, namely, groupand political pressure, responsibility for persons,under participation, powerlessness, low status,strenuous working conditions and unprofitability,suggest that these measures of occupational stresshave nothing to do with job performance and arefunctionally independent for officers .
Joint Contribution of Predictors in JobPerformance
The second major objective of the study was toinvestigate the predictive value of various sourcesof occupational stress for job performance. Forhaving information about the joint contributionof the 16 predictors (age, experience, number ofdependents, total income, role overload, roleambiguity, role conflict, group and politicalpressures, responsibility for persons, under-participation, powerlessness, poor peer relations,intrinsic impoverishment, low status, strenuousworking conditions, and unprofitability, indetermining job performance of officers, multiple
regression equation, and multiple R were applied.The solution for multiple regressions was carriedout by the SPSS (1996 version).
Dependent measure (Job performance) M = 33.85
Table 2
Parameters/Coefficients in Multiple Regressions ofManagers
(N=175)
Sr. Predictors Regression MeanNo. Coefficients
1. Age 0.147 43.22
2. Job experience 0.072 20.49
3. Number of dependents 0.225 3.17
4. Total Income 0.206 15.12
5. Role overload -0.230 18.92
6. Role ambiguity -0.290 9.20
7. Role conflict -0.044 12.06
8. Group and political pressure -0.005 10.56
9. Responsibility for persons 0.252 9.85
10. Under participation -0.148 11.09
11. Powerlessness -0.144 9.36
12. Poor peer relations -0.578 9.62
13. Intrinsic impoverishment -0.082 10.31
14. Low status -0.259 6.89
15. Strenuous working conditions -0.338 10.34
16. Unprofitability -0.171 5.09
Multiple R = 0.45 R2 = 0.20
SEest = 4.55 df = 17 and 157 F = 2.33
Table 2 presents the values of regression co-efficients, means, R2 and F ratio, of the officers. Ageneral equation of multiple regression thatinvolves all the 16 predictors (X l to X16) and onedependent measure (Y l) can be stated as under:
Y1 = a + blXl + b2X2 +………………. +b16X16
To complete the regression equation, the valueof constant, a, may be computed by using thegeneral formula:
a = Y1- b1X1 - b2X2——————b16X16
By substituting the value of the regression co-efficients of all the 16 predictors, the regressionequation reads:
05-Nirmala.p65 2/24/2009, 5:23 PM58

Job Performance and Occupational Stress
NICE Journal of Business l Vol. 3 l Nos. 1 & 2 l 2008 59
Y1=a+ (.147Xl) + (.072X2) + (.225X3) + (.206X4)+ (-.230X5) + (-.290X6) + (-.044X7) + (-O.005X8) +(.252X9) + (-148X10) + (-.I44X11) + (-.578X12) +(-O.82X13) + (-.259X14)+ (.338X15)+ (-171XI6)
By inserting the value given in the table, it isfound:
33.85-(.147 x 43.22) - (.072 x 20.49) - (.225 x 3.17)-(.206 x 15.12)-(-.230x18.92) - (-.290 x 9.20) - (-.044x 12.06) -(-0.005 x 10.56) - (.252 x 9.85) - (-.148 x11.9)-(-.144 x 9.36) -(-.578 x 9.62) - (-0.32 x 10.31) -(-.259 x 6.89) - (.338 x 10.34) -(-.171 x 5.09) = 18.63.
The complete regression equation, then,reads:
Y1=18.63 (.147X I) + (.072 X2) + (.225 X3) +(.206X4; + (¬.230X5) + (-.290X6) + (-.044X7) +(0.005X8) + (.252X9) + (-148X10) + (-.144X11) +(.578XI2) + (-.082X13) + (-.259 X14) + (.338 X15)+(.171XI6)
The regression equation in the score formindicates that for every unit increase in the age,the job performance (y 1) increases by 0.147units. Similarly, for every unit increase in thejob experience, it increases by 0.072; for thenumber of dependents, it increases by 0.225;for total income it increases by 0.206. Here, theaged, job experience, number of dependents,and the total income arrived as post timepredictors of job performance. For every unitincrease for role overload, it decreases by0.230; for role ambiguity, it decreases by 0.290;for role conflict, it decreases by 0.044; forresponsibility for persons it increases by 0.252;for under-participation, it decreases by 0.148;for powerlessness, it decreases by 0.144; forpoor peer relations, it decreases by 0.578; forintrinsic impoverishment, it decreases by0.082; for low status, it decreases by 0.259; forstrenuous working conditions, it decreases by0.338; and for unprofitability, it decreases by0.171. It may be noted that the predictors , i.e.,job experience, role conflict, group andpolitical pressure and intrinsicimpoverishment, contribute very little inpredicting job performance of officers. ‘Thestandard error of estimate equals to 4.55n’
suggests that the predicted scores may deviatefrom the actual one, with the divergence of4.55.
The multiple correlations between thepredictors and dependent measure is 0.45. Theobtained F ratio for the significance of multipleR equals to 2.33. The degree of freedom being 17and 157, the F is significant beyond the 0.05significance level. The findings indicate that thetotal 16 measures of occupational stress jointlypredict the variance in job performancesignificantly. The square of multiple R (R2) being0.20, suggest that all the 16 predictors jointlyaccount for 20 per cent of the total variance inthe job performance of officers. The I-R2, alsoknown as co-efficient of non-determination,equals to 0.80 suggests that 80 per cent of thevariance in job performance is accounted by thevariance in other variables not included in thepresent study.
INTERPRETATION OF THE RESULTS
The study shows that the relationship between ‘jobperformances’ and overall ‘occupational stress’ issignificant and negative in the case of bank officers.It is further reported that six dimensions, out of thesixteen, are significantly related to job performanceof the officers. Role overload, role ambiguity, roleconflict, poor peer relations and intrinsicimpoverishment, and the over-all occupationalstress are all significant but negatively related tojob performance. These findings are consistentwith earlier researches. The correlation between jobperformance and total income is significantlypositive among the officers. It is found that theperceived degree of pay inequity has significantnegative correlation with job performance ofworkers. This suggests that the higher the degreeof inequity as perceived by the employeesregressing their pay, the lower will be the jobperformance. The result is in line with the equitytheory predictions (Adams, 1963). Habibullah,(1980) reported that productivity was significantlycorrelated with the workers’ satisfaction with theirpay. Anand and Sohal (1981) had concluded in theirstudy that pay scale was correlated significantly
05-Nirmala.p65 2/24/2009, 5:23 PM59

Nirmala Chaudhary
60 NICE Journal of Business l Vol. 3 l Nos. 1 & 2 l 2008
with the teachers’ publication performance.Similar results were obtained by Andrew (1967),Evans and Simon (1969), and Harder (1991).
In his ‘person-environment-fit’ research,Harrison (1978) indicated that too much ‘roleambiguity’ relating to the employee’s preferredlevel was associated with depression, tension,anger and irritation. ‘Role conflict’ causescognitive strain, i.e., the person involved finds itdifficult to locate himself because of theconflicting cues from his environment as hislocation. It seems that the subjects included in thepresent study tend to perceive a greater amountof role conflict due to their middle position. Kahnand Quinn (1970) and Miles (1976) had reportedthat the role conflict was likely to exist among theemployees who work at the boundaries betweenthe organisations.
Labovitz and Orth (1972) found that intra-group conflicts or poor peer relations lead tooccupational stress. The positive correlationbetween occupational stress and ‘intrinsicimpoverishment’ may be explained in the waythat an employee perceives less opportunity toutilise his abilities and experience, and this leadsto a negative feeling towards the job.
Multiple regression analysis and multiplecorrelations show that various sources ofoccupational stress jointly account for thevariation in job performance significantly. Thecoefficient of multiple determinations of officerscomes to be 0.20, which suggests that 20 per centof the variance in job performance is accountedfor these predicting variables.
CONCLUSION
There is a significant negative relationshipbetween job performance and occupationalstress of bank managers. The role overload, roleambiguity, role conf1ict, poor peer relations, andintrinsic impoverishment are the majorpredictors of occupational stress and have anegative and significant correlation with the jobperformance of the managers. Demographic
measures have very little relationship with thejob performance of the officers. The predictivevalue is 20 per cent for the managers. It meansthat all the above-mentioned variables accountfor 20 per cent of the variance for jobperformance of the officers.
Managerial Implications of the Findings
To enable the organisation make the best use oftheir officials and to attain a higher level ofperformance for successfully achieving theirpurposes and objectives, it is imperative thatinherent preferences for clarity, certainty, goodfeeling of peer relations, and perfection, areallowed to subjugate the inherent nature ofhuman relationship involving ambiguity,uncertainty, imperfection and much occupationalstress.
The foremost amongst the implication of thestudy is that it should help to reduce or toeliminate the occupational stress so that thehuman resources can be utilised effectively.
We suggest four major strategies for dealingwith life stress: (1) Personal management skills,which are self-regulation skills for organising thetime and energy expenditure, (2) Relationshipskills, which are ‘scene changing’ skills foraltering the environment and interacting with it,(3) Outlook skills are the ‘change your mind’ skillsfor controlling attitudes and perceptions, and(4) Stamina and body building skills, whichstrengthen resistance and relieve tension. Skillsfrom any or all of these groups can be a potentialcomponent of an individualised plan forpromoting vitality and preventing burnout. Thefinal choice of the coping styles, which anindividual has at his disposal, may be categorisedinto: (1) Drug or medication methods, i.e., usingdrugs under medical supervision, (2) Non-drugor meditation methods. The non-drug methodsof coping are more advantageous and safer. Theseare often referred to as bio-feedback techniques,acupuncture, yoga, meditation, physical exercise,etc.
05-Nirmala.p65 2/24/2009, 5:23 PM60

Job Performance and Occupational Stress
NICE Journal of Business l Vol. 3 l Nos. 1 & 2 l 2008 61
REFERENCES
Adams, J.S. (1963), “Toward an Understanding ofInequity”, Journal of Abnormal and Social Psychology ,Vol. 67, pp. 442-456.
Anand, U., and T.S. Sohal (1981), “Relationship betweenSome Personal Traits, Job Satisfaction and JobPerformance of Employees”, Indian Journal of AppliedPsychology, Vol. 18, No. 1, pp. 11-15.
Andrew, I.R. (1967), “Wages inequity and Job Performance:An Experimental Study”, Journal of Applied Psychology ,Vol. 51, pp. 39-45.
Coffer, C.N., and Appley (1964), Motivation: Theory andResearch (New York: Wiley).
Evans, W.M., and R.G. Simons (1969), “OrganisationalEffects of Inequitable Rewards: Two Experiments inStatus Inconsistence”, Administrative Science Quarterly,Vol. 14, pp. 224-237.
French, J.R.P., Jr., and R.D. Caplan (1972), OrganisationalStress and Individual Strain, in A.J. Marrow (ed.), TheFailure of Success (New York: AMACOM).
Gardell (1976), “The Identification of Traits Related toManagerial Success”, Journal of Applied Psychology,Vol. 46, No. 6, pp. 428-432.
Glaser, Dale N., Charles B. Tatum, and Delbert M. Nebeker(1991), “Work Load and Social Support: Effects onPerformance and Stress”, Human Performance , Vol. 12,No. 2, pp. 155-176.
Habibullah, M. (1980), Employee-Centered Supervision andProductivity in the Jute Industry (Dhaka: Bureau ofBusiness Research, University of Dhaka).
Harder, K. (1991), “Role Theory versus Expectancy Theory:The Case of Major League Base Able Free Agents”,Journal of Applied Psychology , Vol. 76, pp. 458-464.
Harigopal, K. (1979), “Role Stress Variables and CompanySatisfaction and Job Involvement: Personality Factorsas Moderators”, Managerial Psychology , Vol. 10, No. 2,p. 25.
Harrison, R.V. (1978), “Person-environment Fit and JobStress”, in C.L. Cooper and R. Payne (eds.), Stress atWork (New York: Wiley).
Hossain, M.M. (1997), “Some Correlates of Performance inManufacturing Industries”, Journal of BehaviouralSciences, Vol. 8, pp. 35-41.
Hoque, M.E. (1988), “Some Correlates of Work Performanceas Perceived by Industrial Workers of Bangladesh,Indian Journal of Industrial Relations , Vol. 34, No. 2,pp. 213-222.
Kahn, R.L., H.D. Wolfe, R.P. Quinn, D.J. Snoek, and K.R.Rosenthal (1964), Organisational Stress: Studies in RoleConflict and Role Ambiguity (New York: Wiley).
Kahn, R.L., H.D. Wolfe, and R.P. Quinn (1970), “Role Stress:A Framework for Analysis”, in A. McLean (eds.),Mental Health and Work Organisations (Chicago: RandMcNally).
Labovitz, G.H., and C.D. Orth, (1972), “Work Conditionsand Personality Characteristics Affecting JobSatisfaction of Student in Terms of ExtendedHealthcare Facilities”, Journal of Applied Psychology ,Vol. 56, No. 5, pp. 434-435.
Mathews, K.A. (1985), “Psychological Perspectives on theType-A Behaviour Pattern”, Psychological Bulletin ,Vol. 91, pp. 293-323.
Miles, R.H., and W.D. Perrault (1976), “Organisational RoleConflict: Its Antecedents and Consequences”,Organisational Behaviour and Human Performance ,Vol. 17, pp. 19-44.
Muhammad, J. (1985), “Relationship of Job Stress to JobPerformance: A Study of Manager”, Human Relations,Vol. 38, No. 5, pp. 409-424.
Nayyer, M.R. (1994), “Some Correlates of WorkPerformance Perceived by First Line Supervisors: AStudy. Management and Labour Studies , Vol. 19, No. 1,pp. 50-54.
Schuster, F.E., K.E. Dunning, D.L. Morden, M.C. Hagan, T.E.Baker, and I.S. Mckay (1997), “Management Practice,Organisation Climate, and Performance”, Journal ofApplied Behavioural Science , Vol. 33, No. 2, pp. 209-226.
Selye, H. (1936), The Stress of Life (New York: McGraw-Hill).
Singh, A.P., and D.M. Pestonjee (1981, 1988), “PerformanceRating Scale,” in Pestonjee’s Handbook of Psychologicaland Social Instrument (1993), pp. 275-276 (New Delhi:Concept Publishing Company).
Singh, B., V.N. Agarwal, and N.K. Malhan (1981), “TheNature of Managerial Role Conflict”, Indian Journal ofIndustrial Relations, Vol. 17, pp. 1-26.
Srivastva, A.K., and A.P. Singh (1981), “Construction andStandardization of an Occupational Stress Index: APilot Study”, Indian Journal Clinical Psychology , Vol. 8,pp. 133-136.
Srivastva, P.K., and M.M. Sinha (1983), “OccupationalLevels and Job Satisfaction”, Journal of PsychologicalResearchers, Vol. 20, No. 2, pp. 56-59.
Tuber, Travis C., and J.M. Collins (2000), “A Study ofOrganisational Stress and Job Performance”, Journal ofManagement, Vol. 26, No. 1, pp. 155-169.
Vroom, V.H. (1964), Work and Motivation (New York: Wiley).
Wright, Thomes A., and Douglas G. Bonett (1997), “TheContribution of Burnout to Work Performance”,Journal of Organisational Behaviour , Vol. 18, No. 5,pp. 491-499.
05-Nirmala.p65 2/24/2009, 5:23 PM61

MANUSCRIPT REVIEW BOARD
Prof. Alok Saklani, Director, Apeejay School of Management, Delhi
Mr. Amit Girdharwal, Keshav Mahavidyalaya, University of Delhi
Prof. Chris Knowles, Oregon State University, Corvallis, USA
Prof. C.P. Gupta, Management Development Institute, Gurgaon
Prof. J.D. Singh, Director, Jaipuria Institute of Management, Noida
Dr. Kamlesh Jain, Mata Sundri College, University of Delhi, Delhi
Prof. M.L. Saini, University of Delhi, Delhi
Prof. Mukesh Dhunna, Maharishi Dayanand University, Rohtak
Prof. Pikay Richardson, Manchester Business School, Manchester, UK
Prof. Prem Vrat, Vice-Chancellor, UP Technical University, Lucknow
Prof. R.S. Dwivedi, Former Professor of Management, Kurukshetra University,Kurukshetra
05-Nirmala.p65 2/24/2009, 5:23 PM62

REVIEW OF INDIAN STOCK MARKETDURING 2007AND 2008
From Boom to Bust
Harvinder Kaur*
Abstract
The period spanning the years 2007-2008 presents a unique opportunity to examine the performance ofthe Indian stock market relative to other world markets. From January 2007 to January 2008, the Indianmarket rose steadily to reach historic highs. Then, it started falling, the descent accelerating towards theend of 2008, due to the global fallout of the US mortgage crisis. In this article, a snapshot of the marketperformance during the two-year period is presented and compared with major overseas markets. Anumber of parameters are used to capture the market performance, such as daily returns, volatility ofdaily returns, market capitalization, FII fund flows, and F&O and mutual fund activity. The studyreveals that market volatility was the highest during October 2008 – about 5 per cent on both indices.Volatility was higher when the market was falling and lower when it was rising, suggesting investors'asymmetrical response to negative and positive news. Investors preferred debt mutual funds over equityfunds, probably to take advantage of the rising interest rate regime. Redemptions were the strongest inOctober 2008, right after the breakout of the US mortgage crisis. The Indian market underperformedmost of the global markets when reckoned from the beginning of January 2007 baseline. However, on amonthly basis, the Indian market delivered the highest returns and matched DJIA's average returnsover the total period. Volatility was the highest on a full-period basis and on a monthly basis comparableto Hang Seng's, but still higher than that of other developed markets.
Key Words: Stock Market, Return, Volatility, Contagion.
INTRODUCTION
IN this article, a snapshot of the Indian stockmarket’ performance, during the two-year periodfrom January 2007 to December 2008, is presentedand compared with major overseas markets. Theperiod from January 2007 to December 2008showed Indian market's march toward thehighest-ever levels of market capitalisation andstock indices in 2007, and, thereafter, a precipitous
fall in 2008. Right from 2007, a number of factorsfuelled the boom. These include strong economicfundamentals, relatively stable political climateand, hence, large foreign funds inflow. All thesemade the Indian stock market among the mostlucrative ones by investors around the world.However, the situation changed towards thebeginning of 2008, when the foreign funds, inparticular, resorted to some serious profit
* Dr. Harvinder Kaur is Reader in the Department of Commerce, Sri Guru Gobind Singh College of Commerce, University of Delhi,Delhi; e-mail: [email protected].
06-Harvinder Kaur.p65 2/24/2009, 5:24 PM63

Harvinder Kaur
64 NICE Journal of Business l Vol. 3 l Nos. 1 & 2 l 2008
booking, knocking the market off its historichighs. To make matters worse, massive financiallosses resulting from the US housing mortgagecrisis, involving transnational investors withinterest in the Indian market, lent a body blow tothe already shaky market and brought it to itsknees. As a result, in January 2009, the Sensex wasbarely able to sustain the 9000-10000 level, despiteexplicit support by the Indian Government.
A number of parameters are used to capturethe market performance during the period ofstudy, such as daily returns, volatility of dailyreturns, market turnover, FII fund flows, F&Oactivity and mutual fund activity. Finally, themarket performance in terms of average dailyreturn and volatility is compared with otherglobal markets.
THE CONCEPT OF VOLATILITY
Volatility is defined in terms of the statisticalmeasures of the variability of percentage pricechanges or rates of return. The most commonlyused statistical measure of volatility is thestandard deviation of returns, in part because itis used as a standard measure of risk in theoriesof portfolio selection and asset pricing. Thestandard deviation measures the dispersion ofreturns or the degree to which they vary fromperiod to period, the period being a month, a dayand even an hour or a minute. Thus, volatility canbe calculated for month-to-month returns, day-to-day returns, and even minute-to-minutereturns. For instance, if the standard deviationbased on daily close-to-close percentage pricechange for a month is 10 per cent, it is veryunlikely (that is, there is about a 5 per cent chance)that an investor will experience returns outside arange of 20 per cent (two standard deviations)over that month. This is because if stock returnsare normally distributed, about 95 per cent of thereturns lie between 2 standard deviations.
Volatility, per se, is not unnatural orunwanted. However, excessive volatility causedby irrational (speculative) behaviour of thetraders and investors, trading mechanism
imperfections and lack of informationtransparency is not desirable. If stock marketvolatility increases, it may have importantconsequences for investors and policy makers.Investors may equate higher volatility withgreater risk and may alter their investmentdecisions due to increased volatility. Policy-makers may be concerned that stock marketvolatility will spill over into the real economy andharm economic performance. Alternatively,policy-makers may feel that increased stockvolatility threatens the viability of financialinstitutions and the smooth functioning offinancial markets.
Stock exchanges sometimes experience veryshort-lived but sharp changes in prices ofindividual stocks. 'Hyper volatility' refers to pricemovements, which in their magnitude; speed anddisorderliness, are symptomatic of a pathologicalstate where the circumstances necessary to arriveat rational purchase or sale decisions do not exist(Kurt, 1991). This may be due to a grosslydestabilising occurrence in respect of:
1. Economic, political, physical, orpsychological environment, e.g.,assassination of the Head of State. Suchoccurrences are incapable of beinganticipated or assessed and, thus, cannotbe controlled; and
2. Market's structure or functioning, i.e., theoccurrence is such that it causes system-breakdown. The examples are: theSecurities Scam of 1992 in the Indian stockmarket and the October 1987 crash,experienced in the United States. Suchoccurrences are capable of analysis and,therefore, controllable.
Episodes of hyper volatility seriously affectpublic confidence in the stock market. Loss ofpublic confidence adversely affects exchanges intheir role as providers of liquidity and pricediscovery mechanisms. It is, therefore, importantto find means to prevent or, at least, contain hyper-volatility.
06-Harvinder Kaur.p65 2/24/2009, 5:24 PM64

Review of Indian Stock Market During 2007-2008
NICE Journal of Business l Vol. 3 l Nos. 1 & 2 l 2008 65
The major factors that affect the short-termand the long-term volatility are briefly describedbelow.
Factors affecting Long-term Volatility
Corporate Leverage
Financial and operating leverage effect thevolatility of stock returns. The use of debt-financing to increase the expected return and riskof equity capital is known as financial leverage.The use of fixed assets to increase the expectedprofitability and risk of production and marketingactivities is known as operating leverage. Schwert(1989) has shown that aggregate financialleverage is correlated with stock return volatility,a finding that is in conformity with the financialleverage theory.
Personal Leverage
Personal leverage refers to the use of personaldebt to increase the expected return and risk ofan individual's investment portfolio. Much recentdebate has focused on the effects of marginrequirements on the volatility of aggregate stockprices.
Business Conditions
There is strong evidence that stock volatilityincreases during economic recessions. Evidence(Schwert, 1989b) shows that the Great Depressionwas a period of extremely high volatility. In recentyears, the 1973-74 OPEC (Organisation ofPetroleum Exporting Countries) recession was aperiod of falling stock prices and high volatility.This relationship may in part reflect operatingleverage, as recessions are typically associatedwith excess capacity and unemployment.
Factors affecting Short-term Volatility
Several bursts in stock volatility in some marketsaround the world have spurred the recent interestin stock volatility during the last few years. The1992 boom and the subsequent crash in the Indian
stock market and the US stock market crashes ofOctober 1987 and October 1989 are prominentexamples. These bursts of volatility are hard torelate to longer-term phenomena, such asrecessions or leverage. Instead, most people havetried to relate them to the structure of securitiestrading. Some of the factors that may cause short-term volatility are discussed below.
Trading Volume
It has been argued that increased trading activityand stock return volatility occur together(Karpoff, 1987). It is difficult, however, todetermine what causes this association. Someobservers conclude that trading volume, i.e., thenumber of stocks traded multiplied by the tradedprice, directly causes volatility but it is only whenall traders want to buy (or sell) that the priceschange rapidly. Otherwise, large trading volumesshow a very efficient market, bringing togetherbuyers and sellers.
Trading Halts: Circuit Breakers and CircuitFilters
Stock exchanges apply market-wide ( i.e., appliedto market indices) or scrip-specific trading haltsfor providing a "cooling-off" period that allowsthe investors to re-evaluate market informationand to re-formulate a new investment strategy. Atrading halt may be applied in the form of a circuitbreaker or a circuit filter. There is no trading haltduring circuit filters, rather trades can take placein the permitted direction only, i.e., if downwardcircuit filter is applied at a certain price level, thestock cannot be sold below that level but can bebought. On the other hand, trading is suspendedfor the designated period upon the application ofa circuit breaker. Circuit filters are also referredto as "price limits" since these are appliedwhenever the stock price change exceeds certainpreset percentage limit in either direction.
Computerised (On-line) Trading
The remarkable advances in informationtechnology have made it much easier for a larger
06-Harvinder Kaur.p65 2/24/2009, 5:24 PM65
Harvinder Kaur
66 NICE Journal of Business l Vol. 3 l Nos. 1 & 2 l 2008
number of people to learn about and react to theinformation quickly. They have also made itpossible for financial markets to provide liquidityfor investors around the world. These changeshave had two by-products. First, there are largeincentives for investors to get new informationand act upon them. Second, since newinformation spreads much faster, the rate at whichprices change in response to the informationwould also accelerate. The liquidity of organisedsecurities market plays an important part insupporting the value of traded securities, but italso means that prices can change quickly. Fromthis perspective, volatility is a symptom of ahighly liquid securities market.
Noise Trading
Another explanation for stock pricesovershooting could be that some investors inferinformation from changes in stock prices and basetheir expectations for changes in stock prices onpast changes, e.g., some investors may extrapolaterecent changes in stock prices. This reaction ofinvestors has been encapsulated as 'the trend isyour friend' syndrome and been given the name'noise trading'. Noise is contrasted withinformation. Noise trading is trading on noise asif it were information.
International Linkages: The Contagion Effect
Nowadays, investors have regard to theincreasing internationalisation of securitymarkets. Increased integration has resulted in theremoval of controls on the internationalmovement of capital by the Indian and othergovernments. The stocks of leading Indiancompanies are now quoted on foreign stockmarkets; movements of Indian stock prices areinfluenced by movements of stock prices on theWall Street and other overseas markets. One effectof the greater international integration of stockmarkets is that the information relevant toinvestment decisions in Indian stocks hasexpanded to include information about foreignsecurities and markets.
Takeovers
Takeover bids are usually made at a premium tothe pre-bid price of the target compan y’s shares.Changing assessments of the likelihood of atakeover can lead to fluctuations in the price of thestocks of the individual companies. A spate oftakeovers may for some time raise prices generally,as investors bid up the prices of the stocks ofcompanies, which they expect may be taken over.
Supply of Equities
So far, the explanation for the volatility of stockprices has been in terms of the forces affectingdemand for stocks from investors. A feature ofthe stock market is that the total stock of stocks isinelastic - the supply of new stocks does notrespond quickly to changes in prices. Certainly,new issues of stocks are made and directors offirms do tend to raise new capital or float theircompanies when stock prices are high, but theresponse is not rapid, partly because it takes timeto prepare prospectuses, etc. When stock pricesare considered by the directors of companies tobe low, companies may buy more of their ownstocks and reduce the supply. Nevertheless, thesupply of new stocks is much more inelastic thanthe supply of say, new cars to the market, and thisinelasticity of supply exacerbates changes inprices caused by changes in demand.
The Media
Large sections of many newspapers and variousTV Channels are devoted to reporting financialnews and views. If the investors and fundmanagers were to act on the same investmentadvice delivered by the media, it could lead toherd-type behaviour and significant fluctuationsin stock prices. The role of the press in generatingfluctuations of stock prices could be significant.The extensive coverage of stock market news evenin the non-financial dailies indicates that thenewspapers are an important source ofinformation and comment upon the stock market,at least for private (as opposed to institutional)investors.
06-Harvinder Kaur.p65 2/24/2009, 5:24 PM66

Review of Indian Stock Market During 2007-2008
NICE Journal of Business l Vol. 3 l Nos. 1 & 2 l 2008 67
Other Factors
In the recent past, the numbers of market playershas gone up and with the rapid dissemination ofinformation, market movements have becomefaster. Ideally, more number of players shouldmean reduced volatility. But ironically in India,online information about domestic andinternational corporate and economicdevelopments is available to only a few peoplewho act fast, and others follow. This time lag inthe availability of information to different marketparticipants also results in volatility.
REVIEW OF LITERATURE
A number of studies deal with the level ofvolatility prevalent in a stock market and howdoes it compare with volatility levels of the othermarkets. The dependence of volatility upon anumber of factors such as trading mechanism,traded volume, dividend payout, various typesof leverages available to companies andinvestors, day of the week, arrival ofinformation, etc. has been covered under thesestudies. Some of these studies focus upon thedescriptive aspects of stock market volatility,while some others have attempted to relate theextent of volatility over various time horizonswith the design and efficacy of regulatoryinterventions that may be resorted to curbexcessive volatility. The following paragraphsbriefly discuss some of the important studies onthe subject.
The Study by French and Roll
French and Roll (1986) analyse the volatility ofequity returns during exchange trading and non-trading hours. The study finds that equity returnsare more volatile during exchange trading hoursthen during non-trading hours. They providedthree explanations for the empirical phenomenonthat prices are more volatile during exchangetrading hours. The first possibility is that morepublic information arrives during normalbusiness hours. Under this hypothesis mostreturn volatility is caused by factors like judicial
decisions and tender offers and theseannouncements are clustered during the tradingday. The second explanation assumes that mostreturn volatility is caused by private informationand that this information only affects pricesthrough the trading of informed investors. If theinformed investors are more likely to trade whenthe exchanges are open, return variances will behigh during this period. The third possibility isthat the process of trading introduces noise intostock returns, e.g., investors may over-react toeach other's trade. This trading noise wouldincrease return variances when the exchanges areopen.
The Study by Amihud and Mendelson
This study examines the effects of the mechanismby which securities are traded on their pricebehaviour. Amihud and Mendelson (1987)compare the behaviour of open-to-open andclose-to-close returns of NYSE stocks, given thedifferences in execution methods applied in theopening and closing transactions. Their resultsshow that the trading mechanism has a significanteffect on a number of characteristics of stockreturns. Trading at the opening exposes trader toa greater variance (volatility) than in the close,reflecting the differences between the tradingmechanisms. Both the nature of lagged priceadjustment and the level of transitory noise aredifferent. Thus, when considering theimplications of changing the method of tradingin a market, the effects on return behaviourshould not be overlooked.
The Study by Jones and Wilson
The study by Jones and Wilson (1989) assesseswhether the stock-price volatility has increased,and whether it is currently above or belowhistorical levels. They have measured volatilityusing two methods: (1) the percentage spreadbetween high and low daily prices in each monthand (2) the standard deviation of the daily priceswithin each month. Their volatility measures overthe 1885-1989 period suggest that, while the daily
06-Harvinder Kaur.p65 2/24/2009, 5:24 PM67

Harvinder Kaur
68 NICE Journal of Business l Vol. 3 l Nos. 1 & 2 l 2008
volatility has increased slightly since 1980, it is bitdifferent from the volatility that has existed formore than 100 years.
Schwert's Study
In this study, Schwert (1989) characterises thechanges in stock market volatility through time. Inparticular, it relates the stock market volatility tothe time-varying volatility of a variety of economicvariables. It analyses the relation of stock volatilitywith real and nominal macroeconomic volatility,economic activity, financial leverage and stocktrading activity, using the monthly data ofStandard and Poor's (S&P) Composite Portfoliofrom 1857 to 1987. Although the study analysesmany factors related to stock volatility, it does nottest for causes of stock price volatility. Stock marketvolatility is related to the level of economic activity.Stock market volatility is higher during recessionssince most of the estimates are positive. Thus, stockmarket volatility is related to the general health ofthe economy. One interpretation of this evidenceis that 'operating leverage' increases duringrecessions. The author also shows that financialleverage affects stock volatility. When stock pricesfall relative to bond prices or when firms issue newdebt securities in larger proportion to new equitythan their prior capital structure, stock volatilityincreases. However, this effect explains only a smallproportion of the changes in the stock volatilityover time. There exists a relationship betweentrading activity and stock volatility. The numberof trading days in the month is positively relatedto stock volatility especially in 1953-1987. Alsoshare trading volume growth in positively relatedto stock volatility.
Schwert's Study
Schwert (1990), in his study, has surveyed theacademic evidence on stock market volatility.Volatility has been measured by the standarddeviation of rates of return to a broad stockmarket index such as the Standard and Poor's500. Three return series - daily returns, monthlyreturns, and 15-minute returns - have been used
to calculate different volatility estimates. Thevarious estimates of standard deviation showthat volatility as measured using the standarddeviation of rates of return has been stable sincethe mid – 19th century in the United States. Themajor exception was the great depression periodfrom 1929 to 1939. Moreover, the growth in stockindex futures and options trading has not beenassociated with an upward trend in stockvolatility. The evidence indicates that futurereturns are more volatile than stock index returnswhen there are big price movements. There isalso little evidence that computerised tradingper se increases volatility except perhaps withinthe trading day. The evidence so far given isinconclusive as to whether trading halts orcircuit breakers can reduce volatility in abeneficial way. He also states that severaleconomic factors may lay behind slow changesin stock market volatility - that is, changes thatbecome noticeable over many months or years.These factors include the financial leverage,operating leverage, personal leverage, and thecondition of the economy. But the bursts ofvolatility, for example, the crashes of October1987 and, to a much lesser extent, October 1989,are hard to relate to longer-term phenomena,such as recessions or leverage.
The Study by Roy and Karmakar
Based on the measurement of stock marketvolatility for the period 1935 to 1992, Roy andKarmakar (1995) focus on the measurement of theaverage level of volatility in the Indian stockmarket and whether it has increased in the currentperiod. Market volatility has been measured fora span of 58 years. Volatility has been measuredby the standard deviation of rates of return. Theirdecade-wise analysis show violent changes inshare prices cluster around the boom of the 40'sand share mania of the 80's that continued up to1992. For a relatively current period, 1961-92,volatility has been measured based on dailyreturn within each month. Their analyses showthat out of a total of 25 volatile months, only 2pertain to the calm period of the 60's and the 70's.
06-Harvinder Kaur.p65 2/24/2009, 5:24 PM68

Review of Indian Stock Market During 2007-2008
NICE Journal of Business l Vol. 3 l Nos. 1 & 2 l 2008 69
In the 90's the year 1992 is the most current andvolatile year in the history of Indian capitalmarket.
Goyal's Study
Goyal (1995) examines the nature and trend of thestock return volatility in the Indian stock marketand assesses the role of "carry-forward system" incausing variations in the volatility levels. From theanalysis of the volatility in stock returns, it isrevealed that the erstwhile carry forward systemcontributed to volatility in the market. UnionGovernment Budget and declarations of bookclosures by firms produce seasonality patterns inmonthly volatility estimates of stock returns.Volatility in stock returns peaks every year in themonth of March and next peak occurs in the monthof July. The apprehension that globalisation of theIndian capital market has added to stock marketactivity is not substantiated. This is in line withthe findings of Kim and Singal (1994) in regard toother emerging markets.
Reddy's Study
Reddy (1998) has analysed the effects of marketmicrostructure on the stock market volatility. Theinfluence of establishment of the NSE andintroduction of the BSE On-Line Trading (BOLT) onthe volatility of securities traded on the BSE has beenanalysed. The results of influence of theestablishment of NSE on the volatility in BSE aremixed. The establishment of the NSE, thoughfragmented the stock market structure in India, hasnot really affected the working of BSE, as his analysiscould not find sufficient evidence for an increase inthe volatility of the securities traded on the BSE. Theresults show that on-line trading has indeed led toan increase in the volatility of securities traded.Thus, automation of trading has influenced thefunctioning of BSE on the expected line.
Kaur's Study
The study by Kaur (2004) describes the extent andpattern of stock return volatility of the Indian stockmarket during the last decade of the previous
millennium, i.e., from 1990 to 2000. The market isrepresented by two most prominent spot priceindices, viz., BSE Sensex and S&P CNX Nifty. It isfound that stock market volatility was the highestduring 1992, followed by 1990 and 2000, in thatorder. It fell sharply after 1992 until 1995, afterwhich it started increasing again. Among themonths, April has been the most volatile followedby March and February. This could probably bedue to the occurrence of most significant economicevent in the year, namely, the presentation of theUnion Budget, which is usually presented on thelast day of February every year.
OBJECTIVES OF THE STUDY
The study seeks to analyse the following aspectsof the Indian stock market for the years 2007 and2008:
1. The extent and pattern of daily returns onSensex and Nifty and their volatility;
2. Comparison of Indian market performancewith global markets in terms of price trend,daily returns, and their volatility;
3. The trends in the cash and derivatives marketsturnover;
4. Mutual Fund investment trends; and
5. FII investment trends.
RESEARCH METHODOLOGY
The Sample
The Indian stock market is taken to be representedby the two most popular, accepted and quotedindices, viz., BSE Sensex ("Sensex") and S&P CNXNifty ("Nifty"). The market indices are fairlyrepresentative of the various industry sectors andtrading activity mostly revolves around the stockscomprising the indices.
The Data
The closing price data (adjusted) for NSE Niftyhas been taken from the NSE website ( www.nse-india.com) and for BSE Sensex (www.bseindia.com)
06-Harvinder Kaur.p65 2/24/2009, 5:24 PM69

Harvinder Kaur
70 NICE Journal of Business l Vol. 3 l Nos. 1 & 2 l 2008
and other world indices from yahoo! financewebsite [email protected] . Summary statistics onmarket activity in various trade segments aretaken from periodic reports published by therespective stock exchanges and The Securities &Exchange Board of India (SEBI) (www.sebi.gov.in).
Measures of Daily Return and Volatility
The volatility of daily stock returns over a monthhas been calculated as the standard deviation ofdaily returns on market indices. The returns arecalculated as log price differences in order to treatpositive and negative returns with equanimity.
Thus, standard deviation (volatility) isdefined as:
2
1
1( )
n
t
n rn
And, the daily return
log1
Ptrt e
Pt
where:
n = number of observations
rt = return on day t
r = average return during the period ofobservation
pt = price on day t
pt-1 = price on the day before day t, i.e., dayt-1
RESULTS AND DISCUSSION
Sensex and Nifty Daily Returns andtheir Volatility
This section presents the results of themeasurement of daily returns on the domestic(Sensex and Nifty) and some other global indices(DJIA, BOVESPA, FTSE, Hang Seng and Nikkei)and their volatility during the period of study.The daily returns have been calculated as the
difference between the natural logarithms of thedaily closing prices on the consecutive tradingdays. From these, average daily return (e.g.,simply the mathematical average) and volatilityof daily returns (e.g., standard deviation) in amonth, year and over the full period of study(2007-2008) have been calculated.
Figure 1 shows the price movement, andFigure 2, the daily returns on the domestic indicesduring January 2007 - December 2008. During thisperiod, the journey of the domestic market hasbeen pretty eventful, to say the least. Starting theyear 2007 on a buoyant note, the marketstrengthened further by around 700 points(Sensex) during first two weeks of February. Afterthis, the market went into the usual around-the-Budget bout of volatility shedding around awhopping 1527 points (accounted from the 2ndJanuary baseline) until 5th March. Things started
06-Harvinder Kaur.p65 2/24/2009, 5:24 PM70
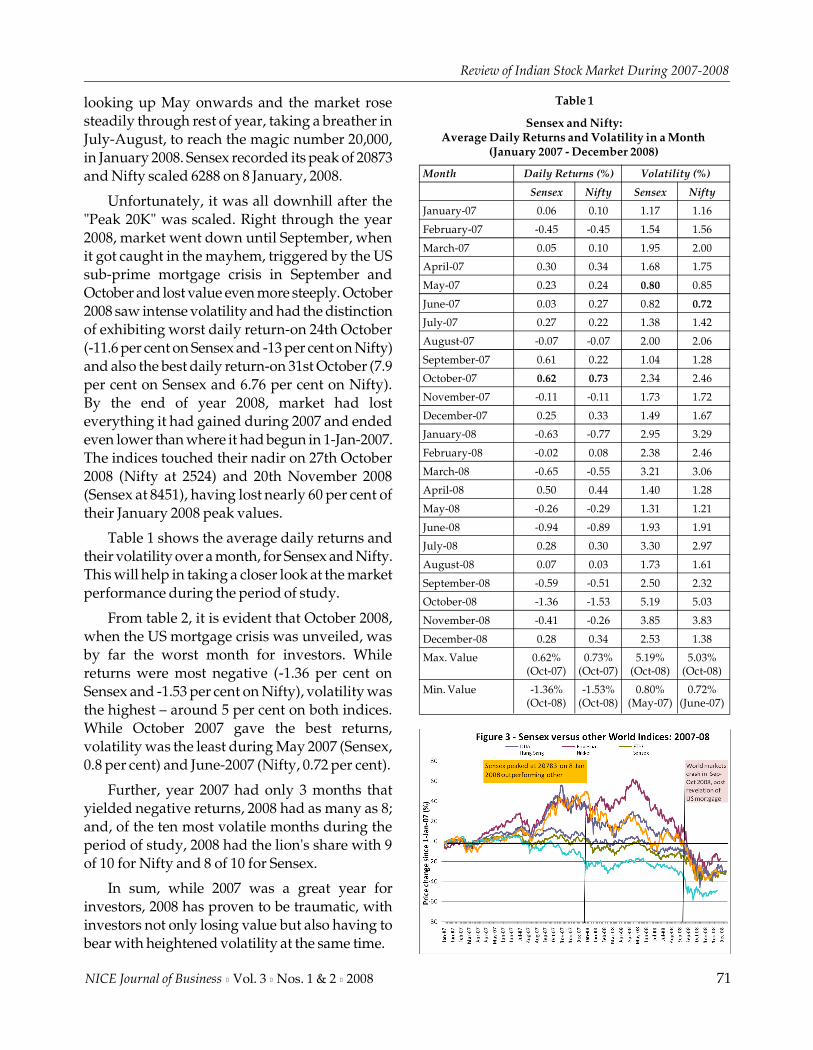
Review of Indian Stock Market During 2007-2008
NICE Journal of Business l Vol. 3 l Nos. 1 & 2 l 2008 71
looking up May onwards and the market rosesteadily through rest of year, taking a breather inJuly-August, to reach the magic number 20,000,in January 2008. Sensex recorded its peak of 20873and Nifty scaled 6288 on 8 January, 2008.
Unfortunately, it was all downhill after the"Peak 20K" was scaled. Right through the year2008, market went down until September, whenit got caught in the mayhem, triggered by the USsub-prime mortgage crisis in September andOctober and lost value even more steeply. October2008 saw intense volatility and had the distinctionof exhibiting worst daily return-on 24th October(-11.6 per cent on Sensex and -13 per cent on Nifty)and also the best daily return-on 31st October (7.9per cent on Sensex and 6.76 per cent on Nifty).By the end of year 2008, market had losteverything it had gained during 2007 and endedeven lower than where it had begun in 1-Jan-2007.The indices touched their nadir on 27th October2008 (Nifty at 2524) and 20th November 2008(Sensex at 8451), having lost nearly 60 per cent oftheir January 2008 peak values.
Table 1 shows the average daily returns andtheir volatility over a month, for Sensex and Nifty.This will help in taking a closer look at the marketperformance during the period of study.
From table 2, it is evident that October 2008,when the US mortgage crisis was unveiled, wasby far the worst month for investors. Whilereturns were most negative (-1.36 per cent onSensex and -1.53 per cent on Nifty), volatility wasthe highest – around 5 per cent on both indices.While October 2007 gave the best returns,volatility was the least during May 2007 (Sensex,0.8 per cent) and June-2007 (Nifty, 0.72 per cent).
Further, year 2007 had only 3 months thatyielded negative returns, 2008 had as many as 8;and, of the ten most volatile months during theperiod of study, 2008 had the lion's share with 9of 10 for Nifty and 8 of 10 for Sensex.
In sum, while 2007 was a great year forinvestors, 2008 has proven to be traumatic, withinvestors not only losing value but also having tobear with heightened volatility at the same time.
Table 1
Sensex and Nifty:Average Daily Returns and Volatility in a Month
(January 2007 - December 2008)
Month Daily Returns (%) Volatility (%)
Sensex Nifty Sensex Nifty
January-07 0.06 0.10 1.17 1.16
February-07 -0.45 -0.45 1.54 1.56
March-07 0.05 0.10 1.95 2.00
April-07 0.30 0.34 1.68 1.75
May-07 0.23 0.24 0.80 0.85
June-07 0.03 0.27 0.82 0.72
July-07 0.27 0.22 1.38 1.42
August-07 -0.07 -0.07 2.00 2.06
September-07 0.61 0.22 1.04 1.28
October-07 0.62 0.73 2.34 2.46
November-07 -0.11 -0.11 1.73 1.72
December-07 0.25 0.33 1.49 1.67
January-08 -0.63 -0.77 2.95 3.29
February-08 -0.02 0.08 2.38 2.46
March-08 -0.65 -0.55 3.21 3.06
April-08 0.50 0.44 1.40 1.28
May-08 -0.26 -0.29 1.31 1.21
June-08 -0.94 -0.89 1.93 1.91
July-08 0.28 0.30 3.30 2.97
August-08 0.07 0.03 1.73 1.61
September-08 -0.59 -0.51 2.50 2.32
October-08 -1.36 -1.53 5.19 5.03
November-08 -0.41 -0.26 3.85 3.83
December-08 0.28 0.34 2.53 1.38
Max. Value 0.62% 0.73% 5.19% 5.03%(Oct-07) (Oct-07) (Oct-08) (Oct-08)
Min. Value -1.36% -1.53% 0.80% 0.72%(Oct-08) (Oct-08) (May-07) (June-07)
06-Harvinder Kaur.p65 2/24/2009, 5:24 PM71

Harvinder Kaur
72 NICE Journal of Business l Vol. 3 l Nos. 1 & 2 l 2008
Sensex and Global Indices' Daily Returnsand their Volatility
We now take a look at the performance of theIndian stock market apropos other globalmarkets. Figure 3 depicts the price movement ofSensex (representing the Indian market) relativeto the other overseas indices, with 2nd January2007 prices as the baseline for respective indices.It shows that while the Sensex mostly exhibitedmiddle of the road performance during theperiod of study, it outperformed other indices
during its leap to "Peak 20K" from the end of 2007until January 2008. Thereafter, itunderperformed BOVESPA (Brazil) and HangSeng (Hong Kong) but outperformed Nikkei(Japan), FTSE (UK) and DJIA (US). Of course, allindices have followed the global trend and fellin the latter half of 2008.
Table 2 shows the average daily return andtheir volatility during 2007 and 2008 and the fullperiod of study for Sensex, DJIA, BOVESPA,FTSE, Hang Seng and Nikkei 225.
Table 2
Sensex and World Indices: Average Daily Returns and Volatility(January 2007 - December 2008)
Stock Index 2007 2008 Overall (2007-08)
Daily Return (%) Volatility (%) Daily Return (%) Volatility (%) Daily Return (%) Volatility (%)
DJIA 0.025 0.920 -0.163 2.381 -0.073 1.811
BOVESPA 0.140 1.735 -0.213 3.291 -0.041 2.643
FTSE 0.009 1.101 -0.149 2.364 -0.072 1.846
Hang Seng 0.125 1.635 -0.263 3.193 -0.071 2.541
Nikkei -0.051 1.166 -0.224 2.935 -0.141 2.235
Sensex 0.151 1.549 -0.305 2.865 -0.074 2.308
Max. Value 0.151% 1.735% -0.149% 3.291% -0.041% 2.643%(Sensex) (BOVESPA) (FTSE) (BOVESPA) (BOVESPA) (BOVESPA)
Min. Value -0.051% 0.920% -0.305% 2.364% -0.141% 1.811%(Nikkei) (DJIA) (Sensex) (FTSE) (Nikkei) (DJIA)
Table 3
NSE Derivatives and Cash Turnover
Month NSE Cash Market NSE Derivatives NSE Cash Derivatives(end of period) Capitalization Turnover (Rs. Crore) Turnover turnover as % of
(Rs Crore) (Rs Crore) (Rs Crore) Cash turnover (%)
Jan-07 3,571,487 627,456 175,147 358
Feb-07 3,296,931 703,492 180,170 390
March-07 3,367,350 693,763 167,954 413
April-07 3,650,368 616,287 168,567 366
May-07 3,898,078 723,443 207,585 349
June-07 3,978,381 806,542 193,648 416
July-07 4,317,571 1,015,077 267,227 380
August-07 4,296,994 1,056,731 231,241 457
September-07 4,886,561 1,072,889 266,050 403
October-07 5,722,227 1,833,663 455,589 402
November-07 5,876,742 1,517,304 414,420 366
December-07 6,543,272 1,274,230 366,385 348
Jan-08 5,295,387 1,453,881 447,138 325
06-Harvinder Kaur.p65 2/24/2009, 5:24 PM72

Review of Indian Stock Market During 2007-2008
NICE Journal of Business l Vol. 3 l Nos. 1 & 2 l 2008 73
Feb-08 5,419,942 899,217 280,176 321
March-08 4,858,122 821,215 253,012 325
April-08 5,442,780 766,431 271,227 283
May-08 5,098,873 797,908 277,923 287
June-08 4,103,651 1,084,064 264,428 410
July-08 4,432,427 1,160,174 295,816 392
August-08 4,472,461 957,445 234,251 409
September-08 3,900,185 1,197,872 262,261 457
October-08 2,820,388 941,646 216,198 436
November-08 2,653,281 745,356 173,123 431
Cash and Derivatives Turnover
Table 3 summarises the market capitalisation andderivatives and cash market turnover of NSE at theend of each month from January 2007 throughDecember 2008.
We consider derivatives turnover of NSE, asNSE is by far the leader in derivative trades andclocks turnover around 45 times that of BSE. Atthe end of June 2007, Both BSE's and NSE's cashmarket capitalization reached the landmark ofUS$ one trillion, an achievement that reflects thegrowing clout of Indian economy and immenseinvestor fancy for the Indian bourses. Derivativesturnover on NSE was the highest during the finalassault on "Peak 20K" from October 2007 throughJanuary 2008, averaging around Rs 1,500,000Crore, around 4 times that of the cash marketturnover. The market capitalisation and turnoverhowever, shrunk after January 2008, to aroundhalf of their peak values (Figure 4).
Mutual Fund Investments
Table 4 shows the summary statistics of themutual fund market investments during theperiod of study. Figure 5 depicts the trend inequity and debt segments.
Net investments in equity and debt mutualfunds during the period of study indicate strongpreference for debt mutual funds over equityfunds. Note that during 2007-2008 we had risinginterest rate regime and market volatility wasincreasing. It is, therefore, natural to expectpreference for debt schemes. In 2007, investmentsin debt mutual funds were around 10 times thanthat in equity funds and amounted to around Rs64,000 crore. In 2008, these were around 3.5 timesand amounted to around Rs 49,000 crore.Interestingly, October 2008, in the midst of marketcrash in the aftermath of US sub-prime crisis andperiod of extreme volatility, massive redemptiontook place in debt funds to the tune of Rs 26,000
06-Harvinder Kaur.p65 2/24/2009, 5:24 PM73

Harvinder Kaur
74 NICE Journal of Business l Vol. 3 l Nos. 1 & 2 l 2008
Table 4
Mutual Fund Investments in 2007 and 2008
EQUITY DEBT
End of Gross Purchases Gross Sales Net Investment Gross Purchases Gross Sales Net InvestmentMonth (Rs Crore) (Rs Crore) (Rs Crore) (Rs Crore) (Rs Crore) (Rs Crore)
Jan-07 11499 12919 -1420 10831 8428 2403
Feb-07 12698 12971 -273 10352 7683 2669
Mar-07 10047 11752 -1705 15565 10779 4786
Apr-07 12216 11185 1031 15986 12859 3127
May-07 15436 13529 1907 23912 14678 9234
Jun-07 12196 10983 1213 25282 16328 8954
Jul-07 16892 17793 -901 29859 17054 12805
Aug-07 16676 12582 4094 20839 16480 4359
Sep-07 15847 16611 -764 24510 14797 9713
Oct-07 23221 24936 -1715 33058 20968 12090
Nov-07 19329 17160 2169 17915 25031 -7116
Dec-07 20745 17721 3024 17744 16456 1288
Jan-08 32721 25019 7702 26139 30760 -4621
Feb-08 16752 16238 514 25413 13340 12073
Mar-08 15548 17519 -1971 37948 26066 11882
Apr-08 13407 13518 -111 36801 20363 16438
May-08 13470 13406 64 30920 25002 5918
Jun-08 14811 11632 3179 24287 21023 3264
Jul-08 17189 15777 1412 23529 17740 5789
Aug-08 10660 11029 -369 23387 15923 7464
Sep-08 14656 12364 2292 29332 22915 6417
Oct-08 13177 11746 1431 15621 41703 -26082
Nov-08 8454 8826 -372 13883 17482 -3599
Dec-08 10210 9870 340 29887 16237 13650
2007 Net 186802 180142 6660 245853 181541 64312
2008 Net 181055 166944 14111 317147 268554 48593
Overall Net 367857 347086 20771 563000 450095 112905
Source: SEBI website
crore. However, heavy investments were madeagain in December 2008 (Rs 13,650 crore) in debtfunds.
FII Investments
Foreign Institutional Investors' (FIIs) investmentsplay an important role in determining marketreturn and volatility. The data contained in Table5 and the graphical representation in Figure 6indicate that daily returns in a month hadsomewhat positive relationship with FIIs'purchases and volatility with their sales.
06-Harvinder Kaur.p65 2/24/2009, 5:24 PM74

Review of Indian Stock Market During 2007-2008
NICE Journal of Business l Vol. 3 l Nos. 1 & 2 l 2008 75
It is observed that volatility was higher whenthe market was falling. Conversely, market wasless volatile while rising. This is because investors'asymmetrical response to negative and positivenews. While the Sensex mostly exhibited middleof the road performance during the period ofstudy, it outperformed other global indices duringits leap to "Peak 20K" during the end of 2007 untilJanuary 2008.
Derivatives turnover on NSE was the highestduring the final stretch to "Peak 20K" fromOctober 2007 through January 2008, averagingaround Rs 1,500,000 crore, around 4 times that ofthe cash market turnover. The marketcapitalisation and turnover however, shrunk afterJanuary 2008, to around half of their peak values.
Net investments in equity and debt mutualfunds during the period indicate strongpreference for debt mutual funds over equityfunds in line with the rising interest rate regimeand increasing market volatility during the years2007 and 2008. In October 2008, in the midst ofmarket crash in the aftermath of the US sub-primecrisis and the period of extreme volatility, massiveredemptions took place in debt funds to the tuneof Rs 26,000 crore.
The daily returns in a month had somewhatpositive relation with FIIs' purchases andvolatility with their sales. While the bouts of highvolatility in Janary-February 2008, June-July andSeptember-October 2008 were all characterised bynet sales by FIIs, comparatively calmer periodsaw sizeable gross purchases by them.
REFERENCES
Aggarwal, R., and K. Tandon (1994), "Anomalies orIllusions? Evidence from Stock Markets in EighteenCountries", Journal of International Money and Finance ,Vol. 13, pp. 83-106.
Amihud, Y., and H. Mendelson (1987), "TradingMechanisms and Stock Returns: An EmpiricalInvestigation", The Journal of Finance , Vol. 42, No. 3,pp. 533-555.
Ballie, R.T., and R. P. DeGennaro (1990), "Stock Returns andVolatility", Journal of Financial and Quantitative Analysis ,Vol. 25, pp. 203-214.
Table 5
FII Investments in 2007 and 2008
Month Gross Gross Net NetPurchases Sales Invest- Investment(Rs Crore) (Rs Crore) ment US $m at
(Rs Crore) monthexchange
rate
Jan-07 45052 44560 492 113
Feb-07 55804 48564 7239.6 1620
Mar-07 50679 51760 -1082 -244
Apr-07 48141 41462 6679 1516
May-07 49752 45792 3960 942
Jun-07 49250 47607 1643 401
Jul-07 85280 61408 23872 5855
Aug-07 58825 66595 -7771 -1922
Sep-07 67411 51278 16133 3957
Oct-07 131787 111196 20591 5067
Nov-07 87313 93163 -5850 -1450
Dec-07 85586 80007 5579 1383
Jan-08 103678 116714 -13036 -3232
Feb-08 62078 65190 -3112 -771
Mar-08 71159 71290 -130 -32
Apr-08 62516 61441 1075 267
May-08 58814 63825 -5012 -1242
Jun-08 62841 72937 -10096 -2503
Jul-08 63563 65400 -1837 -455
Aug-08 47560 48772 -1212 -300
Sep-08 66496 74775 -8278 -2052
Oct-08 49431 64779 -15347 -3805
Nov-08 30416 33014 -2598 -644
Dec-08 31355 29605 1750 434
Source: www.sebi.gov.in (Daily trends in FII investments)
The bouts of high volatility in Jan to Feb 2008,June to July and Sep to Oct 2008 were allcharacterisd by net sales by FIIs, whilecomparatively calmer period saw sizeable grosspurchases, e.g., most part of 2007.
CONCLUSIONS
The period of two years (2007 and 2008) has beenvery eventful for the Indian stock market. These twoyears saw contrasting market action: 2007 being thegood year and 2008, the bad one, from the investors'perspective. The svolatility was the highest duringOctober 2008—around 5 per cent on both indices.
06-Harvinder Kaur.p65 2/24/2009, 5:24 PM75

Harvinder Kaur
76 NICE Journal of Business l Vol. 3 l Nos. 1 & 2 l 2008
Black, F. (1976), "Studies of Stock Price Volatility Changes",Proceedings of the 1976 Meetings of the American StatisticalAssociation, Business and Economics Statistics Section(Washington D.C., American Statistical Association),pp. 177-181.
Booth, G.G., T. Martikainen, and Y. Tse (1997), "Price andVolatility Spillovers in Scandinavian Stock Markets",Journal of Banking and Finance , Vol. 21, pp. 811-23.
Fama, E. (1965), "The Behaviour of Stock Market Prices",Journal of Business, Vol. 38, pp. 34-105.
French, K., G. Schwert and R. Stambaugh (1987), "ExpectedStock Returns and Volatility", Journal of FinancialEconomics, Vol. 19, pp. 3-29.
French, K. and R. Roll (1986), "Stock Return Variances: theArrival of Information and the Reaction of Traders",Journal of Financial Economics , Vol. 17, pp. 5-26.
Geyer, A.L.J. (1994), "Volatility Estimates of the ViennaStock Market", Applied Financial Economics , Vol. 4,pp. 449-55.
Goyal, R. (1995), "Volatility in Stock Market Returns",Reserve Bank of India Occasional Papers , Vol. 16, No. 3,pp. 175-95.
Hansda, S.K., and P. Ray (2002), "BSE and Nasdaq:Globalisation, Information Technology and StockPrices", Economic and Political Weekly , February 2,p. 459.
Karpoff, J.M. (1987), "The Relation Between Price Changesand Trading Volume: A Survey", Journal of Financial &Quantitative Analysis , Vol. 22, No. 1, p. 109.
Kaur, H. (2002), "Modelling Stock Market Volatility inIndia", Review of Commerce Studies, Vol. 21, No. 2 (June-December), pp. 1-40.
Kaur, H. (2002), "Stock Market Volatility in India" (NewDelhi: Deep & Deep Publications).
Kaur, H. (2003), "Effect of Foreign Institutional Investmentson Stock Market Volatility in India", Review of CommerceStudies, Vol. 22, No. 1(January-June), pp. 1-19.
Kaur, H. (2004), "Effect of Company Size on Stock MarketVolatility", Finance India, Vol. 18, No.1 (March),pp. 103-114.
Kaur, H. (2004), "Stock Market Volatility in India", IndianJournal of Commerce , Vol. 57, No. 4 (October-December),pp. 55-70.
Kaur, H. (2004), "Time Varying Volatility in the Indian StockMarket." Vikalpa, Vol. 29, No. 4 (October-December),pp. 25-42.
Kaur, H. (2007), "Review of Indian Stock Market duringJanuary-June 2007." Business Horizon, Vol. 1 (July-December), pp. 185-197.
Kumar, K.K., and C. Mukhopadhay (2002), "A Case of USand India", Paper published by NSE Research Initiative .Available at www.nse-india.com.
Kurt, S. (1991), "Hyper Volatility of Securities Market", TheBombay Stock Exchange Review , July, pp. 1-9.
Mandelbrot, B. (1963), "The Variation of Certain SpeculativePrices", Journal of Business, Vol. 36, pp. 394-419.
Pandey, A. (2002), "Extreme Value Estimators and theirEmpirical Performance in Indian Capital Markets",Paper published by NSE Research Initiative . Available atwww.nseindia.com.
Parkinson, M. (1980), "The Extreme Value Method forEstimating the Variance of the Rate of Return", Journalof Business, Vol. 53, pp. 61-65.
Pattanaik, S., and B. Chatterji (2000), "Stock Returns andVolatility in India: An Empirical Puzzle?" Reserve Bankof India Occasional Papers , Vol. 21, No. 1 (Summer),pp. 37-60.
Poshakwale, S. (1996), "Evidence on Weak Form Efficiencyand Day of the Week Effect in the Indian Stock Market",Finance India, Vol. 10, No. 3, pp. 605-616.
Rao, B.S.R., and U. Naik (1990), "Inter-relatedness of StockMarkets: Spectral Investigation of USA, Japanese andIndian Markets - A Note", Arth Vignana, Vol. 32 (3&4),pp. 309-321.
Reddy, Y. S. (1998), "Effects of Microstructure on StockMarket Liquidity and Volatility", Prajnan, Vol. 26,No. 2, pp. 217-31.
Rogers, L.C.G. , and S.E. Satchell, ( 1991), "EstimatingVariance from High, Low and Closing Prices", Annalsof Applied Probability , Vol. 1, pp. 504-12.
Roll, R., (1988), "The International Crash of October 1987",Financial Analysts’ Journal , September-Octoberpp. 19-35.
Roy, M. K., and M. Karmakar, (1995), "Stock MarketVolatility, Roots and Results", Vikalpa, Vol. 20, No.1(January-March), pp. 37-48.
Schwert, W. G. (1989), "Why Does Stock Market VolatilityChange Over Time?" The Journal of Finance , Vol. 44,No. 5, pp. 1115-51.
Schwert, W. G. (1990), "Stock Market Volatility", FinancialAnalysts Journal, (May-June), pp. 23-34.
Securities and Exchange Board of India (SEBI), AnnualReports. Available at www.sebi.gov.in.
Sharma, J.L., and R.E. Kennedy (1977), "ComparativeAnalysis of Stock Price Behaviour on the Bombay,London and New York Stock Exchanges", Journal ofFinancial and Quantitative Analysis , (September),pp. 391-403.
Shenbagaraman, P. (2003), "Do Futures and OptionsTrading Increase Stock Market Volatility?" Paperpublished by NSE Research Initiative . Available atwww.nseindia.com.
Thomas, S. (1998), "Volatility Forecasting in IndianFinancial Markets", Derivative Markets in India (TataMcGraw Hill, India).
06-Harvinder Kaur.p65 2/24/2009, 5:24 PM76
SERVICE QUALITY IN TELECOM INDUSTRYA Study of Telecom Service-providers in Dehradun City
Prakash Tiwari* and Hemraj Verma**
Abstract
Due to increased competition in the telecom industry, customers are being wooed through numerousmeasures like cutting the call charges and making other attractive and innovative offers. Service qualityhas come to stay as a significant differentiator of service organisations. Studies have been undertakenby various researchers to identify key drivers of service quality. This study seeks to identify the probablevariables affecting the service quality through factor analysis, and the major factors/indicators of servicequality. Service quality of six major mobile service-providers, operating in the Dehradun city, is soughtto be measured across these factors.
Key Words: Customer perception, Service quality, Service quality scale, Telecom industry
INTRODUCTION
THE Competition in the Indian telecomsector has immensely increased recently.While Airtel and MTNL were the only key
players during the nineties, there are around 30players of foreign and domestic origin operatingin India. Due to intense competition in theindustry, the service-providers are now comingup with attractive and innovative offerings towoo the customers, thereby grabbing a largershare of the pie.
The telecom network in India, with over 11million connections, is the fifth largest network inthe world. In terms of quality, the telecom industrymeasures up to global standards. The industry iscurrently estimated to contribute nearly one per
cent to India’s GDP. The total subscriber-basereached the 250 million mark in 2007. Whiledeveloping the Broadband Policy, 2004, theGovernment of India aimed at 9 million broadbandand 18 million Internet connections by 2007.Similarly, the wireless subscriber base alsoincreased to 62.57 million in 2004-2005. Thereafter,for three years, two out of every three newtelephone subscribers were wireless subscribers.Now, the wireless users account for 54.6 per centof the total telephone subscriber base, as comparedto 40 per cent in 2003. Wireless subscriber growthwas expected to be over 2.5 million newsubscribers per month by 2007. The wirelesstechnologies currently in use are Global System forMobile Communications (GSM) and CodeDivision Multiple Access (CDMA). There are 9
* Mr. Prakash Tiwari is Assistant Professor in Management in Dehradun Institute of Technology, Dehradun, Uttarakhand, e-mail:[email protected]
** Mr. Hemraj Verma is Senior Lecturer in Management in Dehradun Institute of Technology Dehradun, Uttarakhand, e-mail:[email protected]
07-Prakash Majumdar.p65 2/24/2009, 5:26 PM77

Prakash Tiwari and Hemraj Verma
78 NICE Journal of Business l Vol. 3 l Nos. 1 & 2 l 2008
GSM and 5 CDMA operators in India providingmobile services in 19 telecom circles and 4 metrocities, covering about 2000 towns across thecountry. The present study was conducted the cityof Dehradun, the capital town of UttarakhandState, where three types of service-providers, wereoperating: State-owned company (BSNL), privateIndian companies (Reliance Infocom, TataTeleservices, Airtel, Idea) and foreign companies(Vodafone and Bharti Tele-Ventures).
REVIEW OF LITERATURE
The term ‘quality’ seems to be kaleidoscopic inscope, as different authors have dealt with it intheir own ways. Berry, Parasuraman, andZeithaml (1985) stated that it inappropriate to useproduct-based definition of quality whenstudying the service sector, and therefore, theydeveloped the concept of ‘service quality’. It isone of the most important aspects which can givea company unmatchable competitive anadvantage. According to Berry, et al. (1985, 1988)service quality is the key differentiatingcompetitive instrument which all organisationswould like to own. Service quality has beendefined as the gap between the expected and theperceived level of service (Gronroos, 1984; Lewisand Mitchell, 1990; Parasuraman, et al., 1991;Dotchin and Oakland, 1994; Donnelly, 1996).Since services are perishable and intangible, theyhave a different connotation in relation to quality.Zeithaml and Bitner (1996) find it posing aproblem to organisations in their deliveringconsistent service quality.
Beardon, et al. (1979), Woodside, et al. (1989),Bitner and Mary Jo (1990), Reinchheld and Sasser(1990), Yi (1990), Bolton and Drew (1991), Croninand Taylor (1992), Boulding, et al. (1993), Zeithamland Bitner (1996), Spreng and Mackoy (1996),Zeithaml, et al. (1996), Cronin, et al. (2000), Bruhnand Grand (2000), and Suresh Chandar, et al.(2002) have tried to establish relationshipbetween service quality and some other customerfocused construct, viz., customer satisfaction,customer loyalty customer retention, etc. Croninand Taylor (1992), Teas (1993), Parasuraman, et al.
(1994), Harvey (1998), and Wisniewski (2001) alsodiffer on how to measure service quality.However, the lack of consensus between differentresearchers does not belittle the importance of themeasurement of service quality as the analysisand measurement is always an important firststep towards developing quality in services(Edvardsson, et al., 1994). This study also focuseson generating a customised index to measure theservice quality, based on the dimensions of theSERVEQUAL scale, of telecom service-providers inthe Dehradun Circle of Indian telecom industry andon the measurement of their service quality level.
OBJECTIVES AND HYPOTHESES
The study was conducted with the followingobjectives:
1. To identify the major factors Constitutingservice quality of telecom.
2. To measure customer perception of theservice quality of different companiesthrough the identified representativefactors for selected telecom service-providers.
3. To ascertain whether consumerperception of the service quality ofdifferent companies on the basis of theservice factors varies significantly.
Based on the above objectives, the followinghypotheses were formulatd:
H01: There is no significant difference inrespect of the information and recordsdimension among the different service-providers.
H02: There is no significant difference inrespect of the network dimensionamong the different service-providers.
H03: There is no significant difference inrespect of the promotion dimensionamong the different service-providers.
H04: There is no significant difference inrespect of the appearance dimensionamong the different service-providers.
07-Prakash Majumdar.p65 2/24/2009, 5:26 PM78

Service Quality in Telecom Industry
NICE Journal of Business l Vol. 3 l Nos. 1 & 2 l 2008 79
H05: There is no significant difference inrespect of the problem-solvingdimension among the differentservice-providers.
RESEARCH METHODOLOGY
The nature of this research is exploratory as aneffort has been made to explore the problemsfurther. The population for the study consists ofthe customers of all the telecom serviceproviders of Dehradun city. The study focuseson customer-service quality parameter for boththe private and the government sector telecomoperators in the Uttarakhand circle of Indiantelecom industry. The operators present in thisarea are Airtel, BSNL, Vodafone, Idea, TataIndicom and Reliance. Data was collected bysystematic random sampling of 200respondents. After eliminating the incompleteresponses and non-responses, a total of 172responses were considered for the analysis.
The scale required to measure the servicequality level was devised by generation of itemsfrom the existing models and from discussionwith industry experts. The first step afterunderstanding service quality construct was togenerate items (categories) that will help ineffectively measuring the service quality.
The Five-point Likert scale was used to measurethe perceived quality for different items over fourdimensions, viz., appearance, performance,knowledge and courtesy, and responsiveness(Parvinder Arora, Ajay Garg, and Amrita Singh,2007). These dimensions have been adapted by theresearchers from the five dimensions, viz., tangiblity,reliability, responsiveness, assurance, and empathyof the SERVQUAL scale given by Parasuraman(1985). However, keeping the superiority ofSERVPERF in mind, only customer perception aspecthas been measured and customer expectation hasbeen excluded. The list of variables used in theconstruction of scale is listed in Exhibit I:
Knowledge and courtesy
1. Timely information (information provided should betimely);
2. Accurate information (information provided shouldbe accurate);
3. Complete information (information provided shouldbe complete);
4. Courtesy (employees should be courteous whileaddressing the customer concerns);
5. Query handling knowledge (employees should havesufficient knowledge to answer the queries of customers).
Exhibit 1
List of Variables (Components of Service Quality used for Construction of Scale)
Appearance
1. Promotional material (brochures, pamphlets,invoices, and print advertisements);
2. Employee dress (uniformity and appearance of thepersonnel working at service centres);
3. Interior design (design of the service centre);
4. Proximity (location of the service centre).
Performance
1. Error free records (comprise bills, invoices);
2. Understandable (bills, invoices, etc. should be easyto read and understand);
3. Prior knowledge of service termination;
4. Network coverage, voice clarity;
5. Disconnection;
6. First instance call connectivity;
7. SMS delivery and commitment (delivering whateverit is promising and at the right time).
Responsiveness
1. Problem address (the responses to customerproblems should be prompt);
2. Timely action (appropriate action should be takenimmediately after addressing the problem);
3. Problem solving ability (the service provider shouldbe able to solve the customer problems);
4. Availability of employees (the staff should always beavailable for addressing the customer problems).
07-Prakash Majumdar.p65 2/24/2009, 5:26 PM79

Prakash Tiwari and Hemraj Verma
80 NICE Journal of Business l Vol. 3 l Nos. 1 & 2 l 2008
The data were entered into SPSS 13.0 foranalysis and various statistical tools were usedto gain further insights.
DATA ANALYSIS AND INTERPRETATION
A demographic profile of the respondents is givenin Table 1.
The distribution of respondents by theirservice-providers is shown in Table 2.
Factor Analysis
In order to reduce the total number of variablesto a smaller and manageable number, factoranalysis was carried out through SPSS. Theresults are given in Table 3.
Table 2
Distribution of Respondents by Service-providers
Service Number of Percentprovider Respondents
BSNL 24 14.0
Reliance 33 19.2
Tata Indicom 18 10.5
Airtel 56 32.6
Idea 23 13.4
Vodafone 17 9.9
Others 1 .6
Total 172 100.0
As shown in the variance table, six factorswere extracted (with more than one Eigen value),accounting for 55 per cent of the total variance,thus, making our model a reliable one.
All factors were rotated through the VarimaxRotation Method to find out how well eachvariable has loaded on to components thusextracted. The Rotated Component Matrix isshown in Table 4.
IDENTIFICATION OF DIMENSIONS
After a careful examination of the factor loadings,the 22 variables were associated with therespective dimensions (problem-solving,network, appearance, convenience, informationand records, and promotion). These are listed inTable 5.
As is evident (Table 6) from the mean ratingsof various mobile service providers across the sixextracted factors, while BSNL, Reliance and TataIndicom are perceived to be the best on networkdimension, Idea and Vodafone are rated as thebest in respect of information and records. As forAirtel, it has been perceived to be the best inrespect of consumer problem-solving.
While Reliance, Idea and BSNL got poorratings in respect of the appearance dimension,Tata Indicom and Airtel were perceived poor inrespect of promotion. Vodafone has been ratedpoor on consumer problem-solving.
Further, from a comparative analysis of the sixservice-providers on the basis of overall means
Table 1
Demographic Profile of Respondents
S.No Demographics Number Percentage
1. Sex
Male 108 62.8
Female 64 37.2
2. Education
Higher secondary or less 8 4.7
Graduation 83 48.3
Post graduation 74 43
Doctoral 7 4.1
3. Occupation
Service 54 31.4
Business 44 25.6
Student 40 34.9
Others 14 8.1
4. Age
Below 25 years 79 45.9
26 to 35 years 53 30.8
36 to 45 years 25 14.5
46 to 60 years 14 8.1
Above 60 years 1 0.6
5. Monthly Family Income
Less than Rs 10000 18 10.5
Rs 10000-25000 73 42.4
Rs 25001-50000 52 30.2
Rs 50001-1 Lakh 19 11
More than Rs. 1 Lakh 10 5.8
07-Prakash Majumdar.p65 2/24/2009, 5:26 PM80

Service Quality in Telecom Industry
NICE Journal of Business l Vol. 3 l Nos. 1 & 2 l 2008 81
Table 3
Total Variance Explained
Initial Eigen Values Extraction Sums of Rotation Sums ofSquared Loadings Squared Loadings
Component Total Per cent Cumulative Total Per cent Cumulative Total Per cent Cumulativeof Variance Per cent of Variance Per cent of Variance Per cent
1. 5.312 25.294 25.294 5.312 25.294 25.294 3.104 14.780 14.780
2. 1.795 8.546 33.840 1.795 8.546 33.840 2.628 12.512 27.292
3. 1.290 6.141 39.981 1.290 6.141 39.981 2.168 10.324 37.616
4. 1.183 5.634 45.615 1.183 5.634 45.615 1.411 6.717 44.333
5. 1.128 5.372 50.987 1.128 5.372 50.987 1.273 6.061 50.394
6. 1.037 4.940 55.927 1.037 4.940 55.927 1.162 5.533 55.927
7. 0.996 4.741 60.668
8. 0.974 4.639 65.307
9. 0.895 4.264 69.571
10. 0.848 4.040 73.611
11. 0.776 3.695 77.306
12. 0.707 3.365 80.671
13. 0.644 3.066 83.737
14. 0.636 3.030 86.768
15. 0.546 2.598 89.365
16. 0.465 2.217 91.582
17. 0.415 1.978 93.560
18. 0.398 1.898 95.458
19. 0.373 1.778 97.236
20. 0.324 1.540 98.776
21. 0.257 1.224 100.000
Extraction Method: Principal Component Analysis
Table 4
Rotated Component Matrix
Component Component Component Component Component Component1 2 3 4 5 6
‘Promotional material is attractive enough’ 6.054E-02 6.222E-02 1.789E-02 7.054E-02 7.068E-02 .777
‘Employees are well dressed’ 2.403E-03 9.663E-02 .172 .750 -.130 -1.079E-02
‘Service centre is well designed’ .281 5.468E-02 -2.285E-02 .663 .135 .161
‘Location of service centres is convenient’ 7.284E-02 .244 .548 .213 -2.326E-02 .363
‘Records are error free’ 9.916E-02 .421 6.685E-02 3.936E-02 .496 .138
‘Received documents are error free’ -1.537E-02 .555 .321 -3.538E-02 4.489E-02 .229
‘Service is terminated with your knowledge’ .178 .107 .181 -4.013E-02 .745 1.727E-02
‘Network is available every time’ .108 .727 3.535E-02 8.704E-02 3.892E-02 -3.899E-02
‘Voice is clearly audible’ .101 .532 .327 .110 .246 -.286
‘Calls are connected in first attempt’ 7.339E-02 .674 6.099E-02 8.612E-02 -2.231E-02 .123
‘SMS delivery is very fast’ .287 .703 -.211 -1.064E-02 .102 -4.676E-03
‘Promises made are fulfilled in time’ .168 8.832E-02 .783 7.916E-02 .135 -2.405E-02
‘Information is provided by the staff in time’ .538 7.756E-02 .498 -.163 2.731E-02 -7.242E-02
‘The staff provides complete information’ .677 9.602E-02 .138 .135 .100 .355
07-Prakash Majumdar.p65 2/24/2009, 5:26 PM81

Prakash Tiwari and Hemraj Verma
82 NICE Journal of Business l Vol. 3 l Nos. 1 & 2 l 2008
Table 5
Principal Components and Associated Variables
Customer Network Convenience Information Appearance PromotionProblem-solving and records
‘Staff provide Network is Promises made Service is Employees are Promotionalcomplete always available are fulfilled in terminated with well dressed material areinformation’ right time customer’s attractive
knowledge enough
‘Employees have SMS delivery Employees are Records are error- Service centrefull knowledge is fast courteous free is well-designedof the subject’
‘Staff provides Calls are Location of theaccurate connected in service centerinformation’ first attempt is convenient
‘Timely action is Voice istaken to solve clearly audiblethe problem’
‘Information Receivedprovided by the documents arestaff is timely’ easily
understandable
‘Service provider Frequentis capable of solving disconnectionthe problem’
‘Employees arealways available’
‘Employeespromptly respondto the problem’
Service Quality of Mobile Operators on Six Extracted Factors
‘The staff provides accurate information’ .667 .145 .211 .278 .102 7.182E-02
‘Employees are courteous while addressing’ .229 -6.902E-02 .525 8.375E-02 2.442E-02 -5.370E-04
‘Employees have full knowledge about query’ .662 2.486E-02 5.460E-02 .266 .145 -.218
‘Employees response to problems is prompt’ .705 .129 .102 -2.029E-02 -5.657E-03 6.314E-02
‘Timely action is taken to solve the problems’ .544 .290 .421 5.799E-02 .156 -4.865E-02
‘ The service provider is capable of .468 .166 .329 -.155 -.360 . 1 6 1solving problems’
‘Employees are always available’ .376 .341 .205 .304 -.376 -.116
Extraction Method: Principal Component Analysis, Rotation Method: Varimax with Kaiser Normalisation. a Rotation converged in 8iterations.
Table 6
Analysis of Overall Means of Service-Quality Dimensions
Service Customer Network Convenience Information Appearance. Promotion Overall RankProblem- and Meanssolving Records
BSNL 2.69 2.86 2.61 2.79 2.50 2.54 2.65 1
Reliance 2.42 2.76 2.47 2.70 2.21 2.21 2.46 2
Tata Indicom 2.63 2.67 2.31 2.58 2.36 2.00 2.42 3
Airtel 2.46 2.19 2.40 2.46 2.29 2.07 2.30 5
Idea 2.51 2.36 2.55 2.67 2.07 2.30 2.41 4
Vodafone 2.07 2.22 2.12 2.26 1.85 1.82 2.05 6
07-Prakash Majumdar.p65 2/24/2009, 5:26 PM82

Service Quality in Telecom Industry
NICE Journal of Business l Vol. 3 l Nos. 1 & 2 l 2008 83
of dimensions, it can be inferred that BSNL holdsthe first position among the service-providersoperating in Dehradun, in providing qualityservice. Both, Reliance and Tata Indicom haveoverall been perceived as 2nd and 3rd best,respectively. Vodafone was poorly rated bycustomers on the six extracted dimensions
HYPOTHESIS TESTING
One-way ANOVA was applied to test thesignificance of the difference between the meanvalues of various service-providers across the sixextracted factors.
One-way ANOVA for Information and Records
The necessary computations are shown in Table 7.
Hypothesis 1 (H01): There is no significantdifference in the information and records dimensionbetween the different service-providers.
One-way ANOVA results
Calculated value: 1.255
Degree of freedom: 6
Table value: 2.10
Inference: Since the calculated value is lessthan the table value the null hypothesis isaccepted. Hence, there is no significant differencein respect of the information and recordsdimension, among the different service-providers.
One-way ANOVA for ‘Network’
The relevant computations are shown in Table 8.
Hypothesis 2 (H02): There is no significantdifference in respect of the network dimensionamong the different service-providers.
Results
Calculated value: 6.482
Degree of freedom: 6
Table value: 2.10
Inference: Since the calculated value isgreater than the table value, the null hypothesisis rejected. Hence, there is a significant differenceon the network dimension between the differentservice-providers.
Hypothesis 3 (H03): There is no significantdifference in respect of the consumer problem-solving among the different service-providers.
Table 7
One-way ANOVA for ‘Information and Records’
Sum of the squares DF Mean square F Sig
Between groups 5.136 6 0.856 1.255 0.281
Within groups 112.555 165 0.682
Total 117.69 171
Table 9
One-way ANOVA for ‘Consumer Problem-Solving’
Sum of the squares DF Mean square F Sig
Between groups 4.464 6 0.744 2.153 0.05
Within groups 57.024 165 0.346
Total 61.488 171
Table 8
One-way ANOVA for ‘Network’
Sum of the squares DF Mean square F sig
Between groups 13,150 6 2.192 6.482 0.00
Within groups 55.791 165 .338
Total 68.941 171
07-Prakash Majumdar.p65 2/24/2009, 5:26 PM83

Prakash Tiwari and Hemraj Verma
84 NICE Journal of Business l Vol. 3 l Nos. 1 & 2 l 2008
Results
Calculated value: 2.153
Degree of freedom: 6
Tabulated value: 2.10
Inference: Since the calculated value isgreater than the table value, the null hypothesisis rejected. Hence, there is a significant differencein respect of consumer problem-solvingdimension among the different service-providers.
Hypothesis 4 (H04): There is no significantdifference in respect of the appearance dimensionamong the different service-providers.
Results
Calculated value: 3.045
Degree of freedom: 6
Tabulated value: 2.10
Inference: Since the calculated value isgreater than the table value, the null hypothesisis rejected. Hence, there is a significant differencein respect of the appearance dimension amongthe different service-providers.
Hypothesis 5 (H05): There is no significantdifference in respect of the promotional materialsamong the various service-providers.
Since the calculated value at 6 degree offreedom is 2.595, which is greater than the tablevalue of 2.10, the null hypothesis is rejected.Hence, there is a significant difference in respectof the ‘promotional material’ dimension amongthe different service-providers.
FINDINGS
After factor analysis, six components, viz.,consumer problem-solving, network,information and records, appearance,convenience and promotion, were identified.These components were able to explain 55 percent of total variance of 22 variables.
Individually, while BSNL, Reliance, and TataIndicom were perceived to be the best service-providers of telecom on their network dimension,Vodafone and Idea on their information andrecords dimension, Airtel was rated as the beston its ‘consumer problem-solving’ dimension.Overall, BSNL held the first position among allthe service-providers in Dehradun city in termsof the service quality, followed by Reliance andTata Indicom. Vodafone has been rated as thepoorest in service quality. Customer’s perceptiondid not vary significantly on information andrecords dimension of different service-providers.However, perception has varied quitesignificantly across the rest of the dimensions.
Table 10
One-way ANOVA for ‘Appearance’
Sum of the Squares DF Mean Square F Sig
Between groups 5.856 6 .976 3.045 0.08
Within groups 52.881 165 .320
Total 58.737 171
Table 11
One-way ANOVA for ‘Promotional Materials’
Sum of the Squares DF Mean Square F sig
Between groups 10.240 6 1.707 2.595 0.020
Within groups 108.528 165 .658
Total 118.767 171
07-Prakash Majumdar.p65 2/24/2009, 5:26 PM84

Service Quality in Telecom Industry
NICE Journal of Business l Vol. 3 l Nos. 1 & 2 l 2008 85
CONCLUSIONS
The study sought to measure the service-qualityconstruct for the Indian telecom operators withthe help of the scale devised by Parvinder Arora,Ajay Garg, and Amrita Singh (2007). Afterexamining the various service-quality modelslike SERVQUAL, SERVPERF and Garvini, thescale is constructed so as to consist of differentitems on six dimensions of consumer problem-solving, network, information and records,appearance, convenience and promotionalmaterials. The measurement of service quality isbased on the difference between the expected andperceived levels of service quality parameters.However, because of the superiority ofSERVPERF scale in measuring service quality,while only customer’s perception is captured theexpectations of customers have been ignored. Thestudy identified the BSNL as the clear winner.After beating its competitors on six out of the sixquality dimensions, its main challenge nowremains to maintain its winning position byworking on the records and informationdimension. Reliance has got the second positionafter beating its competitors on two out of the sixdimensions. These dimensions are ‘network’ and‘information and records’. However, primeconcerns for Reliance are its ratings on‘appearance’ and ‘promotional material’,whereas it manages to meet the customerexpectations on ‘convenience’ and ‘problem-solving dimensions’. Tata Indicom holds the thirdplace, with a strong position on its network andproblem-solving dimensions, but it needs toimprove on other four dimensions. Vodafone hasbeen rated rather poor on its service quality onall dimensions. Though the scale developed iscomprehensive enough in its reliability andvalidity, still remains to be tested in a futureresearch. Also, it remains to be seen if this scaleproduces similar results in other cities also.
REFERENCES
Arora, Parvinder, Ajay Garg, and Amrita Singh (2007),“Service Quality in Panjab Telecom Circle”, IndianJournal of Marketing , Vol. 5, No. 2, pp. 19-35.
Asubonteng, P., K.J. McCleary, and J.E. Swan (1996),“SERQUAL Revisited: A Critical Review of ServiceQuality”, Journal of Service Marketing , Vol. 10, No. 6,pp. 62-81.
Bearden, W.O., M. Crockett, and J.E. Teel (1979),“Alternative Framework for Predicting ConsumerComplaining”, in Beckwith N (eds.), et al., EducatorConference Proceedings , pp. 239-243.
Berry, L.L., A. Parasuraman, and V. Zeithaml (1985),“Quality Counts in Services Too”, Business Horizons(May-June), pp. 44-52.
Berry, L.L., A. Parasuraman, and V. Zeithaml (1988), “TheServices Quality Puzzle”, Business Horizons ,(September-October), pp. 35-43.
Bitner, M.J., and Mary Jo (1990), “Evaluating ServicesEncounter: The Effect of Physical Surroundings andEmployee Responses”, Journal of Marketing , Vol. 54,April, pp. 69-82.
Bolton, Ruth N., and James H. Drew (1991a), “ALongitudinal Analysis of the Impact Service Changeson Customer Attitude”, Journal of Marketing , Vol. 55(January), pp. 1-9.
Bolton, Ruth N., and James H. Drew (1991b), “A MultistageModel of Customer’s Assessment of Service Qualityand Value”, Journal of Consumer Research , Vol. 17(March), pp. 375-385.
Boulding, W., A. Kala, R. Staelin, and V. Zeithaml (1993), “ADynamic Process Model of Service Quality: FormExpectations to Behavioral Intentions”, Journal ofMarketing Research , Vol. 30, pp. 7-27.
Bruhn, M., and M.A. Grand (2000), “Theory Developmentand Implementation of National Customer SatisfactionIndices: The Swiss Index of Customer Satisfaction”,Total Quality Management , Vol. 11, No. 7 pp. S1017-1028.
Cronin, J., and S.A. Taylor, Jr. (1992), “Measuring ServiceQuality: A Re-examination and Extension”, Journal ofMarketing, Vol. 56, pp. 56-68.
Cronin, J., M. Brady, and G.T. Hult (2000), Assessing theEffects of Quality, Value and Customer Satisfaction onConsumer Behavioral Intentions in ServiceEnvironments, Journal of Retailing , Vol. 76, No. 2,pp. 193-218.
Dotchin, J.A., and J.S. Oakland (1994a), “Total QualityManagement in Services, Part I: Understanding andClassifying Services”, International Journal of Qualityand Reliability Management , Vol. 11, No. 3, pp. 9-26.
Dotchin, J.A., and J.S. Oakland (1994b), “Total QualityManagement in Services, Part II: Service Quality”,International Journal of Quality and ReliabilityManagement, Vol. 11, No. 3, pp. 27-42.
Dotchin, J.A., and J.S. Oakland (1994c), “Total QualityManagement in Services, Part III: DistinguishingPerception of Service Quality”, International Journal of
07-Prakash Majumdar.p65 2/24/2009, 5:26 PM85

Prakash Tiwari and Hemraj Verma
86 NICE Journal of Business l Vol. 3 l Nos. 1 & 2 l 2008
Quality and Reliability Management , Vol. 11, No. 4,pp. 6-28.
Edvardsson, B., B. Thomasson, and J. Ovretveit (1994),Quality of Services, Barrie Dale (London: Barrie Dale).
Gronroos, C. (1984), “A Service Quality Modal and ItsMarket Implications,” European Journal of Marketing ,Vol. 18, pp. 36-44.
Harvey, J. (1998), “Service Quality: A Tutorial”, Journal ofOperations Management , Vol. 16, pp. 583-597.
Juran, J.M. (1988), Juran on Planning for Quality . (New York:The Free Press).
Lewis, Barbara R., and Vincent W. Mitchell (1990),“Defining and Measuring the Quality of CustomerService,” Marketing Intelligence and Planning(November).
Parasuraman, A., L.L. Berry, and V. Zeithaml (1991a),“Perceived Service Quality as a Customer-basedPerformance Measure: An Empirical Examination ofOrganisational Barriers Using an Extended ServiceQuality Modal,” Human Resource Management (Fall),pp. 335-64.
Parasuraman, A., L.L. Berry, and V. Zeithaml (1991b),“Refinement and Reassessment of the SERVQUALScale,” Journal of Retailing (winter), pp. 420-450.
Parasuraman, A., L.L. Berry and V. Zeithaml (1994),“Refinement of Expectations as a ComparisonStandard in Measuring Service Quality: Implicationsfor Future Research,” Journal of Marketing, Vol. 58(January), pp. 111-124.
Reichheld, F., and W. Sasser (1990), “Zero Defects: QualityComes to Services”, Harvard Business Review(September-October), pp. 105-111.
Spreng, Richard A., and Robert D. Mackoy (1996), “AnEmpirical Examination of a Modal of Perceived ServiceQuality and Satisfaction,” Journal of Retailing , Vol. 72,No. 2, pp. 201-214.
Suresh Chandar, G.S., C. Rajendran, and R.N.Anantharaman (2002), “The Relationship betweenManagement’s Perception of Total Quality Service andCustomer Perceptions of Service Quality”, Total QualityManagement, Vol. 13 No.1, pp. 69-88.
Teas, R.K. (1993), “Expectations, Performance Evaluation,and Consumers’ Perceptions of Quality”, Journal ofMarketing, Vol. 57, pp. 18-34.
Wisniewski, M. (2001), “Using SERVQUAL to AssessCustomer Satisfaction with Public Sector Services”,Managing Service Quality , Vol. 11, No. 6, pp. 380-391.
Wisniewski, M., and M. Donnelly (1996), “MeasuringService Quality in the Public Sector: The Potential forSERVQUAL”, Total Quality Management , Vol. 7,pp. 357-365.
Woodside, A.G., L.L. Frey, and R.T. Daly (1989), “LinkingService Quality, Customer Satisfaction”, Journal ofHealth Care Marketing , December, pp. 5-17.
Yi, Y. (1990), “A Critical Review of Customer Satisfaction”,in Zeithaml V. (Eds), pp. 68-123, Review of Marketing(Chicago: American Marketing Association).
Zeithaml, V.A., and M.J. Binter (1996), Service Marketing(New Delhi: Tata McGraw-Hill Publishing Company).
Zeithaml V.A., L.L. Berry, and A. Parasuraman (1996), “TheBehavioral Consequences of Quality,” Journal ofMarketing, Vol. 60 (April), pp. 31-46.
Within a virtual market the real world truly is irrelevant,and the invisible hand becomes a blind hand, with no reason
to take account of how it affects other people, or future generations.
Geoff Mulgan, Connexity
H H H H H
Where wealth and freedom reign, contentment fails,and honour sinks where commerce long prevails.
Oliver Goldsmith, The Traveller
H H H H H
07-Prakash Majumdar.p65 2/24/2009, 5:26 PM86

MARKETING AND ECONOMY INTERLINKAGESA View of Rural India
Indrani Majumder*
Abstract
Marketing activities help in the quantification of the flow of physical elements within an economy,and provides value addition within an economy, thus promoting the economic growth. This papertries to explore the interrelationship between marketing activities of the organisations and the economicmagnification of a nation in the light of the rural marketing activities of organisations within Indiangeographical territory. The study reveals the pace of economic progress of the rural counterpart ofIndia after independence and simultaneously gives a focus on the marketing performance of somebusiness organisations ranging from FMCG to consumer durables as well as services. Ultimately inthe present study an attempt has been made to find out the direction of their relationship. The studyalso seeks to explore whether the marketing activities of the organisation really empowered the ruralIndia or not. The study suggests that ‘up-to-the-mark’ marketing activities are the pre-requisite for ahigh level of economic activity. It concludes that in today’s highly competitive IT milieu, the superfluousand efficient marketing activities, along with the product-enhancement strategies, can pull the businessconcerns to the peak of the power curve and thus the nation as a whole. It further concludes that thecustomer is the only foundation of any business unit; it is the customer who possesses the right tocreate employment and considering the society’s norms the organisations have to take the responsibilityto people so that they can supply wealth-empowering producing resources to the organisations andthe nation.
Key Words: Silent revolution, Economic modernisation, Rural totality, Capitalist interests,Empowerment.
INTRODUCTION
MARKETING consist of all the activitiesincluding processing and distributionwhich help to transfer the products
from the producers’ nest to the basket of finalusers. The physical element of marketingenables the transformation of goods and services
into a form desirable to the consumer, and thushelps to give a boost to the human well-being.In view of that, up-to-the-mark marketingactivities are the prerequisite for high economicdevelopment.
For an individual producer or marketer, themotivation behind the marketing activities may
* Indrani Mazumdar is Lecturer, Barrackpore Rastraguru Surendranath College, Barrackpore, North 24 PGNS, West Bengal 741 235;e-mail:[email protected]
COMMUNICATION
08-Indrani mazumdar.p65 2/24/2009, 5:32 PM87

Indrani Majumdar
88 NICE Journal of Business l Vol. 3 l Nos. 1 & 2 l 2008
be to get the most out of his own economicbenefits by utilising the available physical andhuman resources, but from the society’sviewpoint, the objective lies in encouraging theefficient allocation of available resources, whichis essential for economic development. Mar ketingimproves distribution of income betweendifferent sectors of the economy indirectly. Onlythrough properly planned marketing activities,stability of supply and demand for the goods andservices can be maintained and thus, an economycan be pushed into a stable pathway. Valueaddition is possible only through this exchangeprocess, because marketing is the only way ofquantification of the flow of physical elementswithin an economy and thus, it promotes theeconomic growth and creates wealth.
The emergence of market and marketingactivities provide comparative advantage,which in turn can make possible thedevelopment of an economy in isolation andoverall world development in integration. It’sthe marketing that makes mass productionpossible that usually gives positive return to theeconomy in both ways – revenue as well as cost.The benefits of the economies of scale can beenjoyed only if the market is there. And this, inthe reverse direction, creates a space formarketing activities and opportunity to themarketer. It has the power to convert today’sluxuries into tomorrow’s necessities. Withoutmarketing, either in local, national or in theinternational context, self-sufficiency anddiversification, for an individual or for a localcommunity or for a nation, to produce for theirown needs is essential which obviously lacks thereimbursement of comparative advantage.Specialisation results in efficiency in theutilisation of the resources which is the only wayto economic growth and development andexclusively through marketing activities this canbe gained. Employment opportunities to a largeextent, are created by marketing activities. In acountry like the USA, almost one-third to one-fourth of the total employed population areengaged in the field of marketing (Gupta andNair, 2002).
For market development to occur in its truesense, rural areas must be effectively linked,especially in an economy like India where morethan 70 per cent of the total population lives inrural areas. The rural development can beensured only if the marketer can work efficientlyto satisfy the people’s needs. Fromdevelopmental perspective, instead of amerchant, an organisation or entrepreneur mustbe a solution-provider while entering into therural region. If the entrepreneurs can take theresponsibility to make the rural peopleremarkable in the presence and assistance ofgovernment activities, rural places can be thesignificant source of money flow in the nearfuture. Rural markets can generate inter-cyclicalflow of return and an advanced rural economymay take care of the rural marketer which in turncan get a comparatively uplifted standard ofliving that stands to be the main requirement forthe development of an economy, provided it isassociated with the equality concern.
OBJECTIVE OF THE STUDY
Like any other economy, rural Indian economyis a comprehensive theme that virtuallyencompasses workforce development, land use,agriculture, education, infrastructure, anddemographics. The Indian Census reportsportray the village communities of India ascomparatively less densed, agriculture-dependant, less educated, with comparativelyhigher dependency ratio. And the fact is thatsmall and backward communities alone aregenerally deficient in taking action effectively.Such communities need to have adequateauthority that can tackle the concerns of all-round development of the entities of thosecommunities. If the business organisations cantake this responsibility along with thegovernment bodies, then only it may make aplatform for those organisations which they canuse for acting in the forthcoming days. Powerfuleconomy creates strong market, but the cause-and-effect relationship in the reverse way cannotbe denied. The investment made to make therural people aware about the goods and services
08-Indrani mazumdar.p65 2/24/2009, 5:32 PM88

Marketing and Economy Interlinkages
NICE Journal of Business l Vol. 3 l Nos. 1 & 2 l 2008 89
can generate demand within the market whichcan be fulfilled by ensuring sufficient anduninterrupted supply of those products. Theopportunity to put the human resources ineconomic activities may get daylight. Thisimplies a generation of income which isconsidered to be the main determinant of thestandard of living for an individual and theposition of an economy in a plural sense. Thismay further create a market that may yieldsignificant benefits to the organisations.
As an economy is all about people, likewisethe market consists of people only and aninterdependence of these two cannot beoverlooked. It is the market whose existencemakes the people of an economy able to get theirnecessities and to maintain their standard ofliving. It is the marketing that generates income.And it is the income that guides the taste andpreferences of the households and individuals,the affordability along with some other factors.In the light of the above objectives of the studyare the following:
1. To review the trends of India’s ruraleconomy after independence.
2. To explore the consumption scenario inrural India.
3. To examine the relationship between therural Indian economy and the ruralmarketing.
LITERATURE REVIEW
Progressive nations have shown a highlypositive, as high as 0.7, correlation between levelsof economic development and the levels ofentrepreneurial activities. Active and dynamicentrepreneurial activities resulted in strongereconomic performance where rural economycannot remain as an exception. This indicates aneed of setting activities by the organisations forthe rural region. Tactics required to meet thedemands for the rural consumers must be alignedwith the implicit developmental strategies. Therural marketplace put forward enough
opportunity to involve the rural folk, addressesthe issues like unemployment, and sustainablegeneration and mobilisation of resources. Thisbrings all-round economic development(Srivastava, 2006).
The contribution made by rural India for theexpansion and nourishment of the Indianeconomy is enormous (Das, 2006). Rural sectoraccounts for nearly 20 per cent of India’s economy(Firodia, 2007). Social scientists of the yester yearsdrew the picture of the Indian villages as virtuallyself-sufficient with very few ties to the outsideworld. But a new affluence is budding across therural India. The deep hole in between India’sblooming cities and gloomy rural hinterland isgradually narrowing. Where in 1990 a singlevillage person earned $100, its urbanite could do$ 82 extra and now the difference has come downinto $56. No longer the city dwellers can maypicture the country’s rural counterpart asprimitive, impoverished and irrelevant. Urbanprosperity is trickling down to the countryside(Giridharadas, 2005) though currently some partsare in the center of a crisis as a result of the failureof minimum support pricing system, andtendency of making profit out of poverty and outof livelihood security system (Chatterjee, 2007).
In the history of commerce the “Bottom ofthe Pyramid” — the sheer size—is consideredto be the biggest potential market opportunity.The very poor represent value-consciousconsumers. Chinese, Indian, Brazilian, Mexican,Russian, Indonesian, Turkeys, South African andThai, all together in one set, have morepurchasing power in comparison with the setthat consists of Japanese, German, Italian,French and British (Prahalad, 2004). If the“Bottom of the Pyramid” is looked at in acombined set, not each and every element inisolation, then considerable amount of thepurchasing power can be found. What isrequired is the proper innovation. Innovativeideas in all respects, ranging from the creationof utility to the delivery of all those utilities, canmaterialise the renovation of goods and servicesinto money. The entry may ensure a cyclical flow
08-Indrani mazumdar.p65 2/24/2009, 5:32 PM89
Indrani Majumdar
90 NICE Journal of Business l Vol. 3 l Nos. 1 & 2 l 2008
of benefits. The entry can offer a quality life andthus a regional economic development on onehand which tactfully the marketer can bag onthe other hand (Prahalad and Stuart, 2002).Mass-scale and extensive entrepreneurship is atthe heart of the solution to poverty. Several suchinstances are there on this earth. A partneringapproach, in association with governmental andcivil society organisations’ support, can createthe largest and fastest growing market(Prahalad, 2004).
The global phenomenon is that the lowerand middle-income groups only made theFMCG sector successful, where India cannotremain as an exception. Over 50 per cent of theFMCG sales are made to the rural India. Thespecialist rural marketing and ruraldevelopment consultancy, MART, has studiedthat about 53 per cent of FMCG sales and 59 percent of consumer durables sales were positionedin the rural areas. Apart from some lifestyle-based goods and services, the leadership in ruralIndia is the prime ingredient to gain leadershipin the product or brand (Raj, Selvaraj, 2007).Hindustan Lever Limited, the doyen of ruralmarketing, has been among the most effectiveconsumer-brand companies in reaching thepoorest of the poor in India by its ‘OperationBharat’, ‘Operation Shakti’, ‘OperationStreamline’, and in certain other developingcountries (Prahalad, 2004). Leading privatesector entities, such as Reliance, Shriram, Bharti,Mahindra, Nestle and Amul, Tata, ITC, and anyother source agro-products and in this way arenourishing the rural lives and graduallyempowering the rural people which, in turn,help all these organisations by placing theproduce of these companies into theirconsideration set (Das, 2006). ITC is engaged inconveying a ground-breaking dimension to itsrural partnership. The ‘e-choupal’ initiative ofITC is leveraging information technology to liftthe Indian farmer to a new order ofempowerment, and transforming the ruraleconomies. The company’s agro-basedbusinesses constitute a sustainable platform to
the Indian rural sector (Deveshwar, 2002). Tatagroup is well known for initiatives such asbuilding schools, women empowerment, etc.(Srivastava, 2006).
Rural market emerged as a commercialproposition to Indian marketers in the early70s. As a result of Green Revolution in the mid60s in some parts of rural India, the increasedpurchasing power changed the consumptionaspiration of the people in these areas. Thelarge amount of credit to rural areas,development of infrastructural facilities,remittances from outside played a vital role totransform the rural India into a cash economy.Urban consumption values have beenpercolated to rural India. And quite naturallythe marketers became aggressive to bag thatcash by playing the game with strategies thatsuit the changed values (Anitha, 1995). 700million people have the power to tip India’srole in the sphere of global economy from sellerto buyer. These can make the transformation ofIndia happen from a vendor of outsourcedskills to a source of consumers for the world’smerchandise. India’s villagers now account forthe majority of consumers spending in thecountry. The figure is more than $ 100 billionper year. Liberalisation policy of 1991 hasstarted to harvest its result in rural India andrural people have started moving graduallytowards delight from the economics ofnecessity. Multinational corporations, fromCoca-Cola to Nokia, arrive on the sceneincreasingly eager to understand Indianvillagers (Giridhardas, 2005).
A good successful business forms a part ofsociety. It exists to meet society’s needs. It is thepurpose of business at the highest level (Browne,2006). And every business enterprise has twobasic functions, viz., marketing and innovation.Moreover it’s the marketing activities that makethe business enterprises unique and help todistinguish the enterprise from the pull of otherlike entrepreneurs (Drucker, 2006). So marketingof goods and services determines the society’sdevelopment (Browne, 2006).
08-Indrani mazumdar.p65 2/24/2009, 5:32 PM90

Marketing and Economy Interlinkages
NICE Journal of Business l Vol. 3 l Nos. 1 & 2 l 2008 91
RURAL INDIAN ECONOMY
The village India is traditionally imaged as “ourcommon bread giver”. Around 700 millionpeople’s rural India (Figure 1) that directs theeconomic development of the country, presentsan enormous challenge and consequentlypresents an equally great opportunity, as like theurban counterpart of India, for making adifference in the lives of hundreds of its habitats.So the economic aspect of such a close knitcommunity has been the concern of manyresearchers. Rural India has always been viewedfrom the perspective of a social unit which hasexisted cohesively for centuries together.
Regardless of all political and social gospelsthis 70 per cent of the Indian economy, namelyrural economy, is predominantly in the red vigilantand really need a serious put-right. Thoughdecentralised infrastructural investment alongwith decentralised delivery enterprises is the keyto the revival of any economy, very little changehas taken place in the past decades in the villagesof India in these aspects. Though the movementaway from dependency to empowerment isevident in many Indian villages, but very littlechange has taken place in the past decades in the
villages of India as a whole. Still the villagers ofIndia, for their sustenance, are more or lessdependent on agriculture (Table 1), though thefigure is not 100 per cent. Unlike in the past, whe nthe ratio between those who involved inagriculture and in other business was 75-25, todaythe estimated ratio is closer to 60:40 1 (Table 2,Figure 2). The majority own some land, usually inscattered parcels (Table 3), but substantial numberrent all or part of the land they farm, either for cashor for an agreed-upon share of the harvest. Sharestypically range from one-third to one half theharvests. Many families and scheduled castes haveno land at all, and both adults and children arebound to sell their labor to the larger farmers. Withdrought, a common occurrence across all thegeographical area of India, the villagers sustaintheir life only with 12-18,000 (USD 240-360, USD1= INR50) per annum, as compared to the nationalaverage of Rs 25,000.2 In different media the phrase‘Rural India’ is synonymous with extreme poverty.
It is a vast tract of woefully poor people, wholabour under the scorching sun with rudeploughs and emaciated bullocks. But some Partof rural region has undergone significant socialand economic restructuring in last few years.
Figure 1: Time Series Scenario of Rural Population in India
Source: http://www.ud.camcom.it/internazionaliz/int_iniz/allegati%20india/furniture_report.pdf
Indo Italian Chamber of Commerce and Industry in Mumbai (India) on November 2006
Report on furniture industry in India
Rural Urban Total
1200
1000
800
600
400
200
01981 1991 2001
Rural, 159 Rural, 218Rural, 285
Urban, 524Urban, 629
Urban, 742Total, 683
Total, 846
Total, 1027
Pop
ulat
ion
inM
illio
ns
Year
08-Indrani mazumdar.p65 2/24/2009, 5:32 PM91

Indrani Majumdar
92 NICE Journal of Business l Vol. 3 l Nos. 1 & 2 l 2008
Table 1
Per 1000 Distribution of Rural HH and population by HH type during 1993- 94, 1999-00 and 2004-05
Self Employed in: Household Population
1993-94 1999-00 2004-05 1993-94 1999-00 2004-05
Agriculture 378 327 359 424 371 398
Non-agriculture 127 134 158 131 139 167
Self Employed 505 461 517 554 509 565
Agricultural Labour 303 322 258 275 301 241
Other labour 80 80 109 75 76 106
Rural Labour 383 402 367 350 376 346
Others 112 137 116 95 114 88
All 1000 1000 1000 1000 1000 1000
Source: NSS Report No. 515: Employment and Unemployment situation in India.
Table 2
Shares of Non-agricultural Workers in Rural India
Year Rural Rural + Urban
Male Female Person Male Female Person
1961 20.34 13.05 17.85 32.57 16.91 27.64
1971 18.82 12.84 17.53 32.51 19.18 29.88
1981 20.92 11.89 18.32 36.37 18.06 31.65
1991 22.49 10.88 18.74 39.15 17.57 32.99
2001 30.32 20.14 26.67 47.84 28.06 41.60
Source: Journal of Rural Development: (A Quarterly of National Institute of Rural Development), Vol. 24, Oct-Dec, No. 4, 2005
Figure 2: Rural Employment in India
Table 3
Per Thousand Distribution of Rural HHby Size Class of Land Cultivated During theAgricultural Years 1992-93, 1998-99, 2003-04
Size Class of land 1992-93 1998-99 2003-04cultivated hectares
Up to 0.40 575 632 621
0.41-1.00 171 168 171
1.01-2.00 135 112 113
0.412.01-4.00 76 59 65
0.414.01 & above 43 30 30
All Classes 10000 1000 1000
Note: The HH with size class of land cultivated up to 0.40hectares comprise HH cultivated land-less than 0.40hectares as well as HH reported no information onland cultivated
Source: NSS Report no. 515: Employment andUnemployment Situation in India.
08-Indrani mazumdar.p65 2/24/2009, 5:32 PM92

Marketing and Economy Interlinkages
NICE Journal of Business l Vol. 3 l Nos. 1 & 2 l 2008 93
Though the natural or physical attributes,the technological infrastructures that penetrateand/or manipulate rural spaces, and the socialrelationships among persons embedded in localand extra-local networks still reflect the ruraldistances, the time series data reflects the factthat it has conceived economic modernisation,as a process of gradual change from a simple,“village economy” to a diversified economy ofurban centres. With an ascending overall Indianeconomic trajectory, rising foreign exchangereserves, reducing inflation rates, globalrecognition of technological competence and the
interest shown by developed countries to investhere, rural territories do not remain just the sitesof production, rather rural spaces have becomedeeply complex and are subject to plural andoverlapping political and economic claims. Therural spaces are being “mapped and re-mapped”along with the lines of both local and societalstruggles over political rights and economicaccess. However, in some nonagricultural parts,traditionally urban functions , such as housing,manufacturing, services, recreation , etc. areevident. In some other parts, ‘rural populationturn around’3 is the scenario. Literacy rate
Table 4
Literacy Rate (per 1000 persons) by Sex and for Rural India during 1983 to 2004-05
NSS Round Not literate Literate & up Middle Secondary(Year) to primary & Above
Rural Male
61st (2004-05) 364 (320) 361(277) 140(191) 134(211)
55th (1999-00) 412 (372) 342(262) 126(178) 117(189)
50th (1993-94) 455 (411) 337(276) 109(154) 98(157)
Rural Female
61st (2004-05) 550(585) 293199) 89(113) 67(102)
55th (1999-00) 615(652) 260174) 75(96) 50(77)
50th (1993-94) 679(788) 230(166) 56(73) 34(53)
Note: For 38th, 43rd and 50th Rounds no separate category of social group ‘OBC’ was there and the category ‘others’included OBC category also.
Source: NSS Report, 61st Round (July 2004- June 2005)
Table 5
Number of persons employed per 1000 persons (WPR) according to theusual status (PS+SS) for different social groups during 1983 to 2004-05
NSS Round (Year) ST SC OBC Others All (incl. n.r.)
Rural Male
61st (2004-05) 562 545 537 557 546
55th (1999-00) 558 531 532 520 531
50th (1993-94) 591 554 – 547 553
43rd (1987-88) 567 538 – 5356 539
38th (1983) 588 551 – 540 547
Rural Female
61st (2004-05) 4646 333 330 262 327
55th (1999-00) 438 325 302 223 299
50th (1993-94) 482 355 – 297 328
43rd (1987-88) 454 358 – 294 323
38th (1983) 478 381 – 310 340Note: For 38th, 43rd and 50th Rounds no separate category of social group ‘OBC’ was there and the category others
included OBC category also.Source: NSS Report, 61st Round (July 2004- June 2005)
08-Indrani mazumdar.p65 2/24/2009, 5:32 PM93

Indrani Majumdar
94 NICE Journal of Business l Vol. 3 l Nos. 1 & 2 l 2008
gradually increases in the rural India (Table 4).Rural employment has gradually increased(Table 5). A lot of people, around 50-60 per cent,belonging to the second generation, are gettingwhite-collar jobs in nearby towns. There is agrowing middle class , with regular income andthe rural rich are becoming richer (Table 6).Between 1993-94 and 2000-2001 , the per capitarural income grew at the same pace as the urbanincome (Goswami and Bijapurkar, 2005) and it
is expected to grow further (Figure 3). The trendsin development, the decrease in the below-poverty-line percentage (Table 7, Figure 4) andits pace in India’s rural spaces can be said togrowing be by the process of urban-ruralintegration and counter urbanization. While therural totality comprises three facets, viz.,(1) rural localities reflected through distinctivepractices, linked to production and/orconsumption, (2) formal representations of therural, such as those expressed by capitalistinterests, cultural arbiters, planners orpoliticians and (3) everyday lives of the rural,these three are gradually changing positively.
In India, we have the developed rural Indiaand the undeveloped rural India. Punjab,Haryana, Tamil Nadu, Andhra Pradesh, Kerelaand parts of Maharashtra come under thedeveloped rural India but the rest areundeveloped where power, infrastructure, etc, are
Table 6
Rising Rural Prosperity
Income Group 1994-95 2001-02 2006-07
Above Rs 1,00,000 1.6 3.8 5.6
Rs 77,001-1,00,000 2.7 4.7 5.8
Rs 50,001-77,000 8.3 13.0 22.4
Rs 25,001-50,000 26.0 41.1 -
Rs 25,000-below 61.4 37.4 20.2
Note: Projections based on 7.2 per cent GDP growthSource: Kumar, 2004
Table 7
Poverty (Proportion of Population Below Poverty Line)
India (official) 1951- 1961- 1973- 1977- 1983 1987- 1993- 1999- 2004-1952 1962 1974 1978 1988 1994 2000 2005
Rural India 47.4 47.2 55.7 53.1 45.7 39.1 37.3 27.1 …….
Urban India 35.5 43.6 48.0 45.2 46.8 38.2 32.4 23.6 …….
Combined 45.3 46.5 54.1 51.3 44.5 38.9 36.0 26.1 22.0
Source: http://www.imf.org/external/np/tr/2006/pdf/india.pdf
Figure 3: Projected Household Income Growth in RuralIndia
Source: Mckinsey Global Institute http://www.scribd.com/doc/4 7 9 45 /McKinsey-MGI- india -consumer- full-report
Figure 4: Projected Rural Poverty in India
Note: Figures are rounded to the nearest integer andmay not add up to 100 per cent.
Source: MGI India Consumer Demand Model, v1.0h t t p : / / w w w . s c r i b d . c o m / d o c / 4 7 9 4 5 /McKinsey-MGI-india-consumer-full-report
08-Indrani mazumdar.p65 2/24/2009, 5:32 PM94

Marketing and Economy Interlinkages
NICE Journal of Business l Vol. 3 l Nos. 1 & 2 l 2008 95
big problems. Rural India is like a pyramid. Thetop of the pyramid is occupied by the rich farmersand businessmen. They constitute 5 per cent ofthe population. The next level belongs to thosewith a regular income and the base of thepyramid is occupied by the vast majority of thepeople who are daily wage labourers.
Rural India is caught in so called developmenttrap. Low incomes of the rural households aredue to the lack of economic opportunities. Mostof the people in rural India are unable to pay forgoods and services. As a result organisations feelit costly to do business in rural areas which leadsto inadequate provision of infrastructure and thatin turn leads to the lack of economic opportunitiesand so on. Studies indicate that even urbanpoverty is predominantly due to the fact ofimpoverishment of rural peasantry which forcesthem to move out of villages to seek somesubsistence living in towns and cities. Thoughthere have been a number of schemes andprogrammes which have been attempted by thestate and the central governments and a fewforeign agencies to address the question of ruralpoverty, many of them have only marginal effects.Maximum percentage of the people in the poorlyconnected villages live on a low productivityagriculture, cattle rearing and related casualwork. Due to inability to value addition, most ofthe villages are always at subsistence levels. Poorvillage people always do distress sale. But in future
the rising consumption of rural India (Figure 5)and rising trends in economic performances canprovide ray of hope.
Rural Indian Market
Rural Indian market is morphing at anunthinkable rapid rate. In last few years India’srural markets have seen a lot of activities. Inseveral categories, rural India has alreadyaccounted for the lion’s share. Within 1993-94and 2000-2001 per capita income of rural Indiagrew at the same pace as urban income. With
Figure 5: Indices of Real Per Capita Consumption by Fractile Groups
Source: Ghosh, 2004
Figure 6: Projected Consumption Growth in Rural India
Source: MGI India Consumer Demand Model, v1.0http://www.scribd.com/doc/47945/McKinsey-MGI-india-consumer-full-report
08-Indrani mazumdar.p65 2/24/2009, 5:32 PM95

Indrani Majumdar
96 NICE Journal of Business l Vol. 3 l Nos. 1 & 2 l 2008
Figure 7: Project Per Capita Consumption in Rural India
Source: MGI India Consumer Demand Model, v1.0http://www.scribd.com/doc/47945/McKinsey-MGI-india-consumer-full-report
Figure 8: Aspirers Will Drive Rural Spending Over theNext Two Decades
Note: Figures are rounded to the nearest integer andmay not add up to 100%.
Source: MGI India Consumer Demand Model, v1.0http://www.scribd.com/doc/47945/McKinsey-MGI-india-consumer-full-report
this reality the rural consumption is alsogrowing at a faster pace and as per McKinseyMGI, India’s study, in the next 10 years it mayincrease at a rate of more than 5 per cent (Figure6 & 7). The rural persons, belonging to the topquartile of rural India have been higher spendersthan the average. Their expenditure patterns arequite similar to that of urban India (Goswamiand Bijapurkar, 2005). And another hope is thatthe rural aspires will drive the spending in nextdecades (Figure 8). Penetration levels are prettyhigh in most product categories in the urbanareas. But the rural scenario is not at all
Table 8
Product Penetration Rate, 2006 (%)
Category All India (%) Urban (%) Rural (%)
Deodorants 2.1 5.5 0.6
Toothpaste 48.6 74.9 37.6
Skin cream 22.0 31.5 17.8
Shampoo 38.0 52.1 31.9
Utensil Cleaner 28.0 59.9 14.6
Instant Coffee 6.6 15.5 2.8
Washing Powder 86.1 90.7
Detergent Bar 88.6 91.4 87.4
Toilet soap 91.5 97.4 88.9
Source: MRUC, Hansa Research – Guide to Indian Markets2006, HLL investor presentation, June 2006
Table 9
Estimated Size of the Rural Market
FMCG Rs. 50,000 crores
Durables Rs. 50,000 crores
Agri-inputs (incl. tractors) Rs. 45,000 crores
2&4 wheelers Rs. 8,000 crores
Total Rs. 1,08,000 crores
Source: NCAER, IMDR 2002, Francis Kanoi, 2002
Table 10
Product Penetration in Rural India in 2002
Category Market Urban Rural TotalSize pene- pene- pene-(US$ tration tration tration
Million) (%) ( %) (%)
Fabric Wash 1210 89.6 82.9 84.9
Personal Wash 938 97.9 90.7 92.8
Packet Tea 635 91.2 82.2 84.9
Tooth Paste 409 69.8 32.3 43.5
Skin 312 36.6 19.8 24.7
Hair Wash 230 40.1 16.3 23.3
Talcum Powder 148 66 36.8 45.1
Branded Atta 107 44 30.2 34.3
Dish Wash 102 54.6 11.5 24.4
Instant Coffee 55 – – –
R & G Coffee 30 – – –
Ketchups 25 12.5 0.7 4.2
Deodorants 19 – – –
Jam 13 – – –
Source: Fast Moving Consumer Goodshttp://www.arc.unisg.ch/org/arc/web.nsf/f1d9ed904340e51ac1256a8d00504269/43cfocaeed566facc 12571d30061daac/$FILE/India%20symposium_IBEF_Sectoral%20Reports_FMCG.pdf
08-Indrani mazumdar.p65 2/24/2009, 5:32 PM96

Marketing and Economy Interlinkages
NICE Journal of Business l Vol. 3 l Nos. 1 & 2 l 2008 97
negligible. With the passage of time, it isgradually increasing (Table 8, 9, 10) and thefuture growth can come only from deeper ruralpenetration and higher consumption. Inassociation, the road development projects andthe distribution networks improve and ruralincome increases, the penetration levels are setto increase.
With the presence of 12.2% of the worldpopulation in the villages of India, the Indianrural FMCG market provides a vast opportunity(equitymaster.com, 2007). As per ASSOCHAMestimation, rural market scenario for the currentyear 2007 is revealing the fact of 52 per cent oftotal FMCG market in India and an expectationis that it will grow by 10 per cent by the year2010. The domestic FMCG total size in terms of
Figure 9: FMCG Market Scenario in Rural India
volume is currently (2007) US$ 15 billion ofwhich US$ 7.9 billion is rural contribution asagainst US$ 4.2 billion of urban and metros andUS$ 2.85 billion is the semi-urban FMCG market.And in some cases such as for personal care,fabric care, hot beverages, rural India’s share ismore than 40 per cent (Economic Times, March10, 2006). And the expectation that the totalnumber of rural households will rise from 135million in 2001-02 to 153 million in 2009-10, isobviously depicting the increase in Indian ruralmarket potentiality. The annual size of the ruralFMCG market has been estimated at US$ 10.5billion in the year 2001-02 after a certain declinein the past 3 years (Figure 9). And with the risingtendency of income of the rural people one canexpect a further expansion of rural market inIndia.
In Mumbai and New Delhi corner offices,executives have long recognized that to build realsales volumes they will have to reach outside thebig cities. According to MART, a New Delhi-based research organization that offers ruralsolutions to the corporate world, rural India buys46 per cent of all soft drinks sold, 49 per cent ofmotorcycles and 59 per cent of cigarettes. Thistrend is not limited just to utilitarian products. 11per cent women in rural India use lipstick andperhaps the figure is quite significant (Whaston,2009).
One study by NCAER in 2001-02 revealed thefact that rural Indian market accounted for 55 percent of LIC’s total policy sales. And as per NCAERreport the story is more or less same forwristwatches, dry cells, cassette recorders and forsuch other things. For food and beverages alsothe picture is not so ignorable (Table 11).According to New Delhi based BS CorporateBureau, by doubling the number of outlets inrural areas from 80,000 in 2001 to 1,60,000 in 2003Coca-Cola India became able to achieve a higherpenetration rate from 13 to 25 per cent. Rs. 5 packenabled the company to reap rich dividends interms of sales. From multinational high-techconsumer durable companies to Chinese mobile-phone makers; from global information
08-Indrani mazumdar.p65 2/24/2009, 5:32 PM97

Indrani Majumdar
98 NICE Journal of Business l Vol. 3 l Nos. 1 & 2 l 2008
Table 11
Food And Beverages (Rural India and Zonal Penetration)
Packaged Packaged Soft Drinks ChocolatesEdible Oil (%) Biscuits (%) (%) (%)
Rural 2000 2005 2000 2005 2000 2005 2000 2005
India 8.7 13.7 39.1 54.2 9.8 12.2 2 2.7
North 5.4 10 53 66.6 7.5 12.6 1.6 1.9
South 7.2 22.9 25.5 44.3 18.9 22.6 3.6 4.7
East 6.4 9.1 36.6 55.9 4.2 6.6 1.1 1.9
West 17 13.9 42.2 47.9 10.2 8.4 2.2 2.6
Source: Guide to Indian markets 2006: An indispensable guide with distilled insights on Indian consumers and markets:Presented by Hansa Research and Media Research Users Council http://www.hansaresearch.com/IM_2006_Booklet.pdf.
technology giants such as Microsoft to back-office service providers; global telecom andbiotechnology companies, and even India’s IT-sector lobbyist, the National Association ofSoftware Services Companies (NASSCOM), arestepping out of the cities and moving to thevillages of India (Basu, 2007). The penetrationscenario of durables in rural Indian market isquite pretty (Table 12, 13). As per a research reportby Hansa Research Guide to Indian Markets,2006, Color TV sales were by 200 per cent,motorcycle sales, by 77 per cent, and refrigeratorsales, by 31 per cent. The recreation sector is alsogradually entering into the rural hinterland(Figure 10). The rural people are graduallybecoming health conscious and making thehealth sector interested to take entry there (Figure11). The telecom sector is also penetrating at ahigher pace (Table 14).
Table 12
Durables and Transportation (Rural India and Zonal Penetration)
Refrigerator % Motor Cycles % Tractor % Bicycle %
Rural 2000 2005 2000 2005 2000 2005 2000 2005
India 3.2 4.2 3 5.3 1.8 2.3 43.7 51.1
North 5.7 7.6 3.5 6 3.2 4.9 53.8 60.6
South 3.7 4.6 2.6 4.6 1.9 1 35 36.4
East 0.7 1 1.6 3.4 0.5 0.8 47.8 60
West 2.5 4 4.7 7.7 1.6 2.8 37.8 44.1
Source: Guide to Indian Markets 2006: An Indispensable Guide with Distilled Insights on Indian Consumers and markets: Presented byHansa Research and Media Research Users Council http://www.hansaresearch.com/IM_2006_Booklet.pdf
ECONOMY AND MARKETINGEQUIVALENCE OF RURAL INDIA
Studies conducted so long have revealed the factthat more than 50 per cent of our national incomeis originating from rural India. This was thetruth of early centuries and this is also the truthof this 21st century. At present a silent revolutionis taking place all over the rural India - arevolution that empowers rural people to agreater extent and help to make their lives better.The basic nature of rural economy hasundergone a fundamental transformation. Withthe transfers of rural employment towards themanufacturing sector and especially in theservice sector, the scenario which can be noticedis the mobility of rural economy towards higherincome groups. Facts and figures of rural Indiaare telling us that the rural income is graduallyincreasing, though at a lower pace. Below thepoverty line figure is gradually decreasing in
08-Indrani mazumdar.p65 2/24/2009, 5:32 PM98

Marketing and Economy Interlinkages
NICE Journal of Business l Vol. 3 l Nos. 1 & 2 l 2008 99
Table 13
Penetration Rate of Refrigerators in Villages of India , 2006
All Refri- Refrigerator Refrigerator Year sinceIndia gerator type Size acquired
owner- Only Only 165 & 166-279 280 lts Up to 10 yrsship Frost Defrost less % Lts % & more 2 years & more
free % % % % %
HHs (000s) 207206 24385 5221 19093 20436 3028 829 5338 5333
Pop Strata
5,000+ villages 31778 2288 19.5 80.5 87.2 10.5 2.2 23.3 17.6
1000-5000 villages 85514 3093 14.2 85.8 91.7 7.3 1.0 27.4 15.2
Below 1000 villages 28457 770 13.4 86.6 94.2 5.7 - 34.2 8.7
Penetration rate of Top 5 Brands of Refrigerator
All India North South East West
All U R U R U R U R U R
HHs 207206 61457 145749 15719 37740 17932 34954 9781 42109 18025 30946
Brands
Godrej 7460 5588 1871 2038 993 1085 463 559 77 1906 339
Kelvinator 4711 3540 1172 1638 571 510 252 481 105 911 244
Whirlpool 3533 2557 976 1010 486 494 257 319 81 735 152
LG 1850 1427 423 577 177 250 79 146 37 455 130
Videcon 1801 1317 485 400 163 269 150 111 24 356 147
Source: Guide to Indian markets 2006: An indispensable guide with distilled insights on Indian consumers and markets:Presented by Hansa Research and Media Research Users Council http://www.hansaresearch.com/IM_2006_Booklet.pdf
Figure 10: Rural Recreation Spending
Source: MGI India Consumer Demand Model, v1.0 http://www.scribd.com/doc/47945/McKinsey-MGI-india-consumer-full-report.
08-Indrani mazumdar.p65 2/24/2009, 5:32 PM99

Indrani Majumdar
100 NICE Journal of Business l Vol. 3 l Nos. 1 & 2 l 2008
F6igure 11
Source: MGI India Consumer Demand Model, v1.0 http://www.scribd.com/doc/47945/McKinsey-MGI-india-consumer-full-report
Table 14
Rural Teledensity, 2001
Telecom circle Urban Rural Total
Andaman & Nicobar 14.36 5.15 7.63
Andhra Pradesh 9.77 1.54 4.06
Assam 9.09 0.25 1.33
Bihar 4.85 0.24 0.94
Gujarat 11.73 1.54 5.37
Haryana 11.63 1.44 4.25
Himachal Pradesh 25.00 3.34 5.31
J & K 6.58 0.13 1.72
Karnataka 10.28 1.80 4.70
Kerala 12.33 5.32 7.51
Madhya Pradesh 5.74 0.36 1.81
Maharashtra 13.61 1.39 6.60
Orissa 6.51 0.51 1.52
Punjab 15.29 2.67 6.95
Rajasthan 7.57 0.86 2.57
Tamil Nadu 15.05 0.43 5.91
Uttar Pradesh 6.11 0.34 1.66
West Bengal 8.10 0.51 2.67
Delhi 20.67 0.00 17.66
India 10.16 0.93 3.58
Source: AcrossWorld Communications (September 2001) Nov, 2001 by Sanjima DeZoysa
rural India. Academic exploration revealed thefact that within the time period of 1985-2005 therural household income increased at the rate of2.8 per cent and considering the scenario ofevery spheres of rural economy, researchesprojected that within next 20 years it willincrease at the rate of 3.6 per cent. Abide by the“Circular Flow of Income” theory it can then besaid that utility-money exchange process is oneand only source of people’s income within aneconomy, which defines marketing process asthe only means through which growth ofnational income can be experienced. All humanbeings in this world are getting their income byrendering their physical or mental effort s to theorganisations that makes the flow of benefitsready-for-use, either by any kind of end-user(individual or organisation) or by anotherintermediary organisation. This earning enablesthem to afford the produced goods and services.So one can easily make an inference about theinterdependence of marketing activities andstate of an economy.
As per the study, within the time period 1985-2005 the rural consumption growth was 3.9
08-Indrani mazumdar.p65 2/24/2009, 5:32 PM100

Marketing and Economy Interlinkages
NICE Journal of Business l Vol. 3 l Nos. 1 & 2 l 2008 101
per cent and it has been projected that it may be5.1 per cent for next 20 years. One thing is to benoted here that the consumption growth of last20 years was higher than the income growth inthe rural sector of India. The essential questionthat may arise quite naturally, here, that how itwas possible and how it would be possible.Obviously, it is the financial assistance from somenon-governmental agencies and fromgovernment that made it possible and perhapswill make it possible in near future also. And it isgiving an indication of penetration of financialservices in rural areas. So again the role ofmarketing one can’t ignore.
CONCLUSION
With the gradual increase of the percentage ofrural aspires, and the decrease of numbers of therural population in the deprived section, the ruralconsumption of household products,consumption of durables, food and beverages,all increased at a significant rate and it has beenprojected that it will be able to maintain the trend.The FMCG sector penetration rate in the ruralIndia is even higher, nowadays, than the urban.Now consumption presumed the production orvalue addition activities first of all and marketingactivities as ultimate within the economy. Thusit is the economy that places demand to themarketer and it is the marketing that generatesincome and help the nation to fulfill the demand,which provides a quite closer equivalence of thetwo – economy and marketing.
The rural bazaar is booming beyondeveryone’s expectations. But the requirement forthe business organisations to get sufficientreturn from those rural markets is that theirpurpose must lie outside the business itself. Abusiness enterprise is an organ of a society. Thecustomer is the only foundation of a businessunit and keeps its existence. It is the customerthat alone possesses the right to createemployment. So considering the society’snorms, the organisations have to take theresponsibility to make people capable so that
they can supply wealth-producing resources tothe organisations and at the same can give valueto the society.
REFERENCES
Anitha, H. S.(1995), “Rural Marketing: No more a ThudArrow in Marketers Quiver”, Indian Journal ofMarketing, Vol. 24, No. 9-10, pp. 19-22.
Browne, Lord John (2006), A Speech on “The Purpose ofbusiness”, Organized by BP Global, MIT, Boston, 2May, 2006. http://www.bp.com/genericarticle.do?categoryId=98&contentId=7017837(accessed on 05.08.07).
Chatterjee, Somnath (2007), “Rural India: DevelopmentalChallenges”, Address on 26th Annual Convocation ofthe Institute of Rural Management, Anand (IRMA),Gujarat, 3 April 2007, http://speakerloksabha.nic.in/Speech/SpeechDetails.asp?SpeechId=210, (accessed on 09.07.2007).
Das, Sudhansu R (2006), “Villagescope—Reviving the RuralEconomy”, The Hindu Business Line: Tuesday, Feb 14,2006. http://www.thehindubusinessline.com/2006/02/14/stories/2006021400381100.htm (accessed on 09.07.2007).
Deveshwar, Y.C. (2002), “Transformational Change InRural India: ITC: An Inspiring Agenda”, Speech by theChairman, at the 91st Annual General Meeting of ITCLimited in Kolkata, India on July 26, 2002 . http://www.itcportal.com/chairman_speaks/chairman_2002.html(accessed on 09.07.2007) .
DeZoysa Sanjima (2001), “India’s Rural Reality - Industry &Market Update”, Telecommunications International , Nov,2001, http://findarticles.com/p/articles/mi_m0IUL/is_11_35/ai_82607749.html (accessed on 09.07.2007).
Drucker, Peter 2006, “The Purpose of Business”, RSS Feed,Bloglines, AUGUST 3, 2006. http://www.yourbusinesscoach.net/trackback/4/4/DisplayFullText/5671, (09.07.2007).
Firodia, Arun (2007), “Another Good Year for Urban India;What about Rural Bharat?” Domain- b.com, 28February 2007.http://www.domain-b.com/economy/budget/union_budget_2007/20070228_arun_firodia.html(accessed on 09.07.2007).
Ghosh, Jayati (2004), “Income Inequality in India”,International Development Economics Associates,Political Economy, Februray 9, 2005, http://www.networkideas .org /themes/pol it ical / feb2004/po09_Income_inequality.htm (accessed on 17.04. 2007).
Giridharadas, Anand (2005), “Poor rural India? It’s a RicherPlace”, International Herald Tribune Asia-Pacific,October 19, 2005. http://www.iht.com/articles/2005/10/18/business/rural.php. (accessed on 05.07.2007).
Goswami Omkar, and Rama Bijapurkar (2005) “India is notJust about Agriculture”, http://in.rediff.com/money/2005/jul/16guest.htm (accessed on 05.08.07).
08-Indrani mazumdar.p65 2/24/2009, 5:32 PM101

Indrani Majumdar
102 NICE Journal of Business l Vol. 3 l Nos. 1 & 2 l 2008
Gupta, C. B. and N. Rajan Nair (2002), MarketingManagement, 7th ed. (New Delhi: Sultan Chand & Sons),pp. 1.12-1.13.
Jain, Rajesh (2003), “Transforming Rural India”, i4donline,Issue: “A vision for rural India”, July-August, 2003.h t t p : / / w w w . e m e r g i c . o r g / c o l l e c t i o n s /tech_talk_transforming_rural_india.html (accessed on07.06.07).
Kumar, C. Rajendra and Sanjay S Kaptan (2004), “ChangingFace of Rural Marketing”, Kurukshetra,Vol. 52, No. 6, April 2004.
Meijering, Louise, Bettina van Hoven and Paulus Huigen(2007), “Constructing Ruralities: The Case ofHobbitstee, Netherlands”, Journal of Rural Studies,Vol. 23, issue 3, July 2007, “The Changing Face of RuralPopulation”, pp. 357-366.
Prahalad, C.K. (2004), “The Fortune at the Bottom of thePyramid: Eradicating Poverty through Profits”,Wharton School Publishing, August 25, 2004 inKnowledge@Wharton. http://knowledge.wharton.upenn.edu/indiaarticle.cfm?articleid=4032 (accessed on 09.07.07)
Prahalad, C.K. (2004), “Marketers Must Seek Their ‘Fortuneat the Bottom of the Pyramid”, March 10, 2004 inKnowledge@Wharton. http://knowledge.wharton.
upenn.edu/india/article.cfm?articleid=4030 (accessed on09.07.07).
Prahalad, C. K., and Stuart Hart (2002), “The Fortune at theBottom of the Pyramid,” in Strategy + Business, issue26, first quarter 2002, pp 54-67. http://www.cs.berkeley.edu/~brewer/ict4b/Fortune-BoP.pdf.(accessed on 02.08.2007).
Raj, S John Mano, and P Selvaraj (2007), “Social Changes andthe Growth of Indian Rural Market: An Invitation ToFMCG Sector”, Presented on International MarketingConference on Marketing & Society, 8-10 April, 2007,IIMK, http://dspace.iimk.ac.in/bitstream/2259/381/1/103-110.pdf (accessed on 09.07.07).
Rajan, R. V. (2005), “Rural India Getting Richer? You bet!The Rediff Interview, June 2, 2005, rediff.com. http://www.rediff.com/money/2005/jun/02inter.htm. (accessedon 09.07.2007).
Sanjima, DeZoysa (2001), “India’s rural reality - Industry &Market Update”, Telecommunications International,Nov, 2001, http://findarticles.com/p/articles/mi_m0IUL/is_11_35/ai_82607749 (accessed on 02.08.2007).
Srivastava, Ritu (2006), “Rural India: Collaborating forOverall Economic Development”, Kurukshetra, Vol. 54,No. 8, June 2006,pp. 3-7.
Vision paints the picture of what we want to create.Systems thinking reveals how we have created what we currently have.
Peter M. Senge, The Fifth Discipline
H H H H H
Unregulated markets create and reinforce hierarchy by allowingthe strong to get stronger and the rich to get richer.
Steven E. Miller, Civilizing Cyberspace
H H H H H
Beyond this never earn, make no effort to increase fortune,but spend the surplus each year for benevolent purposes.
Andrew Carnegie
08-Indrani mazumdar.p65 2/24/2009, 5:32 PM102

* Deepa Sharma is Senior Lecturer in Commerce, Maharaja Agrasen College, University of Delhi, Mayur Vihar 1, Delhi – 110 091;e-mail: [email protected]
A. BOOKS
Aaker, David, and George S. Day, Consumerism: Searchfor the Consumer Interest (New York: Free Press,1971).
Agarwal, V.K., Consumer Protection: Law and Practice , 6th
ed. (Delhi: BLH Publishers’ Distributors, 2008).
Arora, Renu, Consumer Grievance Redressal (Delhi:Manak Publications, 2005).
Bhashyam, G., Consumer Protection in India: A Study ofSelect Consumer Forums in Andhra Pradesh ,unpublished Ph.D thesis, Department ofCommerce, Osmania University, Hyderabad (2000).
Best, Arthur, When Consumers Complain (New York:Columbia University Press, 1981).
Berelson, Bernard, and Gary A. Steiner, HumanBehaviour: An Inventory of Scientific Findings (NewYork: Harcourt, Brace Jovanovich, 1964).
Cartwright, Roger and George Green, In charge ofCustomer Satisfaction (New York: BlackwellPublishers, Inc., 1977).
Cook, Sarah, Customer Care, 2nd ed. (London: KoganPage Limited, 1997).
Cross, Richard and Janet Smith, Customer Bonding :Pathways to Lasting Customer Loyalty(Lincolnwood, IL: NTC Business Books, 1995).
Denny, William Michael, and Robert T. Lund (eds.),Research for Consumer Policy (Cambridge, Mass:Centre for Policy Alternatives, M.I.T., 1978).
Freemantle, David, Incredible Customer Service: The FinalTest (New York: McGraw-Hill Publishing Co.,1993).
CONSUMER GRIEVANCE REDRESS
A BIBLIOGRAPHY
Deepa Sharma*
Gitomer, Jeffrey, Customer Satisfaction is Worthless:Customer Loyalty is Price less ( Austin, TX: BardPress, 1998).
Gunjeet Kaur, Consumer Complaints and ManagerialResponse: A study of Passenger Car Industry ,unpublished Ph.D Thesis, Department ofCommerce, Delhi University, Delhi, 2001.
Gurjeet Singh, Law of Consumer Protection in India: Justicewithin Reach (New Delhi: Deep and DeepPublications, 1996).
Hawkins, Del I., Roger, J. Best, Kenneth. A. Coney, andAmit Mukherjee, Consumer Behaviour: BuildingMarketing Strategy , 9th ed. (Special Indian Edn.)(New Delhi: Tata McGraw-Hill, 2008).
Hilton, Mathew, Consumerism in Twentieth-CenturyBritain (Cambridge, UK: Cambridge UniversityPress, 2003).
Hirschman, Albert O., Exit, Voice and Loyalty(Cambridge, MA: Harvard University Press, 1970).
Howard, John A., and Jagdish N. Sheth, The Theory ofBuyer Behaviour (New York: Wiley, 1969).
Hoyer, Wayne D, and Deborah J. MacInnis, ConsumerBehaviour, 4th ed. (Boston: Houghton Mifflin Co.),Indian adaptation by Pinaki Dasgupta (NewDelhi: Biztantra, 2008).
Kangun, Norman, and Lee Richardson (eds.),Consumerism: New Challenges for Marketing(Chicago: American Marketing Association, 1978).
Livemore, John, Legal Aspects of Marketing (London:Heinemann, 1984).

Deepa Sharma
104 NICE Journal of Business l Vol. 1 l Nos. 1 & 2 l 2008
Loudon, David L., and Albert J. Della Bitta, ConsumerBehaviour, 4th ed. (New Delhi: Tata McGraw-HillPublishing Co., 14 th Indian Reprint, 2008).
Martin, David M., Tough Talking: How to HandleAwkward Situations? (London: Pitman, 1993).
Moore, C., How to Handle Customer Complaints: ACompany Guide to Customer Relations and ConsumerRights (England: Gower Press, 1975).
Nader, Ralph, The Consumer and CorporateAccountability (New York: Harcourt Brace, 1972).
Oliver, R. L., Satisfaction: A Behavourial Perspective on theConsumer (New York: McGraw-Hill, 1999).
Prakash Vir, Regulation of Unfair Trade Practices in India ,unpublished Ph.D. Thesis, Department ofCommerce, Delhi University, 1993 .
Rosenbloom, Larry J., Consumer Complaint Guide (NewYork: McGraw-Hill Book Co., 1979).
Sharma, Deepa, Consumer Grievance Redress under theCPA (New Delhi: New Century Publications,2002).
Sharma, Deepa, A Study of Corporate and Public Systemsfor Redressal of Consumer Grievances (unpublishedPh.D. thesis, Department of Commerce, DelhiSchool of Economics, Delhi University, Delhi,2008.
Sobti, Renu, Medical Services and the ConsumerProtection Act (New Delhi: New CenturyPublications, 2002).
Sonnenberg, Frank K., Managing With a Conscience : Howto Improve Performance, Trust and Commitment (NewYork: McGraw-Hill Publishing Co., 1994).
Technical Assistance Programme (TARP), ComplaintHandling in America (Washington, DC: US Office ofConsumer Affairs, 1986).
Verma, D.P.S., MRTP Law: Principles, Provisions andCases (New Delhi: Manas Publications, 1992).
Waterman, Robert H., The Frontiers of Excellence:Learning from Companies that put People Firs t(London: Nicholas Brealey, 1994).
Wellington, Patricia, Kaisen Strategies for Customer Care:How to Create a Powerful Customer Care Program andMake it Work (London: Pitman, 1995).
Zeithaml, Valerie A., Mary Jo Bitner, Dwayne DGremler, and Ajay Pandit, Services Marketing:Integrating Customer Focus Across the Firm, 4th ed.(New Delhi: McGraw-Hill Publishing Co., 2008).
B. ARTICLES
Aaker, David, A., and George S. Day, “CorporateResponse to Consumerism Pressures”, HarvardBusiness Review, Vol. 50, Nos. 5-6 (November-December 1972), pp. 114-124.
Adamson, C., “Complaint Handling: Benefits and BestPractices”, Consumer Policy Review , Vol. 1 (1991),p. 4.
Anderson, Ralph E., “Consumer Dissatisfaction: TheEffect of Disconfirmed Expectancy on PerceivedProduct Performance”, Journal of MarketingResearch, Vol. 10 (February, 1973), pp. 38-44.
Andreasen, A.R., “A Taxonomy of ConsumerSatisfaction/Dissatisfaction Measures”, Journal ofConsumer Affairs, Vol. 2 (1977), pp. 11-24.
Andreason, A.R., and A. Best, “Consumer Complain:Does Business Respond?” Harvard BusinessReview, Vol. 55, No. 4 (July, 1977), pp. 96-101.
Andreason, A.R., and Tur Wallin, “Antecedents toSatisfaction with Service Recovery”, EuropeanJournal of Marketing , Vol. 34, No. 1-2 (2000),pp. 156-175.
Arndt, John, Edgar Crane and Knut Talllaug ,“Opinions about Consumerism: Issues amongPresent and Future Norwegian BusinessExecutives”, European Journal of Marketing , Vol. 11,No. 1 (1977), pp. 13-20.
Ash, Stephen B., and R. Quelch, “ConsumerSatisfaction, Dissatisfaction and ComplainingBehaviour: A Comprehensive Study of Rentals,Public Transportation and Utilities”, Advances inConsumer Research, Vol. 5 (Winter 1979), pp. 254-62.
Awasthy, H.K., “Perception vs. Reality”, IRDA Journal(August, 2004), pp. 26-27.
Bailey, Diane, “Recovery from Customer Service Short-falls”, Managing Service Quality , Vol. 4, No. 6(1994), pp. 25-28.
Barksdale, H.C., and W.A. French, “The Response ofUS Business to Consumerism”, European Journal ofMarketing, Vol. 10 No. 1 (1976), pp. 13-27.
Bauer, Raymond A., and Stephen A. Greyser, ‘’TheDialogue that Never Happens’’, Harvard BusinessReview, Vol. 45 (Nov-Dec 1967), pp. 1-12.
Bearden, William O., et al, “Consumer’s Propensity toComplain and Dissatisfaction with AutomobileRepairs”, in Woodside, A.G., et al. (eds.) Consumerand Industrial Buying Behaviour (New York: NorthHolland, 1979), pp. 450-58.

Consumer Grievance Redress
NICE Journal of Business l Vol. 1 l Nos. 1 & 2 l 2008 105
Bearden, William O., and Jess E. Teel, “SelectedDeterminants of Consumer Satisfaction andComplaint Reports”, Journal of Marketing , Vol. 20(February, 1983), pp. 21-28.
Bhanot, Arun, “Consumer Advocacy: A GrowingInfluence”, Span, September-October 1998,pp. 33-37.
Blodgett, J.G., and D.H. Granbois, “Towards anIntegrated Conceptual Model of ConsumerComplaining Behaviour”, Proceedings of theConsumer Satisfaction, Disatisfaction andComplaining Behaviour Conference, MarketingLetters, Vol. 4 (1991), pp. 12-16.
Blodgett, J.G., Donna J. Hill, and Stephen S. Tax, “TheEffects of Distributive, Procedural andInteractional Justice on Post-complaintBehaviour”, Journal of Retailing , (1997), Vol. 73,No. 2, pp. 185-210.
Blum, Milton L., J.B. Stewart, and Edward Wheately,“Consumer Affairs: Viability of CorporateResponses”, Journal of Marketing , Vol. 38 (April,1974), pp. 13-19.
Brown, S.P., and R.I. Beltramini, “ConsumerComplaining and Word-of-Mouth Activities”, inT.K. Shrull (ed.) Advances in Consumer Research ,Vol.16 (Provo, Utah: Association for ConsumerResearch, 1989), pp. 9-11.
Buskirk, Richard H., and James T. Rothe,“Consumerism: An Interpretation”, Journal ofMarketing, Vol.34, No.4 (Oct., 1970), pp.61-65.
Chevalier, M. and J. Lendrevie, “The Image ofMarketing among the People”, in Will Straver,European Journal of Marketing, Vol. 11, No. 1 (1977),pp. 93-112.
Cohen, Dorothy, “Remedies for Consumer Protection:Prevention, Restitution or Punishment”, Journal ofMarketing, Vol. 39 (1975), pp. 24-31.
Cook, Sarah, and Steve Macaulay, “Practical Steps toEmpowered Complaint Management”, ManagingService Quality, Vol. 7, No. 1 (1997), pp. 39-42.
Czepiel, E., A. John and Larry Rosenberg, “The Study ofConsumer Satisfaction: Addressing the ‘So WhatQuestion”, in H. Keith Hunt (ed.) Conceptualisationof Consumer Satisfaction and Dissatisfaction(Cambridge, Mass: Marketing Science Institute,1977), pp. 92-119.
Day, George S., and David A. Aaker, “A Guide toConsumerism”, Journal of Marketing , Vol. 34, No. 3(July1970), pp. 12-19.
Day, Ralph L., “Research Perspectives in ConsumerComplaining Behaviour”, in Charles Lamb andPatrick Dunn (eds.) Theoretical Developments inMarketing (Chicago: American Marketing Institute,1980), pp. 211-15.
Day, Ralph L., and E.L. Landon, Jr., “Survey Data onConsumer Complaints for Consumer ProtectionPolicy–Makers”, Proceedings of the MidwestAIDL Conference, Marketing Letters, Vol. 2 (1975),pp. 40-44.
Day, Ralph L., and E.L. Landon, Jr., “Towards a Theoryof Consumer Complaining Behaviour”, in A.G.Woodside, et al (eds.), Consumer and IndustrialBuying Behaviour (New York: North Holland,1977), pp. 425-37.
Day, Ralph L., K.L. Grabicke, T. Schartzle, and F.Staubach, “The Hidden Agenda of ConsumerComplaining”, Journal of Retailing , Vol. 57 (Fall1987), pp. 86-106.
Deshpande, Rohit, and Frederick E. Webster,“Organisational Culture and Marketing: Definingthe Research Agenda”, Journal of Marketing , Vol. 53(January, 1989), pp. 3-15.
Diamond, S.L., Ward and Faber, “Consumer Problemsand Consumerism: Analysis of Calls to aConsumer Hotline”, Journal of Marketing (January,1976), pp. 58-62.
Diener, Betty A., and Stephen A. Greyser, “ConsumerViews of Redress Needs”, Journal of Marketing ,Vol. 42 (Oct, 1978), pp. 21-27.
Drucker, Peter F., “Consumerism: The Opportunity ofMarketing”, in R.M. Gaedeke and W.W. Etcheson(eds.), Consumerism (San Francisco: Canfield Press,1972), pp. 252-58.
Dwyer, F.R., and R.J. Dornoff, “The Congruency ofManufacturers’ Redress Actions and Consumers’Redress Norms and Expectations”, in K. Bernhardt,et al. (eds.) The Changing Marketing Environment: NewTheories and Applications (Chicago: AmericanMarketing Association, 1984), pp. 162-65 .
Eovaldi, Thomas L., and John E. Gestrin, “Justice forthe Consumers: The Mechanisms of Redress”,Northwestern University Law Review , Vol. 66, No. 3(July-August, 1971), pp. 281-325.
Folke, Olander, “Can Consumer Dissatisfaction andComplaints Guide Public Policy?” Journal ofConsumer Policy, Vol. 2 (1977), pp. 124-37.
Folkes, Valerie, “Consumer Reactions to ProductFailure: An Attributional Approach” , Journal of

Deepa Sharma
106 NICE Journal of Business l Vol. 1 l Nos. 1 & 2 l 2008
Consumer Research , Vol. 10 (March, 1984),pp. 398-409.
Fornell, Claes and Robert A. Westbrook, “The ViciousCircle of Consumer Complaints”, Journal ofMarketing Vol. 48, No. 3, (Summer 1984), pp. 68.
Fornell, Claes, and W.T. Robinson, “IndustrialOrganisation and Consumer Satisfaction/Dissatisfaction”, Journal of Consumer Research ,Vol. 9 (1983), pp. 403-12.
Fornell, Claes, and B. Wernerfelt, “DefensiveMarketing Strategy by Customer ComplaintManagement: A Theoretical Analysis ”, Journal ofMarketing Research , Vol. 24 (November, 1987),pp. 337-46.
Fourmiar, Susan, and David Glenmick,“Rediscovering Satisfaction”, Journal of Marketing(October, 1999), pp. 5-23.
Foxall, G., “Towards a Balanced view ofConsumerism”, European Journal of Marketing,Vol. 12, No. 4 (1978), pp. 264-274.
Gaedeke, R. M., “Filing and Disposition of ConsumerComplaints: Some Emperical Evidence”, Journal ofConsumer Affairs, Vol. 6, No. 1 (Summer 1972),pp. 45-56.
Ganesh, Jaishankar, Mark J. Arnold, and Kristy E.Reynolds, “Understanding the Customer Base ofService Providers: An Examination of theDifferences between Switchers and Stayers”,Journal of Marketing , Vol. 64 (July, 2000).
Garbarino, Ellen, and Marks S. Jhonson, “ The DifferentRoles of Satisfaction, Trust and Commitment incustomer Relationships”, Journal of Marketing ,Vol. 63, No. 2 (April, 1999), pp. 70-87.
Garett, Dennis E., “Effectiveness of CompensationGiven to Complaining Consumers: Is More Better”,Journal of Consumer Satisfaction, Dissatisfaction andComplaining Behaviour , Vol. 12 (1999).
Gilly, M.C., “Post-complaint Processes: FromOrganisational Responses to RepurchaseBehaviour”, Journal of Consumer Affairs , (Winter1987), pp. 293-313.
Gilly, M.C., and B.D. Gelb, “Post-Purchase ConsumerProcess and the Complaining Consumer” , Journalof Consumer Research , Vol. 9 (December, 1982),pp. 323-28.
Gilly, M.C., and Richard W. Hansen, “ConsumerComplaint Handling as a Strategic MarketingTool”, Journal of Consumer Marketing , Vol. 2 (Fall1985), pp. 5-16.
Goodwin, C., and I. Ross, “Consumer Evaluations ofResponses to Complaints” , Journal of ConsumerMarketing (Spring 1990), pp. 39-47.
Goodwin, C., and I. Ross, “Consumer Responses toService Failures: Influence of Procedural andInteractional Fairness Perceptions ”, Journal ofBusiness Research, Vol. 25 (1992), pp. 149-63.
Gopal Krishna, G., “The Insurance Customer”, IRDAJournal, February 2008, pp. 34-35.
Granier, Kemp and Lawes, “Customer Complaint-handling The Multimillion Pound Sinkhole, ACase of Customer Rage Unassuaged”, Studyconducted by the Customer Care Alliance , 2004,cited in Zeithaml, et al., 2008, p. 252.
Greenberg, J., “Organisational Justice: Yesterday,Today and Tomorrow”, Journal of Marketing ,Vol. 16 (1990), pp. 339-432.
Halstead, Diane, “Expectations and DisconfirmationBeliefs as Predictors of Consumer Satisfaction,Repurchase Intention and ComplainingBehaviour: An Empirical Study”, MarketingLetters, Vol. 2 (1991), pp .17-21.
Harmon, Robert and Alan J. Resnik, “ConsumerComplaining: Exploring Expected and DesiredResponses”, in Bruce J. Walker, et al (eds.) AnAssessment of Marketing Thought and Practice(Chicago: American Marketing Association, 1982),pp. 175-78.
Herrman, Robert O ., ‘’Consumerism: Its Goals,Organisations and Future’’, Journal of Marketing,Vol. 34, No. 4 (Oct. 1970), pp. 55-60.
Heskett, James L., Thomas O. Jones, Gary W. Loveman,W. Earlsasser, and Leonard A. Schlesinger,“Putting the Service-Profit Chain to Work”,Harvard Business Review , Vol. 72, No. 2 (1994),pp. 164-174.
Hocutt, Mary Ann, Michael R. Bowers, and D. ToddDonavan, “The Art of Service Recovery: Fact orFiction?” Journal of Services Marketing , Vol. 20, No. 3(2006), pp. 199-207.
Hogarth, Jeanne M.M and Maureen English,“Consumer Satisfaction with the ComplaintResolution Effort of a US Federal Agency”, Journalof Consumer Satisfaction, Dissatisfaction andComplaining Behaviour , Vol. 10 (1997).
Hogarth, Jeanne M.M, Maureen English, and ManishaSharma, “Consumer Complaints and ThirdParties: Determinants of Consumer Satisfactionwith Complaint Resolution Efforts”, Journal of

Consumer Grievance Redress
NICE Journal of Business l Vol. 1 l Nos. 1 & 2 l 2008 107
Consumer Satisfaction, Dissatisfaction andComplaining Behaviour , Vol. 14 (2001).
Homburg, Christian and Andreas Furst, “HowOrganisational Complaint Handling DrivesCustomer Loyalty: An Analysis of the Mechanisticand the Organic Approach”, Journal of Marketing ,Vol. 69, No. 3 (July, 2005), pp. 95-114.
Hunt, H. Keith, “CS/D- Overview and Future ResearchDirections”, in H. Keith Hunt (ed.),Conceptualisation and Measurement of ConsumerSatisfaction and Dissatisfaction (Boston: MarketingScience Institute, 1977), pp. 459-460.
Jacoby, Jacob, and J.L. Jaccard, “The Sources, Meaningand Validity of Consumer ComplainingBehaviour: A Psychological Analysis ”, Journal ofRetailing, Vol. 57 (Fall 1981), pp. 4-24.
Jagdip Singh, “A Typology of ConsumerDissatisfaction, Response Styles,” Journal ofRetailing, Vol. 66, No. 1 (Spring 1990).
Jagdip Singh “Consumer Complaint Intentions andBehaviour: Definitional and Taxonomical Issues ”,Journal of Marketing , Vol. 52 (January, 1988),pp. 93-107.
Jagdip Singh and Robert E. Widing 2, “What OccursOnce Consumers Complain?” European Journal ofMarketing, Vol. 25, No. 5 (1991), pp. 30-46.
Jobber, D., and Bendelow, “ Consumerism: The Public’sAwareness of their Rights”, European Journal ofMarketing, Vol. 13, No. 3 (1979), pp. 113-125.
Kangun, Norman, Keith K. Cox, James Higginbothamand John Burton, “Consumerism and MarketingManagement”, Journal of Marketing , Vol. 39, No. 2(April, 1975), pp. 3-10.
Kendall, C.L., and Fredrick A. Russ, “Warranty andComplaint Policies: An Opportunity for MarketingManagement”, Journal of Marketing , Vol. 39, No. 2(April, 1975), pp. 36-43.
La Barbera, Priscilla A., and David Mazursky, “ALongitudinal Assessment of ConsumerSatisfaction/Dissatisfaction: The DynamicAspects of the Cognitive Process”, Journal ofMarketing Research (November 1983), pp. 393-404.
Landon, E. Laird Jr., “New Dimensions of ConsumerSatisfaction and Complaining Behaviour”, in R.L.Day, and H. Keith Hunt (eds.) Satisfaction andComplaining Behaviour Conference Proceedings(Bloomington, IN: Indiana Universal Press, 1979),pp. 44-49.
Liljander, Veronica, “Consumer Satisfaction withComplaint-handling following a DissatisfactoryExperience with Car Repair”, Advances inConsumer Research, Vol. 4 (1999), pp. 270-275.
Lillekar, C.Y., R.E.A Mapes, and C.S. Riley,“Determinants of Consumer Complaints”, BritishJournal of Marketing , (Winter 1969), pp. 218-22.
Luo, Xueming, “Consumer Negative Voice and Firm-Idiosyncratic Stock Returns”, Journal of Marketing ,Vol. 71, No. 3 (July, 2007), pp. 75-88.
Luo, Xueming and Christian Homburg, “Satisfaction,Complaint, and the Stock Value Gap”, Journal ofMarketing, Vol. 72, No. 4 (July, 2008), pp. 29-43.
Mann, James and Peter Thornton, “Consumerism inPerspective”, European Journal of Marketing, Vol. 12,No. 4 (1978), pp. 253-263.
Mattila, A.S. and P.G. Patterson, “Service Recovery andFairness Perceptions in Collectivist andIndividualist Context”, Journal of Services Research ,Vol. 6 (May, 2004), pp. 336-46.
Maxham, James G., III, and Richard G. Netmeyer,“Firms Reap what they Sow: The Effects of SharedValues and Perceived Organisational Justice onCustomer’s Evaluation of Complaint handling”,Journal of Marketing , Vol. 67 (January, 2003),pp. 46-62.
Meffert, Heribet and Manfred Bruhn, “ComplainingBehaviour and Satisfaction of Consumers: Resultsfrom an Empirical Study in Germany, Proceedingsof the International Fair in Consumer Satisfactionand Complaining”, Marketing Letters, Vol. 2 (1982),pp. 12-16.
Moore, Chris, “Handling Consumer Complaints”, in J.Mirchell (ed.) Marketing and the Consumer Movement(New York: McGraw-Hill Publishing Co, 1978),pp. 15-20.
Morganosky, Michelle, A., “Complaint Behaviour:Analysis by Demopgraphics, Lifestyle andConsumer Values”, Proceedings of ConsumerSatisfaction, Dissatisfaction and ComplainingBehaviour Conference, Marketing Letters, Vol. 3(1992), pp. 15-20.
Morris, David, “Consumer Complaints and ConsumerAdvice”, in David Morris (ed.) Economics ofConsumer Protection (London: HeinemannEducational Books Limited, 1980), pp. 56-65.
Morris, David and D.I. Reeson, “The EconomicDeterminants of Consumer Complaints” , EuropeanJournal of Marketing, Vol. 12, No. 4 (1978), pp.275-282.

Deepa Sharma
108 NICE Journal of Business l Vol. 1 l Nos. 1 & 2 l 2008
Moss, Charles Derek and Bill Richardson , ‘’CustomerSatisfaction: The Key to Successful and LegallyUnfettered Trading’’, European Journal of Marketing,Vol. 19, No. 6 (1985), pp. 05-10.
Moyer, M.S., “Characteristics of ConsumerComplaints”, Journal of Public Policy and Marketing ,Vol.3 (1984), pp. 67-84.
Oliver, R.L., “An Investigation of Consumer (Dis)Satisfaction and complaining Behaviour ”,Proceedings of the Conference: International Fairin Consumer Satisfaction and ComplainingBehaviour, Marketing Letters, (1987), pp. 23-28.
Oliver, R.L., and J.E. Swan, “Consumer Perceptions ofInterpersonal Equity and Satisfaction inTransactions: A Field Survey Approach ”, Journalof Marketing, Vol. 53 (April, 1989), pp. 19-21.
Nicolaud, Brighette M.M., ‘’Consumerism andMarketing Management’s Responsibility’’, Journalof Marketing, Vol. 23, No. 3 (1987), pp. 07-16.
Rao, G.V., “What Do Your Customers Really Want?”IRDA Journal, August 2004, pp. 18-20.
Resnik, A.J. and R. Harmon, “Consumer Complaintsand Managerial Response: A Holistic Approach ”,Journal of Marketing, Vol.47 (Winter 1983), pp. 86-97.
Richins, Marsha L., “Negative Word of Mouth byDissatisfied Consumers: A Pilot Study”, Journal ofMarketing, Vol. 47 (Winter 1983), pp. 68-78.
Rust, Roland T, Bala Subramanian, and Mark Wells,“Making Complaints a Management Tool”,Marketing Management , Vol. 1, No. 3 (1992),pp. 40-45.
Saraf, D. N., “Some Facts of Consumer Justice throughConsumer Disputes Redressal Agencies”, Journalof Indian Law Institute, Vol. 34, No. 1 (January-March, 1992), pp. 28-70.
Sawarkar, G., “ Consumer Awareness: A SurveyAnalysis”, Indian Journal of Marketing, Vol. 25, No.10-12 (Oct-Dec, 1996), pp. 13-21.
Sayulu, K. and G. Sardar, “Customer Satisfaction withregard to LIC Policies”, The Indian Journal ofCommerce, Vol. 58, No. 2 (April-June, 2005),pp. 25-30.
Sharma, Deepa, “Consumer Grievance Redressal inIndia”, Synergy, Vol. 6, Nos. 1 & 2 (Jan-Dec 2004),pp. 08-17.
Sharma, Deepa, “Service-Marketers Beware, CPA isHere!” Delhi Business Review, Vol. 7, No. 1 (Jan-June2006), pp. 111-118 .
Singh, Gurjeet, “Business Self-Regulation andConsumer Protection in India: A Critique”, Journalof Consumer Policy , Vol. 16, No. 1 (1993), p. 1.
Smith, Amy K., and Ruth N. Bolton, “An ExperimentalInvestigation of Customer Reactions to ServiceFailure and Recovery Encounters: Paradox orPeril?” Journal of Services Research , Vol. 1, No. 1(1998), pp. 65-81.
Smith, Amy K., Ruth N. Bolton, and Janet Wagner, “AModel of Customer Satisfaction with ServiceEncounters Involving Failure and Recovery”,Journal of Marketing Research , Vol. 36 (August,1999), pp. 356-372.
Straver, Will, “The Consumerist Movement in Europe:Challenges and Opportunities for MarketingStrategy”, European Journal of Marketing, Vol. 12,No. 4 (1978), pp. 316-325.
Straver, Will, “The International ConsumeristMovement: Theory and Practical Implications forMarketing Strategy”, European Journal of Marketing,Vol. 11, No. 1 (1977), pp. 93-117.
Swan, J.E., and R.L. Oliver, “Post-purchaseCommunications by Consumers ”, Journal ofRetailing (Winter 1989), pp. 516-33.
Tax, S., S Brown and M. Chandrashekhran, “CustomerEvaluation of Service Complaint Experiences:Implications for Relationship Marketing”, Journalof Marketing, Vol. 62 (April, 1998), pp. 6076.
Tharulingam and Kochadai, “An Evolution ofConsumer Awareness”, Indian Journal of Marketing,Vol. 19, Nos. 8-10 (April-June, 1989), p. 4 .
Tootelian, Dennis H., “Attitudinal and CognitiveReadiness: Key Dimensions for ConsumerLegislations”, Journal of Marketing (July1975),pp. 61-64.
Vaidyanathan, R., “A CRM Paradigm”, IRDA Journal,January 2007, pp. 15-17.
Varadrajan, P. Rajan and P.N. Thirunarayana,“Consumers’ Attitudes towards MarketingPractices, Consumerism and GovernmentRegulations: Cross-national Perspective”,European Journal of Marketing , Vol. 24, No. 6 (1990),pp. 06-21.
Verhage, Bronislaw J., “Knowing your Rights: A Cross-Cultural Study” European Journal of Marketing,Vol. 21, No. 5 (1987), pp. 70-75.
Verma, D.P.S., and Gunjeet Kaur, “What theComplainant Expects: A Study of Car- users”, IIM-BManagement Review, Vol. 3, No. 4 (2001), pp. 39-44.

Consumer Grievance Redress
NICE Journal of Business l Vol. 1 l Nos. 1 & 2 l 2008 109
Verma, D.P.S., and Gunjeet Kaur, “Post-complaintSatisfaction: A Neglected Area”, Delhi BusinessReview, Vol. 2, No. 2 (2001), pp. 51-57.
Verma, D.P.S, and Renu Sobti, “Patients’ Perception ofMedical Services”, Journal of Services Research ,Vol. 2, No. 1 (2002), pp. 1-17.
Verma, D.P.S., and Renu Sobti, “Medical Services andGrievance Redressal under Consumer ProtectionAct”, Business Perspectives, Vol. 5, No. 1 (January-June, 2003), pp. 71-90.
Verma, D.P.S., and Shashi Nanda, “Impact ofConsumerism on Marketing Practices: A studyin National Capital Region”, Journal of Advancesin Management Research , Vol. 4, No. 1 (2007),pp. 47-60.
Warland, Rex H. Robert O. Hermann, and HayneWiltis, “Dissatisfied Consumers: Who Gets Upsetand Who Takes Action” , Journal of ConsumerAffairs, Vol. 9 (Winter 1975), pp. 148-63.
C. LEGISLATIONS
1. The Consumer Protection Act, 1986.2. The Insurance Regulatory and Development
Authority (Protection of Policy HoldersInterests) Regulations, 2002.
3. The Redressal of Public Grievances Rules, 19984. The Monopolies and Restrictive Trade Practices
Act, 1969.5. The Competition Act, 2002.6. The Right to Information Act, 2005.
If the gentlemanly capitalists and international rentiers canoperate offshore, with no democratic accountability,
then democratisation of our national economy,polity and society will be permanently stymied.
Will Hutton, The State We’re In
H H H H H
Within a virtual market the real world truly is irrelevant,and the invisible hand becomes a blind hand, with no reason
to take account of how it affects other people, or future generations.
Geoff Mulgan, Connexity
H H H H H
A truly global economy is being created by the worldwidespread of new technologies, not by the spread of free markets...
the result is not a universal free market but an anarchy ofsovereign states, rival capitalisms and stateless zones.
John Gray, False Dawn

Managers tend to be promoted to the level of their incompetence.
Laurence J. Peter and Raymond Hall,The Peter Principal
H H H H H
Work expands so as to fill the time available for itscompletion, and subordinates multiply at a fixed rate,
regardless of the amount of work produced.
Cyril Northcote Parkinson,Parkinson’s Law – The Pursuit of Progress
H H H H H
In the affluent society, no useful distinction can bemade between luxuries and necessaries.
J. K. Galbraith, The Affluent Society
H H H H H
A good book is the purest essence of a human soul.
Thomas Carlyle
H H H H H
A truly great book should be read in youth, again inmaturity and once more in old age, as a fine building
should be seen by morning light, at noon and by moonlight.
Robertson Davies, Peterborough Examiner,“Too Much, Too Fast”
H H H H H
Books are good enough in their own way,but they are a mighty bloodless substitute for life.
Robert Louis Stevenson, Virginibus Puerisque,”An Apology for Idlers”

BOOK REVIEWS
C.K. Prahalad and M.S. Krishnan, The New Ageof Innovation: Driving Co-created Value through
Global Networks (New Delhi: Tata McGraw-Hill Publishing Company Limited, 2008, 2nd
reprint), Pages: 278, Hard bound, Price: Rs.695.
The authors of the book, particularly the seniorauthor C.K. Prahalad, are celebrities in the field of
management education. Prahalad has beenconferred Padma Bhushan on the Republic Day on
26th January, 2009. The book has been already verywell received in the corporate world and carriesexcellent reviews by CEO’s and others, acclaiming
it for providing a clear road map for continuousinnovation, driven by seamless integration of
strategy, technology, processes and people. ThisIndian edition is intended for sale only in the sixSAARC countries.
The book focuses on building organisationalcapabilities that allow a firm to create the capacity
for continuous innovation, so that a significant gapthat exists today between the strategic intent andthe ‘capacity to act’ in organisations is narrowed.
The book is about the nature of innovation in thenew competitive context, focusing on the links
between business processes and analytics.
The main thesis of the authors is the co-creatingvalue through individual consumer experience and
global access to resources and the talent. Theauthors define this concept as “N=1 and R=G”
approach as the two pillars of innovation in allbusiness firms. Innovation is viewed as shapingconsumer expectations as well as responding
continually to the changing demands, behaviour,and experience of consumers by accessing the best
talent and the resources available anywhere in theworld.
The book presents the concept of the ‘New
House of Innovation’ by linking the ‘N=1’ and ‘R=G’as the two pillars, technical architecture of the firm
as the base, social architecture as the top, andflexible and the resilient business processes and
focused analytics as the glue.
The book is structured in eight chapters. The
first four chapters focus primarily on the ‘what’ and‘why’ of value creation and innovation space. Chapter1 describes the fundamental transformation of
business, forged by digitisation, ubiquitousconnectivity and globalisation in almost all kinds of
industries. This transformation is proposed to bemanaged on these two basic pillars – value is basedon unique personalised experiences of individual
consumers with a focus on the centrality of theindividual (N=1 pillar). The second pillar is the focus
on access to resources, not ownership of resources,which is called the ‘R=G’ pillar. Using these twopillars, the authors identify five key elements of this
transformation and develop new principles forinnovation to cope with this transformation. For the
‘N=1’ world, the new critical demands are:flexibility, quality, cost and experience, collaborativenetworks, complexity, customer interfaces, and
scalability. The second principle, ‘R=G’, unfolds newchallenges, such as access to resources, speed,
scalability, and innovation arbitrage. This calls forforgetting traditional ways of managing andlearning the new ways.
Chapter 2 deals with business processes asenablers of innovation. It proposes a framework
of capability building for ‘N=1, R=G’ world, andthe ICT architecture, comprising of four layers. Anumber of experiences particularly that of the ICICI,
is described.
In Chapter 3, the author describes the analytics
to explain a class of mathematical applications andalgorithms to help derive insights. In this chapter,the authors develop a framework of building
analytical capability. As in other chapters, a numberof anecdotal references are given.

Book Reviews
112 NICE Journal of Business l Vol. 3 l Nos. 1 & 2 l 2008
Chapter 4 deals with the IT-based technicalarchitecture for innovation, with capacity to link
large systems and multiple databases, anddevelops specification of ICT architecture for
‘N=1, R=G’ requirements, illustrated by twoexamples to validate the proposal. The next fourchapters, explore the process of migration of
systems – social and technical – to conform to thedemands of the ‘N=1, R=G’ approach to value
creation.
In Chapter 5, the authors present the details ofimpediments to value-creation due to
organisational legacies, and then suggest anapproach to organisational evolution. The case of
Madras Cements is used as a basis to illustrate theissues contained in the chapter.
Chapter 6 deals with managing the tension due
to efficiency and flexibility. These seeminglyantithetic attributes need to be managed
simultaneously in the new business. The topmanagement in diversified firms needs to recognisethe implications that there is a limit to elasticity of
business processes.
Chapter 7 deals with the need and ways to
dynamically reconfigure the talent to continuallymatch opportunities with resources. The focus ison mobilising talent not outsourcing it. After
discussing a number of situations and trends, theauthors observe that the search for talent has gone
beyond cost arbitrage. The concept of Velcroorganisation is outlined.
Finally, in Chapter 8, an agenda for
implementing the ‘N=1, R=G’ world of value co-creation is presented. At the end, a note on each
chapter is added. It is followed by Index.
As one would expect from the authors, ascelebrated as Prahalad and Krishnan, this book is
an outstanding addition to the literature onmanagement under new business paradigms.
There are numerous examples, anecdotes, and case-lets to prove a particular point. I am confident thatthis book will make a mark in both the academic
circles and the corporate world. Companies,executives, educational institutions, students, and
teachers will find in this book a clear roadmapand direction in managing the present customer-
driven, highly competitive and globalisedbusiness. The book will definitely provide value
for the money.
Prof. Prem Vrat
Vice ChancellorUP. Technical UniversityLucknow
J.K. Sharma, Business Statistics, PearsonEducation/Dorling Kindersley (India) Private
Limited, 2007, New Delhi, Pages: 732, Price: notmentioned
The knowledge of statistics helps the users in the
collection, compilation, and analysis of data, andinterpretation of the results, for making decision
in a particular situation. There are several statisticsbooks available in the market, which include thebasic principles and statistical methods for decision-
making process. The inferences drawn from anydata analysis are based on sample observations,
which is a representative part of the population.The decisions-making in business, based onstatistics, is probably the most important and
complex process. It needs clarification of the basicconcepts to business managers.
The book under review is in its second edition.The author claims that the book would be usefulfor developing the decision-making ability of the
students. The book includes the basic concepts ofstatistics, necessary for business managers. It
contains most of the statistical methods used inbusiness studies. The book has been preparedspecially for meeting the needs of management
students wishing to learn the basic principles ofstatistics applied in business. The authors’ emphasis
in the book is on the basic principles andprocedures, with an attempt at elucidating the logicwithout too much of mathematical treatment. An
outstanding feature of the book is the inclusion ofimportant terms used in business statistics
mentioned on the margin of the relevant page andthe statistical aspects are explained through flow-charts to facilitate one easy grasp of the topic.
The book effectively introduces a limitednumber of statistical concepts and techniques. The
coverage of the book is adequate as expected in an

Book Reviews
NICE Journal of Business l Vol. 3 l Nos. 1 & 2 l 2008 113
introductory business statistics text book. All themajor topics which are generally included in any
standard text book of statistic are given in the book.These includes: introduction of the subject, data
description, graphical methods, measures of centraltendency, dispersion, moments, skewness andkurtosis, probability, probability distribution, point
and interval estimation, significance testing,correlation and regression analysis, sampling and
sampling distributions, normal tests, non-parametric tests, designs of experiment, qualitycontrol, decision-making process, time-series
analyses, index number, and forecasting models.However, there are several applications of statistics
that should have been included in this textbook,such as introduction of designs of experiment,comparison of regression lines, repeated measured
design, advance methods, such as proportionalhazards regression, discriminant analysis and
forecasting models. The increasing demand ofapplication of statistical procedures in businessstatistics is the need of time for the future business
managers.
The book is organised into 19 chapters, besides
12 appendices and a subject-index. At the end ofeach chapter, there are conceptual questions, self-practice problems, ‘true or false’ questions,
multiple-choice questions, hints for solving theproblem, and answer to selected problems. Case
studies, along with the explanation of the problems,are also given in some of the chapters.
The first chapter of the book gives an overview
of the term ‘statistics’ when it is used in a singularform, i.e., concerned with the subject matter and
further introduced its application in managerialdecision-making.
Chapters 2 to 5 explains descriptive statistics
through solved numerical examples and graphicalpresentation, based on business studies. The
importance of the concept of central tendency,dispersion, skewness, moments and kurtosis isexplained as a pre-requisite for studying the several
advance fields of statistics useful in businessmanagement studies. However the basic concepts
may be further cleared by giving more solved andunsolved case studies based on industrial andbusiness problems. These chapters are of
introductory nature and routine statisticalprocedures are explained.
Chapters 6 and 7 introduced the concept ofprobability and probability distribution. The main
topics covered include: concepts of probability,Addition and Multiplication theorem and Bayes’Theorem, Probability distribution function,
expected value, variance of a random variable, anddiscrete and continuous probability distribution.
Chapter 8 focuses on sampling methods alongwith the concept of sampling distribution. Thesampling methods are not explained with the help
of numerical examples. This is significant omission.Moreover the description of sampling methods
could have been more elaborate because these arevital for data analysis.
Chapter 9 briefly discusses the estimation
procedure for both point estimation and intervalestimation. The concept of the Central Limit
Theorem and determination of sample size for finitepopulation have also been briefly introduced. Thereseems to be some printer’s devils, such as in Figure
9.1, on page 306, the bar sign was to be placed overx, and not over s. Similarly on the top of page 318,
the multiplication of z on the left hand side of theequation is missing.
Chapter 10 outlines the concept of statistical
inference, Topics, such as hypothesis testing,methodology, z-test, t-test, and F-test, confidence
level, significance level, critical region and powerof a test is explained with the help of numericalexamples.
Chapter 11 describes the Chi-squire and othernon-parametric tests, Chi-squire test for goodness-
of-fit, population variance, and homogeneity,Yate’s correction for continuity are discussedthrough solved numerical problems. Sign test, Runs
test, Mann–Whitney U-test, Wilcoxon’s MatchedPairs test, and Kruskal-Wallis test are adequately
explained. However, there is no case study givenin the chapter.
The concept of ‘analysis of variance’ is explained
in Chapter 12. The procedure for testing thehypothesis for more than two population variances
is introduced and F-test is explained for makingthe decision regarding the null hypothesis. One-

Book Reviews
114 NICE Journal of Business l Vol. 3 l Nos. 1 & 2 l 2008
way and two-way ANOVA tables are alsoexplained with the help of appropriate numerical
examples.
Chapters 13, 14 and 15 are devoted to the
concept of correlation and regression analysisHypothesis testing for correlation coefficient is alsoexplained with the help of numerical examples. It
would have been better to solve numericalexamples based on some case study and regression
equation fitted accordingly. Partial and multiplecorrelations and regression analysis are explainedwith the help of the least-squares methods.
It is followed by coefficient of multipledeterminations. The result of relationship between
multiple and partial correlation coefficient is alsogiven. Enough emphasis is placed on worked-outnumerical examples, which can be useful for
teaching. However, there is no discussion on thecomparison of regression line. Similarly, the
methods of discriminant analysis are also ignored.
The concept of forecasting based on time-seriesdata is discussed in Chapter 16. The different types
of forcasting methods are briefly explained. Time-series analysis is explained in detail, including the
components of time-series and multiplicative andadditive modules. Different quantitativeforecasting methods and trend projection methods,
based on business climate over a period of severalyears, are adequately dealt with. Linear, quadratic
and exponential trend models are also given at theend of the chapter.
Chapter 17 describes the purpose, types and
the uses of index numbers. Several methods ofcomputing price index, volume index, and
consumer price index are explained with the helpof numerical examples.
Chapter 18 focuses on Statistical Quality Control
techniques. The concept related to quality controlis explained through control charts, viz., x bar
charts, R–charts, Acceptance sampling plan, O.C.curves and the formula of average outgoing quality(AOQ) is given along with the advantages and
limitations of statistical quality control.
Lastly, Chapter 19 provides statistical decision
theory through an analytical and systematicapproach to the study of decision-making. It also
includes the procedure for determining the optimaldecision based on posterior probability. Finally,
decision-tree analysis is presented for displayingacts and events in a decision-making problem, in
the form of a tree diagram.
Sharma’s text book has undoubtedly contributedmuch to enhance knowledge in the area of business
statistics. It would have been a great help to thereaders if the data set was made available on a floppy
disks affixed to the book. This would have saved alot of data entry work and would have ensured thatonly the correct values are analysed.
The advent of high-speed computers generatedrenewed interest in theoretical and computational
aspects of business studies. The applicationsoftware for solving the business problem mightalso have saved time and provided correct answers
to the problems.
I hope the book will be further improved in its
subsequent edition. It is desirable that the relatedbibliography is provided either at the end of eachchapter, or towards the end of the book. In some
of the chapters, case studies have not been provided.For business students each chapter should have at
least one case study.
The language part seems to have been badlyignored by the author. Grammatical and
typographical errors are galore (see, for example,page 328, second line, “bearing testimoney (instead
of testimony)” “before reaching to (instead of ‘at’)a verdict.” Moreover, the exact sources ofdefinitions of statistics, attributed to various
authors, in Chapter 1, are not given.
Despite certain weaknesses, the book is
recommended to those who need an introductionto the statistical methods related to business. Inconclusion, it can be said that the author has
succeeded in producing an interesting book oncollection, compilation, analysis and interpretation
of data, and as such it would be useful to a widerange of business students and teachers.
Prof. J.B. Singh
DirectorSchool of Computer Engineering and
Information TechnologyShobhit University, Meerut

Book Reviews
NICE Journal of Business l Vol. 3 l Nos. 1 & 2 l 2008 115
Madhu Sinha, Financial Planning: A ReadyReckoner, Tata McGraw-Hill Publishing
Company Limited, New Delhi, 2008, Pages: 270,Paperback, Price: Rs. 345.
Everyone needs and does financial planning tovarious degrees of formalism. In fact, the need forfinancial planning begins with the very first rupee
we earn. In today’s competitive and demandingworld, we all are seeking answers to questions,
such as, “How much should I save every month tomaintain my current life style even after I retire?”,or, “How can I save for the rainy day and still afford
that dream holiday and send my daughter foreducation abroad, and…?” We are always
confronted with such dilemmas in our lives, butwe seldom find quick answers or have access toexpert help. This book attempts to fill this gap.
The book Financial Planning: A Ready Reckoner,is a very timely addition to the literature on the
subject and professionals and non-professionals ofall ages are expected to benefit alike from thepractical financial planning insights and tools
suggested by the author. The hallmark of this bookis the demystification of financial buzzwords and
catch phrases, like annuity, net present/futurevalue, and time value of money, and the focus onpractical application of financial planning principles
to typical financial situations, that occur in oureveryday life. The author has provided ample
practical exercises on each topic in order to reinforcethe understanding of various concepts. Step-by-step guidelines are provided for using Microsoft
Excel and a financial calculator for making variouscalculations.
The book begins by explaining what is financialplanning, why it is needed, and the process offinancial planning. For the benefit of finance
professionals, who wish to take up financialplanning as a career, essential qualities of successful
financial planners are also described, in additionto the basic artifacts they are required to generateas part of their services to the clients.
Chapters 2 and 3 are devoted to financialmathematics, the foundation on which all the
concepts of financial planning are built. Chapter 2covers the issue such as ‘how to calculate the timevalue of money’, ‘future value of one-time
investment made today’, and ‘the present value ofone-time investment made sometime in the past’,
‘rates of return on investment’, and ‘effectiveinterest rates’. Chapter 3 focuses on annuities
(regular periodic payments or investments) anddiscusses concepts, such as holding period return,compounded annual growth rate (CAGR), present
and future value of annuity, deferred annuity,annuity in perpetuity, growing annuity, and net
present value and internal rate of return. Both thechapters are replete with practice examples, all takenfrom everyday-life situations. For instance, how
much money one must save every month for nextN months to afford that dream holiday abroad, or
how much money should parents set aside everymonth for their daughter’s marriage M years hence,or, calculating EMI’s for your dream home, or,
returns on a systematic investment plan after Tperiods, etc.
Chapter 4 describes personal financial ratios,like savings-to-income ratio, debt-to-income ratio,liquidity ratios, debt ratios, risk-exposure ratios,
and net worth ratios. These ratios determine thefinancial health of a person, just like we use financial
ratios to assess the financial health of a companyand, therefore, its stock price (i.e., its worth). Theseare very handy numbers for a quick diagnosis of
one’s financial health and for setting suitable goalsto get back into shape, or to become financially more
solid.
In Chapters 5 to 7, the author discusses‘Retirement Planning’, in details. While Chapter 5
discusses the need for retirement planning and itsincreasing importance in today’s uncertain times,
and the steps in the process of retirement planning.Chapter 6 describes various financial productsavailable for retiring planning, e.g., Public
Provident Fund, Senior Citizens Saving Scheme,Employees Provident Fund, Post Office Monthly
Income Scheme, Government of India Bonds,National Saving Certificates, Kisan Vikas Patra, BankFixed Deposits, various insurance policies, Unit-
Linked Insurance Plans, Pension Plans, Mutual Fundproducts and Reverse Mortgages. Each product is
discussed in terms of its advantages anddisadvantages, and its distinguishing features. Thesuitability of various products for different financial
situations and targets is also discussed. Chapter 7

Book Reviews
116 NICE Journal of Business l Vol. 3 l Nos. 1 & 2 l 2008
is solely devoted to solving numerical problemson retirement planning. The author has included a
large number of financial situations that variouspeople may confront in various life stages. Readers
will surely find more than one problems describedhere which may be relevantl for their own financialsituation.
Chapter 8, on mutual fund investments,describes what a mutual fund is, its benefits, its
structure, types of mutual funds, and how to investin a mutual fund scheme. The rights available to amutual fund investor and the precautions to be
taken while investing in mutual funds are alsodiscussed. Finally, FAQ’s concerning mutual funds
are included to provide answers to most-oftenasked questions about mutual funds. The readerswill find Section 8.8, of particular interest, since it
provides essential advice on how to invest in amutual fund in terms of choosing a fund vis-à-vis
one’s investment goals, diversification, regularityof investment and regular monitoring ofinvestments.
In Chapter 9, the author discusses the variouscomponents of a financial plan and provides
fourteen financial planning case studies on the basisof live information and offers appropriatesuggestions, which include the appropriate amount
of contingency fund (for meeting contingentexpenses), optimal insurance requirement, buying/
income from a residential house and providing forother goals, such as children’s higher education,retirement planning, and estate planning (writing
a Will and the document of power of attorney fortransfer of wealth to heirs). All the case studies
have been taken from the author’s own professionalexperience and include various types of clients, i.e.,young, middle aged, retired or nearing retirement,
having various levels of income, i.e., low income,moderate income, and high income.
Finally, in Chapter 10, the code of ethics andrules of professional conduct as set out by theFinancial Planning Standards Board of India are
described. These must be adhered to by all certifiedpracticing financial planners.
This book does full justice to its purpose andshould prove to be an invaluable and handyresource for anyone interested in financial planning.
What makes this ready-reckoner even morevaluable is the fact that it has been written by a
certified practitioner and is purposely focused onreal-life financial planning situations. A small
improvement in the form of a CDROM, containinga “Wizard” application, written, for instance, forMicrosoft Excel, would have been an added bonus
over and above what is included in this very well-conceived book. This auto-running Wizard
application would have allowed the readers to fillin the required parameter values for various typesof financial planning problems to the solutions.
Nevertheless, this is a welcome addition to theliterature on the subject of practical financial
planning.
Harvinder KaurReader, Dept. of Commerce
Sri Guru Gobind Singh College of CommerceUniversity of Delhi
Delhi
Kerry Patterns, Joseph Grenny, Ron McMillan,and Al Switzler, Crucial Conversations Tools for
Talking When Stakes are High, Tata McGraw-Hill Publishing Company Limited, New Delhi,
2008, Pages: 240, Price: Rs.275.
There are a few defining moments in our lives andcareers that make all the difference. Many of these
moments come from crucial or “breakthrough”conversations with important people in emotionally-
charged situations, where the decisions made takeus down one of the several roads, each of whichleads to an entirely different destination. In the
result-oriented environment and fast-paced worldof IT, the success of a system or business depends
on crucial conversations people have every day.
A crucial conversation refers to a discussionbetween two or more people, when the stakes are
high, the opinions vary, and the emotions runstrong.
Although a large number of books are availablein the market to cater to the communication needsof students and professionals, the book under
review, “Crucial Conversations Tools for Talking WhenStakes are High”, authored by Kerry Patterns, Joseph
Grenny, Ron McMillan, and Al Switzler, is a unique

Book Reviews
NICE Journal of Business l Vol. 3 l Nos. 1 & 2 l 2008 117
one in as much as it takes a systematic approach toexplain the concept and practice of crucial
conversation for talking when the stakes are high.This book is an attempt to describe, and explain,
the conversation force, and its role in shaping ourbusiness and social life.
Another relevant concept is dialogue. Dialogue
refers to the free flow of an idea between two ormore people. In the book, the authors seek to
answer the question as how this free flow of anidea leads to success. The authors seek to find ananswer as to why certain people were more
effective than others, and learn exactly what thosepeople did, and pass it on to others with the help of
the book. For twenty-five years, the authorsexplored this very issue. During this time, theyinterviewed twenty thousand people. They
searched for key to organisational success. Acompany’s overall success would depend on its
strategy, structure, and systems. Changingstructures and systems alone do little to improveperformance. In fact, half of the high-flyers had
almost no formal performance managementprocesses. What’s behind their success? It all comes
down to how people handle “CrucialConversation”. The path to high productivity passesnot through a static system, but through face-to-
face conversations at all levels. When you ask theaverage person what causes a couple to break up,
he or she usually suggests that it was due to thedifference of opinion.
The book, comprising twelve chapters, will be
helpful to everyone in understanding how toeffectively blend and use both intellectual and
emotional quotient to enable crucial conversations.
What is a Crucial Conversation is dealt with inthe opening chapter of the book, titled “Huge
Impact on the Quality of Your Life.” The authorshave given a detailed description of what happens
in our body when we disagree during a crucialconversation with the reader. It is written in afriendly style with a sense of humour, which makes
reading interesting.
Chapter 2, titled, “Mastering Crucial
Conversations”, focuses on the power of a dialogue.Through elaborate examples, the authors showhow dialogue works and how people can develop
their dialogue skills. How to stay focused on whatyou really want is the central theme of Chapter 3,
titled “Start with Heart”. Here is how people whoare skilled at dialogue stay focused on their goal,
particularly when the going gets tough.
“How to notice when safety is at risk” is takenup in Chapter 4, titled “Learn to Look”. In this
chapter, the readers will find a test which will helpthem to see what tactic they typically revert to when
caught in the midst of a crucial conversation.Unfortunately the web-site mentioned in the bookdoes not correspond with the test given in the
chapter.
Chapter 5, with the title “Make It Safe”,
elaborates how to make it safe to talk about almostanything. This part of the book is rich withinteresting examples followed by a few exercises.
The authors describe how misunderstandinghappens among the people. As an example, they
show a couple’s conversation which might makeor break their relationship. The authors state thatpeople usually say whatever is on their minds –
with no regard for how it will be received. Thenrealising that the topic was completely unsafe, they
move to silence or start sugar-coating their messageand, as a result, the real problem never gets fixed.
Chapter 6 explains how to stay in dialogue
when you are angry, scared, or hurt, under the title,“Master My Stories”. Here, the authors have
succeeded in explaining the nature of our emotionsand, as an example; they describe pretty strongemotions of Maria, who was preparing along with
her colleague a proposal for their boss. In thisexample, it is shown that emotions do not just
happen. We and only we create our emotions. Afterthat, we have only two options: we can act on themor be acted on by them. Maria’s feelings and
behaviour have been described so accurately; shewas feeling humiliated, angry, frustrated, betrayed,
and horrified and, as a result, she was showingsmug attitude, hostile reaction, having sarcasticcomments, and keeping a professional silence. This
story is followed by some model explanations howemotions, thoughts, and expressions lead to our
actions: “The Path to Action”. The author’s researchproves that many people, who are emotionallyilliterate, can not explain what is going on inside
them. The authors advise the reader to expand

Book Reviews
118 NICE Journal of Business l Vol. 3 l Nos. 1 & 2 l 2008
emotional vocabulary. When we are trying tointerpret the fact, we make our stories and exactly
these stories drive our emotions and not otherperson’s actions. As a matter of fact our story could
easily surprise and insult others.
“How to speak persuasively, not abrasively”,is dealt with in Chapter 7, titled “State My Path”.
Up to this stage the previous chapters intended toprepare the reader for crucial conversation. Now,
they are ready to open their mouths and startsharing their pool of meaning. This chapter explainshow to improve our advocacy skills. How can we
speak the unspeakable and still maintain respect?It can be difficult to share negative conclusions and
unattractive judgments (e.g., “I’m wondering ifyou’re a thief”).
Chapter 8, titled “Explore other’s Paths”
discusses how to listen when others arecommunicating in a way that is abusive and
insulting, or refusing to speak what is on their mind.In this chapter the authors add one more skill -Explore Other’s Paths - as a tool for helping others
feels safe. If we can find a way to let others knowthat it is okay to share their path to action – their
facts, their nasty stories and ugly feelings – thenthey will be more likely to open up. But what mustwe do for getting that? The readers will find the
detailed answer to this question. After all, the readerwill find out that after asking, mirroring,
paraphrasing, and eventually priming, the otherperson opened up and shared his or her path. But,what if you disagree? The authors give their
excellent detailed advice, like: “agree, build andcompare”.
Chapter 9, titled “Move to Action”, focuses onhow to turn crucial conversations into action andresults. Following some or all advice given in the
previous chapters, the reader will walk around withfull pools of meaning. In this chapter the authors
add two final skills which will help to make adecision. Dialogue is not a decision making tool,but a process for getting all relevant meaning into
a shared pool. The authors give, in detail, the fourmethods of decision-making: command, consult,
vote, and consensus. And, as conclusion, they givefour important elements: “Who?” “Does what?”“How you will follow up?” And, finally, they advise
not to leave your hard work to memory, –
“Document your work”. The authors’ advice to thereader is to write down the details of conclusions,
decisions, and assignments, and record that doeswhat, and by what time. The author’s further
advice to revisit notes at key times (usually the nextmeeting) and review assignments. If we followthese rules, it will hold people accountable and
when someone fails to deliver on a promise, it istime for a dialogue. By holding people accountable,
you not only increase their motivation and abilityto deliver on promises, but you create a culture ofintegrity.
Chapter 10 presents the tools for preparing andlearning, and is titled “Putting It All Together”. In
this chapter, the authors ask the reader who mustbe wondering how all these ideas can possibly helphim, especially during something as unpredictable
and fast-moving as a crucial conversation. Thischapter will help him in the daunting task of making
dialogue tools and skills memorable and useable.The authors here share what they have heard frompeople who have changed their lives by using these
skills. They lay out a model that can help visuallyorganise the seven dialogue principles and finally
they put forward an example of a crucialconversation, where all the dialogue principles areapplied. In this chapter, the reader will find many
models and tables. Using all these given tools andreminders, readers will get interested in and start
mastering the skills that help them improve theircrucial conversations.
In the next chapter, titled “Yeah, But”, the
authors share advice for tough cases. The readerswill find seventeen tough cases in the chapter. These
include: (1) “Failure to live up to agreements”,(2) “Deference to authority”, (3) Failed trust,(4) “Won’t talk about anything serious” (5) “Shows
no initiative”, (6) “I need time to calm down”,(7) “Endless excuses”, (8) “Touchy and personal”,
(9) “Dealing with someone who breaks all the rules”etc. Every case includes the danger point and thesolution.
In the concluding chapter, the authors explainhow to turn ideas into habits and title it “Change
Your Life”. Our chances of improving somethingare deeply rooted in our psyche and in the waywe communicate. There are a lot of factors that
affect our chances. One of this is ‘surprise’. High-

Book Reviews
NICE Journal of Business l Vol. 3 l Nos. 1 & 2 l 2008 119
risk discussions do not come with notice andreminders. More often, they come as unwelcome
surprises. Emotions do not help much either.Ability to pull yourself out of the content of
discussion and to focus on the process is inverselyproportional to your level of emotion. If youradrenaline is flowing, you are almost guaranteed
to jump to your style under stress. ‘Scripts’,another enemy of change, are pre-bundled phrases
we use in common conversations; they form thevery foundation of social habits and often makechange almost impossible. The following examples
help readers understand the point. So what arethe readers’ chances? Conversationalists are
shocked into motion by surprise, whipped up tospeed by high stakes and strong emotions, andpropelled along a completely predictable course
by scripts that offer few if any options. And hereauthors come with their research. Once they
examined forty-eight front-line supervisors whowere learning how to hold crucial conversations.The supervisors who in order to apply the new
skills gave four principles for turning ideas intoaction: first, master the content; second, master
the skills, third, enhance you motive, forth, watchfor cues. Every mentioned point is clearlydescribed in the book.
There is no doubt, the book is written by peoplewho are gifted at dialogue. With a goal to provide
a complete, stand-alone tool for personal changethey have included in the book everything a personmight need to conduct a crucial conversation.
The Foreword to the book has been written bythe celebrated author of the best-seller, “The 7
Habits of Highly Effective People”, StephenR.Covey.
When we fail a crucial conversation, every
aspect of our lives can be affected - from our career,to our community, to our relationships, to our
personal health. Master your crucial conversationsand you will improve your career, strengthen yourrelationships, and, above all, improve your health.
As people master high-stake discussions, they willalso vitalize their organisation and their
community.
It is a must-read for every person who wantsto empower his conversation skills. The book must
also be interesting and useful to students andteachers, working in the field of psychology and
business communication.
Evgeniya Zharikova
Lecturer in Foreign LanguagesSchool of Business StudiesShobhit University, Meerut - 250110
R.S. Dwivedi, A Textbook of Human ResourceManagement, Vikas Publishing, 2007,
New Delhi, Pages: 397, Paperback, Price Rs. 195
The present book on HRM is an attempt toemphasise a general management approach to
meet the challenges of human resourceseffectively. In essence, it deals with the evolution
of HRM models in India and abroad, humanresource planning, recruitment and selection,training and development, performance
appraisal, promotion and transfers, counselling,compensation, and the changing role of Industrial
Relation.
The book is divided into 10 chapters. Chapter1 deals with the introductory aspects including
managerial functions, nature and scope of HRM.Personnel management or people management, by
whatever name it is called, it amounts tomanagement of people so that the goals of anorganisation can be achieved. What is important is
that HRM need to be linked with the changingscenario due to globalisation, work-force diversity,
changes in technology, and research andinnovation. If organisations are able to face thesechallenges, they can have competitive advantage
over others. The most intriguing problem beforethe organisations is to align corporate strategy with
HRM strategy and the task of motivating employeesin relation to wage employment. At theorganisational level, it has to keep people young
and productive, turning the ‘industrial relation’ into‘cooperatives’ and the ‘development of
organisational culture’. At the workplace level, ithas to adapt to technological changes, tackle theproblem of non-performers, problem of grievance
management and at the departmental level, it hasto develop HR policies to fulfill the development
needs of people.

Book Reviews
120 NICE Journal of Business l Vol. 3 l Nos. 1 & 2 l 2008
In order to meet these challenges, organisationsneed to indulge in human resource planning (HRP).
It has been pointed out that HRP should beformulated at the same time while evolving
business planning (p. 37). Chapter 2 is devoted tothe quantitative and qualitative techniques of HRP,setting of policies, procedures and strategies to
achieve corporate objectives. It is highly importantto control the HR costs; otherwise the HRP may be
a failure. Chapter 3 relates to recruitment andselection. An attempt has been made to describethe process and the policy of recruitment, its sources
and innovative Indian practices, mainly, e-recruitment and EOGO scheme (each one get one
scheme) (p. 710). It also discusses the variousselection and placement devices. Methods ofselection, particularly, e-selection have been
emphasised.
The selected employees need to be trained for
the current job and developed for future jobs sothat they can be retained in the organisation.Chapter 4 focuses on training and development. It
includes the training needs and objectives, trainingpolicy, principles, methods and techniques, types
of training, employee development, nature,procedure, methods, and techniques ofmanagement development, career development
and succession planning as a development device.Chapter 5 describes the most controversial subject
of HRM performance appraisal. According to oneresearch finding, performance appraisal practicesin Indian organisations range from ‘no appraisal’
to ‘sophisticated’ multi-purpose, multi-componentbased appraisal systems (p. 146). The chapter
highlights performance management as a holisticapproach and elaborates potential appraisalpractices at Philips, Glaxo and Cadbury and
performance management system at the NationalStock Exchange of India. Thus, performance
appraisal is one yardstick by which an employeedemonstrates his capacity to contribute towardsthe organisational goals. In this connection, the
concepts of promotion, transfer, and separationassume importance. The key issues in promotion,
transfer and separation are provided in Chapter 6with the help of case studies of Central FertilizerCompany, Telco, Sandoz, etc. Furthermore,
voluntary retirement schemes, retrenchment,
outplacement and retention are discussed.‘Outplacement’ has emerged as a significant HR
programme in recent years. The major objectivesof outplacement and outplacement services are
outlined. It assists the separated people to cope withtheir emotional problems and reduce their periodof unemployment. In contrast to separation,
retention has emerged as a crucial HR function inthe critical skill shortage areas. Varied HR measures
and strategies are outlined to resolve retentionproblems.
Chapter 8 is devoted to the study of behavioural
concepts of counselling, empowerment and qualityof work life, to accomplish the corporate goals of
survival, growth, and profitability. Whileexamining the Indian perspective on counselling,an attempt has been made to describe a survey on
counseling services in Indian industries. The authorhas also given the findings of a study in a large
engineering organisation. Due to globalization ofbusiness, empowerment and quality of work lifehave emerged as important concepts for corporate
performance. The case examples of Sterling group,Shriram group, Eicher group, Tamil Nadu, Petro-
products Limited, Apollo Cancer Hospital,Mahindra and Mahindra, Reliance IndustriesLimited, and Hindustan Lever Limited, described
to illustrate how empowerment can be introducedin the Indian context for survival and growth.
The examples of quality of work life includethose conducted at the BHEL and RashtriyaChemicals and Fertilizers Limited. Quality of work
life is a shared responsibility, not only of themanagement and workers but also of the union
leaders, government and behavioural scientists.Chapters 8 and 9 examine the compensation systemand the changing role of employer and employees
in Indian context. The effectiveness of employeecompensation policy makes a vital difference in
gaining or losing a competitive edge. A hi-techcompany which offers better compensation tomanagerial and marketing personnel, but under-
pays its research and development staff may loseits ability to innovate, because competitors may take
away its best talent. It presents the new employer-employee relationship in the Indian context. Anattempt has also been made to examine the
changing role of the State and to outline the historical

Book Reviews
NICE Journal of Business l Vol. 3 l Nos. 1 & 2 l 2008 121
perspective on labour policy, indicating the needfor harmonising it in the context of new economic
policy. It further examines the role of the Councilof Indian Employers and status of trade unions in
India. It also outlines the meaning and types of tradeunions, their major central organisations, historicalcharacteristics, and measures to strengthen them.
The major objective of IR is to prevent industrialconflict by prescribing the providing legitimate
rights of both employers and employees and toestablish harmonious relations in the industry.Improving employee involvement and commitment
would help them to appreciate the employer’sperspective with empathy towards the employer’s
genuine problems. Finally, Chapter 10 presents thevarious approaches to industrial relations. Itoutlines the legal approach of conciliation and
adjudication and an ethical approach, embracingthe code of discipline, voluntary arbitration and
grievance-handling. In this chapter, the author alsoanalyses the concepts and processes of collectivebargaining and workers’ participation in
management. Participative system is a survivalneed of business and industry. The author, here,
outlines a number of issues that must be taken intoaccount while resurrecting this system.
Thus, the book, A Textbook of Human Resource
Management retains the flavour of a research-basedapproach to the study of HRM, particularly in the
Indian context. Extensive Indian studies have beenquoted to support of the concepts and points ofview. The author has sought to review as many
relevant Indian studies and cases as could bepossible and to integrate them to the context.
Students, teachers, and scholars should find theavailability of such a vast number of case studies in
one book a convenient reference source.
Teachers of HRM often find themuncomfortable with foreign case studies and
research results. It is mainly due to the easyavailability of books written by foreign authors and
lack of indigenous material suited for the Indiancontext. Also, the available Indian material is notcomprehensive. This book takes care of all these
concerns. The book suggests ways and means tomanage human resources effectively. Nevertheless,
the coverage is very exhaustive. Although the bookcontains only ten chapters, each chapter covers inas much detail as possible. The students will find
the coverage taxing, particularly at theundergraduate level. The twin fields of HRM and
IR are blended into one book. Many chapters, suchas those on collective bargaining, retirementschemes, workers’ participation in management,
grievance-handling, trade unionism, conciliation,and adjudication are included in this book.
The Appendices given at the end of the bookcontain useful matter. The innovative HRMteaching kits, given in Appendix C, in particular,
can be gainfully used by executives in work-settingsand students at business schools.
Dr. Kamlesh JainReader, Mata Sundri College for WomenUniversity of Delhi, Delhi

The Indian Journal of Industrial RelationsA Review of Economic & Social Development
Volume 44 Number 2 October 2008
Contents
Reservations: Compulsion & Contradictions Meghnad Desai
Invited Articles
Quest for Equality: Affirmative Action in India Ashwini Deshpande
Is Affirmative Action Policy for S. MadheswaranPrivate Sector Necessary?
Caste & the Corporate Sector Surinder S. Jodhka
Religion, Socio-economic Backwardness & Rowena RobinsonDiscrimination: The Case of Indian Muslims
Stratification among the Disadvantaged: Meena RadhakrishnaIdentifying the Rock-bottom LayersDecentralised Governance, Gender & Affirmative Chhaya DatarAction in Rural Drinking Water Management
Changing Dialectics of Dalit Aspirations: Sudhai PaiDemand for Affirmative Action
Articles
Personality, Generalised Self-efficacy & Team Saswata Narayan BiswasPerformance: A Study of Rural Development Teams
Human Resources Development Climate in India M. Srimannarayana
Non-monetary Rewards: Employee Choices & Pragya SonawaneOrganisational Practices
Family Business: Yesterday, Today, Tomorrow Ashok Panjwani, Vijay Aggarwal & Nand Dhameja
Communications
Book Reviews
Bibliography
SHRI RAM CENTREfor Industrial Relations and Human Resources
4, Safdar Hashmi Marg, New Delhi – 110 001 • Phone: 23352410/12/14/15e-mail: [email protected], [email protected] Website: www.srcirhr.com

NICE Journal of Business(Half-yearly Journal of School of Business Studies, Shobhit University, Meerut)
SUBSCRIPTION RATES
1 Year 3 Years
India Abroad India Abroad
Individual Rs. 200 US $ 20 Rs. 500 US $ 50
Institution Rs. 400 US $ 40 Rs. 1000 US $ 100
SUBSCRIPTION ORDER FORM
Please accept the enclosed cheque/demand draft, No.______________________, dated ___________________,
drawn on ____________________________________________ Bank, favouring Shobhit University, for
Rs. _____/- US$ __ towards subscription of NICE Journal of Business, payable at Meerut, for one year/three years.
Name ______________________________________________________________________________________
Organisation _________________________________________________________________________________
Mailing Address ______________________________________________________________________________
____________________________________________________________________________________________
____________________________________________________________________________________________
City _________________________________ PIN/ZIP __________________ Country ______________________
e-mail ____________________________
Mail to: The EditorNICE Journal of BusinessSchool of Business studiesShobhit UniversityModipuram, Meerut-250 110(INDIA)

Statement of Ownership and Other Particulars about the Journal
NICE Journal of Business(Half-yearly journal of Shobhit University, set up by NICE Society, Meerut)
Form IV(See Rule 8 of the Newspapers (Central) Rules, 1956)
1. Place of Publication Meerut
2. Periodicity of Publication Half-yearly
3. Printer’s Name Kunwar Shekhar VijendraNationality IndianAddress NICE Society
ModipuramMeerut-250 110
4. Publisher’s Name Kunwar Shekhar VijendraNationality IndianAddress NICE Society
ModipuramMeerut-250 110
5. Editor’s Name Prof. D.P.S. VermaNationality IndianAddress Shobhit University
ModipuramMeerut-250 110
6. Name and address of individuals NICE Societywho own the newspaper and partners Modipuramor shareholders holding more than Meerut-250 110one per cent of the total capital.
7. Printed at Print-WaysG-19, Vijay Chowk, Laxmi NagarDelhi-100 092
I, Kunwar Shekhar Vijendra, do hereby declare that the particulars given above are true to the best of myknowledge and belief.
Sd/-Kunwar Shekhar Vijendra
Publisher

MANUSCRIPT GUIDELINES
NICE Journal of Business invites academicians and professionals to contribute research papers, articles, abstracts ofdoctoral dissertations, major research project reports, case studies, comprehensive bibliography, and book reviews.The following are the guidelines for the authors:1. The contribution must be original, neither published nor under consideration for publication anywhere else.2. The cover page should contain the title of the paper, author’s name, designation, official address, contact phone/fax
number, e-mail address. The next page should contain an abstract of not more than 150 words, along with 5 key words.The main text should not contain the author’s name.
3. References should be given at the end of the manuscript and should contain only those cited in the text of themanuscript. These should be given in an alphabetical order of first author’s surname.
4. References should be given on the following pattern:(i) For books written by a single author:
Malhotra, Naresh K. (2007), Marketing Research, 5th ed. (New Delhi: Prentice-Hall of India), p.41. (ii) For books written by two or more authors:
Kotler, Philip, Deepak Jain, and Suvet Maesince (2002), Marketing Movers (Boston: Harvard Business SchoolPublishing Corporation), pp. 3-9.
(iii) For journal articles:Lather, Anu Singh, and Shilpa Jain (2007), “Need Behavioural Orientation of Dynamos and Drones inOrganisations”, Vikapla, Vol. 32, No. 1 (January - March), pp. 45-55.
(iv) For unpublished Ph.D. theses and M. Phil. dissertations:Sharma, Deepa, Consumer Grievance Redressel in India, unpublished M.Phil dissertation, Delhi University,Department of Commerce, Delhi, 2001, pp. 42-49.
5. Figures and tables should be numbered consecutively, in international numerals, and should appear soon after the textwhere they are first cited. The figures should be accommodated within two-thirds of A-4 size paper. All the figures andtables must be suitably captioned.
6. Please follow British spellings throughout: ‘programme’, ‘not program’; ‘organisation’, ‘not organization’;‘behaviour’, ‘not behavior’.
7. The use of capitilisation should be kept to the minimum, except in case of proper nouns, and should be followedconsistently.
8. A manuscript should normally be between 5000 to 8000 words (20 to 25 pages).9. The manuscript should be in double space; in 12-points font size on, A-4 size paper, leaving 4 cms margin on all sides,
so as to facilitate editing and styling. All texts, including abstract, quotations, notes and references should be typed indouble-space.
10. Authors using a questionnaire for collection of data for preparing the paper should send a copy of the questionnaire,along with the manuscript.
11. The contribution should be sent as an e-mail attachment to: [email protected], with a copy to:[email protected]. Moreover, one hard copy and a soft copy (in MS Word format) are to sent by post/courier.
12. The contributions received for publication shall be referred to two experts on the subject, for review and evaluation,after a preliminary review in the editorial office.
13. Correspondence and proofs for correction, if required, will be sent to the first-named author, unless otherwiseindicated. Corrected proofs should be returned within a week.
14. The forwarding letter must include a certificate by the author to the effect that the article is original and an exclusivecontribution to NJB and shall not be released for publication elsewhere unless the Editor’s decision not to publish ithas been communicated to the author.
15. The final decision on the acceptance or otherwise of the paper rests with the Editor/Editorial Board, and it dependsentirely on the standard and relevance of the paper.
16. The final draft may be subjected to editorial amendment to suit the Journal’s requirements.17. The author will receive one copy of the Journal, along with 10 reprints of his paper, free of charge, soon after its
publication.18. The copyright of the articles and other material, published in the Journal, shall lie with the publisher.19. While sending the manuscript, please state that the ‘Guidelines for Authors’ (for authors of NICE Journal of Business),
have been followed. Manuscript which does not conform to these guidelines may not be considered for publication.20. The reference to websites should be kept to the minimum. The date of accession of the website should be mentioned
within a bracket.

Printed and Published by Kunwar Shekhar Vijendra, Pro-Chancellor, Shobhit University, Meerut
and Vice-Chairman, NICE Society, for and on behalf of NICE Society, 54, Todarmal Road,
New Delhi-110001, at Print-Ways, Delhi-110092, 22514076, 9899094076 e-mail: [email protected]
Shobhit Institute of Engineering & Technology, Meerut
A University declared by GoI u/s 3 of UGC Act 1956