NICE Journal of Business · NICE Journal of Business Promoting and Preserving Business Research...
132
HALF-YEARLY JOURNAL OF SHOBHIT UNIVERSITY, MEERUT (INDIA) ISSN: 0973- 449X NICE Journal of Business Promoting and Preserving Business Research Listed in Cabell’s Directory, USA Included in EBSCO’s Database, USA Included in Ulrich’s Directory of Periodicals, USA Volume 11, Numbers 1 & 2 January - December, 2016 : : : : : : : : : : Pikay Richardson Amardeep Kaur Ahluwalia and Raghbir Singh Hardeep Chahal and Rupa Mahajan Sugandha Verma and T S Tomar Gurjeet Kaur and Stanzin Mantok Shamsher Singh Shweta Anand and Deepika Saxena Vaishali and R C Dangwal Shrawan Kumar Singh PERSPECTIVES Making Goods and Services Tax Operational: The Challenges Ahead Public Governance, Economic Development and Quality of Life RESEARCH PAPERS Children's Attitudes towards TV Advertisements : A Gender-wise Comparison Role of Organisational Citizenship Behaviour and Service-Dominant Logic in Value-creation in Higher Education: University Officers' Perspective Influence of Personal Characteristics on Work-life Balance of Women Employees Role of Financial Capital and Experience in Women Entrepreneurship and Empowerment: A Study of SMEs in Ahmedabad Consumer Perception of Various Attributes of Modern Retail Stores Financial Inclusion through On-line Banking Services : Impact of Customers' Occupation on their Awareness and Usage Level Poornima B G and Y V Reddy Determinants of Capital Structure in Automobile Companies: An Empirical Study Performance Evaluation of Public-sector Banks during the Second Phase of Economic Reforms BOOK REVIEWS
Transcript of NICE Journal of Business · NICE Journal of Business Promoting and Preserving Business Research...

HALF-YEARLY JOURNAL OF
SHOBHIT UNIVERSITY, MEERUT (INDIA)
ISSN: 0973- 449X
NICE Journal of BusinessPromoting and Preserving Business Research
Listed in Cabell’s Directory, USA
Included in EBSCO’s Database, USA
Included in Ulrich’s Directory of Periodicals, USA
Volume 11, Numbers 1 & 2
January - December, 2016
:
:
:
:
:
:
:
:
:
:
Pikay Richardson
Amardeep Kaur Ahluwalia and Raghbir Singh
Hardeep Chahal and Rupa Mahajan
Sugandha Verma and T S Tomar
Gurjeet Kaur and Stanzin Mantok
Shamsher Singh
Shweta Anand and Deepika Saxena
Vaishali and R C Dangwal
Shrawan Kumar Singh
PERSPECTIVES
Making Goods and Services Tax Operational: The Challenges Ahead
Public Governance, Economic Development and Quality of Life
RESEARCH PAPERS
Children's Attitudes towards TV Advertisements :
A Gender-wise Comparison
Role of Organisational Citizenship Behaviour and Service-Dominant Logic
in Value-creation in Higher Education: University Officers' Perspective
Influence of Personal Characteristics on Work-life Balance
of Women Employees
Role of Financial Capital and Experience in Women Entrepreneurship
and Empowerment: A Study of SMEs in Ahmedabad
Consumer Perception of Various Attributes of Modern Retail Stores
Financial Inclusion through On-line Banking Services : Impact of
Customers' Occupation on their Awareness and Usage Level
Poornima B G and Y V Reddy
Determinants of Capital Structure in Automobile Companies:
An Empirical Study
Performance Evaluation of Public-sector Banks during the Second Phase
of Economic Reforms
BOOK REVIEWS

(Half-yearly Journal of School of Business Studies, Shobhit University, Meerut) ISSN: 0973- 449X
EDITORIAL BOARD
NICE Journal of Business
Editor
Associate Editor
: Prof. D.P.S. Verma, Advisor, Shobhit University, Meerut
: Dr. Neha Yajurvedi, Assistant Professor, Shobhit University, Meerut
Prof. Abhinandan K. Jain Prof. Pankaj MadanIndian Institute of Management Dean
Ahmedabad (Gujarat) Faculty of Management Studies Gurukul Kangri University, Haridwar
Prof. Alok SaklaniDirector Prof. Pikay Richardson
Apeejay School of Management Manchester Business SchoolDwarka, Delhi University of Manchester
Manchester (U.K.)Dr. Amit AdhlakhaAssociate Professor Prof. Parimal .H. Vyas
IMS Unison University, Dehradun Vice-ChancellorM.S. University of Baroda, Vadodara
Prof. Anoop SwarupVice-Chancellor Prof. Pawan K. Agarwal
Jagran Lake City University, Bhopal (M.P.) Vice-Chancellor ICFAI University Dehradun
Prof. Arun Kumar University of Allahabad
Prof. R.C. DangwalAllahabadHead
Department of Commerce Prof. Furqan QamarHNB Garhwal Central University Secretary-General,
Srinagar, GarhwalAssociation of Indian Universities New Delhi Prof. R.D. Sharma
Vice-ChancellorProf. H. Chaturvedi University of Jammu, JammuDirector,
Birla Institute of Management Technology Prof. Ranbir SinghGreater Noida (U.P.)
Vice-ChancellorNational Law University, DelhiProf. K.N.Badhani
Indian Institute of ManagementProf. Sanjay MishraKashipur, Uttarakhand
School of Business University of KansasProf. M. Khalid Azam
Kansas (USA)Faculty of Management Studies Aligarh Muslim University
Prof. Sanjiv MarwahAligarh (U.P.)Director
J.K. Business School Prof. M.L. SinglaGurugram (Haryana)Dean
Faculty of Management StudiesProf. Sanjeev Kumar Sharma University of Delhi, Delhi
Director University Institute of Applied Management, Prof. Nawal Kishore
Panjab University, ChandigarhSchool of Management StudiesIndira Gandhi National Open University, New Delhi
Dr. Surendra MunjalUniversity of Leeds Business SchoolProf. Pratapsinh Chauhan
Leeds (U.K.)Vice-Chancellor Saurashtra University, Rajkot (Gujarat)
Prof. Yogendra VermaPro-Vice-ChancellorProf. P.K. Jain
Central University of Himachal PradeshDepartment of Management Studies Dharamshala (H.P.)Indian Institute of Technology, Delhi

From the Editor’s Desk ...............................................................................................................................iii
PERSPECTIVES
Making Goods and Services Tax Operational: The Challenges Ahead .......................................................1Shrawan Kumar Singh
Public Governance, Economic Development and Quality of Life.............................................................11Pikay Richardson
RESEARCH PAPERS
Children's Attitudes towards TV Advertisements: A Gender-wise Comparison........................................19Amardeep Kaur Ahluwalia and Raghbir Singh
Role of Organisational Citizenship Behaviour and Service-Dominant Logic............................................33 in Value-creation in Higher Education: University Officers' PerspectiveHardeep Chahal and Rupa Mahajan
Influence of Personal Characteristics on Work-life Balance of Women Employees.................................47Sugandha Verma and T S Tomar
Role of Financial Capital and Experience in Women Entrepreneurship....................................................59 and Empowerment: A Study of SMEs in AhmedabadGurjeet Kaur and Stanzin Mantok
Consumer Perception of Various Attributes of Modern Retail Stores........................................................73Shamsher Singh
Financial Inclusion through On-line Banking Services: Impact of ...........................................................87Customers' Occupation on their Awareness and Usage LevelShweta Anand and Deepika Saxena
Performance Evaluation of Public-sector Banks during the Second Phase................................................95 of Economic Reforms in IndiaVaishali and R C Dangwal
Determinants of Capital Structure in Automobile Companies: An Empirical Study...............................105Poornima B G and Y V Reddy
CONTENTS
BOOK REVIEWS
Strategic Management (Azhar Kazmi and Adela Kazmi)Sham Sharma
Marketing (Harsh V Verma and Ekta Duggal)Sanjeev Kumar
Armstrong's Handbook of Human Resource Management Practice (Michael Armstrong and Stephen Taylor)Neha Yajurvedi
Effective People( T V Rao)Vijay Kumar Shrotryia

SHOBHIT UNIVERSITY, MEERUT
Shobhit University, notified by the Government of India as a Deemed to be University, under Section 3 of the University Grants Commission Act, 1956, was envisaged and inspired by Babu Vijendra Kumar ji, an eminent agriculturist and social worker from Gangoh (Saharanpur) of U.P.
The University seeks to go beyond the established standards to nurture technocrats and prospective managers that have a global vision and insight in their chosen field.
SCHOOL OF BUSINESS STUDIES
School of Business Studies (SBS) is an integral part of Shobhit University, Meerut. It has inherited the academic legacy of the NICE Management College (established in 1995), and together with autonomy in curriculum-designing and flexibility for foreign collaborations, through academic exchange, and credit-transfer mechanism, and increased institution-industry interface. The SBS offers MBA programme with several specialisations, including marketing, finance, human resource management, production and operations management, and insurance and risk management. It also offers M.Phil. and Ph.D. programmes in management.
NICE JOURNAL OF BUSINESS
NICE Journal of Business is a half-yearly journal, earlier published by NICE Management College, Meerut, and now brought out by the School of Business Studies, Shobhit University, Meerut. It provides a platform to research scholars, practising managers, and academicians in business management, commerce, economics, and allied fields, to present their research findings and share their views and experiences.
The Journal aims at disseminating research output and providing information about recent developments in the relevant fields, by way of research articles, book reviews, Ph.D. thesis abstracts, case studies, and bibliographies, on topics related to business and allied areas. It is listed in Cabell's Management Directory (USA), and is included in EBSCO's Database, and Ulrich's Directory of Periodicals.
Original contributions received for publication in the Journal are subjected to a blind review, by experts in the relevant fields.
Shobhit University holds the copyright of the articles and other material published in the NICE Journalof Business. No part of the journal may be reproduced or transmitted in any form, or by any means, electronic or mechanical, including photocopying, recording, or by information storage or retrieval system, without the prior permission of the Editor/ Publisher.
Shobhit University is a NAAC-accredited research-intensive University that shares the values of high-quality teaching within an environment of internationally competitive research.

I feel privileged in placing before the readers the new issue (Volume 11, Numbers 1& 2: January-December 2016) of NICE Journal of Business. The response from the contributors and the readers to the earlier issues of the journal has been overwhelming.
With each issue of the journal, we bring to you the latest and authoritative insights into the fascinating world of business. The issue contains a panorama of research papers on topics of current interest in business.
In this issue, we have put together two perspectives and eight research papers, reflecting diverse interests in the field of business. The research papers pertain to the major areas of marketing, banking and finance, organisation behaviour, human resource management, entrepreneurship, information and communication technology and higher education. The two perspectives pertain to the new Tax system in the garb of the Goods and Service Tax and public governance
After a prolonged debate inside and outside Parliament, the Goods and Services Tax (GST) has become a reality. However, the transitional problems asoociated with the implementation of the new tax system cannot be ruled out. Prof. S.K.Singh analyses the current scenario and status of the GST and foresees the challenges likely to be faced by this revolutionary tax system proposed to be incremented in India., w.e.f. April 1, 2017.
Prof. Pikay Richardson observes that an improved quality of life derives from the economic growth, which, in turn, derives from the good governance and effective leadership. He argues a line of causation that starts with effective leadership, which is the bedrock of a good governance regime, which leads to economic progress and eventually to a better quality of life. Governance in a country can be broken into public and corporate governance. Here, he highlights the role of public governance in the national development and improving the quality of life.
Children's attitude towards TV ads not only determine their purchase behaviour but also other behavioural influences that ads have on them. Dr. Amardeep Kaur Ahluwalia and Prof. Raghbir Singh identify gender-wise factors affecting children's attitude towards TV ads. The factor structure and the relative importance assigned by boys and girls to various dimensions of TV ads are found to be different.
Prof. Hardeep Chahal and Ms. Rupa Mahajan examine the role of Organisational Citizenship Behaviour (OCB) and Service-dominant Logic (SDL) competencies in value-creation in higher-education institutions. With a sample of 55 officers of the University of Jammu and the Guru Nanak Dev University, Amritsar, they discover that the SDB contributes more to value- creation than the OCB.
Ms. Sugandha Verma and Dr. T.S. Tomar examine the influence of personal characteristics on the work-life balance (WLB) of women employees in the banking sector by using simple linear regression model. They observe the significant influence and predictability of the personal characteristics on the WLB
From
the
Edi
tor's
Des
k

of women employees.
Based on a sample of women entrepreneurship from small and medium enterprises in Ahmedabad city, the study conducted by Dr. Gurjeet Kaur and Ms. Stanzin Mantok reveals the relevance of financial capital and experience play an important role in promoting women entrepreneurship, which has a positive effect on women empowerment.
Prof. Shamsher Singh assesses the consumer perception of various attributes of modern retail stores in Delhi and finds how retail store attributes influence consumers' perception on major store attributes including price, variety, quality of products, in-store services, shopping convenience and ambience, and how the demographic factors affects the operation of these stores. He brings out valuable information for decision-makers of retail stores, so they can improve their marketing efforts and boost their sales.
On-line banking services have gained popularity in recent days. Prof. Shweta Anand and Dr. Deepika Saxena assess the impact of customer occupation on their awareness, and frequency of usage of on-line banking. Based on the data collected from 750 bank customers, their study reveals that the customer's occupation has a significant impact on all these aspects.
Dr. Vaishali and Prof. R C Dangwal examine the determinants of growth and performance of public-sector banks during the second phase of economic reforms in India. They make certain workable suggestions to improve the banks' performance.
Employing the panel data models, Ms. Poornima B G and Prof. Y V Reddy examine the relationship between the capital structure determinants and financial leverage in automobile companies in India. Their study reveals that profitability, growth, and tangibility significantly influence the financial leverage.
The section on book reviews contains four items, written by subject experts in the relevant fields. The books reviewed pertain to strategic management, marketing, human resource management, and human resource development.
I express my gratitude to the eminent scholars and expert book-reviewers for their precious contribution to the journal.
Several experts have made available their time and expertise for assessing the articles received for publication by making critical comments and suggestions for improving their quality. They truly deserve my sincere thanks.
D.P.S. Verma Editor
I owe a special word of thanks to Dr. Shobhit Kumar, Chairman, NICE Society; and Kunwar Shekhar Vijendra, Chancellor, Shobhit University, for their keen interest in this endeavour to promote, preserve and disseminate business research.

Abstract
More than 25 different taxes are currently levied on various goods and services by the States and the Centre in India, yielding nearly Rs.9 lakh crore per year as total indirect tax revenue. The GST would subsume all these rates into three or four tax rates to yield at least the same amount. Some people argue that multiple rates are necessary in an unequal society, like India. However, the multiplicity of rates increases the administrative complexities and the compliance cost. Rather than moving towards neutrality, the reform may increase distortions. The States might lose their fiscal autonomy. The GST Council would guarantee that the States would be compensated for any shortfall in their tax revenue for five years. This implies that the Centre will now bear all the risk of tax revenue under the GST. The Centre to proposes an extra cess on 'luxury' and 'sin' goods. There are arguments both for and against tax proposal. The proposal was considered disappointing as it would rob the GST of its efficiency-enhancing potential. It is impossible to have a flawless GST levied at single rate in India. The political considerations continue to rule.
MAKING GOODS AND SERVICES TAX OPERATIONAL The Challenges Ahead
Shrawan Kumar Singh*
* Former Professor of Economics and Director, School of Social Sciences, IGNOU, New Delhi, e-mail: [email protected]
Key words: Goods and Services Tax , GST Council, Indirect Taxes, Autonomy of States, Fiscal
Federalism
growth-and-employment-enhancing reform. INTRODUCTION
Following the President's assent to the constitutional amendment enabling the roll-out of The Goods and Services Tax (GST) was long the Goods and Services Tax (GST), India's move to overdue in India. This tax reform was debated for introduce the new indirect tax is all set to enter a more than a decade. There have been occasions in crucial stage. For the first time, they will share a the past when it appeared that this tax would be common indirect tax base, with the GST Council ushered in. After raising high expectations, the providing the modality for enforcing the law. GST Council has hit a speed breaker. It is a matter Whether such a sharing of tax base is harmonious of satisfaction that this initiative has commanded and sustainable will be the true test of the success of broad consensus across the political spectrum. It co-operative fiscal federalism in India. The appears to be a model of co-operative federalism in introduction of a full-fledged, broad-based GST practice, with the Centre and the States coming will have significant direct as well as indirect together as partners in bringing about such a
Perspective

NICE Journal of Business • Vol. 11 • Nos. 1 & 2 • January - December, 2016 NICE Journal of Business • Vol. 11 • Nos. 1 & 2 • January - December, 2016 2
impact. Due to the federal nature of the Indian series of serious discussions took place between the polity, the GST is proposed to be implemented Central Government and the State governments simultaneously by the States and the Centre from due to the multiplicity of stakeholders. An April 1, 2017. announcement was made in the Parliament through
the Union Budget (2007-2008) to the effect that the GST would be introduced from April 1, 2010 and
The Concept of GST that the Empowered Committee of State Finance Ministers would work with the Central The GST is a comprehensive indirect tax levied on Government to prepare a road map for introduction manufacture, sale and consumption of goods and of the GST in the country. Afterwards, the services at a national level, covering all sectors of Empowered Committee presented the First the economy at each stage of the supply-chain from Discussion Paper on November 10, 2009. A dual the supplier to the retailer. Even though the GST is GST structure, with defined tax functions and imposed at each level of the supply-chain, the tax responsibilities of the Centre and the States, was element does not become part of the cost of the recommended. An appropriate mechanism that product because the GST paid on the business would be binding on both the Centre and the States inputs is claimable. Hence, it does not matter how was to be worked out.many stages where a particular good and service
goes through the supply-chain because the input tax incurred at the previous stage is always deductable The Problem of Constitution Amendment by the successive business firms in the supply-chain. The GST will facilitate seamless credit The Constitution of India is not an instrument for across the entire supply-chain and across all the the levy of tax or implementation of tax reforms. It states under a common tax base. However, the is an instrument to empower the Central and the ultimate consumer will bear this tax as he is the last States governments to impose taxes and to provide link in the supply-chain. for a broad framework for the exercise of those
powers. The interests of the Union and the State The GST is by far the most preferred tax as it is governments do not necessarily coincide, nor are levied on the final consumption of goods and the interests of producing states in harmony with services where it occurs according to the those of the consuming States. There is a trade-off destination principle. Generally collected as a between tax harmony and fiscal autonomy and, multi-stage tax, the GST system facilitates the therefore, the ultimate GST structure to emerge 'flow-through' of the tax burden to the final would be a compromise solution. The optimism consumer while maintaining neutrality within the about the GST reform would be possible if the GST system. It is an essential pre-requisite to lay outcome of bargaining between the Union, 29 down the principles for the identification of the States and two Union Territories (UTs), with consumer who has to ultimately bear the tax burden legislature on the one hand and among the states of the GST. These principles are necessary to and UTs on the other. ensure that the chances of double taxation and unintended non-taxation are minimised. This is the Our Constitution provides for the delineation of most important tax reform - a paradigm shift in the power to levy tax between the Centre and the tax management in more than six decades. The GST States. While the Centre is empowered to impose is not merely a tax reform but a transformation of tax on services and goods up to the production how the business is conducted in India. It requires a stage, the States have the power to impose tax on careful and proactive planning by the stakeholders the sale of goods. The States do not have the powers to leverage its benefits. to levy any tax on the supply of services while the
Centre does not have the power to levy tax on the sale of goods. Thus, the Constitution does not vest Making of GST : The Processexpress powers either in the Central or the State
The GST law has evolved over a period of time. A Governments to levy a tax on the supply of goods
Shrawan Kumar Singh Making Goods and Services Tax Operational
and services. Moreover, the Constitution does not Constitution, the GST Council has been constituted thempower the States to impose tax on imports. on 12 September, 2016, which has set in motion
Therefore, it is essential to have Constitutional the formal process of the GST implementation. The amendments for empowering the Centre to levy tax Council has to make recommendations to the on the sale of goods and the States for levy of Union and the States on important issues related to service tax and import tax and other consequential the GST, like the goods and services that may be issues. subjected to or exempted from the GST, model
GST law, principles that govern the place of supply, thThe Constitution (115 Amendment) Bill, 2011, threshold limits, GST rates, including the floor
was introduced in the Lok Sabha in March 2011. rates with bands, special rates for raising additional The Bill was referred to the Parliamentary Standing resources during natural calamities/disasters, and Committee on Finance, for consideration. The special provisions for certain States.Standing Committee submitted its report in August 2013. But the Bill lapsed with the dissolution of the
th Salient Features of the GST15 Lok Sabha. With a view to introducing the GST, the Union finance minister tabled the Constitution
1. A three-tier levy of Central GST, State GST and nd(122 Amendment) Bill, 2014, in the Lok Sabha on an Integrated GST proposed. The first two will be
December 23, 2014. The Bill got passed in the Lok levied on the same set of goods and services, which
Sabha, but the Rajya Sabha referred it to a 21-means the States would get their bit straightaway, member panel. The Rajya Sabha Select Committee while the third (IGST) will be collected by the on GST rejected the three Congress objections Centre on inter-State transfers and will be shared which Mr. Chidambaram had listed, prompting the with the States.party to give dissent notes, along with a few more
issues. Thus, the Bill became the hostage in the 2. The IGST mechanism has been designed to Rajya Sabha. ensure seamless flow of input tax credit from one
August 3, 2016, the State to another. The inter-State seller would pay GST finally had its historic day in the Rajya Sabha the IGST on the sale of his goods to the Central with the passage of the Bill to amend the
Government after adjusting credit of the IGST, Constitution, paving the way for what is popularly
CGST and the SGST on his purchases (in that referred to as the concept of ‘one nation, one tax’.
order). The exporting State shall transfer to the Centre the credit of SGST used in payment of IGST. Any Constitution Amendment Bill needs a The importing dealer shall claim credit of IGST ratification from at least 50 per cent of the States. while discharging his output tax liability (both On being ratified by eighteen of the country's 31 CGST and SGST) in his own State. The Centre States, the long-pending GST Constitution
th shall transfer to the importing State the credit of Amendment Bill received Presidential assent on 8 stSeptember 2016 as the Constitution (101 IGST used in payment of the SGST.
Amendment) Act 2016. This act paved the way for 3. The GST is to be a destination-based tax. This the introduction of Goods and Services Tax (GST) implies that all SGST collected shall ordinarily by making special provisions with respect to the accrue to the State where the consumer of the goods GST. The Centre will now have the right to levy tax or services sold resides.at the retail stage and the States too will have the
right to levy the service tax. As part of the exercise 4. The Central taxes to be subsumed include:
on the Constitutional amendment, there would be a central excise duty (CenVAT), additional excise
special attention to the formulation of a mechanism duties, service tax, additional duty of customs or for upholding the need for a harmonious structure counter vailing duty (CVD) and special additional for the GST, along with the concern for the powers duty of customs (SAD), cesses and surcharges in so of the Centre and the States in a federal structure. far as they relate to supply of goods and services.
As per Article 279A(1) of the amended
After being subject to months of haggling and histrionics, on
3

5. The State taxes to be subsumed are: VAT/sales This is where the Centre needs to play a more pro-tax, entertainment tax, octroi, entry tax, purchase active role in raising service-tax collections. tax, luxury tax, State cesses, and surcharges, Service taxes are the fastest-growing segment of insofar as they relate to supply of goods and the entire tax-base. 'The quality of the GST reform services. will put to test the statesmanship of the leadership at
both the Central and the State levels'. Various 6. Crude oil, gas, aviation fuel, petrol, and diesel, suggestions have been made to roll out a 'perfect' which will now be excluded from the GST, can be GST. However, the best must not be the enemy of brought within its ambit once the GST Council the good. The bottom line is not to insist on starting accords its approval. with the perfect tax design but to improve matters
gradually. It is looking increasingly likely to be 7. Compensation to States for any loss of revenues implemented in the financial year 2017-18.due to implementation of the GST for a period of
five years.Challenges in the Implementation
8. Stamp duty and electricity duty shall continue to be out of the GST and, therefore, the cascading With the politics of getting the legislative hurdles effect of taxes shall continue for real estate and out of the way, the challenges in the power sectors. implementation of the GST are now to be
encountered. The GST Council is saddled with 9. A joint forum of the Centre and the States, known onerous challenges, contentious issues and as the GST Council, shall be an inter-state body, substantial amount of ground work. Now the need whose formation and operating procedures are is to shift to discussing the structure of the tax and clearly spelt out. The decisions of the Council are of the forms and hurdles in the implementation of the paramount importance since the very success of GST. The major issues to be taken into account for GST depends on them. making the GST operational are given below.
10. A not-for-profit, non-government company, 1. Fixing of GST Rates called the Goods and Services Tax Network
(GSTN), jointly set up by the Central and State The GST rates need to be framed against the larger Governments shall provide shared IT infrastructure issue of tax reforms, in order to avoid a messy and services to the Central and State Governments, transition to the new tax. In 2015, a panel headed by tax payers, and other stakeholders. Chief Economic Advisor Arvind Subramanian had
suggested a standard GST rate at which the tax will The GST is thus not a new tax, but simply a fall on a majority of the goods and services, be kept comprehensive VAT on goods and services. The below the 18 per cent mark. The issue of rates being GST will strongly facilitate and assist the process of technical as well as politically sensitive, is difficult 'Make in India'. All the stakeholders support the to resolve without bringing the Centre and the State basic concept of the GST, while disagreeing with its on board. At least directionally, one will get a sense specific-design features. It is noteworthy that the of where the rates are headed. The GST rates will GST is not an event; it is a process, and a process not be cast in stone. If necessary, they could be that can take several years. Besides, no reform is an revised after a review undertaken by the GST end in itself; it is always a work-in-progress. The Council. GST would, like any other reform, need
improvements and course corrections. But the The GST Council will have to decide if it is long-term perspective of a rational tax policy for politically feasible to tax the services at the the GST shows that the taxation policy would have standard GST rate. The higher rate for services to be flexible. under the GST is proposed being 18 per cent,
essential services such as transportation are The big game-changer is the taxation on services.
proposed to be taxed at 6 per cent or 12 per cent. GST accepted in the first place in developing The GST Council will need to arrive at consensus countries. However, it is important to ensure that around the different rate-schedules and the the fundamentals of the reform are not violated. products and services to be listed under each rate category (exempt, low rate/s, revenue neutral rate 2. Impact on Prices and higher rate). The Chief Economic Advisor has made a pitch for a lower GST rate, saying it will The GST implementation will have to take into help improve compliance and dispel inflation fears. consideration the impact on the poor and
economically weaker sections. The GST council is aware of this. As far as goods are concerned, the Deviation from the Standard GST Systemincidence of tax is expected to fall under the GST.
India is making a departure from a classical GST The GST impact would be less than the current system in many ways, including proposing the incidence of taxation. Despite being the fear of multiple-rate structure, which seems to be the only inflation, this can be managed and any unusual rise realistic way of moving ahead. A multiple tax rate in prices can be reined in. The implementation of in India is inevitable for several reasons. Different GST in some countries fuelled inflation and the items used by different segments of society have to government is keen to prevent a similar situation by be taxed differently. Otherwise, the GST would be starting with a low tax rate. Items with a nearly regressive. Air conditioners and hawai chappals 50% of the weight-age in the Consumer Price Index cannot be taxed at the same rate. Total tax basket, mainly food items, are proposed to be eventually collected has to be revenue-neutral. The exempted from the GST levy. It is important to government should neither lose money necessary ensure that the GST rate is moderate and credit for expenditure nor make a windfall gain. There is system smooth. The risk of inflation is certainly going to be seven different rates of taxation under real with regard to the service tax, which at present the GST as policymakers do not count three more is levied around 15 percent. An increase in service rates – a zero rate for items that will remain outside tax rates is likely to be the main cause for inflation. the new tax regime, a four per cent tax on gold and a But the overall incidence of service tax can be cess rate on the highest slab of 26 per cent, aimed at contained and even brought down if the compensating the States for their revenue loss. applicability of service tax component in GST is
modified through appropriate rebates.It remains a challenge to determine the rate structure to be adopted so as to incentivise
3. Computation of Compensation in lieu of compliance and, at the same time, generate enough Revenue Loss to the States revenues. Since losses are going to be notional in nature, it
This is perhaps the toughest task of the GST becomes important to laid down a transparent and Council, complicated by the stark economic detailed method to calculate the compensation, diversity of India's States. Six States account for as which is to be provided to States for initial five much economic activity as the remaining 23 States years. The compensation being proposed for states of the country. What may be a luxury goods in one by assuming a secular growth rate of 14 per cent in State may be an essential goods in another. The tax revenues on the base year of 2015-16 over the GST is an indirect tax and will affect the poor and next five years. States continue to raise issues on rich equally. Protecting the poor from an unduly how the compensation will be funded Justifying heavy tax burden can perhaps be best achieved the cess the union finance minister said that it through a low uniform rate for most goods except would be rolled back into the GST after five years. 'elite' and 'sin' goods. As argued by Richard Bird This would ensure no additional burden on the and Pierre Pascal Gendron, some imperfections taxpayer and yet be able to compensate the losing may even be an essential element of getting the states.
.
Shrawan Kumar Singh Making Goods and Services Tax Operational
NICE Journal of Business • Vol. 11 • Nos. 1 & 2 • January - December, 2016 NICE Journal of Business • Vol. 11 • Nos. 1 & 2 • January - December, 2016 4 5

Finance; and
4. Administrative Domain for GST (iii) The Minister in-charge of Finance or Taxation,
or any other Minister nominated by each State Who will collect the taxes - the States, the Centre, or Government and they will choose one from both? The promise of the GST is not only a uniform among themselves to be the Vice-Chairperson rate structure but also the uniform tax of the Council for a particular period.administration to ensure better compliance. The
taxpayers should have just one interface for their Functions: The Council shall make its integrated goods and services tax administration. recommendations to the Union Government and to The GST Council shoulders an enormous the States, on the following subjects:responsibility to carry along extremely diverse
States and transition smoothly to a unified 'one (i) The GST rates, cesses and surcharges nation, one tax' regime. The critical elements of the
levied by the Union, States and local tax reform are that it should reduce the bodies.administration, compliance and distortion costs to
(ii) The goods and services exempted from the the economy. The tax should have a broad base, low tax; rates, less differentiated rates and should be simple
(iii) Clause by change analysis of the Model and transparent.GST law which was put on public domain on June 14, 2016, will be analysed clause
The Crucial Role of GST Council by clause;
(iv) The apportionment of Integrated Goods As per Article 279A of the Constitution of India, the and Services Tax (IGST), the principles GST Council has been set up which may prove to be
the most powerful federal forum in the years to that govern the place of supply, and the come. The Council will be the gateway to the principles of levying the tax;successful implementation of the new tax. (v) Tax threshold limit of the turnover (below
which the goods and services may be Setting-up of the GST Council: The GST Council exempted from the GST);is to be a quasi-judicial-cum-administrative body. It (vi) Special provisions with respect to the will perform the legislative function delegated to it States of Arunachal Pradesh, Assam, by the Parliament and will also perform certain Jammu and Kashmir, Manipur, administrative functions. It will be a statutory body, Meghalaya, Mizoram, Nagaland, Sikkim, since it draws its power from the Constitution of Tripura, Himachal Pradesh, and India. The GST Council shall be a recommendatory Uttrakhand;body to the Central Government and State (vii) Prescribe the detailed procedure for the Governments. However, since it comprises conduct of its own business;political functionaries from the Centre as well as (viii) Recommend the date from which the from the States the Union Finance Minister and the GST would be levied on petroleum crude, State Finance Ministers. Thus, it will not be easy for high speed diesel, motor spirit (commonly the Centre and the States to ignore its known as petrol), natural gas and aviation recommendations without any strong reason. turbine fuel; and
(ix) Any other matter relating to the GST, as Composition: The GST Council shall consist of the the Council may decide.following persons:(i) Union Finance Minister, who shall be the
Voting at the GST Council Meeting:Chairperson;
(1) The Central Government shall have a (ii) Union minister of State in-charge of Revenue or rdweight of 1/3 of the total votes cast.
(2) The State Governments, taken together, could then be used more broadly to phase out other rdshall have a weight of 2/3 of the total subsidies”. The GST council is an important new
votes cast. institution of governance in India's federal system. (3) Every decision shall be taken, when it is A recommendation from this body is perhaps the
approved by at least 75% of the weighted only way of depoliticizing the process of tax votes of the members present and voting. reforms, which is essential if the Centre and the From such a voting pattern, it appears that it States are to take bold decisions in this area.will not be possible for the States to take any
It is pertinent to note here that the oversight of the decision against the will of the Centre, since financial pipeline is changing which gives a it has 33% votes to get any decision passed, completely new meaning to the concept of fiscal 75% votes are required, which is possible federalism. Intense politics preceded the birth of only when the Centre supports that the GST. But it would be a mistake to think that only particular decision. In the similar way, the good economics will henceforth guide the Centre cannot take any decision which is remaining workload to get the GST off the ground. opposed by the States.The real politics starts only now. The outcomes of the latest meeting of the GST Council are worrying.
The Challenges before the GST CouncilThe spirit of co-operation is not visible. Differences in the GST Council have delayed a The GST Council is facing a few big questions. compromise on the GST rates, the funding pattern What tax rates will maximise revenues and for compensation as well as distribution of minimise inflation? In the impossible trinity of oversight powers between the Centre and the guaranteeing revenues for the States, clean GST States. To justify the cess proposal, the Centre and fiscal discipline. Which goods and services will argued that it is a more efficient tool than the GST fall into which tax slabs across the country? structure to mobilise resources for the States' Multiple rates present problems because a low rate compensation. Expectations are that these for some goods forces a much higher rate for other differences are not insurmountable and are likely to goods to ensure overall revenue neutrality. The be resolved at the forthcoming meetings of the GST European Union has multiple rates, but they have council. The GST Council is a mini Parliament for recently released a Green Paper for discussion on making the GST operational.how to converge to a single rate. The real problem is
that the departure from an ideal GST will mean that productivity gains for the economy will be much How to ensure Success for the Scheme?less. Vijay Kelkar recently stated that the multiple-
While teething troubles are expected in various rate structure, with numerous exemptions, would
areas, including the definition and valuation of reduce the growth gains to one-fourth of what they
goods and the services under various might otherwise have been!
circumstances. The main task to be done is to call meetings of the GST Council and sort out the Given this scenario, one possible way out is to relevant issues. There are lots of moving parts. follow the advice of Kelkar, Satya Poddar and V. There are issues around technology and cultural
Bhaskar, when they recommended a common rate, readiness. There will be many challenges, which
with an effort to offset the adverse impact on the will come into picture once the GST Council starts
poor through a direct benefit transfer (DBT). They its work in the right earnest, but as is well known
estimate that a transfer of Rs. 2,000 per person, per there is always a solution for every problem and one
year, would more than suffice to offset any increase hopes that the GST Council will be able to find in post-tax prices and would cost only Rs. 50,000 constructive solutions for problems arise before it crore per year, which is a small price for a perfect and will make the GST a successful experiment in tax. Ahluwalia (2016) has observed that “this is a India. For the success of GST Council, Kelkar and neat solution which will have the added advantage Bhaskar have suggested the following measures: that it will test out the effectiveness of DBTs, which
Shrawan Kumar Singh Making Goods and Services Tax Operational
NICE Journal of Business • Vol. 11 • Nos. 1 & 2 • January - December, 2016 NICE Journal of Business • Vol. 11 • Nos. 1 & 2 • January - December, 2016 6 7

(i) Policy on delegated legislation: The more the component for the success of the GST. The system delegated legislation, the greater will be the should be capable of: centralised/integrated and differences in the application and impact of the dedicated software, revenue collection mechanism,
refund generation mechanism, tracking of inter-GST across states.state movement of goods & services, effective (ii) Transparency and predictability: There should collection and interpretation of 8 million monthly be no vacuum of uncertainty. To avoid returns, and generation of exception reports (eg. list uncertainty it could state upfront in which year of payment defaulters). Thus, a proficient IT it will recommend (or at least consider) Infrastructure is required for the national level inclusion of petroleum products in the GST coverage of the GST.base. These issues should form the basis of its
transparency policy.The IT backbone of the GST is an extremely
(iii) Inclusiveness: The council should exercise its complex and ambitious exercise as it involves powers with the utmost inclusiveness. There banks, small businesses, and the states. To carry out are a number of steps that could be taken to these requirements, the GSTN is required to create ensure inclusiveness. Information Technology infrastructure for the GST.
At its core, the Goods and Services Tax Network (iv) Capacity: To accomplish the ambitious task of (GSTN) is creating an IT platform that encodes the implementation, the GST Council needs to be GST processes of registration, returns, payments supported by an independent secretariat with
technical expertise. The secretariat should also and refunds, and implements the provisions of the produce or commission technical papers that GST Act and Rules. The GSTN system will also can guide future evolution of the rate structure maintain centralised ledgers (such as cash, and ITC and these should be put in the public domain. and Liability Ledgers for the IGST, CGST and the This would also enable business and industry SGST) of each individual taxpayer, thereby groups to lobby their point of view with both evolving to become the single source of truth for all the Central government and State governments. taxpayer credits and liabilities, across all the states The council secretariat must be adequately and the Centre. GSTN allows a common and shared staffed to enable it to independently propose, IT infrastructure between the Central Government analyse and evaluate GST-related proposals so and State Governments, along with other bodies of that it can provide objective advice to the GST Government of India e.g. RBI and CBDT, will add council. to the operational efficiency of the GST regime.
The Infosys software behemoth in September 2015 The GST Council needs to operate in a transparent, was tasked with the job of building the IT predictable, and consistent manner so that it infrastructure for the new indirect tax regime. commands the respect and credibility not only of its
The GSTN is the special-purpose vehicle (SPV) to members but also of all the stakeholders across the create the information technology backbone for the GST spectrum—ranging from manufacturers, tax. It is a Section 8 (not for profit), non-traders and service-providers to consumers, civil
society, academics, and the nation at large. Noted government, private limited company. It was economists Kelkar and Bhaskar (2016) observed incorporated on March 28, 2013 with the that the GST Council will “be the arbiter of most authorized capital of Rs. 10 crore. It would be better indirect taxes in India across the Centre and all to let the GST Council, represented by the Centre
stStates; it must aim to become a 21 century world- and States, take a call on the GSTN's ownership class institution epitomising co-operative fiscal pattern. The GSTN framework needs to safeguard federalism at its best”. the data and should have majority ownership of the
Government. The GSTN must ensure that the data Modus operandi of GSTN is secure and has a robust interface. The GSTN will
be compliant with security standards such as A high-end, technically-capable, error-free, 27001, as all banks and critical IT systems are effective, and efficient IT Infrastructure is the key
expected to be. The GSTN is working closely with inflationary impact on the common man is the least business process management (BPM), software while protecting the tax revenues of both the Centre firms like SAP, Tally and Oracle, among others, to and the States.facilitate timely preparedness of the corporate sector for the transition. The GSTN has been sharpening its capacity to handle the complex tax as REFERENCES GST.
Ahluwalia, Montek S. (2016). Next steps for the goods and services tax, Mint, October 28 CONCLUSION
Chakraborty, Pinaki (2016). Moderating the Hype, Given the diversity of economic development and Economic and Political Weekly, Vol 51, No. 33, divergence of opinion among States is not August 20surprising. The stalemate in the GST Council was
expected. To narrow down such differences is the Jain, Pratik (2016). GST cess confusion: Focus job of the GST Council. It was always unlikely that should be having most products at 18% rate, The the complex federal bargaining would be over Financial Express, October 21 smoothly and that too in a few meetings of the
Council. There are many months and years of Kishore, Praveen (2012). Administering Goods
negotiations ahead. What is worrying is the and Service Tax in India, Economic and Political direction these negotiations are taking, rather than Weekly, Vol. 48, No. 17, April 28the time needed to strike a deal. The political class is quite naturally worried that a low GST rate will Kelkar, Viajy, Satya Poddar, and V. Bhaskar hurt the budgetary revenue. Further, an increase in (2016). GST Make haste slowly, Mint, October the prices of items of mass consumption could lead 19to a political backlash, hence the multiple slabs rather than a single rate. Kelkar, Vijay, and V. Bhaskar (2016). The road
ahead for the GST Council, Mint, September 14A more dynamic view of the fiscal federalism is needed. The growth dividend from the GST is Prasanna, Alok Kumar (2016). Goods and Services expected to ensure that the total tax collections are Tax: An Exercise in 'Controlled Federalism'?, not adversely affected despite a lower tax rate. And Economic and Political Weekly, Vol 51, No 34, a renewed push for direct tax reforms should August 20ideally create fiscal space for a lower GST rate. Better planning, with synthesised data, could help Purohit, Mahesh C. (2010). Issues in the bring about a much smoother transition to a GST introduction of goods and services tax, Economic regime. The full benefits of the scheme will accrue and Political Weekly, Vol. 45, No. 5, January 30only when the tax structure is determined on a scientific and principled understanding, based on Rao, M. Govinda (2009). Goods and Services Tax: empirical evidence and by adopting global Some progress towards clarity, Economic and experience and best practices. It would be better to Political Weekly, Vol. 44, No. 51, December 19 make haste slowly while implementing the GST. To conclude, the vexing issues of the ideal tax rate, Rao, M. Govinda (2016). GST implementation:
Here's why increasing number of slabs is evolving the compensation mechanism for the retrograde, The Financial Express, November 1 States and the division of administrative powers
between the Centre and the States on levying the Rao, R. Kavita (2016). Now, iron out the wrinkles, service tax will have to manage the trade-off The Hindu Business Line, August 4between pragmatic politics and good economics,
being worked out in a way to ensure that the
Shrawan Kumar Singh Making Goods and Services Tax Operational
NICE Journal of Business • Vol. 11 • Nos. 1 & 2 • January - December, 2016 NICE Journal of Business • Vol. 11 • Nos. 1 & 2 • January - December, 2016 8 9

Rao, R. Kavita (2016). New Assumptions, New Singhal, Rajrishi (2016). The Politics of GST, Estimates: Scrutinising a New Report on Revenue Mint, October 19Neutral Rate, Economic and Political Weekly, Vol. 31, No. 4, January 23 Reports:
Government of India, Ministry of Finance (2009): Rao, R. Kavita, and Pinaki Chakraborty (2010). thReport of the 13 Finance Commission (Chairman: Goods and Services Tax in India: assessment of the
base, Economic and Political Weekly, Vol. 45, No1, Vijay Kelkar), December, New DelhiJanuary 2
First Discussion Paper on Goods and Services Tax In India (2009), The Empowered Committee of Sarma, J V M, and V Bhaskar (2012). A Road Map
for Implementing the Goods and Services Tax, State Finance Ministers, November, New DelhiEconomic and Political Weekly, Vol. 47, No. 31,
Government of India, Ministry of Finance (2015): August 4Report on the Revenue Neutral Rate and Structure of Rates for the Goods and Services Tax Shah, Kishore Kumar (2014). Goods and Services (Chairman: Arvind Subramanian), December, New Tax (GST) in India: Challenges and Opportunities, Delhi Global Journal of Multidisciplinary Studies,
V o l u m e 3 , N o . 9 , A u g u s t (http://www.gjms.co.in/index.php/gjms/article/view/348/559 (accessed on November 15, 2106)
Sarma, J V M, and V Bhaskar (2012). A Road Map for Implementing the Goods and Services Tax, Economic and Political Weekly, Vol. 47, No. 31, August 4
Shrawan Kumar Singh
“Your work is going to fill a large part of your life, and the only way to be truly satisfied is to do what you believe is great work. And the only way to do great work is to love what you do.”
Steve Jobs
Co-founder, CEO, Chairman, Apple Inc.
?????
“The fastest way to change yourself is to hang out with people who are already the way you want to be.”
Reid Hoffman Co-founder, LinkedIn
NICE Journal of Business • Vol. 11 • Nos. 1 & 2 • January - December, 2016 10

PUBLIC GOVERNANCE, ECONOMIC DEVELOPMENT AND QUALITY OF LIFE
Pikay Richardson*
* Professor, Manchester Business School, University of Manchester, Manchester (U.K.); e-mail: [email protected]
Key words: Public governance, Economic development, Quality of life, Leadership
Abstract
The author argues that the individual's welfare follows a line of causation that starts with 'effective leadership' through 'good governance' (both public and corporate), to 'economic development'. When any of these elements is missing or is ineffective, there can be no improvement in the average quality of life. He concludes that for any economic development to happen, those who take the leadership responsibility in a country should be competent and be capable of designing and maintaining a good governance regime.
1. The Model of Economic Development Governance. But 'good governance' is never a given, nor does it come by chance, good luck, or
Many national and international experts, and, magic. Rather, it is designed, developed, and indeed the true friends of developing economies, implemented by good effective leaders. say that the real impediment to sustained economic growth and development has more to do with the Many studies lend credence to this model. For quality of leadership and the absence of good instance, the World Bank has made it clear in its governance than with the economic plans and studies that good governance is a significant reforms. Research has established a relationship determinant of economic progress (Kaufmann et al, between the leadership, governance and the 2002). Two economists, Prof. Benno Ndulu and economic growth (Ndulu et al., 1999). There is now Prof. Stephen O'Connell, in a study on governance little debate about the model and causation of and growth in the sub-Saharan Africa, noted that development. An improved quality of life, as Africa's under-development could be linked measured by the Human Development Index, primarily to the governance models practised in derives from the increase in the socio-economic most parts of the continent.development. This, in turn, derives from good governance, comprising a combination of good In the same vein, the ex-Governor of the Central Public Governance and good Corporate Bank of Nigeria, Prof. Charles Soludo, quoting

Pikay Richardson
NICE Journal of Business • Vol. 11 • Nos. 1 & 2 • January - December, 2016 13
Public Governance, Economic Development and Quality of Life
NICE Journal of Business • Vol. 11 • Nos. 1 & 2 • January - December, 2016 12
from a study conducted by two researchers, Daniel are indivisible, and that the development of the Kaufmann and Aart Kraa, in the paper, titled, capacity for good governance is the primary way to “Creating effective governance and leadership for eliminate poverty. If good governance, through sustained national prosperity,” said that the per good leadership, is so important for the sustained capita income and the quality of governance were economic development and prosperity, then the strongly positively correlated across countries. developing countries in Asia, Africa and Latin Two other scholars, Benjamin F. Jones and America have no choice but to make good Benjamin A. Olken, writing on growth, leadership, governance the cornerstone of development. This and political institutions, also noted that countries is the challenge if real development and experienced persistent changes in growth rates improvement of the lot of the people is what across leadership transitions, and that leaders had a incumbent leaders truly desire, as against seeking large causative influence on the economic power in order to line their own pockets and to outcomes of their nations. feather their own nests. Increasingly, it is being
accepted in many circles, in line with Greg Mills' A Nigerian example would illustrate this point. assertion, that “poverty is now optional”.According to Dr. Adewoyin Olaoti, a development economist and Director of Adatey Konsult, Lagos,
2. What is Governance? Nigeria's failure to achieve sustained growth is linked to the lapses on the part of the past and
Governance is an indeterminate term used in the present leaders, as well as the political institutions.
literature on international development to describe He said, “Every plan that has been designed by
how public institutions conduct public affairs and successive administrations has had its good and bad
manage public resources. In the main, governance sides. But, on the whole, there was no plan that was
is 'the process of decision-making and the process incapable of moving the country forward
by which decisions are implemented (or not considerably. Rather, it was the canker of poor
implemented)'. The term governance can apply to implementation, selfishness, gross misconduct and
corporate, international, national, local governancecorruption on the part of those entrusted with the
or to the interactions between other sectors of powers of the state, the so-called leaders, who have
society.always spoilt the chances of such plans making any big difference”. He also noted that “it is not the The concept of good governance' often emerges as name of the plan that matters; neither can the plan in a model to compare ineffective economies or itself transform the country. Rather, it is the leaders political bodies with viable economies and political into whose hands the plan falls, and who are bodies. The concept centres on the responsibility of required and expected to keep the ball rolling, governments and governing bodies to meet the ensure that the plan succeeds”. Economic policies, needs of the masses as opposed to select groups in foreign inward investment and overseas society. Because countries often described as "most development aid, for instance, will only succeed in successful" are the Western liberal democratic boosting economic development if they are States, concentrated in Europe and the Americas, orchestrated and directed by competent leadership, good governance standards often measure other underpinned by good governance in recipient state institutions against these stateseconomies. This is not the rocket science.
Thus, a good governance regime is a sine qua non To showcase the importance of good governance to for sustainable and equitable development is economic development, the United Nations without debate. There are many ways in which the Development Programme has been at the forefront good governance engenders economic of the growing international consensus that good development. Governments have to make governance and sustainable human development decisions on macroeconomic and social policy that
have a direct impact on the long-term health of the politically, and economically, and regulated by economy. They provide critical public goods and formal and informal rules and laws. Civil society services, such as infrastructure, health and organisations are the host of associations around education that determine the competitiveness of the which the society voluntarily organises. They economy. Within such good governance regimes, include trade unions; non-governmental governments foster enabling environments for organisations; gender, language, cultural and private sector growth, and regulatory structures religious groups; charities; business associations; that the balance objectives of growth and equity. social and sports clubs; cooperatives and The experience of the East Asia shows that good community development organisat ions; governance is an essential component of dynamic environmental groups; professional associations; private-sector growth. academic and policy institutions; and media
outlets. Political parties are also included, although they straddle the civil society and the state if they
3. Good Public Governance: Key to Effective are represented in the Parliament.Macroeconomic Policy-making and Execution
The institutions of governance in the three domains Governance has three legs: economic, political, and referred to above (state, civil society, and the administrative. Economic governance includes private sector) must be designed to contribute to decision-making processes that affect a country's sustainable human development by establishing economic activities and its relationships with other the political, legal, economic and social economies. It clearly has major implications for circumstances for poverty-reduction, job-creation, equity, poverty alleviation and quality of life. environmental protection and the advancement of Political governance is the process of decision-women. making to formulate policy. Administrative
governance is the system of policy implementation. In essence, therefore, good public governance is the Encompassing all three, good governance defines bedrock of development. Among other things, it is the processes and structures that guide political and participatory, transparent, and accountable. It is socio-economic relationships.also effective and equitable and it promotes the rule of law. Good governance ensures that political, While governance encompasses the State, it social and economic priorities are based on broad transcends the State by including the private sector consensus in society and that the voices of the and civil society organisations. What constitutes poorest and the most vulnerable are heard in the state is widely debated in different contexts. decision-making on the allocation of development Here, the state is defined to include political and resources. The challenge for all societies is to create public- sector institutions. The private sector a system of governance that promotes supports and covers private enterprises (manufacturing, trade, sustains human development, especially for the banking, cooperatives and so on) and the informal poorest and the most marginal. On the contrary, the sector in the marketplace. Some say that the lack of good governance, exemplified by the private-sector is part of the civil society. But the existence, and glorification of, corruption, private sector is separate to the extent that private nepotism, fiscal indiscipline, parochialism, and sector players influence social, economic and poor leadership, are not only inimical to the process political policies in ways that create a more of economic and human development, it is, at best, conducive environment firms as well as the defeatist, and, at worst, vulgar.marketplace.
Although there is little or no debate about the The civil society, lying between the individual and importance of a good governance regime to the State, comprises individuals and groups national development, such regimes do not just (organised and unorganised) interacting socially,

happen, or come around by chance or good fortune. and the protection of property rights.(vii)Manage the changing role of the public sector They are fashioned by those who take leadership
in the context of globalisation, market positions in a country. Such leaders of governments economy, multi-party democracy and have to design macroeconomic and social policies information technology, which have that have a direct impact on the long-term health of significant implications for openness in the economy, and implement the same diligently to public-sector management.achieve tangible results. The issue of policy-
(viii)Cultivate and nurture an environment that will implementation need not be overemphasised. The accelerate poverty-alleviation and sustainable truth is that policy execution is as important as development.policy-formulation (strategising). Numerous
examples abound of cases where governments formulated wonderful policies but failed at the
4.1 Characteristics of a Good Public-implementation stage, thereby causing much
Governance Regimefrustration, pain, and cost. It is not enough for
Much has been written about the characteristics of governments to make pronouncements on great efficient government, successful businesses, and policies; it must be adept at actually providing effective civil society organisations, but the those critical public goods and services that characteristics of good governance defined in determine progress, in such a way as to ensure societal terms remain elusive. The following are the efficiency of resource allocation in the domestic main characteristics of a good governance regime:economy. In a fast-changing globalising world,
governments have an added responsibility of (i) Participation: All men and women have a voice ensuring national competitiveness in a highly-
in decision-making, either directly or through competitive global economy.legitimate intermediate institutions that represent their interests. Such broad participation is built on the freedom of 4. Governance in the Public Sectorassociation and the speech, as well as capacity to participate constructively.To effectively lead the process of tackling the
development challenge, the public sector must be (ii) Rule of law: Legal frameworks are fair and strengthened to perform the key functions of enforced impartially, particularly the laws on
human rights.poverty-alleviation, equitable development and (iii) Transparency: Transparency is built on the free participatory governance.
It needs enhanced capacity to : flow of information. Processes, institutions and information are directly accessible to those (i) Design and implement development policies concerned with them, and enough information and programmes.is provided to understand and monitor them.(ii) Provide efficient, cost-effective and responsive
(iv) Responsiveness: Institutions and processes try public service.to serve all stakeholders.(iii) Promote an environment that will facilitate and
(v) Consensus orientation: A system is set up that sustain the emergence of a strong and vibrant mediates differing interests to reach a broad private sector and the civil society.consensus on what is in the best interests of the (iv)Establish and manage an effective and group and, where possible, on policies and transparent regulatory and legal framework to procedures.guide the growth and development of the
(vi) Equity: All men and women have opportunities private sector.to improve and maintain their well-being.(v) Address the issue of transparency and
(vii) Effectiveness and efficiency: Processes and accountability in public service.institutions are set up to produce results that (vi) Enhance institutions that promote and enforce meet needs while making the best use of the rule of law for legitimacy, social stability
resources. ensure that everyone participates in economic and social development and take advantage of (viii) Accountability: Decision-makers in the globalisation. They must build a political system government, the private sector and the civil that encourages the government, political, business society organisations are accountable to the and civic leaders to articulate and pursue objectives public, as well as to institutional stakeholders. that are centred around people and a system that This accountability differs according to the promotes public consensus on these objectives. organisation and whether the decision is
internal or external to the organisation. (ix) Strategic vision: Leaders and the public have a
4.3 Public Governance, Capacity-building and broad and long-term perspective on good Sustainabilitygovernance and human development, along
with a sense of what is needed for such In Section 4.1, we referred to those elements which development. There is also an understanding of characterise a good governance regime. Here, we the historical, cultural and social complexities amplify these elements and argue that in order to in which that perspective is grounded. achieve national progress and sustain it, the twin
elements of governance and capacity building should be pursued unceasingly. A number of key
4.2 Governance in the Global Context principles which reflect the essential attributes of a th well-functioning public sector, as well as the The late 20 Century saw the beginning of a sea-
creation of an environment conducive for the change in the socio-economic landscape of the private sector to function efficiently in the creation world. This comprised a transformation from the of wealth, should be at the forefront of public command economies to the market-oriented action. These principles include:economies, the emergence of democratic political (i) Accountability: This is a fundamental tenant of regimes in the former United Soviet Socialise
good management and for our purpose it Union Republic, the rapid development and global implies that public employees, whether proliferation of new technologies, the pervasive working individually or collectively, need to be spread of information and telecommunications placed within a framework that clearly sets out system, the growing importance of knowledge-the goals, establishes incentives for the based industries and skills, and the continuing achievement of the desired outcomes, and integration of the world economy through trade and monitors progress towards these ends. This is investment. These have created the foundation for also applicable to the judiciary and other a new age of sustainable human development, components of the legal system.which can enable a nation to create and sustain
(ii) Strategic Focus: This is essential in an equitable opportunities for its people or precipitate environment where needs are vast and a race to the bottom.resources are limited. Consequently,
If the government does not function efficiently and organizations in the public sector must have a effectively, scarce resources will be wasted. If it clear sense of purpose; otherwise, they are does not have legitimacy in the people's eyes, it will likely to dissipate energy and resources over a not be able to achieve its goals. If it is unable to range of activities that may not be directly build national consensus around useful objectives, related to their fundamental objectives.no external assistance can help. If it is unable to (iii) Transparency and Predictability: These are foster a strong social fabric, the society risks
impor tant as more rapid economic disintegration and chaos. Moreover, if people are
development is possible when the private sector not empowered to take responsibility for their own
can operate within a set of stable, predictable development within an enabling framework
"rules of the game" that facilitate investment provided by the government, development will not
decision-making and promote investor be sustainable.
confidence. It is in this area that the need for an efficient legal system is most apparent. Well-It is, therefore, crucial for developing countries to
Pikay Richardson
NICE Journal of Business • Vol. 11 • Nos. 1 & 2 • January - December, 2016 15
Public Governance, Economic Development and Quality of Life
NICE Journal of Business • Vol. 11 • Nos. 1 & 2 • January - December, 2016 14

developed laws, which are not subject to their opportunity to participate in, or endorse, arbitrary change, an independent judiciary, and decision-making affecting their lives.a minimum level of technical competence (ii) Co-operation: Recognising that a sense of within the judiciary, are essential for ensuring belonging is important for personal fulfilment, predictability in business relations. Without well-being and a sense of purpose and meaning, such predictability, the transaction cost may be human development is concerned with the so high that the economic activity is stifled. ways in which people work together and
(iv) Responsiveness: It is vital for public interact.organisations to be client-centred and to focus (iii)Equity: The expansion of capabilities and their efforts on providing services that are in opportunities means more than income; it also great demand. This, in turn, fosters higher means equity, such as an educational system to 'customer' satisfaction and reduces the which everybody should have access.diversion of resources into unnecessary or (iv)Sustainability: The needs of a current lower priority goods and services. generation must be met without compromising
(v) Participation: People should be maximally the right of future generations to be free of encouraged to participate in the affairs of the poverty and deprivation and to exercise their State. This is important as a government is basic capabilities.more effective when it operates, within a robust (v) Security: The guarantee of security, in civil society. The relevance of public particular, the security of livelihood, is crucial participation is most apparent in the law- for development and the attainment of liberty. making process since the law which does not People need to be freed from threats, such as enjoy a wide societal consensus is difficult to disease or repression and from sudden harmful enforce. disruptions in their lives
4.4 Sustainable Development : Ultimate Goal 5. Good Governance and Leadershipof Good Public Governance
The word 'governance' derives from 'govern', The goal of governance initiatives is to achieve which means: to rule a country, to control or direct national sustainable development through the the public affair of a city; control, influence development of capacity that alleviates poverty, something or somebody; and to determine advances women, sustains the environment and something. Governance is the activity or manner of creates necessary opportunities for employment governing, and the main ingredient of good and earnings of livelihood. The UNDP defines governance is principled-centred leadership.sustainable human development as expanding the
choices for all people in society, i.e., the creation of an enabling environment where all can enjoy long, In turn, 'leadership' derives from the word 'leader', healthy and creative lives. It also means the which means, someone who determines the right protection of the natural systems on which the life thing to do and leads people to get it done. From depends and the protection of life opportunities for these meanings, it is obvious that governance and future generations. leadership point to 'direction and leading'. While
there can be no progress without good governance, leadership is the pivot around which good Sustainable human development has five elements, governance revolves. Leaders are people who all affecting the lives of the poor and the vulnerable. develop visions of future progress, develop These are: strategies and align people behind them to achieve the visions. In this way, the main attribute of a good (i) Empowerment: The expansion of men and leader is the ability to render selfless service and women's capabilities and choices increases refraining from selfishness. their ability to exercise those choices free of
hunger, want and deprivation. It also increases
In essence, good governance and leadership are Overseas Development Institute, Londonconcerned with one thing: the good and prosperity
3. Al-Rodhan and Nayef, R. F. (2009). Sustainable of society as a whole. Unfortunately, the model of History and the Dignity of Man: A Philosophy of leadership and governance in much of the History and Civilisational Triumph, LITdeveloping world has, in the main, disappointed
and betrayed peoples' trust. The attitude of 4. Munshi, Surendra, Abraham, Biju Paul, and selfishness, desire for power for power sake and a Chaudhuri, Soma (2009). The intelligent person's drive for money has been very pervasive. With this guide to good governance. New Delhi, India: Sage kind of governance and leadership, there is little Publications.wonder that economic progress has eluded most of
sub-Sahara Africa in much of the post-5. Benno J. Ndulu and Stephen A. O'Connell independence era. The story is similar in many (1999). Governance and Growth is Sub-Saharan Asian countries.Africa, Journal of Economic Perspectives, Vol.13, No.3, Summer
CONCLUSION 6. Jones, B F, and Olken, BA (2002). Do Leaders Matter? National Leadership and Growth Since The creation of a good governance regime on World War II, NBER, Harvard University, Marchwhich human development depends to a large
extent, poses serious challenges to those who hold 7. Weiss T G (2000). Governance, good governance
leadership position in a country. This is more so in and global governance: Conceptual and actual
developing countries, where the challenges are challenges, Third World Quarterly, 21(5), 795-814
more pronounced. For example, the governance challenges facing the leaders in Africa and India are 8. Agere, Sam (2000). Promoting good numerous, and require great dedicated efforts to governance. Common wealth Secretariat, London. achieve improvements. Unfortunately, this has been lacking for most of the post-Independence, 9. Khan, Mushtaq Husain (2004). State formation and this is in a world where efficiency and in Palestine: viability and governance during a effectiveness constitute a condition sine qua non social transformation, Political Economy of the for economic and social progress. The need for Middle East and North Africa. Vol 2. Routledge.competent, effective and ethical leadership in has never been more urgent. 10. Heritier, P., & Silvestri P. (Eds.) (2012), Good
government, Governance, Human Complexity. Luigi Einaudi's legacy and contemporary societies,
Select Bibliography Leo Olschki, Firenze.
1. Kaufmann, D, and Kraal, A (2002). Growth 11. Mills, G (2011). Why Africa is poor – and without Governance, World Bank Policy Research what Africans can do about it ? Penguin Global, Working Paper, No. 2928, November London
2. Rocha Menocal, A. (2011). Analysing the relationship between democracy and development.
Pikay Richardson
NICE Journal of Business • Vol. 11 • Nos. 1 & 2 • January - December, 2016 17
Public Governance, Economic Development and Quality of Life
NICE Journal of Business • Vol. 11 • Nos. 1 & 2 • January - December, 2016 16
ACKNOWLEDGEMENT TO REFEREES
The following experts acted as referees for papers received for publication in NICE Journal of Business. We acknowledge their valuable comments and suggestions.
1. Prof. Alok Saklani, Director, Apeejay School of Management, Dwarka, Delhi
2. Dr. B. Charumathy, Associate Professor of Management, Pondicherry
University, Puddu Cherry
3. Dr. Deepa Sharma, Associate Professor, Maharaja Agrasen College, University
of Delhi, Delhi
4. Prof. Gitika Kapoor, Dean, R.A. Podar Institute of Management, University of
Rajasthan, Jaipur
5. Prof. Hardeep Chahal, Department of Commerce, Jammu University, Jammu
6. Prof. J.S. Panwar, Former Dean, Faculty of Management Studies, Sardar Patel
University, Anand (Gujarat)
7. Prof. K.N. Badhani, Indian Institute of Management, Kashipur (Uttarakhand)
8. Dr. Neeru Kapoor, Associate Professor of Commerce, Delhi Collage of Arts &
Commerce, Delhi University, New Delhi
9. Prof. Pikay Richardson, Manchester Business School, Manchester (UK)
10. Prof. Sanjay Mishra, School of Business, University of Kansas, Kansas (USA)
11.Dr. Surender Munjal, University of Leads Business School, Leads (UK)
12.Prof. SC. Kundu, Haryana School of Business, Guru Jambeshwar University,
Hisar

Abstract
Purpose: The study seeks to identify the factors affecting the children's attitude towards TV ads and to make a comparison between the attitudes of boys and girls.
Methodology: The sample comprised 400 children selected from reputed private English –medium schools of three cities of Punjab. The data was analysed with the help of factor-analysis, on the basis of gender.
Findings: The factor structure and the relative importance given both by boys and girls to various dimensions of area are found to be different.
Limitations: The study was limited to the state of Punjab. It took into consideration only the urban and the economically-stronger sections of the society.
Contribution/ Policy Implications: Children's attitude towards ads not only determines their product purchase behaviour but also other behavioural influences that ads have on them.
CHILDREN'S ATTITUDES TOWARDS TV ADVERTISEMENTS A Gender-wise Comparison
Amardeep Kaur Ahluwalia* and Raghbir Singh**
* Assistant Professor, Department of Business Management, Guru Nanak Dev University Regional Campus, Gurdaspur; e-mail: [email protected] ** Former Professor, Department of Commerce & Business Management, Guru Nanak Dev University, Amritsar; e-mail: [email protected]
other family members (McNeal, 1969; INTRODUCTIONBuckingham, 2000; Clarke and Smallbone, 2001; and Oates et al. 2003).
A Television advertisement (TV Ad) is an The research suggests that marketing to children is important experiential component in a child's life. no child's play. Children might appear to be more Although children demonstrate a fair amount of receptive to advertisements but their critical awareness about the entire range of advertising abilities should not be underestimated. However, media that extend far beyond TV; the research the research also reveals that children are more reveals that children invariably respond in terms vulnerable in comparison to adults, although the of TV when asked about adver t i s ing effective ads can impress even the most rational (Narasimhamurthy, 2014). Children are not only adults. Advertising exerts substantial influence on seen as an attractive market segment (Pecheaux and beliefs and attitudes. Hence, there is an increased Derbaix, 2002) but also an influential market as concern regarding the ethics of advertising they exert influence on the purchasing habits of
Key words: TV advertisements, Children's attitude, Gender-wise comparison, Purchase behaviour
RESEARCH PAPERS
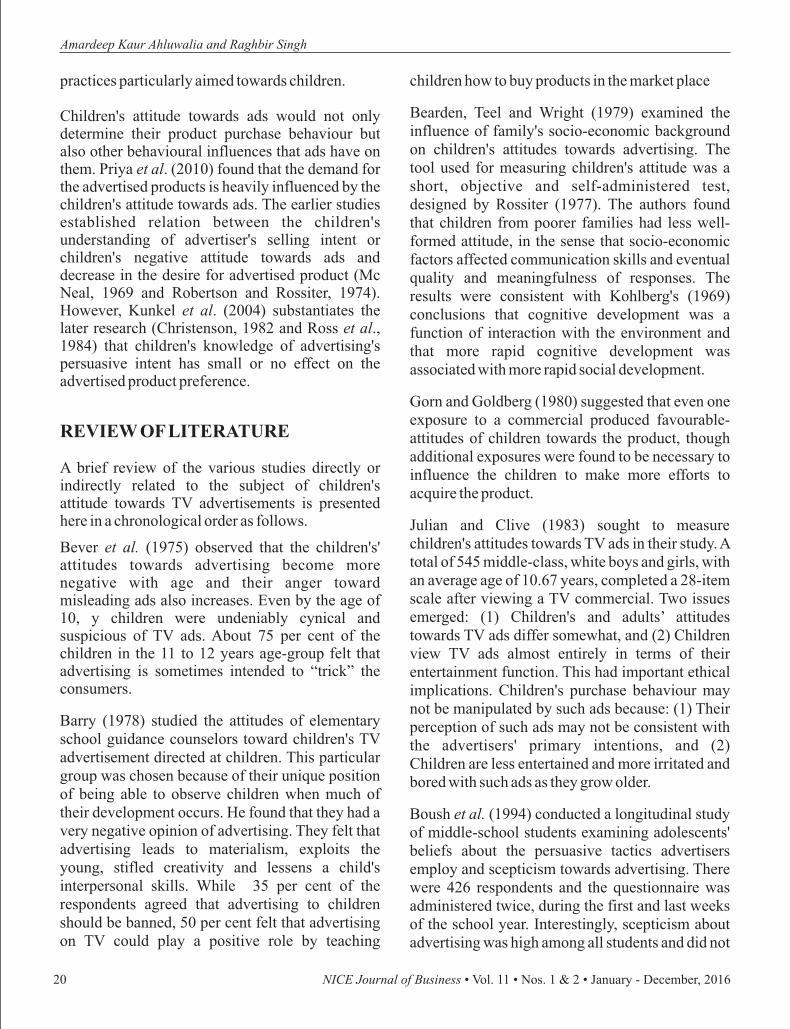
NICE Journal of Business • Vol. 11 • Nos. 1 & 2 • January - December, 2016 21
practices particularly aimed towards children. children how to buy products in the market place
Bearden, Teel and Wright (1979) examined the Children's attitude towards ads would not only influence of family's socio-economic background determine their product purchase behaviour but on children's attitudes towards advertising. The also other behavioural influences that ads have on tool used for measuring children's attitude was a them. Priya et al. (2010) found that the demand for short, objective and self-administered test, the advertised products is heavily influenced by the
children's attitude towards ads. The earlier studies designed by Rossiter (1977). The authors found established relation between the children's that children from poorer families had less well-understanding of advertiser's selling intent or formed attitude, in the sense that socio-economic children's negative attitude towards ads and factors affected communication skills and eventual decrease in the desire for advertised product (Mc quality and meaningfulness of responses. The Neal, 1969 and Robertson and Rossiter, 1974). results were consistent with Kohlberg's (1969) However, Kunkel et al. (2004) substantiates the conclusions that cognitive development was a later research (Christenson, 1982 and Ross et al., function of interaction with the environment and 1984) that children's knowledge of advertising's that more rapid cognitive development was persuasive intent has small or no effect on the associated with more rapid social development.advertised product preference.
Gorn and Goldberg (1980) suggested that even one exposure to a commercial produced favourable-
REVIEW OF LITERATURE attitudes of children towards the product, though additional exposures were found to be necessary to
A brief review of the various studies directly or influence the children to make more efforts to indirectly related to the subject of children's acquire the product.attitude towards TV advertisements is presented here in a chronological order as follows. Julian and Clive (1983) sought to measure
children's attitudes towards TV ads in their study. A Bever et al. (1975) observed that the children's' total of 545 middle-class, white boys and girls, with attitudes towards advertising become more an average age of 10.67 years, completed a 28-item negative with age and their anger toward scale after viewing a TV commercial. Two issues misleading ads also increases. Even by the age of emerged: (1) Children's and adults’ attitudes 10, y children were undeniably cynical and towards TV ads differ somewhat, and (2) Children suspicious of TV ads. About 75 per cent of the
children in the 11 to 12 years age-group felt that view TV ads almost entirely in terms of their advertising is sometimes intended to “trick” the entertainment function. This had important ethical consumers. implications. Children's purchase behaviour may
not be manipulated by such ads because: (1) Their Barry (1978) studied the attitudes of elementary perception of such ads may not be consistent with school guidance counselors toward children's TV the advertisers' primary intentions, and (2) advertisement directed at children. This particular Children are less entertained and more irritated and group was chosen because of their unique position bored with such ads as they grow older. of being able to observe children when much of their development occurs. He found that they had a Boush et al. (1994) conducted a longitudinal study very negative opinion of advertising. They felt that of middle-school students examining adolescents' advertising leads to materialism, exploits the beliefs about the persuasive tactics advertisers young, stifled creativity and lessens a child's employ and scepticism towards advertising. There interpersonal skills. While 35 per cent of the were 426 respondents and the questionnaire was respondents agreed that advertising to children administered twice, during the first and last weeks should be banned, 50 per cent felt that advertising of the school year. Interestingly, scepticism about on TV could play a positive role by teaching advertising was high among all students and did not
vary across their grades. It was documented that Socialization is the process by which “young knowledge of advertising tactics and appeals people acquire skills, knowledge and attitudes continues to develop during adolescence. As they relevant to their functioning as consumers in the mature, children make a transition from the viewers marketplace” (Ward and Wackman, 1973, p.1). who see advertising as purely informative, They found that the extent of TV viewing can have entertaining, and trustworthy, to ones who view positive effects on adolescents' consumer advertising in a more sceptical, analytical, and socialisation, unlike earlier studies (Grossbart and discerning fashion. In the light of these trends, the Crossby, 1984 and Goldberg, 1990). TV viewing end result of this socialisation process will be increases marketplace knowledge which mediates widespread scepticism and dislike of advertising by the effects of socialisation. They observed that the older children. The level of scepticism toward concept-oriented family communication (where advertising was high and was positively related to children are encouraged to develop their own having a more adult understanding of advertising individual view of the world, their own competence tactics. Further, consumer susceptibility to and skills as consumers), peers' informational interpersonal influence was negatively related to influence and the extent of their TV- viewing are disbelief in advertising. positively related to their scepticism towards
advertisements. Unnikrishnan and Bajpai (1996) conducted a research to study the impact of TV ads on 730 Verma and Kapoor (2004) found that both the children, who represented a cross-section of Delhi's parents and children felt the impact of TV ads on population. The TV ads that the children (aged 8 to children's purchase request. However, with an 15 years) in the sample responded to were those that increase in the age of the child, the parents' were broadcast via Doordarshan (India's National perception of the children's purchase request being TV Network). A large majority (75 per cent) of the influenced by TV ads tended to decrease. Parents' respondents said that they loved watching ads on response to children's purchase request was found TV. When asked whether they liked them better to be strongly influenced by the age of the child and than the TV programmes, more than 46 per cent the family income. They further noted that the replied in the affirmative. It was observed that the parent-child interaction plays an important role in children in the 8-plus age-group seemed more the children's learning, positive consumer values, interested in knowing about new products, and and in parents perceiving the influence as positive seemed to act as the family's 'antenna', picking up on their children's buying response. Thus, instead new ideas, noticing new products, and keeping a of criticising TV ads, it would be desirable if the watchful eye on premiums, discounts, free gifts and parents resorted to more of co-viewing and sales offers. Moreover, the desire to own the explaining the intent and contents of such advertised products increased with age, as 74.5 per advertisements to their children. cent of children confirmed this. Over 80 per cent
Another study by Kapoor and Verma (2005) said they asked for the brands they had seen on TV. revealed that Indian children are not as easy a target Furthermore, from the gender perspective the boys as advertisers and critics believe. They are able to wanted to buy much more than the girls (20.8 per analyse TV ads and develop a realistic approach cent: 9.73 per cent).towards them. It was further noticed that children as
Mangleburg and Bristol (1998) adopted a young as six-year old, could understand the socialisation explanation for adolescents' purpose of a TV ad and distinguish it from a TV scepticism towards TV ads. They define scepticism programmes. With increase in the age of the child, a as a negatively valenced attitude, which is an significant increase in his/her cognitive outcome of the socialisation process. Socialisation understanding of the ad was found. Armed with the is mainly an interaction with three socializing knowledge about the advertiser's persuasive intent agents: parents, peers and the mass media. and scepticism about the truthfulness of advertising
Amardeep Kaur Ahluwalia and Raghbir Singh
NICE Journal of Business • Vol. 11 • Nos. 1 & 2 • January - December, 2016 20
Children's Attitudes towards TV Advertisements

claims, children above the age of eight years were among the different age-groups lead to the found to have the ability to respond to TV ads in a formation of varying attitudes towards ads. They mature and informed manner. The authors found suggested that a more focused approach was that the TV ads contributed significantly towards required by advertisers while planning their ad the Indian children's consumer socialisation. Even campaign for different age-groups of children, the parents admit for the role of TV ads in shaping rather than considering them as one homogenous their children's buying response. However, it was group. Characters from folklores can be depicted also found that early parents-child interaction was a for creating aspirations.key element, if parents did not want their child to be
Narasimhamurthy (2014) examined the impact of affected adversely by TV ads. The final lesson that a TV ads on children's attitudes, and behaviour. They child extracts from the viewing of TV ads might be found that among many communications tools, TV a joint product of what was shown on the screen and ads had more intense impact on attitudes and what was taught by the parents.behaviour on children than the other medium of
According to Calvert (2008), marketing to children advertising. Findings revealed the stronger effect of which according to her is more intense now than TV ads on attitude and behaviuor of children. earlier because, (1) Both discretionary income of Moreover, girls spend more time with TV as children and their power to influence parental compared to boys. Girls were very active and they purchases have increased over time; (2) The large spend more time with TV and this medium is highly increase in the number of TV channels has resulted influencing them and the ads influenced their in smaller audiences for each channel; and (3) lifestyles, involvement in family purchase Digital interactive technologies have opened new decisions, and interaction with parents, Children routes to selectively cater to children's needs. told that many TV ads were better than TV Newer marketing approaches include online ads programmes.and stealth marketing (embedding products in the programme content). All these techniques make
OBJECTIVES OF STUDYchildren (below 8 years of age) particularly vulnerable. The stealth techniques do not spare
The study seeks to identify the gender-wise factors older children, they weaken their consumer
affecting the children's attitude towards TV defenses too. The author noted that today's child
advertisements and to compare the difference lives and grows up in a technologically-advanced between boys’ and girls’ attitudes.and sophisticated market environment that impacts
their preferences and behaviour. RESEARCH METHODOLOGY
The study conducted by Pankaj et al. (2010) among children studying in English-medium schools in The sample comprised children from English-Delhi, sought to assess the impact of children's medium reputed private schools, catering to middle attitudes towards TV ads. The study includes in- and upper socio-economic strata. The three cities depth interviews with child psychologists, selected for gathering data represent traditional, advertisers and parents of young children and a geographical, and cultural categorisation of survey of children in the age-group 5 to 11 years. Punjab: Majha (Amritsar), Doaba (Jalandhar), and They found that the demand for the advertised Malwa (Patiala). The effective sample came out to products is heavily influenced by the children's be 400 children. The sample was collected through attitude towards ads. At the lower age-group, it is convenience sampling. Factor analysis was used as the entertaining ability of the ads, whereas at the a statistical tool for data-analysis.higher age-groups the credibility element in the ads
The sample comprised 206 (51.50 per cent) boys has the potential of creating a favourable attitude while the remaining 194 (48.50 per cent) are girls. towards the advertisements. The cognitive changes
The sample gives proper representation to both the correlations showed that data was fit for factor genders. There are four age categories in the range analysis. Overall, Kaiser-Meyer-Oklin Measure of of 8 to 16 years olds (8-10 years, 10-12 years, 12-14 Sampling Adequacy (0.734) was sufficiently high years and 14-16 years). The highest percentage of and Bartlett's Sphericity Test (74.380) is also them (30.00 per cent) belongs to the age group of statistically significant. These tests have revealed 12-14 years, while the lowest (22.50 per cent) of that the data is fit for factor analysis.them belongs to the age group of 14-16 years old.
Principal Component Analysis was employed for extracting six factors as shown in Table 1. All
DATA ANALYSIS AND factors having the Eigen values greater than unity INTERPRETATION were selected. The cut-off point for significant
factor loadings is taken to be 0.45. The Multivariate data analysis was done to examine
communalities are quite high while the highest the responses of boys and girls, separately.
communality coefficient is 0.722 for Statement C17; the lowest communality coefficient is 0.437
Dimensions of Boys’ Attitude towards TV Ads for Statement C19. Communalities magnitude indicates that a large amount of variance in a
The responses of 206 respondents to 26 statements, variable is accounted for by the factor solution. measured on a five-point Likert Scale and Thus, the six-factor model, explaining 60.094 per subjected to factor analysis are shown in Table 1. A cent of the variance, is quite powerful. study of correlation matrix and anti-image
Table 1: Principal Component Analysis with Varimax Rotation (for Boys)
NICE Journal of Business • Vol. 11 • Nos. 1 & 2 • January - December, 2016 23
Children's Attitudes towards TV AdvertisementsAmardeep Kaur Ahluwalia and Raghbir Singh
NICE Journal of Business • Vol. 11 • Nos. 1 & 2 • January - December, 2016 22

Note: KMO MSA=0.734; Bartlett=74.380
Factors affecting the Boys’ Attitudes towards were identified on the nature of statements included TV Ads in the factor. This categorisation is shown in Table
2. For measuring the attitudes of boys, the factors
Table 2: Factors affecting Attitude of Boys towards TV Advertisements
NICE Journal of Business • Vol. 11 • Nos. 1 & 2 • January - December, 2016 25
Amardeep Kaur Ahluwalia and Raghbir Singh
NICE Journal of Business • Vol. 11 • Nos. 1 & 2 • January - December, 2016 24
Children's Attitudes towards TV Advertisements

variance with 4 statements. Statement C15 (“If I go Identification of Factors (Boys’ shopping on my own, while choosing things, I keep Attitudes)TV ads in mind”) scored the highest coefficient of
Factor 1: Permeability of Ads 0.605, followed by Statement C21 “TV ads tell us which brands have features that I am looking for”)
This factor explains 18.09 per cent of the variance having a coefficient of (0.593). The other with 6 statements. It denotes that TV ads are statements are about TV ads being an important informative, entertaining, make interesting topic of source of product information and that children ask discussion, improve living standards and has for advertised products with premium-offers. influence on children's conversation. So, the ads touch our lives in more than one way. The highest Factor 3: Ardent Ad Followerscoefficient is 0.647, attributed to Statement C1 (“I
This factor explains 10.36 per cent of the total learn a lot from watching TV ads”), followed by variance with 5 statements. Statement C2 (“By C11 (“Many TV ads are better than TV seeing TV ads, I sometimes know more about the programmes”) (0.626).product than my parents do”) scores the highest
Factor 2: TV Ad as a Shopping Guide coefficient (0.714), followed by Statement C6 “I ask my parents to buy those products which I find
The second factor explains 13.82 per cent of the
good in TV ads”) (0.665). The other statements more important determinant than the TV ad in highlight that ads guide children with their choices buying the product’.of clothes, footwear, snacks, stationery, gadgets,
Factor 6: Mirror-image of Societytoys, games, fashion accessories, etc.
The sixth factor explains 3.01 per cent of variance, Factor 4: Unscrupulous Adswith a single Statement M26, namely, “TV ads
This factor explains 8.77 per cent of the variance show true picture of society; it portrays people, with 6 statements. The highest coefficient is 0.775 their ways and the way they actually are” (0.526). is related to the statement C20, (“TV ads tell only This factor denotes that the ads are a reflection of the nice things, hiding the bad about their the society.products”), followed neck and neck by Statement M10, (“Many TV ads are to make fool of people
Dimensions of Girls' Attitude towards TV Adsand seek to catch them in their trap”) (0.774). Other statements pertain to dishonesty of the TV ads. The responses of 194 girls to the 26 statements are
factor analysed in Table 3, so as to make them Factor 5: Judicious Buyerscomparable with the results of the boys. A study of correlation matrix and anti-image correlations This factor explains 6.03 per cent of the variance showed that the data is fit for factor analysis. The with 4 statements. The highest coefficient is 0.787 Kaiser-Meyer-Oklin Measure of Sampling pertaining to the Statement C8 (“Many TV ads Adequacy (0.641) is sufficiently high and the contain little information and many other Bartlett's Sphericity Test (121.670) is also unnecessary things”), followed by C22 (“I buy a statistically significant, indicating the suitability of product only if the ad convinces me of its benefits”) the data for factor analysis.having a coefficient of (0.705). The other
statements are about ‘liking of ads but not buying products because of them’ and ‘brand name being
Table 3: Principal Component Analysis with Varimax Rotation (Girls)
NICE Journal of Business • Vol. 11 • Nos. 1 & 2 • January - December, 2016 27
Amardeep Kaur Ahluwalia and Raghbir Singh
NICE Journal of Business • Vol. 11 • Nos. 1 & 2 • January - December, 2016 26
Children's Attitudes towards TV Advertisements

with 7 statements. It denotes how ads have become Identification of Factors (Girls’ integral to the lifestyle of children. The highest Attitudes)coefficient (0.730) is scored by the statement C16,
Factor 1: 'Educative and Entertaining Ads' “I use ad jingles, one liner in my conversation”, followed by C17, “TV ads make you try new The first factor explains 16.23 per cent of the total products and improve life styles and raise standard variance with 6 statements. It indicates that TV ads of living” (0.601). The other statements are about educate children by acting as their window to the children picking trends of clothes, footwear, world in general and by informing them about the gadgets, toys, accessories, eatables, etc., from TV available product choices in particular. Also, ads and discussing ads with their friends. children find TV ads entertaining. The statement
C1, (“I learn a lot from watching TV ads”) gets the Factor 3: 'A Quay to Superior Product highest coefficient (0.714), followed by C3, Knowledge'(“Many TV ads are amusing and entertaining”)
The third factor explains 10.56 per cent of the (0.517). The other statements are concerning TV variance with 3 statements. The highest coefficient ads reflect a true image of the society, 'parents being (0.771) is scored by Statement C6, “I ask my asked to buy goods with premium-offers', TV ads parents to buy those products which I find good in are better than the programmes and 'Children TV ads”, followed by C2, “By seeing TV ads, I always keep ads in mind while shopping'.sometimes know more about the products than my
Factor 2: 'Integral to Lifestyle' parents do” (0.679) and C14, “TV ads are an important source of product information” (0.529).This factor explains 12.89 per cent of the variance
NICE Journal of Business • Vol. 11 • Nos. 1 & 2 • January - December, 2016 29
Amardeep Kaur Ahluwalia and Raghbir Singh
NICE Journal of Business • Vol. 11 • Nos. 1 & 2 • January - December, 2016 28
Children's Attitudes towards TV Advertisements

Factor 4: 'A Futile Exercise' diligently they follow ads for choosing the products. The factor 'Unscrupulous Ads' focusing
This factor explains 9.24 per cent of the total on the dishonesty in ads comes at the fourth level of variance with 3 statements, highlighting skeptical
importance for boys, while it is at the fifth for girls. attitude towards TV ads. The highest coefficient is
'A Futile Exercise' emerges as the fourth factor for scored by the statement C4, “TV ads interrupt the
girls conveying uselessness of TV ads. 'Judicious show and are waste of time” (0.604). The other two
Buyers' emerges at the fifth level for boys and at the statements are C8, “Many TV ads contain little
sixth level for girls. The sixth factor for boys with a information and many other unnecessary things”,
single statement revealed how TV ads reflect the (0.554) and C5, “TV ads are not for entertainment,
true image of the society.information or social awareness”, (0.536).
It is noteworthy that all the factors are different Factor 5: 'Unscrupulous Ads'except for two: 'Unscrupulous Ads' and 'Judicious
The fifth factor explains 7.60 per cent of variance Buyers', but these two dimensions are prioritised at
with 5 statements, focusing on dishonesty in TV different levels for boys and girls. 'A Futile
ads. The Statement C20, “TV ads tell only the nice Exercise' constitutes a separate factor and does not
things, hiding the bad about their products” secures combine with 'Unscrupulous Ads' and 'Judicious
the highest coefficient (0.569), followed by Buyers' as in case of boys; there by highlighting the
statement C13, “TV ads persuade people to buy importance of this factor for girls. The fourth and
those things they do not really need” (0.546).the fifth factors for boys denoting scepticism towards TV ads explain 14.80 per cent of variance, Factor 6: 'Judicious Buyers’whereas for girls, skepticism is denoted through
This factor explains 5.14 per cent of variance with 2 three factors: fourth, fifth and sixth that explain statements. The higher coefficient (0.649) is scored 22.08 per cent of the total variance. (Girls have by C12, “I like TV ads but don't buy things because more pronounced analytical and apprehensive of them”, followed by C18, “I buy the products by attitude towards ads.) their brand names and not on the basis of what TV ads say” (0.519).
CONCLUSION AND POLICY IMPLICATIONSAttitudes of Boys Vs Girls
A comparison of the sub-samples of boys and girls The media-planners and marketers may identify the reveal six dimensions but the factors emerging relative strength of each of the factors identified from both the sub-samples are different in above in determining the children's attitude constitution and importance attributed to each. towards TV ads. Attitude is one of the most
important determinants of consumer behaviour that stThe 1 factor for boys denotes that advertisement affects a purchase decisions. Priya et al. (2010) touches our lives in more than one way; while for found that the demand for the advertised products is girls it reveals that advertisement can be both heavily influenced by the children's attitude informative and interesting. The second dimension
towards ads. They may take note that children have of TV ads for girls covers different ways in which
an overall positive but pragmatic attitude towards ads influence their living style and for boys the
TV ads. While, ads are a learning platform from second factor focuses on how TV ads help in a
where they learn about products and lifestyles, they product purchase decision. The third factor for girls
give ads a consideration while shopping. On the highlights that children have better awareness as
other hand, they understand the intent behind the ads are a good source of product information.
ads, they realise that ad persuades people to shop While the third factor for boys highlights how
for unnecessary things; ads just highlight the children have better product knowledge and how
positive attributes of the product, completely
hiding the negative aspects. Hence, children buy Marketing Research, 27(6), November, 445-454goods only if they are really convinced by the ads.
Gorn, Gerald J., & Goldberg, Marvin E. (1980), “Children's Responses to Repetitive TV Commercials”, Journal of Consumer Research, REFERENCES6(3), October, 421-25
Ahluwalia, A.K. (2012), “Impact of TV Advertising Grossbart, Sanford L., & Crosby, Lawrence A.
on Children: A Behavioural Study”, unpublished (1984), “Understanding the Bases of Parental
Ph.D. thesis, Guru Nanak Dev University, UBS, Concern and Reaction to Children's Food
Amritsar, 144-174Advertising”, Journal of Marketing, 48(3), Summer, 79-92Barry, Thomas E., & Hansen, Richard W. (1978),
“Children's TV Advertising: The Attitudes and Julian, Barling, & Clive, Fullagar (1983), Opinions of Elementary School Guidance “Children's Attitudes towards TV Advertisements: Counselors”, Journal of Advertising, 7(4), 9-16A Factorial Perspective”, Journal of Psychology,
Bearden, William O., Teel, Jesse E., & Wright, 113(1), 25-30Robert R. (1979), “Family Income Effects on
Kapoor, N., & Verma, D.P.S. (2005), “Children's Measurement of Children's Attitudes towards TV understanding of TV Advertising: Influence of Commercials”, Journal of Consumer Research, Age, Sex and Parents”, Vision, 9(1), 21-366(4), 308-311
Kohlberg, Lawrence (1969), “Stages and Bever, T.G., Smith, M.L., Bergen, B., & Johnson, Sequence: The Cognitive Developmental T.G. (1975), “Young Viewers’ Troubling Response Approach to Socialisation”, in Handbook of to TV Ads”, Harvard Business Review, 53(6), 109-Socialisation Theory & Research, edited by David 120Goslin, Rand McNally & Co., Chicago, pp.347-
Boush, D.M., Friestad, M., & Rose, M.R. (1994), 480“Adolescent Scepticism toward TV Advertising
Kunkel, D., Wilcox, B.L., Cantor, J., Palmer, E., and Knowledge of Advertiser Tactics”, Journal of Linn, S., & Dowrick, P. (2004), “Psychological Consumer Research, 2(1), 165-75Issues in the Increasing Commercialisation of
Buckingham, D. (2000), After the Death of Childhood”, Report of the APA Task Force on Childhood, Polity, Cambridge Advertising and Children, 20(1), 1-35
Calvert, Sandra L. (2008), “Children as Lowden, S. (1999), “Managing International Consumers”, Children and Electronic Media: The Brands”, Paper presented at Advertising and Future of Children, 18(1), Spring, 205-34 Academia, The Fourth Annual Marketing
Educators' Forum, Institute of Practitioners in Christenson, P. (1982), “Children's Perceptions of Advertising, London, September 14TV Commercials and TV Products: The Effects of
PSA's”, Communication Research, 9, October, Mangleburg, Tamara F., & Bristol, Terry (1998), 491-524 “Socialisation and Adolescents' Scepticism
towards Advertising”, Journal of Advertising, Clarke, J., & Smallbone, T. (2001), Widening the 27(3), 11-21Vision of the Role of Marketing in Achieving
Sustainable Consumption, in Proceedings of the McNeal, James U. (1969), “An Exploratory Study Academy of Marketing Conference, Cardiff: AOM. of the Consumer Behaviour of Children”, in
Dimensions of Consumer Behaviour, edited by Mc Goldberg, Marvin E. (1990), “A Quasi – Neal, James U, Appleton-Century Crofts, New Experiment Assessing the Effectiveness of TV York, 183 Advertising Directed to Children”, Journal of
NICE Journal of Business • Vol. 11 • Nos. 1 & 2 • January - December, 2016 31
Amardeep Kaur Ahluwalia and Raghbir Singh
NICE Journal of Business • Vol. 11 • Nos. 1 & 2 • January - December, 2016 30
Children's Attitudes towards TV Advertisements
Ross, R., Campbell, T., Wright, J., Huston, A., Rice, Narasimhamurthy, N. (2014), “TV Advertisement M., & Turk, P. (1984), “When Celebrities Talk, and its Impact on Attitudes, Behaviours of Children Listen: An Experimental Analysis of Children-A study” International Journal of Children's Responses to TV Ads with Celebrity Interdisciplinary and Multidisciplinary Studies, Endorsements”, Journal of Applied Developmental 1(10), 14-22 Psychology, 5(2), 185-202 Rossiter, J.R. (1977),
“Reliability of a Short Test Measuring Children's Oates, C., Blades, M., Gunter, B., & Don, J. (2003), Attitudes toward TV “Children's Understanding of TV. Advertising: A Qualitative Approach”, Journal of Marketing Commercials”, Journal of Consumer Research, Communication, 9(3), 59-71 3(4), March, 179-184
Pecheaux, C., & Derbaix, C. (2002), “Children and Unnikrishnan, N., & Bajpai, S. (1996), Impact of th the Attitude toward the Brand: A New TV Advertising on Children, 4 ed., Sage, New
Measurement Scale”, Journal of Advertising DelhiResearch, 39(4), 19-27
Verma, D.P.S. & Kapoor, N. (2004), “Influence of Pankaj, P., Baisya, Rajat K., & Sharma S., (2010) TV Advertisements on Children's Buying "TV Advertisements and Children's Buying Response: Role of Parent-Child Interaction”, Behaviour", Marketing Intelligence and Planning, Global Business Review, 5(1), 51-7128(2), 151–169
Ward, S., & Wackman, D.B. (1973), “Children's Robertson, Thomas S., & Rossiter, John R. (1974), Information Processing of TV Advertising”, in New “Children and Commercial Persuasion: An Models for Mass Communication Research, edited Attribution Theory Analysis”, Journal of by P. Clarke, Sage Publications, Beverly Hills, CAConsumer Research, 1(1), 13-20
Amardeep Kaur Ahluwalia and Raghbir Singh
NICE Journal of Business • Vol. 11 • Nos. 1 & 2 • January - December, 2016 32
“You shouldn't focus on why you can't do something, which is what most people do. You should focus on why perhaps you can, and be one of the exceptions.”
Steve Case
Co-founder, AOL
?????
“Always deliver more than expected.”
Larry Page Co-founder, Google

ROLE OF ORGANISATIONAL CITIZENSHIP BEHAVIOUR AND SERVICE-DOMINANT LOGIC IN VALUE-CREATION IN HIGHER
EDUCATION University Officers' Perspective
Hardeep Chahal* and Rupa Mahajan**
* Professor, Department of Commerce, University of Jammu, Jammu; e-mail: [email protected]** Research Scholar, Department of Commerce, University of Jammu, Jammu; e-mail: [email protected]
Key words: Organisational citizenship behaviour, Service-dominant logic, Service-dominant
behaviour, Value-creation, Higher education
Abstract
Purpose: The study seeks to examine the role of Organisational Citizenship Behaviour (OCB) and Service-dominant Logic/ Behaviour (SDL/B) competencies in value-creation in higher-education institutions. While OCB is sought to be studied, using five dimensions, namely altruism, sportsmanship, conscientiousness, civic virtue and courtesy, SDL/B is examined through absorptive and collaborative competencies. Four dimensions of value-creation (teaching, research, co-ordination (with colleges) and administrative services) were studied.
Research Methodology: 55 senior officers of the University of Jammu (UOJ) and the Guru Nanak Dev University (GNDU) were contacted using the census method. The data was analysed using the partial least-squares method.
Findings: The study reveals that out of the four dimensions of OCB, altruism, sportsmanship and civic virtue contribute towards the OCB, while both absorptive and collaborative competencies significantly contribute to SDL. Further, value-creation can be more significantly predicted by SDL, as compared to OCB.
Limitations: Subjectivity of respondents is an unavoidable limitation due to the use of the primary data.
Value / Contribution: The study contributes to the existing literature by establishing the relationship of OCB and SDL in value-creation in univertsities. OCB and SDL-based environment in universities encourage exchange and information sharing with peers, updating and encouraging innovative and competitive initiatives for sustainable development in the higher education sector.

and the network exchange theory (Walker et al., INTRODUCTION2000). The behaviour that results reflects the SDB. The creation of value and exchange of knowledge and competencies that are important to the SDB A Service organisation can enhance its also require the behaviour that can be measured competitiveness through interaction with its against such underlying values. Thus, the OCB an stakeholders' performance. Such interactive important behavioural concept influences the behaviour has attracted great deal of attention from foundation premises of the SDB. researchers all over the world. Akin to various
service organisations, success of higher education In this context, Chahal and Mahajan (2014a); Nga, sector requires significant marketing tools to Lam and Feldman (2016) noted that the OCB in the enhance and to sustain organisational performance education sector focuses on attitude of service-and growth (Edvardson, Tronvoll and Gruber provider towards three aspects that include student (2011). Hence, value in higher education can be (e.g., acquiring expertise in new subjects that determined mainly by the ability and skills of its contribute to teaching, enhancing the ability to deal stakeholders. Scholars, such as Walker et al. (2000) with students' special needs, etc.), faculty members observed that organisational members work in a (e.g., helping other members who have workload, network-based exchange system involving orient new members, etc.) and organisation (e.g,. collaboration of members, resources, knowledge volunteering for unpaid tasks, providing innovative and skills to benefit the organisation. In addition, it suggestions to improve the organisation as a whole, is also seen that the behaviour of organisational etc.). Similarly, it is argued that the SDB is equally members promote development of collaborative significant for attaining competency- based behaviour within organisations, which encourages benefits in the higher-education sector. discretionary behaviour (that is not required by the
formal role). Such behaviour is defined by The SDL requires interaction based on knowledge Bateman and Organ (1988) as organisational and skill exchange, which is very important to be citizenship behaviours (OCB). Informally, OCB supervised and supported by service competencies allows the development of processes of creating of various stakeholders (Karpen, Bove and Lukas and sharing knowledge to create value for 2009; Golooba and Ahlan, 2013; Ronald and organisations. Amelia, 2014). However based on the literature review, little research related to OCB and SDL is The other concept, that is, service- dominant included in the business literature. The present behaviour (SDB), related to service dominant study seeks to explore the behavioural aspects of logic (SDL) states that value is created through the SDL that is, the SDB and its relationship with service-exchange among its varied stakeholders, the OCB in the higher-education sector in India.instead of within the organisation itself (Vargo and
Lusch, 2008; Karpen, Bove and Lukas, 2009; Chahal and Mahajan, 2015).
L I T E R AT U R E R E V I E W A N D HYPOTHESIS FORMULATIONService exchange and value creation are further
influenced by social forces, such as social structures, social systems, roles, positions, Organisational Citizenship Behaviour (OCB)interactions and reproduction of social structures.
The term 'Organisational Citizenship Behaviour' The social theories are based on three pillars:
(OCB), coined by Bateman and Organ (1983), is a reality, knowledge, and learning (Kukla, 2000; Liu
set of discretionary workplace behaviour that and Tsuar, 2014). From the behavioural aspect,
exceed one's basic job requirements (Chuin and both the concepts (OCB and SDB) are based on
Ramayah 2009; Nga et al., 2010; Acaraya and various social theories, such as the social exchange
Akturan 2015). It is well-established in literature theory (Birenbaum and Sagarin 1976), social
that an organisation cannot survive or prosper interaction theory (Kukla 2000), network theory
unless its employees engage in activities that reflect
positive organisation-relevant behaviours OCB. (Nezakati et al., 2010; Banu, Amudha and Surulivel 2012).
Service-dominant logic (SDL)
Employees that go beyond their formal job The concept of service-dominant logic, developed responsibilities and freely provide assistance in by Vargo and Lusch, in 2004 is a broader and terms of their time and energy to help stakeholders comprehensive concept based on exchange of to accomplish the organisational objectives are able intangibles such as knowledge and skills among to benefit the organisation by creating value. Organ stakeholders (Gronroos 2008, 2011; Lusch and (1988), the major contributor in the area of OCB, Vargo 2008). SDL considers that value is created by opined that OCB maximises the efficiency and an organisation along with other stakeholders, productivity of employees and ultimately instead of organisation itself (Vargo and Lusch contributes to creation of value for the organisation. 2004; Cabiddu, Lui and Piccoli 2013; Lai and Tan This is also supported by researchers such as Chuin 2015). In other words, SDL has a primary focus on and Ramayah (2009); Ellinger et al., (2013). Since operant resources - the resources that are intangible these efforts are made beyond requirements and dynamic and are capable of creating value. specified in the job description, their presence Number of scholars such as Vargo and Lusch cannot be enforced and similarly their absence (2004); Gummenson (2008); Lusch and Vargo cannot be penalised (Podsakoff and Mackenzie (2008); Maglio and Spohrer (2008); Vargo (2008) 1997). have contributed to the conceptual development of
SDL.Among various perspectives regarding the dimensionality of OCB, the present study adopts Similarly, Chahal and Mahajan (2014b) stated that OCB as five-dimensional concept as identified by the functioning of the SDL-based organisation Smith, Organ and Near (1983) comprising focuses on the interaction among internal and altruism, sportsmanship, conscientiousness, civic external members of an organisation. Basically in virtue and courtesy. This five-dimensional concept SDL focused system, organisational stakeholders is well-established in literature and is used by are encouraged to work in a coordinated and majority of the scholars, such as Somech and Ron transparent manner to create value. This interaction (2007); Jung and Hong (2008); Chuin and among various members ultimately helps in Ramayah (2009); Chahal and Mahajan (2014a); building foundation for achieving the desired and Devece et al. (2015). Studies such as organisational performance. Hence SDL can be Mackenzie et al., (1993); Walz and Niehoff, defined as value co-creation chain in which all (2000); Oplatka (2006) concluded that all the stakeholders collaborate dynamically, to deliver components excluding courtesy contribute high quality service through various interactions significantly to OCB. This is also observed in the among stakeholders to create value. Further SDL education sector by Somech and Ron (2007). notion suggests that best way to achieve desired Based on the review of literature, the following level of organisational performance is through the hypotheses are formulated: application of competencies (Gummenson 2008;
Edvardson, Tronvoll and Gruber 2011). H : Altruism significantly contributes towards 1a
SDL is based on the principle that service is OCB. exchanged for service, where service is process of H : Sportsmanship significantly contributes 1b
exchange that applies competencies for benefit of towards OCB. all stakeholders and is the basis for value creation H : Conscientiousness significantly contributes 1c
(Vargo and Lusch 2008; Lai and Tan 2015; Chou, towards OCB. Lin and Huang 2016). SDL is primarily based on H : Civic virtue significantly contributes towards 1d
the application of two competencies that is, OCB. knowledge and skills (Lusch, Vargo and Brien H : Courtesy insignificantly contributes towards 1e2007; Lusch and Vargo 2008; Ordanini and
NICE Journal of Business • Vol. 11 • Nos. 1 & 2 • January - December, 2016 35NICE Journal of Business • Vol. 11 • Nos. 1 & 2 • January - December, 2016 34
Hardeep Chahal and Rupa Mahajan Role of Organisational Citizenship Behaviour and Service-dominant Logic in Value-creation in Higher Education

Parasuraman 2010). The behaviour that reflects through resources such as goods and services, and it from such interactive exchange activities is termed is customer who creates value over a process of as SDB. As such, SDL as SDB (behavioural aspect time (Cabiddu, Lui and Piccoli 2013). As such, the of SDL) with respect to two competencies that is, foundation of the SDL emphasizes need for value collaborative and absorptive competencies are creation through networks and interactions of examined. various stakeholders (Gummesson 2008; Vargo and Lusch 2008). In other words, value creation Based on the seminal contribution (Vargo and results when all members are directing their efforts Lusch 2008) absorptive and collaborative and capabilities collectively to enhance competencies are pivotal for value co-creation. organisational performance (Robson, Bailey and Absorptive competencies relate to the symmetric Larkin 2004; Chou, Lin and Huang 2016). Lin and information and conversation among various Lin (2006) remarked that value is key determinant members of the organisation which require to collaborative provider-customer relationship. employees to provide correct and accurate Prior research has considered value co-creation information and not to mislead any other from different perspectives, such as “value-in-stakeholder involved in the organisation (Lusch experience” (Prahalad and Ramaswamy 2004) and and Vargo 2008). Maglio and Spohrer (2008) and “value-in-use” (Vargo and Lusch 2004). However, Chahal and Mahajan (2014b) remarked that the it is examined mainly through three perspectives application of collaborative competencies is namely, value created by employees, value created necessary to strengthen the integration between the by customers and value created by both providers different parties of the organisation to create value. and customers (Lin and Lin 2006; Kuzgun and Both the competencies enable all employees to Asugman 2015). As Lin and Lin (2006) expressed collaborate with each other and to adjust with the that value for employees is generated only when changing vis-a-vis new environment (Lusch and they are allowed to participate in decision- making Vargo 2008; Chahal and Mahajan 2014b). It and are considered as an important part of focuses on two way interaction between the organisation. In similar context, Saks (2006) producer or other social and economic integrators remarked that level of employee participation in an to create value. Thus the following hypotheses are organisation determines the level of value created. formed; Thus, co-creation depends highly on individuals
through involvement and exchange among H a: Absorptive competencies significantly multiple parties to create value collaboratively 2
(Prahalad and Ramaswamy 2004; Chou, Lin and contribute towards SDB.Huang 2016). H b: Collaborative competencies significantly 2
contribute towards SDB.Research evidence suggests that significant OCB and SDL/SDB give rise to favourable performance
Value-creation evaluations and creation of value for an organisation (Chou, Lin and Huang 2016). The concept of value is at the center of all human Organisation is a network of individuals (within activity. In all kinds of exchange, the worth of what and around), that influences goals and performance is obtained is evaluated by the value gained (Vargo of organisation, both formally and informally and Lusch 2008). The value concept in marketing (Podsakoff et al., 2000; Cabiddu, Lui and Piccoli has been receiving substantial attention. However, 2013).Though OCB is not specifically mandated or there is still an on-going controversy regarding how rewarded by formal job descriptions, but value is defined and measured. According to value management has a great deal of indirect influence concept, value is not created solely by organisation, on OCB. Further researchers such as Mc.Coll-but created with collaboration of customers (Vargo Kennedy (2012); Kuzgun and Asugman (2015) and Lusch 2004) during their usage of products and stated that value in the SDL/SDB framework can be interactions with different actors. The role of said to be created through effective interaction organisation is to propose a value proposition between customer and provider in an organisation.
Thus, both partners need to collaborate effectively to enhance the value of firm. In a highly networked RESEARCH METHODOLOGYorganisation value co-creation becomes very important because it views value as not created by The Sampleorganisation, but by customers and other
In this study, University of Jammu (UOJ) and Guru stakeholders as they all integrate resources Nanak Dev University (GNDU), two of the oldest collaboratively (Chahal and Mahajan 2015). (functional since 1969) and the biggest state Accordingly value in education sector is created universities of North India, were selected to through service providers (higher officers, faculty examine the role of OCB and SDL in value- members and supporting members) and service creation. users (students and research scholars). Value in
education sector is thus created in the form of The decision-making members of the two research publications, participation in academic universities (UOJ and GNDU) that consist of senior and non-academic events, enhanced teaching authorities / officers and controlling officers were practices, maintaining overall quality and contacted to examine OCB and SDB relationships. performance standards of colleges (affiliated to These higher officers includes Vice-Chancellors, higher institutions) and universities (Chahal and Registrars, Controllers, Dean (Academic Affairs), Mahajan 2014b). As such the present research Dean (Students Welfare), Directors, Deans, Joint made an endeavour to examine value created in Registrars, Deputy Registrars and Principals of higher educational sector in terms of teaching, Government Degree Colleges of Jammu and research, coordination (college) and administrative Amritsar cities. The census method was used to services (four dimensional -concept). The contact the selected stakeholders. The census following hypotheses were formulated for testing:method was used to contact fifty-five higher officers and controlling officers of both the H : All the four dimensions- teaching, research, 3universities that included 27 (UOJ) and 28 coordination (college) and administrative services (GNDU) from the UOJ and GNDU, respectively. contribute significantly to value-creation. Of the total 55 distributed questionnaires, forty-H : OCB significantly contributes to value-4 three completely filled questionnaires were
creation.received, giving a response rate of 78.18 per cent.
H : SDB significantly contributes to value-5
creation.
Generation of Items
OCB-OCB was measured, through items extracted OBJECTIVES OF THE STUDYfrom the scales developed by Smith, Organ and Near (1983) and Podsakoff et al. (1990). The items The study was conducted with the following were modified as per need of the study and resulted objectives:in developing the OCB measure, containing 43 1. To assess the OCB level of university officers items spread across five dimensions of the OCB. with respect to five dimensions that include The items OCB dimensions were finalised after altruism, sportsmanship, conscientiousness, reviewing various studies, such as Walz and civic virtue, and courtesy;
2. To assess the SDL of university officers with Niehoff (2000); Oplatka (2006); Somech and Ron respect to absorptive and collaborative (2007); Jung and Hong (2008); Chuin and competencies; Ramayah (2009); and Chahal and Mahajan
3. To measure their value-creation by way of (2014a). teaching, research, co-ordination (college) and administrative services; and SDB-SDB measure comprising 20 items was
4. To assess the impact of the OCB and the SDL in developed by reviewing earlier studies, namely creating value. Lusch and Vargo (2008); Maglio and Spohrer
NICE Journal of Business • Vol. 11 • Nos. 1 & 2 • January - December, 2016 37NICE Journal of Business • Vol. 11 • Nos. 1 & 2 • January - December, 2016 36
Role of Organisational Citizenship Behaviour and Service-dominant Logic in Value-creation in Higher EducationHardeep Chahal and Rupa Mahajan

(2008); Vargo (2008); Karpen, Bove and Lukas (2009); Ordanini and Parasuraman (2010); Profile of RespondentsEdvardson, Tronvoll and Gruber (2011); Chahal
The sample consisted of 43 senior university and Mahajan (2014b). The items for collaborative officers, of which 35 were male (81.39%) and 8 and absorptive competencies were also extracted female respondents (18.60%). The majority of the from studies, such as Ballantyne and Varey (2008); respondents were in the age group of 48 years and Payne, Storbacks and Frow (2008); Vargo (2008); above (81.39%), and the rest (18.61%) were in 38 -and Yazdanparast, Manuj and Swartz (2010). 47 year age-group. With regard to the educational Value-creation- A scale for value-creation, qualifications, 23.25% were M.Phil. while 76.74% including four dimensions that included teaching, were Ph.D. degree holders. These officers were r e sea rch , co -o rd ina t ion (co l l ege ) and also identified according to their designation - administrative services was developed. Thus, a registrar (2), controller (2), director (8), dean (3), total of 47 items for value-creation was finalised. principal (12), joint registrar (3) and deputy registrar (14). The profile of respondents (UOJ and All the items of the questionnaire were anchored GNDU officers) is given in Table 1.with a 5-point Likert's scale, where 1 stands for
'strongly disagree' and 5 stands for 'strongly agree'.
Table 1: Demographic Profile of Sampled University Officers
creation. Skewness and kurtosis are examined DATA ANALYSIS AND using normal probability plots. The details of INTERPRETATIONdescriptive statistics are given in Table 2.
Descriptive Statistics
At the outset, response scores for negative items are reversed to examine descriptive statistics of the three construct namely, OCB, SDB and value
Demographic
Factors
Groups UOJ GNDUNumber Percentage
(%)
Number Percentage
(%)
Number Percentage
(%)
Gender Male 20 90.90 15 71.42 35 81.39Female 2 9.09 6 28.58 8 18.60
Age 38-47 3 13.63 3 14.28 6 18.6148 & Above 17 77.27 18 85.72 35 81.39
Qualification M.Phil 5 22.72 5 23.81 10 23.25Ph.D / NET 17 77.27 16 76.19 33 76.74
Designation Registrar 1 4.54 1 4.76 2 4.65Controller 1 4.54 1 4.76 2 4.65Director 2 9.09 6 28.57 8 18.60
Dean 2 9.09 1 4.76 3 6.97Principal 4 18.18 8 38.09 12 27.90
Joint Registrar 2 9.09 1 4.76 3 6.97Deputy Registrar 10 45.45 4 19.04 14 32.55
Teaching 1-10 2 9.09 1 4.76 3 6.97Experience 11-20 5 22.72 2 9.52 7 16.27
21-30 9 40.90 11 52.38 20 46.5131-40 6 27.27 7 33.33 13 30.23
Administrative
Experience
1-5 10 45.45 15 71.42 25 58.136-10 3 13.63 2 9.52 5 11.6211-15 7 31.81 3 14.28 10 23.2516-20 2 9.09 1 4.76 3 6.97
Table 2: Descriptive Statistics of Senior Officers
Constructs MeanStandardDeviation
Skewness Kurtosis
Min Max Overall Min Max Min Max Min Max
OCB 3.91 4.12 3.60 0.718 1.411 0.008 -0.339 0.044 0.765
SDB 3.51 3.86 3.55 0.812 1.252 0.066 0.527 -0.077 0.163
Value-Creation
3.27 4.30 3.79 0.674 1.295 0.002 0.362 0.025 0.368
while CITC is ranged between 0.452 and 0.686. Item AnalysisThe overall scale statistics that are, overall mean (55.88) and overall variance (28.82) along with OCB: Item analysis was conducted on forty- three item scale statistics that are, item mean (mean= items that resulted in deletion of fourteen items 3.555, variance= 0.033) and item variance (complete deletion of courtesy dimension) as (mean=0.961, variance=0.037) reflect good scale squared multiple correlation (SMC) values were properties of SDB (Table 3).less than the set criterion (greater than 0.5). After
deletion, overall cronbach alpha value of OCB Value-creation: The item analysis performed on measure is recorded at 0.759, which is above the forty- seven items of value creation grouped under recommended criterion (0.7). Further, majority four factors namely, teaching (eleven items), values of corrected item-to-total correlation research (seven items), coordination (college) (CITC), ranged between 0.340 and 0.695 along (eight items) and administrative services (twenty with SMC values ranging between 0.549 and 0.845. one items) resulted in deletion of fifteen items due The item mean values are recorded as 3.240 (with to low SMC values. Eight (teaching), five 0.286 variance), item variance mean as 0.913, (with (research), four (college coordination) and fifteen 0.443 variance) while scale statistics reveal overall (administrative services) retained items resulted in mean as 61.56 and overall variance as 56.129 robust cronbach alpha value that are recorded as (Table 3).0.822, 0.874, 0.817 and 0.865 respectively and with overall alpha value of the scale as 0.858. CITC of SDB: At the initial stage of item analysis, out of all the four dimensions ranged between 0.316 and twenty items of SDB, three items are deleted due to 0.644, while SMC ranged between 0.550 and 0.801 low SMC values. All the retained items of SDB ( (Table 3).eighteen) reflected good internal consistency with
cronbach alpha as .838. The SMC of items in the two dimensions, namely, absorptive and collaborative are within the range of 0.564 to 0.634
Construct CITC Range SMC Range CAOCB, Overall CA= 0 .759
Altruism 0.340 - 0.615 0.578 - 0.605 0.758Sportsmanship 0.398 - 0.695 0.549 - 0.845 0.806Conscientiousness 0.382 - 0.488 0.549 - 0.722 0.700Civic Virtue 0.420 - 0.690 0.532 - 0.759 0.719SDB, Overall CA= 0.838Absorptive Competencies 0.469 - 0.686 0.592 -0 .634 0.775Collaborative Competencies 0.452 - 0.667 0.564 -0 .612 0.786
Table 3: Item Analysis of OCB, SDB and Value-Creation
NICE Journal of Business • Vol. 11 • Nos. 1 & 2 • January - December, 2016 39NICE Journal of Business • Vol. 11 • Nos. 1 & 2 • January - December, 2016 38
Role of Organisational Citizenship Behaviour and Service-dominant Logic in Value-creation in Higher EducationHardeep Chahal and Rupa Mahajan

(2008); Vargo (2008); Karpen, Bove and Lukas (2009); Ordanini and Parasuraman (2010); Profile of RespondentsEdvardson, Tronvoll and Gruber (2011); Chahal
The sample consisted of 43 senior university and Mahajan (2014b). The items for collaborative officers, of which 35 were male (81.39%) and 8 and absorptive competencies were also extracted female respondents (18.60%). The majority of the from studies, such as Ballantyne and Varey (2008); respondents were in the age group of 48 years and Payne, Storbacks and Frow (2008); Vargo (2008); above (81.39%), and the rest (18.61%) were in 38 -and Yazdanparast, Manuj and Swartz (2010). 47 year age-group. With regard to the educational Value-creation- A scale for value-creation, qualifications, 23.25% were M.Phil. while 76.74% including four dimensions that included teaching, were Ph.D. degree holders. These officers were r esea rch , co -o rd ina t ion (co l l ege ) and also identified according to their designation - administrative services was developed. Thus, a registrar (2), controller (2), director (8), dean (3), total of 47 items for value-creation was finalised. principal (12), joint registrar (3) and deputy registrar (14). The profile of respondents (UOJ and All the items of the questionnaire were anchored GNDU officers) is given in Table 1.with a 5-point Likert's scale, where 1 stands for
'strongly disagree' and 5 stands for 'strongly agree'.
Table 1: Demographic Profile of Sampled University Officers
creation. Skewness and kurtosis are examined DATA ANALYSIS AND using normal probability plots. The details of INTERPRETATIONdescriptive statistics are given in Table 2.
Descriptive Statistics
At the outset, response scores for negative items are reversed to examine descriptive statistics of the three construct namely, OCB, SDB and value
Demographic
Factors
Groups UOJ GNDUNumber Percentage
(%)
Number Percentage
(%)
Number Percentage
(%)
Gender Male 20 90.90 15 71.42 35 81.39Female 2 9.09 6 28.58 8 18.60
Age 38-47 3 13.63 3 14.28 6 18.6148 & Above 17 77.27 18 85.72 35 81.39
Qualification M.Phil 5 22.72 5 23.81 10 23.25Ph.D / NET 17 77.27 16 76.19 33 76.74
Designation Registrar 1 4.54 1 4.76 2 4.65Controller 1 4.54 1 4.76 2 4.65Director 2 9.09 6 28.57 8 18.60
Dean 2 9.09 1 4.76 3 6.97Principal 4 18.18 8 38.09 12 27.90
Joint Registrar 2 9.09 1 4.76 3 6.97Deputy Registrar 10 45.45 4 19.04 14 32.55
Teaching 1-10 2 9.09 1 4.76 3 6.97Experience 11-20 5 22.72 2 9.52 7 16.27
21-30 9 40.90 11 52.38 20 46.5131-40 6 27.27 7 33.33 13 30.23
Administrative
Experience
1-5 10 45.45 15 71.42 25 58.136-10 3 13.63 2 9.52 5 11.6211-15 7 31.81 3 14.28 10 23.2516-20 2 9.09 1 4.76 3 6.97
Table 2: Descriptive Statistics of Senior Officers
Constructs MeanStandardDeviation
Skewness Kurtosis
Min Max Overall Min Max Min Max Min Max
OCB 3.91 4.12 3.60 0.718 1.411 0.008 -0.339 0.044 0.765
SDB 3.51 3.86 3.55 0.812 1.252 0.066 0.527 -0.077 0.163
Value-Creation
3.27 4.30 3.79 0.674 1.295 0.002 0.362 0.025 0.368
while CITC is ranged between 0.452 and 0.686. Item AnalysisThe overall scale statistics that are, overall mean (55.88) and overall variance (28.82) along with OCB: Item analysis was conducted on forty- three item scale statistics that are, item mean (mean= items that resulted in deletion of fourteen items 3.555, variance= 0.033) and item variance (complete deletion of courtesy dimension) as (mean=0.961, variance=0.037) reflect good scale squared multiple correlation (SMC) values were properties of SDB (Table 3).less than the set criterion (greater than 0.5). After
deletion, overall cronbach alpha value of OCB Value-creation: The item analysis performed on measure is recorded at 0.759, which is above the forty- seven items of value creation grouped under recommended criterion (0.7). Further, majority four factors namely, teaching (eleven items), values of corrected item-to-total correlation research (seven items), coordination (college) (CITC), ranged between 0.340 and 0.695 along (eight items) and administrative services (twenty with SMC values ranging between 0.549 and 0.845. one items) resulted in deletion of fifteen items due The item mean values are recorded as 3.240 (with to low SMC values. Eight (teaching), five 0.286 variance), item variance mean as 0.913, (with (research), four (college coordination) and fifteen 0.443 variance) while scale statistics reveal overall (administrative services) retained items resulted in mean as 61.56 and overall variance as 56.129 robust cronbach alpha value that are recorded as (Table 3).0.822, 0.874, 0.817 and 0.865 respectively and with overall alpha value of the scale as 0.858. CITC of SDB: At the initial stage of item analysis, out of all the four dimensions ranged between 0.316 and twenty items of SDB, three items are deleted due to 0.644, while SMC ranged between 0.550 and 0.801 low SMC values. All the retained items of SDB ( (Table 3).eighteen) reflected good internal consistency with
cronbach alpha as .838. The SMC of items in the two dimensions, namely, absorptive and collaborative are within the range of 0.564 to 0.634
Construct CITC Range SMC Range CAOCB, Overall CA= 0 .759
Altruism 0.340 - 0.615 0.578 - 0.605 0.758Sportsmanship 0.398 - 0.695 0.549 - 0.845 0.806Conscientiousness 0.382 - 0.488 0.549 - 0.722 0.700Civic Virtue 0.420 - 0.690 0.532 - 0.759 0.719SDB, Overall CA= 0.838Absorptive Competencies 0.469 - 0.686 0.592 -0 .634 0.775Collaborative Competencies 0.452 - 0.667 0.564 -0 .612 0.786
Table 3: Item Analysis of OCB, SDB and Value-Creation
NICE Journal of Business • Vol. 11 • Nos. 1 & 2 • January - December, 2016 39NICE Journal of Business • Vol. 11 • Nos. 1 & 2 • January - December, 2016 38
Role of Organisational Citizenship Behaviour and Service-dominant Logic in Value-creation in Higher EducationHardeep Chahal and Rupa Mahajan

Value-Creation, Overall CA= 0.858Teaching 0.399 -0 .644 0.554 - 0 .686 0.822Research 0.316 -0 .542 0.550 - 0 .654 0.874Co-ordination (college) 0.408 -0 .532 0.559 - 0 .675 0.817Administrative Services 0.324 -0 .546 0.578 - 0 .801 0.865
Note: CITC (Corrected Item Total Correlation), SMC (Squared Multiple Correlation), CA (Cronbach Alpha)
Hypothesis Testing significantly contributing towards OCB. Courtesy however is completely excluded from this
We used the Partial Least Square (PLS) method for construct. Hence hypotheses H1a, H1b, H1c, H1d testing hypotheses relating to OCB, SDB and value and H1e stand partially accepted. creation. PLS (Partial Least Square) is used to analyse relationship in items of structural and Both the two SDL competencies- absorptive measurement models. To run PLS, summated mean competencies (â=0.757) and collaborative of respective dimensions of all the constructs are competencies (â=0.998) are significantly used to establish relationship among the constructs. predicting SDB. As such, hypotheses H2a and H2b Hair et al., (2014) stated that internal reliability (0.7 are accepted. or higher is considered), composite reliability (0.7 or higher is considered) and item loadings above The three dimensions of value creation - teaching 0.05 signify that the measures are adequate in their (â=0.894), research (â=0.873) and coordination validity. Finally, as a mean of evaluating (college) (â=.0663) contribute significantly while discriminant validity, the average variance fourth dimension that is, administrative services, extracted for each construct should be greater than contributes insignificantly. Thus, hypothesis H3 is the square of the correlation between the construct partially accepted. and all other constructs. AVE (0.5 or higher is considered) and discriminant validity (square root Further PLS result also reflects that value creation of AVE of each latent variable should be greater is more significantly predicted by SDB (â =0.897, than the correlations among the latent variables). p=0.000) while OCB (â=0.662, p=0.001) predicts
value creation moderately. Hence hypotheses H4 Among the four OCB dimensions altruism and H5 are being accepted (Figure 1).(â=0.719), sportsmanship (â=0.827), civic virtue (â=0.680) and conscientiousness (â=0.570) are
Note: OCB (Organisational Citizenship Behaviour), AT (Altruism), SP (Sportsmanship), CO (Conscientiousness), CV (Civic Virtue), SDB (Service Dominant Behaviour), AB (Absorptive Competencies), COC (Collaborative Competencies), VC (Value Creation), TVC (Teaching), RVC (Research), CVC (College) and UVC (University). Values represent regression weights and p- values.
Figure 1: Research Model
Discussion authorities / officers or controlling officers are well competent in exhibiting their absorptive (â= 0.757)
Organisational citizenship is discretionary and collaborative (â= 0.998) competencies. behaviour that is not part of an employees' formal Absorptive competencies enable the authority job requirement but significant in promoting members to adapt themselves to changing effective functioning of the organisations. environment, have free flow of communication, Organisations need employees who do more than provide timely and accurate information to their their usual job duties and provide performance that peers while collaborative competencies enable the is beyond expectations. The result of the study members to collaborate with their peers and other reflects that among five dimensions of OCB, stakeholders to accomplish organisational goals in sportsmanship (â=0.827) is the strongest predictor terms of achieving excellency in the higher of OCB, followed by altruism (â= 0.719) and civic education sector. Lusch and Vargo (2008); Chahal virtue (â= 0.680). Conscientiousness (â=0.570) is and Mahajan (2014b) concluded that SDB created found to predict OCB insignificantly while value through integration and use of operant courtesy dimension is completely deleted from the resources which can help in integration of all construct. Similar results are also found in studies stakeholders. This might help in strengthening their conducted by as Mackenzie et al., (1993); Walz and competencies more and subsequently increases Niehoff, (2000); Somech and Ron (2007); Chahal knowledge generation and interaction among and Mahajan (2014a). The findings reflect that higher authorities / officers vis-à-vis results in officers of both universities exhibit OCB at an achievement of organisational goals (average level. They regularly involve themselves in ). Thus both competencies enable the organisational activities (as and when required); higher stakeholders to adapt and collaborate with provide voluntary help to their peers to accomplish each other to attain organisational performance. organisational targets; and are supportive to new The knowledge dissemination can be done by changes related to norms and policies for effective organising seminars, workshops, training courses, functioning of the organisation. However, higher orientation courses for officers on required officers need to focus more on issues related to functional areas such as finance, examination, supervision of work in various departments, administration etc. The ultimate aim of holding regularity and punctuality, encourage informal such congregations is to acquaint employees of the talks and meets in between their busy time schedule organisation with the latest academic and non – to enhance the OCB level as good informal academic developments (Chahal and Mahajan, relations enable the members to work in a 2014b) and such practices will widen the conducive and healthy working environment Thus, knowledge horizon of various stakeholders and higher level of the OCB of higher officers in terms create value for the organisation (Robson et al., of helping, sportive, responsible behaviour, can 2004; and Helen and Rubery, 2005). enable them to pay more attention to update and modify academic and non- academic policies to All the dimensions except administrative services enhance organisation image and value creation contribute to value creation in educational through effective working environment (Oplatka organisations. The study reveals that officers are 2006). satisfied with the level of teaching and research,
which pave the way to value-creation in institutes The SDB based on the networking concept helps in of higher education. Value-creation is specifically creating and improving interaction-based reflected in the form of good teaching skills, ac t iv i t ies , bu i ld ing and s t rengthening providing updated knowledge to students and competencies of stakeholders that ultimately lead scholars, publications in various national and to co-creation of value (Chahal and Mahajan, international journals, participation and high level 2014b). The SDB result reflects that higher of interaction among stakeholders, organising
Golooba and Ahlan, 2013
NICE Journal of Business • Vol. 11 • Nos. 1 & 2 • January - December, 2016 41NICE Journal of Business • Vol. 11 • Nos. 1 & 2 • January - December, 2016 40
Role of Organisational Citizenship Behaviour and Service-dominant Logic in Value-creation in Higher EducationHardeep Chahal and Rupa Mahajan

workshops and seminars, along with timely and Journal of Social Sciences, 28(4), 581-589accurate communication of information (Payne,
Bateman, T.S., & Organ, D.W. (1983). Job Storbacks and Frow 2008; Chahal and Mahajan satisfaction and the good soldier: The relationship 2014a, 2014b). The study also reveals that higher between affect and employee citizenship. Academy authorities / officers ought to focus on enhancing of Management Journal, 26(4), 587-595overall performance for value-creation. This can be
done by focussing on administrative level of work-Birenbaum, A., and E., Sagarin, (1976), Norms and like, updating policies and procedures related to human behaviour. New York: Praegerfunctioning of departments, syllabi updation,
availability and submission of forms, improving Cabiddu, F., Lui, T.W., & Piccoli, G. (2013). the quality of services offered, providing timely Managing value co-creation in the tourism feedback to various stakeholders with regard to industry. Annals of Tourism Research, 42(July), their performance, encouraging and administering 86–107the overall functioning of the organisation from
time to time.Chahal, H., & Mahajan, R. (2014a). Exploring OCB among Jammu university faculty members,
CONCLUSION Abhigyan, 32(3), 57-70
To conclude, sustainability of higher education Chahal, H., & Mahajan, R. (2014b). Exploring role organisations can be maintained by enhancing of service competence orientation (SCO) in both informal and formal relations among various creating value in higher education sector. Amity stakeholders (Chahal and Mahajan, 2014a, 2014b). Business School, 15(2), 67-83 The relationship through OCB (informal) and SDB
(formal) can help in encouraging valuable Chahal, H., & Mahajan, R. (2015). The mediating
interaction among various stakeholders. Further, role of organisational citizenship behaviour (OCB)
OCB and SDL based environment in the UOJ and and service dominant logic (SDL) in creating value
GNDU encourage exchange and information in higher education”, Apeejay Journal of
sharing with peers, updating and encouraging Management and Technology, 10(1), 49-61
innovative and competitive initiatives for sustainable development in the higher education. Chou, E.Y., Lin, C.Y., & Huang, H.C. (2016).
Fairness and devotion go far: Integrating online justice and value co-creation in virtual
REFERENCES communities. International Journal of Information Management, 36(1), 60-72Acaraya, A., & Akturan, A. (2015). The
relationship between organisational citizenship Chuin, L.M. , & Ramayah, T. (2009) . behaviour and organisational silence. Procedia - Dimensionality of organisational citizenship Social and Behavioural Sciences, 207, 472 - 482behaviour (OCB) in a multicultural society: The case of Malaysia. International Business Research, Ballantyne, D., & Varey, R.J. (2008). The service- 2(1), 48–55dominant logic and the future of marketing.
Journal of Academy of Marketing Science, 36(1), Devece, C., Daniel P.M., & María, P.A. (2015). 11-14Organisational commitment and its effects on organisational citizenship behaviour in a high-Banu, C.V., Amudha, R., & Surulivel, S.T. (2012). unemployment environment. Journal of Business A pragmatic study on organisation citizenship Research, http://dx.doi.org/10.1016/j. jbusres. behaviour in an Indian private leisure travels (accessed on 22 Feb 2016)organisation using factor analysis. European
Edvardson, B., Tronvoll, B., & Gruber, T. (2011). Karpen, I.O., Bove, L.L., & Lukas, B.A. (2012). Expanding understanding of service exchange and Linking service-dominant logic and strategic value co-creation: a social construction approach. business practice: A conceptual model of a service-Journal of Academic Marketing Science, 39(2), dominant orientation. Journal of Service Research, 327-339 15(1), 21-38
Ellinger, A.E., Carolyn, F.M., Andrea, D.E., Kukla A. (2000), Social constructivism and the Daniel, G.B., Ayºe, B.E.B., and Yu-Lin, W. (2013). philosophy of science. New York, RoutledgeInfluences of organisational investments in social
Kuzgun, E., & Asugman, G. (2015). Value in capital on service employee commitment and services – a service dominant logic perspective. performance. Journal of Business Research, 66(8), Procedia - Social and Behavioral Sciences, 1124–1133207(October), 242 – 251
Golooba, M., & Ahlan, A.R. (2013). Service value Lai, K.P., & Tan, C.H. (2015). Neighbours first, co-creation in research and innovation practices in bankers second”: Mobilising financial citizenship higher education institutions in Malaysia. Procedia in Singapore. Geoforum, 64(August), 65-77Technology, 11(December), 342-347
Lin, G.R., & Lin, J. (2006). Ethical customer value Gronroos, C. (2008). Service logic revisited: who creation: Drivers and barriers. Journal of Business creates value? And who co-creates. European Ethics, 67(1), 93–105Business Review, 20(4), 298-314
Liu, J.S., & Tsaur, S.H. (2014). We are in the same Gronroos, C. (2011). Value co-creation in service boat: Tourist citizenship behaviours. Tourism logic: A critical analysis. Marketing Theory, 11(3), Management, 42(June), 88-100279-301
Lusch, R.F., & Vargo, S.L. (2008). The service- Gummenson, E. (2008). Extending the service-dominant mindset, in Bill Hepley and Windy dominant logic from customer centricity to Murphy (Ed). Service, Science, Management and balanced centricity. Journal of Academy of
stEngineering Education for the 21 Century, Marketing Science, 36(1), 15-17Springer, 89-96
Hair, F.J., Sarstedt, M., Hopkins, L., & Lusch, R.F., Vargo, S.L., & Brien, M.O. (2007). Kuppelwieser, G.V. (2014). Partial least squares Competing through service: Insights from service-structural equation modeling (PLS-SEM): An dominant logic. Journal of Retailing, 83(1), 5-18emerging tool in business research. European
Business Review, 26(2), 106-121Mackenzie, S.B., Podsakoff, P.M., & Fetter, R. (1993). The impact of organisational citizenship Helen, H. and Rubery, E. (2005), “Educating behaviour on evaluations of salesperson managers to lead community enterprises”, performance. Journal of Marketing, 57(1), 70-80 International Journal of Public Administration,
28(9-10), 887-902Maglio, P.P., & Spohrer, J. (2008). Fundamentals of service science. Journal of Academy of Marketing Jung, J.Y., & Hong, S. (2008). Organisational Science, 36(1), 18-20citizenship behaviour (OCB), TQM and
performance at the Maquiladora. International McColl-Kennedy, J. R., Vargo, S. L., Dagger, T.S., Journal of Quality and Research Management, Sweeney, J. C., & van Kasteren, Y. (2012). Health 25(8), 793 – 808
,
NICE Journal of Business • Vol. 11 • Nos. 1 & 2 • January - December, 2016 43NICE Journal of Business • Vol. 11 • Nos. 1 & 2 • January - December, 2016 42
Role of Organisational Citizenship Behaviour and Service-dominant Logic in Value-creation in Higher EducationHardeep Chahal and Rupa Mahajan

care customer value cocreation practice styles. Performance, 10(2), 133-151Journal of Service Research, 15 (4), 370-389
Podsakoff, P.M., MacKenzie, S.B., Paine, J. B. & Nezakati, H., Kohzadi, V.F.K., and Asgari, O. Bachrach, D.G. (2000). Organisational citizenship (2010). Fostering organisational citizenship behaviours: A critical review of the theoretical and behaviour through human resource management. empirical literature and suggestions for future www.ubiconpro.com/27.Nezakati.pdf, accessed research. Journal of Management, 26(3), 513–563on 23 Oct, 2011
Nga, G. B., Hackermeier, I., Jiao, X., & Wagdarikar, P. (2010). Organisational citizenship behaviour and perception of organsational justice i n s t u d e n t j o b s . G R I N Ve r l a g . h t t p : / / w w w . g r i n . c o m / d e / e -book/152678/organisational-cit izen-ship-behaviour-and-perception-of-organisational- Prahalad, C.K. & Ramaswamy, V. (2004). Co-justice creation experiences: The next practice in value
creation. Journal of Interactive Marketing, 18(3), Ng, T.W.H., Simon S.K., Lam, D., and Feldman, C. 6-14(2016). Organisational citizenship behaviour and counterproductive work behaviour: Do males and Robson. J., Bailey, B., & Larkin, S. (2004). Adding females differ ? Journal of Vocational Behaviour, va lue : inves t iga t ing the d i scourse o f 93(April), 11–32 professionalism adopted by vocational teachers in
further education colleges. Journal of Education Oplatka, I. (2006). Going beyond role and Work, 17(2), 183-195expectations: towards an understanding of the determinants and components of teacher Ronald & Amelia (2014). Measuring service organisational citizenship behaviour. Educational quality on higher education base on service Administration Quarterly. 42(3), 385-423 dominant logic. Interdisciplinary Journal of
Contemporary Research in Business, 6(5), 95-106 Organ, D.W. (1983). The good soldier syndrome. L e x i n g t o n , M A , L e x i n g t o n B o o k s , Saks, A.M. (2006). Antecedents and consequences psycnet.apa.org/psycinfo/1988-97376-000, of employee engagement. Journal of Managerial accessed on 23 Jan 2009 Psychology, 21(7), 600-619
Ordanini, A., & Parasuraman, A. (2010). Service Smith, C.A., Organ, D.W., & Near, J.P. (1983). innovation viewed through a service - dominant Organisational citizenship behaviour: Its nature logic lens: A conceptual framework and empirical and antecedents. Journal of Applied Psychology, analysis. Journal of Service Research, 14(1).3-21 68(4), 653- 663
Payne, A.F., Storbacks, K., & Frow, P. (2008). Somech, A., & Ron, I. (2007). Promoting Managing the co-creation of value. Journal of organisational citizenship behaviour in schools: Academy of Marketing Science, 36(1), 83-96 Thse impact of individual and organisational
characteristics. Education Administration Podsakoff, P.M., & Mackenzie, S.B. (1997). Quarterly, 43(1), 38- 66 Impact of organisational citizenship behaviour on organisational performance: A review and Vargo, S.L. (2008). Paradigmatic traps and suggestions for future research. Human perspectives. Journal of Service Research, 11(2),
Podsakoff, P.M., MacKenzie, S.B., Moorman, R.H., & Fetter, R. (1990). Transformational leader behaviours and their effects on followers' trust in leader, satisfaction, and organisational citizenship behaviours. The Leadership Quarterly, 1(2), 107-142
211-215. 324-337
Vargo, S.L., & Lusch, R.F. (2004). Evolving to a Walz, S.M., & Neihoff, B.P. (2000). Organisational new dominant logic for marketing. Journal of citizenship behaviour: Their relationship to Marketing, 68(1), 1-17 organisational effectiveness. Journal of Hospitality
and Tourism, 24(3), 301-319Vargo, S. L., & Lusch, R.F. (2008). Why Service?. Journal of Academic of Marketing Science, 36(1), Yazdanparast, A., Manuj, I., & Swartz, S.M. 25-38 (2010). Co-creating Logistics Value: A Service-
Dominant Logic Perspective. The International Walker, H.A., Thyne, S.R., Simpson, B., Michael, Journal of Logistics Management. 21(2), 375- 403J., Lovaglia, D.W., & Barry, M. (2000). Network exchange theory: recent developments and new directions. Social Psychology Quarterly, 63(4),
NICE Journal of Business • Vol. 11 • Nos. 1 & 2 • January - December, 2016 45NICE Journal of Business • Vol. 11 • Nos. 1 & 2 • January - December, 2016 44
“Empower yourself and realize the importance of contributing to the world by living your talent. Work on what you love. You are responsible for the talent that has been entrusted to you.”
Catharina Bruns
Founder, Work is not a Job
?????
“The price of success is hard work, dedication to the job at hand, and the determination that whether we win or lose, we have applied the best of ourselves to the task at hand.”
Vince Lombardi Executive, Head Coach, Player, NFL
?????
“The difference between a boss and a leader: a boss says 'Go!' – a leader says, 'Let's go!'.
E.M Kelly U.S Army
Role of Organisational Citizenship Behaviour and Service-dominant Logic in Value-creation in Higher EducationHardeep Chahal and Rupa Mahajan

NICE Journal of Business
Why you should submit your research work to us?
• Leading Journal in the Field of Business: NICE Journal of Business is now established as one of the leading academic journals on the subject. It has been accepted well among academicians as well as practitioners. In a short span of time, it has made rapid progress and has carved out its place among the reputed, peer-reviewed, business research journals published in India.
• Refereed Journal: We have a rigorous peer-review process, involving a comprehensive feedback on your paper. The editorial team follows an elaborate process for selection and improvement of papers for publication. Each article passes through a blind review by two or three experts.
• Wider Scope: The journal covers general management, marketing and advertising, fnance and banking, organisational behaviour and human resources management, production and operations management, business environment and policy, international business, etc.
• Wider Readership: (1) The journal is accessible in libraries of all reputed business schools and university
departments of management, commerce, and economics. It includes quality articles of interest to a large audience in the wide feld of business.
(2) Besides paid subscriptions, we have exchange arrangement with about 100 well-known business journals.
• Listing: The journal has ISSN number. It is included in the Database of EBSCO Publishing, Inc. (USA) and is listed in the Cabell’s Management Directory (USA).
• Other Features:(1) Each research article has an abstract, key words, introduction, survey of literature, objectives
and hypotheses, research methodology, discussion and analysis, conclusion, and bibliographical references.
(2) We follow the British spellings and take great care of grammar and pattern of bibliographical citations and references, even though it is a daunting task to obtain full and precise information in some cases.
(3) Its Editorial Board and Manuscript Review Board consist of eminent experts from the relevant fields, including professors from reputed universities IIMs, and IIT-D, and vice-chancellors and directors of universities and business schools, from India and the USA, the UK, and Australia.
(4) The journal has, as its Editor, a former Professor of Delhi University, who has long experience of teaching post-graduate classes and conducting and guiding research, and has a large number of publication to his credit.

INFLUENCE OF PERSONAL CHARACTERISTICS ON WORK-LIFE BALANCE OF WOMEN EMPLOYEES
Sugandha Verma* and T. S. Tomar**
* Research Scholar, Department of Commerce, S.M.J.N. (P.G.) College, Haridwar; e-mail: [email protected]** Associate Professor, Department of Commerce, S.M.J.N. (P.G.) College, Haridwar
Key words: Work-life balance, Women employees, Commercial banks.
Abstract
Purpose: A proper fit between the work-life and the personal life of an employee is essential for the betterment of both the employee and the organization.. This study seeks to ascertain the status of the work-life balance (WLB) of women employees in banks, and to assess the influence of their personal characteristics on the WL.
Methodology: The data was collected from 168 respondents, using a structured questionnaire. While personal characteristics, including the age, number of dependents, family size, marital status, job experience and the commuting time, were the independent (predictor) variables , the WLB was the dependent (outcome) variable. The data was analysed through Simple Linear Regression model.
Findings: The study revealed the medium level of the WLB of women employees along with the significant influence and predictability of their personal characteristics on their WLB. However, the marital status was the most significant characteristics having the highest influence on working women's WLB.
Limitations: The variables used in this study should be applied to other samples, as well as to adapt, refine, and expand those to increase their impressive predictive ability.
Value / Contribution: The paper adds to the understanding of the influence of personal characteristics on the WLB of women working in the banking sector.
the WLB and their ability to perform and gain INTRODUCTIONsatisfaction from the work or family domains (e.g., Greenhaus and Foley, 2007). Balancing work and personal life is a key challenge for women A women employee has many roles to play (e.g., employees and organisations (Valcour, 2007). It employee, wife, mother, caregiver) and the excess has been suggested that an individual's best interest of responsibilities over the available time, hampers

NICE Journal of Business • Vol. 11 • Nos. 1 & 2 • January - December, 2016 49
Influence of Personal Characteristics on Work-life Balance of Women Employees
NICE Journal of Business • Vol. 11 • Nos. 1 & 2 • January - December, 2016 48
is served by living a balanced life. Hyman and Work-life BalanceSummers (2004) observed that women still
Drago and Kashian (2003) stressed the need to primarily take care of domestic tasks, irrespective focus on work and life, rather than on work and of their employment status. So, many women family, recognising the needs of employees who do employees continue to face difficulties in balancing not have a family (e.g, childless or single workers). their job and home lives. In defining the work–life balance, Kossek and
Kanter (1977) highlighted the issue of WLB by Lambert (2004) suggested work as a paid opening the front of research and development in employment and everything outside the work was the field of organisational behaviour (OB). Various life. They also asserted that life focused not only on human resource policies in this area are being family issues but also on life in general.framed by modern organisations, including,
Duxbury and Higgins (2001) conducted a study flexible work-schedules, job-sharing, non-among the employees of medium and large public traditional work hours, tele-commuting, autonomy and private organisations across Canada. They and support from colleagues and supervisors asserted that parenthood remains more difficult for (Haddock et al., 2006). The WLB is, thus, emerging women than men; work-life conflict has a negative as one of the most strategic and contemporary impact on organisational performance and on issues within the purview of HRM around the employees as well; and employees with high work-globe.life conflict make more use of Canada's Health Care System. In organisations and on the home
REVIEW OF LITERATURE front, the challenge of the WLB is rising to the top of many employees' consciousness. The evaluation A review of available literature paves the way to a of influence of private life and external life well-developed research work. Here, the review of determinants, that is, structural and institutional some studies is presented in a chronological order, factors on the WLB has been done by Kucharova so that a knowledge gap can be identified for the (2009). In this study, analysis was based on a conduct of a meaningful study. comparison of the situation in the Czech Republic with selected countries of Europe. The study
Work-family Balance revealed that the factors of private life influence the WLB in two facets. While one is the staging of the A number of theoretical studies have been life-cycle in terms of the performance of work and conducted to understand the interface between childcare; the other second is the inter-connection work and family. Greenhaus and Beutell (1985) of the two spheres in the lives of working parents noted that researchers needed to pay more attention from the perspective of gender equality in the employees balancing their work and family, and the Czech Republic, it was found that there was a high associated conflict due to any imbalance. degree of identification with the current state of the According to Staines (1980), Mac Ewen and division of family and the work- roles between the Barling (1994), and Spain and Bianchi (1996), it partners and thus, with the space in which the work was the conception of work-family balance which and family responsibilities were combined. concentrated on the management of the job
horizons and family affairs. Later on, other aspects In their study, Nwagbara and Akanji (2012) found of socialisation moved in and the traditional that motivation and commitment were the basic thought of work-family balance turned into the new elements needed for organisations to perform better version of WLB. and were incentivised for better organisational
commitment and productivity of Nigerian women employees in Nigeria
In the Indian context, Mathew and Panchanatham OBJECTIVES OF THE STUDY(2011) observed that in the existing familial and
The study has two objectives:societal set up, entrepreneurial women were overburdened and found it increasingly difficult to 1. To ascertain the status of the WLB of women balance their work and life roles. A total of 227 employees; andwomen entrepreneurs, belonging to the various
2. To assess the influence of Women employees' states of South India, were contacted for the survey.
personal characteristics on their WLB. While the Support network, quality of health, and the time management were observed as the positive
Hypothese of the Studypredictors of the WLB, the dependent care and role overload were the negative predictors. Even though The following null hypotheses were formulated the vast majority of respondents struggled with the for testing:WLB issues, there existed significant variations in
H : Personal characteristics of women 01 the perception of the WLB among the various employees do not affect their WLB
categories of women entrepreneurs, depending on H : Personal characteristics do not predict the the age-group, educational level, income level and 02
WLB of women employees.the marital status. Independent sample t-test and one-way ANOVA revealed these differences significantly. The authors also noted that most of
RESEARCH METHODOLOGY the organisations were giving high priority to the work-life balance through flexi-timings, work from The study is an attempt to empirically assess the home options, extended maternity leave, fitness influence of personal characteristics on the WLB of centers, cafeteria and recreation rooms women employees. Women employees working in (Satyanarayana and Sreelakshmi, 2012). They Scheduled Commercial Banks (SCBs) located in examined the work-life balance of employees in the the Haridwar district of Uttarakhand state IT-enabled service sector and found that the WLB constituted the universe. need not always be viewed as negative. Another survey of employees working at call centers in the Delhi NCR region, conducted by Agarwal (2014), Instrument Usedrevealed that a significant impact of the nature of
The data was collected through a questionnaire job on the WLB and significant differences
developed to measure the women employees' between male and female employees on the WLB
perception of the WLB. The questionnaire was perception.
divided into two parts. The first part of the questionnaire contained the statements to rate the status of the WLB of women employees, while the
Research Gap and Rationale of the Studysecond part consisted of the personal
Most of the Human Resource Management (HRM) characteristics of women employees. The five-researchers sought to identify the relationship point Likert scale statements were used for the between the WLB and the employees'demographic WLB, wherein the score of 5 represented ‘Strongly factors. However, it was hard to locate the impact of disagree’ and 1 meant ‘Strongly agree’ With 20 personal characteristics on the WLB. Hence, this statements, the measurement tool had its scoring study attempts to fill this knowledge gap and to range from 20 to 100 for each response. A higher contribute to the relevant field of knowledge. mean value signified the better status of the WLB
on a continuum.
Sugandha Verma and T. S. Tomar

Personal characteristic Fractions Frequency Percent
Age (In years) Up to 30 years 85 50.6
31-40 years 51 30.4
41-50 years 16 9.5
51 years and above 16 9.5
Marital status Unmarried 68 40.5
Married 84 50.0
Widow or Divorcee 16 9.5Type of family Nuclear 102 60.7
Joint 66 39.3
No. of dependents None 34 20.2
Up to 3 67 39.9
4-6 51 30.4
7 and above 16 9.5Job experience Up to 5 years 102 60.7
6-10 years 34 20.3
11-20 years 16 9.5
21-30 years 16 9.5Commuting time Up to 30 Min 17 10.1
Up to 1 Hr. 84 50.0
Above 1 Hr. 67 39.9
Total 168 100.0
Table 1: Demographic Profile of Respondents
Using the personal characteristics we assessed their DATA ANALYSIS AND influence on the WLB of women employees in INTERPRETATIONbanks. Therefore, to achieve the second objective,
The obtained value of Chronbach's Alpha is 0.853, the simple linear regression analysis is shown in the though the standardised value of Alpha is found to following sub-section. be 0.850 for the scale used to measure the employee's perception of the WLB. These alpha
WLB and Employees' Age values depict the good consistency of the questionnaire and prove the sound reliability of the
The Regression analysis between the WLB and the instrument used in social sciences (Field, 2009). respondent's age is summarised in Table 2. This table consists of correlation, magnitude of As mentioned earlier, in order to find out the overall influence and other information also about the status of the WLB of women employees in SCBs a relationship between the WLB and the respondents' combined mean value was obtained. The SPSS age. results showed that women employees have
reported 3.804 as the combined mean value of their WLB which is closer to the average value of the rating scales of the questionnaire.
bTable 2: Model Summary Results of Regression Analysis between WLB and Employees'Age
Model R R2
Adjusted R2
Std. Error ofthe Estimate
Change StatisticsDurbin-Watson
Standard Residual
R2 ? F ? df1 df2 Sig. F Change Maximum
1 0.303a 0.092 0.093 0.49106 0.092 15.341 1 166 0.000* 1.882 1.232
Note : a. Predictors: (Constant), Age b. Dependent Variable: Work-Life Balance* Significant as p < 0.05 at 95 % Level
The influence and prediction power of employee's being a requisite for a good model. The maximum age on the WLB are shown in Table 2. The value of value of the standard residual (1.232) is lower than R (0.303) represents the medium-level correlation 2.58 and 1.96, at 1 per cent and 5 per cent level of between the WLB and the employee's age. The significance , respectively, which is a confirmation
2 to prove the model to be good. It is found that, the value of R is 0.092, which shows that the age employee's age has 9.2 per cent influence on WLB accounts for 9.2 per cent of the variations in the
2 and 9.3 per cent predictability. WLB. The adjusted R with the value of 0.093 or 9.3 per cent confirms that with this value the regression model would predict the different set of data. The
ANOVA Values (WLB and Age) standard error of the estimate shows the fitness of the model. The values under the change statistics The ANOVA values based on the regression model
2 show whether the change in R is significant or not. between the WLB and the age are shown in Table 3, So, the change statistics confirms the prediction which represent the overall goodness of fit of the capacity of this model by adding new predictors. model. The value of the Durbin-Watson test is 1.882, which suggest that the residuals are uncorrelated,
NICE Journal of Business • Vol. 11 • Nos. 1 & 2 • January - December, 2016 51
Influence of Personal Characteristics on Work-life Balance of Women Employees
NICE Journal of Business • Vol. 11 • Nos. 1 & 2 • January - December, 2016 50
Variables
In this study, personal characteristics, including the Techniques used for Data Analysis age, number of dependents, size of family, marital
WLB scale scores were obtained by the average of status, job experience and the commuting time, the 20 statements. For ascertaining the status of were the independent (predictor) variables. The women employees' WLB in SCBs, the combined
WLB was the dependent (outcome) variable.mean of 168 responses was obtained. It provided an overall mean value of the entire dataset (Bordens
Data Collection and Abbott, 2011). To assess the influence of personal characteristics on the WLB, Simple Convenience sampling was used to collect the Linear Regression Analysis was used. The Simple primary data through the questionnaire from 168 Linear Regression Analysis is a method to test the women employees in the various branches of influence, prediction power and the fitness of the scheduled commercial banks (SCBs) model between the personal characteristics (independent variables) and the WLB (dependent variable). It the most commonly used test in the Reliability and Validity of Questionnairefield of organisation behaviour (Fiksenbaum, 2014).In order to ensure the reliability of the data
collected through the questionnaire for measuring The Sample: The demographic profile of the the perception of the WLB women employees in respondents is shown in Table 1. the banks, Cronbach Alpha value was calculated
with the help of the Statistical Package for Social Sciences (SPSS). However, the face validity of the questionnaire was also ensured by experts' opinion.
Sugandha Verma and T. S. Tomar

Model Sum of Squares df Mean Square F Sig.
1 Regression 4.633 1 4.633 15.341 0.000*a
Residual 50.125 166 0.302Total 54.758 167
Note :a. Predictors: (Constant), Age (in years)b. Dependent Variable: Work-Life Balance* Significant as p < 0.05 at 95 % Level
b Table 3: ANOVA (WLB and Employees'Age)
As shown in the table, the F-Ratio is 15.341 and it is WLB and Employees' Marital Status significant at the 5 per cent level. Thus, our The results of the simple linear regression analysis regression model based on the age has a significant between the WLB and the employee's marital influence and the prediction power of the WLB of status are shown in Table 4. These results also women employees. Alternatively, this model of comprise of the correlation, extent of influence, and regression between the WLB and the age depicts the level of predictability, etc. related with the WLB the overall significant and sound prediction power. and the marital status of the employee.
Results of Regression Analysis between WLB and Marital Status
bTable 4: Model Summary
ModelR R2
AdjustedR2
Std. Error ofthe Estimate
Change StatisticsDurbin-Watson
Standard Residual
R2 ? F ? df1 df2 Sig. F Change Maximum
1 0.756a 0.572 0.579 0.41021 0.572 152.959 1 166 0.000* 2.146 1.240
Note :a. Predictors: (Constant), Marital Statusb. Dependent Variable: Work-Life Balance
* Significant as p < 0.05 at 95 % Level
As shown in the table, the value of R is 0.756, which 1.240, which is less than 2.58 and 1.96 (at 1 per cent represents a large correlation between the WLB and and 5 per cent level of significance, respectively),
2 confirms the sound predictability of our model. So, the employee's marital status. The value of R it may be inferred that marital status has 52.7 per 0.572, shows that marital status of women cent influence on the WLB with 52.9 per cent employees influences their WLB with 57.2 per cent
2 predictability.predictability. Adjusted R conveys that with 0.579 or 57.9 per cent predictability, this regression
ANOVA Values (WLB and Employees' Marital model can predict another set of data. The standard Status) error of the estimate suggests the goodness of the
model. The change statistics show the significant The ANOVA test of the regression analysis difference made by adding new predictors to this between the WLB and the marital status, which model. The value of Durbin-Watson test is 2.146, shows the overall fitness of the model, is which suggests that the residuals are not correlated. summarised in Table 5.The maximum value of the standard residual is
b Table 5: ANOVA (WLB and Marital Status)
Model Sum of Squares df Mean Square F Sig.
1 Regression 26.156 1 26.156 152.959 .000*a
Residual 28.489 166 0.171
Total 54.645 167
Note : a. Predictors: (Constant), Marital Statusb. Dependent Variable: Work-Life Balance* Significant as p < 0.05 at 95 % Level
As shown in the table, the F-Ratio is 152.959 and it WLB and Employees' Family Typeis significant at 5 per cent level. It also validates that
The model summary has been depicted in Table 6 this regression model, on the basis of employee's
between the WLB and the type of family is given in marital status, has a great influence and is good to
Table 6 correlation, size of impact, degree of predict the WLB of women employees.
prediction etc regarding the WLB and the type of family are also shown in the table.
Results of Regression Analysis between WLB and Type of Family
Model R R2 Adjusted
R2 Std. Error ofthe Estimate
Change StatisticsDurbin-Watson
Standard Residual
R2 ? F ?df1 df2 Sig. F Change
Maximum
1 0.560a 0.314 0.316 0.46537 0.314 80.889 1 166 0.000* 2.071 1.462
Note: a. Predictors: (Constant), Type of Family
b. Dependent Variable: Work-Life Balance
* Significant as p < 0.05 at 95 % Level
bTable 6: Model Summary
The Model Summary shown in the table reveals the unrelated residuals. The maximum value of the the value of R to be 0.560, which indicates the standard residual (1.462) is below 2.58 and 1.96 (at medium-level correlation between the WLB and the 1 per cent and 5 per cent level of significance,
2 respectively), which again represents a good the type of employee's family. The value of R is 0prediction model. As a result, it is found that type of .314, which means that type of family has an impact family has an influence of 31.4 percent over the of 31.4 per cent on the WLB. The value of adjusted
2 WLB with predictive ability of 3.16 per cent. R denotes that our regression model can predict an entirely different set of data with 0.316 or 31.6 per
The results of ANOVA test between WLB and type cent. The value of the standard error of the estimate of family, which forms the part of regression embodies the model fitness. Values of change analysis, are presented in Table 7. These results statistics signify the difference significantly made report the overall fit of the model.by adding other predictors to the model. The value
of the Durbin-Watson test is 2.071, which stands for
NICE Journal of Business • Vol. 11 • Nos. 1 & 2 • January - December, 2016 53
Influence of Personal Characteristics on Work-life Balance of Women Employees
NICE Journal of Business • Vol. 11 • Nos. 1 & 2 • January - December, 2016 52
WLB and Family Type
Model Sum of Squares Df Mean Square F Sig.
1 Regression 17.634 1 17.634 80.889 .000*a
Residual 36.206 166 0.218
Total 53.840 167
Note : a. Predictors: (Constant), Type of Familyb. Dependent Variable: Work-Life Balance
* Significant as p < 0.05 at 95 % Level
b Table 7: ANOVA (WLB and Family Type)
As shown in the table, the value of the F-Ratio is model, developed on the ground of the type of 80.889, which is significant at the 5 per cent level of family, has an influence on the WLB and it is a good significance. This indicates that the regression predictor of the WLB also.
Sugandha Verma and T. S. Tomar

Model R R2
Adjust-ed R2
Std. Error ofthe Estimate
Change Statistics
Durbin-
WatsonStandard Residual
R2 ? F ?
df
1 df2 Sig. F ChangeMaximum
1 0.572a 0.328 0.324 0.47487 0.328 78.786 1 166 0.000* 1.940 0.848
Note : a. Predictors: (Constant), No. of Dependentsb. Dependent Variable: Work-Life Balance
* Significant as p < 0.05 at 95 % Level
bTable 8: Model Summary Results of Regression Analysis between WLB and Number of Dependents
As exhibited in the table, the R value is 0.572, residual (0.848) is less than 2.58 and 1.96, at 1 per which shows the medium- level of correlation cent and 5 per cent level of significance, between the WLB and number of employee's respectively, which suggests that our model is good
2 dependents. The value of R is found to be 0.328, for the prediction of the WLB. Hence, it can be which makes it evident that the number of concluded that number of dependents of the dependents of women employees has 32.8 per cent women employees in the SCBs has 32.8 per cent
2 impact on their WLB. The adjusted R reveals that impact over their WLB, with predictability of 32.4 our regression model contains the prediction per cent. capacity of 0.324 or 32.4 per cent for different
The analysis of variance, on the basis of regression dataset. The standard error of the estimate indicates model between the WLB and the number of the fit of the model. Change statistics confirm the dependents, is summarized in Table 9. The overall significant difference on the addition of new fitness of the model has been established through predictors to the model. The Durbin-Watson test these results. with the value of 1.940 shows the unrelated
residuals. The maximum value of the standard
From the table, we notice that the value of F-Ratio The model summary of the regression analysis (78.786) is significant at the 5 per cent level. It between the WLB and the job experience is shown establishes that our regression model based on the in Table 10. Besides that, the level of correlation, number of dependents of women employees is a extent of influence, degree of prediction power, good predictor of the WLB. It is also found that the etc., are also been reported here about the WLB and number of dependents has a significant influence the job experience.on the WLB of women employees in the SCBs.
As shown in the table, the R value of WLB and the value of the standard residual (1.429), is less than job experience in the table of model summary is 2.58 and 1.96 at 1 per cent and 5 per cent level of 0.325. It indicates the medium level of the significance, respectively. It represents the fit of correlation between the WLB and the job this model for the prediction of the WLB. Thus, it is
2 confirmed in case of the job experience also it has experience. The value of R (0.106), suggests that an influence of 10.6 percent with 10.1 per cent the job experience influences only 10.6 per cent of predictability, on the WLB of women employees in respondents' over the WLB. The value of the
2 the SCBs. adjusted R shows 0.101 (or 10.1 per cent) predictability of this regression model for another dataset. The standard error of the estimate indicates WLB and Job Experience the goodness of the model. However, the change
The values obtained from the ANOVA test between statistics present a significant difference, by adding the WLB and the job experience are presented in new predictors to the model. The value of the Table 11. This portion of regression analysis Durbin-Watson test (1.715) suggests that the depicts the overall goodness of the model. residuals are unrelated, which satisfies the
requirement of an ideal model. The maximum
Model Sum of Squares df Mean Square F Sig.
1 Regression 17.648 1 17.648 78.786 .000*a
Residual 37.131 166 0.224
Total 54.779 167
Note : a. Predictors: (Constant), No. of Dependentsb. Dependent Variable: Work-Life Balance
* Significant as p < 0.05 at 95 % Level
bTable 9: ANOVA
bTable 10: Model Summary Results of Regression Analysis between WLB and Job Experience
Model R R2
Adjusted
R2
Std. Error of
the Estimate
Change StatisticsDurbin-Watson
Standard Residual
R2 ? F ?
df
1 df2 Sig. F ChangeMaximum
1 0.325a 0.106 0.101 0.52317 0.106 18.241 1 166 0.000* 1.715 1.429
Note : a. Predictors: (Constant), Job Experience b. Dependent Variable: Work-Life Balance* Significant as p < 0.05 at 95 % Level
NICE Journal of Business • Vol. 11 • Nos. 1 & 2 • January - December, 2016 55
Influence of Personal Characteristics on Work-life Balance of Women Employees
NICE Journal of Business • Vol. 11 • Nos. 1 & 2 • January - December, 2016 54
WLB and Employees' Dependents summarised in Table 8. The related correlation, magnitude of influence, size of predictability, etc.
The results of regression analysis between the have also being represented in this table.WLB and the number of dependents are
bTable 11: ANOVA
Model Sum of Squares df Mean Square F Sig.
1 Regression 5.436 1 5.436 18.241 .000*a
Residual 49.614 166 .298
Total 55.050 167
Note : a. Predictors: (Constant), Job Experience
b. Dependent Variable: Work-Life Balance
* Significant as p < 0.05 at 95 % Level
As revealed by the table, the value of F-Ratio is WLB and Commuting Time18.241 and it is significant at the 5 per cent level of
Commuting time is the last personal characteristic significance. It shows the significant influence and
to be tested. Its related model summary with the sound prediction power of our regression model
respected to the WLB is presented in Table 12. based on the job experience for the WLB of women
Furthermore, then correlation status, extent of employees.
influence, size of predictability, etc between these two variable are also shown.
Sugandha Verma and T. S. Tomar

Model R R2
Adjuste
d R2
Std. Error of
the Estimate
Change Statistics
Durbin-
WatsonStandard Residual
R2 ? F ?
df
1 df2 Sig. F ChangeMaximum
1 0.306a .094 0.089 0.56424 0.094 18.890 1 166 0.000* 1.885 1.064
Note: a. Predictors: (Constant), Commuting Timeb. Dependent Variable: Work-Life Balance* Significant as p < 0.05 at 95 % Level
Results of Regression Analysis between WLB and Commuting Time
bTable 12: Model Summary
As shown in the table, the R value is 0.306, which maximum value of the standard residual is 1.064, denotes the medium level of correlation between which is lower than 2.58 and 1.96 (at 1 per cent and
2 5 per cent levels of significance, respectively), the WLB and commuting time. The value of Rproves that our model is good to predict the WLB. (0.094) shows that the commuting time has 9.4 per
2 Thus, the commuting time has an impact of 9.4 cent influence on the WLB. Adjusted R truly percent on the WLB of women employees, with 8.9 represents 0.089 or 8.9 per cent predictability of per cent prediction capacity.this regression model for different sets of data. The
value of the standard error of the estimate shows that our model is an ideal one. The values under the
ANOVA change statistics depict significant difference made
On the basis of the simple linear regression on the addition of new predictors to the model. analysis, the results of analysis of variance Further, the Durbin-Watson test value is 1.885, (ANOVA) are shown in Table 13, which report the which means that the residuals are unrelated. It overall fitness of the model. fulfills the requirement for a good model. The
Model Sum of Squares df Mean Square F Sig.
1 Regression 5.667 1 5.667 18.890 .000*a
Residual 49.891 166 .300
Total 55.558 167
Note: a. Predictors: (Constant), Commuting Timeb. Dependent Variable: Work-Life Balance* Significant as p < 0.05 at 95 % Level
bTable 13: ANOVA (Overall Fitness)
From the table, we note that with the F-Ratio of women employees. 18.890, the significant probability of F (ANOVA) confirms the significant influence of commuting The simple linear regression analysis shows that all time on the WLB. It is also a good predictor of the of the six personal characteristics have significant WLB of women employees in banks. influence on the WLB. So, the first null hypothesis
of the study, namely, the personal characteristics do not impact the WLB of women employees, is
Findings rejected.
The obtained value of the combined mean, calculated to find out the status of the WLB, The Simple linear regression analysis also reveals confirms the medium level of the WLB among that all the personal characteristics are good
NICE Journal of Business • Vol. 11 • Nos. 1 & 2 • January - December, 2016 57
Influence of Personal Characteristics on Work-life Balance of Women Employees
NICE Journal of Business • Vol. 11 • Nos. 1 & 2 • January - December, 2016 56
predictors of the WLB, the dependent variable. such attempts could have substantial benefits for Therefore, the second null hypothesis that the the WLB of working women. This study also personal characteristics do not predict the WLB of reinforces that married women employees need women employees, is also rejected. some unique policy formulation from the bank
authorities. It is hoped that this study should Furthermore, the values of the Durbin Watson Test encourage researchers to apply our approach to (see Tables 2, 4, 6, 8, 10 and 12) are near about 2, other samples, and to adapt, refine, and expand it to and show that the residuals are unrelated. Similarly, increase its existing predictive ability. these tables of model summary also represent the
2 2 much closer values of the Adjusted R and R ,which indicate the very good cross validity of all the six REFERENCESmodels. Additionally, the change statistics shown in Tables 2, 4, 6, 8, 10 and 12 with a significant F? , Agarwal, Parul (2014), “A Study of Work-Life resemble their respective closer value of the Balance with special reference to Indian Call significant F (see Tables 3, 5, 7, 9, 11, and 13). All Centre Employees”, International Journal of these results of the Durbin Watson Test and the Engineering and Management Research, Vol. 4, ANOVA simply put forth the features of good No. 1, pp. 157-164regression models used in the study. The maximum values of the standard residual, shown in Tables 2, Bordens, K.S., and Abbott, B.B. (2011), Research 4, 6, 8, 10, and 12, are less than 2.58 and 1.96 at 1 Design and Methods: A Process Approach (New per cent and 5 per cent levels of significance Delhi: McGraw Hill)respectively. It suggests that all the six regression models based on the personal characteristics are Drago, R., and Kashian, R. (2003), “Mapping the good (Field, 2009). Taken together, our Terrain of Work/Family Journals”, The Journal of observations report that the personal characteristics Family Issues, Vol. 24, No. 4, pp. 488-512significantly influence and predict the WLB of women employees in SCBs. Duxbury, L. and Higgins, C. (2001), Work-Life
Balance in the New Millennium: Where are we? Where do we need to go? (Ottawa: Canadian Policy
CONCLUSION AND POLICY Research Networks Discussion Paper No. w/12)
IMPLICATIONSField, Andy (2009), Discovering Statistics using
The medium level of the WLB status has been SPSS. (London: Sage Publications)found along with the significant influence and predictability of the personal characteristics over Fiksenbaum, L.M. (2014), “Supportive Work-the WLB of women working in SCBs. However, it Family Environments: Implications for Work-is important to note here that the marital status has Family Conflict and Well- Being”, The emerged as the single most significant International Journal of Human Resource characteristic having the highest influence on the Management, Vol. 25, No. 5, pp. 653-672WLB of women employees. The number of dependents, type of family, job experience, Greenhaus, J.H., and Beutell, N.J. (1985), “Sources commuting time and the age are also observed as of Conflict Between Work and Family Roles”, the impacting factors of the WLB. The influencing Academy of Management Review, Vol. 10, Issue 01, magnitude of these variables is noted in the pp. 76-88descending order.
Greenhaus, J.H. and Foley, S. (2007), “The Our study provides important implications for Intersection of Work and Family Lives,” in policy and practice. The average status of the WLB Handbook of Career Studies, eds. H. Gunz and M. among women employees calls for the initiatives to Peiperl. (Thousand Oaks, CA: Sage), pp. 131-152be taken in this direction. The results indicate that
Sugandha Verma and T. S. Tomar

NICE Journal of Business • Vol. 11 • Nos. 1 & 2 • January - December, 2016 58
Haddock, S., Zimmerman, T., Lyness, K. and Nwagbara, U, and Akanji, B.O. (2012), “The Ziemba, S. (2006), “Practices of Dual Earner Impact of Work-Life Balance on the Commitment Couples Successfully Balancing Work and and Motivation of Nigerian Women Employees”, Family,” Journal of Family and Economic Issues, International Journal of Academic Research in Vol. 27, No. 2, pp. 207-234 Business and Social Sciences, Vol. 2, No. 3,
pp. 38-47Hyman, J. and Summers, J. (2004), “Lacking Balance”, Personal Review, Vol. 33, No.4, pp. 418- Satyanarayana, S.V, and Shanker, Sreelakshmi 429 (2012), “Work-Life Balance: Dilemmas of the Modern Society”, The Indian Journal of Kanter, R. M. (1977), Work and Family in the U.S.: Commerce, Vol.65, No.2, pp.71-78A Critical Review and Agenda for Research and Policy (New York: RussellSage Foundation) Spain, D, and Bianchi, S. (1996), Balancing Act:
Motherhood, Marriage and Employment among Kossek, E.E., and Lambert, S.J. (2004), “Work- American Women. (New York: Russel Sage Family Scholarship: Voice and Context,” in Work Foundation)and Life Integration in Organizations: New Directions for Theory and Practice, eds. E.E. Sta ines , G. (1980) , “Spi l lover versus Kossek and S. Lambert. (Mahwah, NJ: Erlbaum) Compensation: A Review of the Literature on the pp. 3-18 Relationship between Work and Non-Work”,
Human Relations, Vol. 33, pp. 111-129Kucharova, V. (2009), “Work-Life Balance: Societal and Private Influences”, Sociologicky Valcour, M. (2007), “Work-Based Resources as casopis / Czech Sociological Review, Vol. 45, No. Moderators of the Relationship between Work 6, pp. 1283-1310 Hours and Satisfaction with Work-Family Balance,” Journal of Applied Psychology, Vol. 92, Mac Ewen, K.E, and Barling, J. (1994), “Daily No.6, pp. 1512-1523Consequences of Work Interference with Family and Family Interference with Work”, Work and Stress, Vol. 8, pp. 244-254
Mathew, R. V, and Panchanatham, N. (2011), “An Exploratory Study on the Work-Life Balance of Women Entrepreneurs in South India”, Asian Academy of Management Journal, Vol. 16, No. 2, pp. 77-105
“I'm convinced that about half of what separates the successful entrepreneurs from the non-successful ones is pure perseverance.”
Steve Jobs
Co-founder, CEO Chairman, Apple Inc.
Sugandha Verma and T. S. Tomar

ROLE OF FINANCIAL CAPITAL AND EXPERIENCE IN WOMEN ENTREPRENEURSHIP AND EMPOWERMENT
A Study of SMEs in Ahmedabad
Gurjeet Kaur* and Stanzin Mantok**
* Associate Professor, Department of Commerce, University of Jammu, Jammu; e- mail: [email protected]** Research Scholar, Department of Commerce, University of Jammu, Jammu; e- mail: [email protected]
Key words: Women entrepreneurship, Financial capital, Experience and expertise, Women empowerment
Abstract
Purpose: The study seeks to examine the role of financial capital and experience in the entrepreneurship and empowerment of women.
Research Methodology: A total of 169 women entrepreneurs were surveyed from amongst small and medium enterprises (SMEs), located in the Ahmedabad city of Gujarat. The statistical tools of confirmatory factor analysis (CFA) and structural equation modelling (SEM)were used for data analysis.
Results: The study has revealed that venture capital, experience and expertise are the major determinants of women entrepreneurship. Psychological empowerment appears to be the outcome of women entrepreneurship in an emerging economy.
Limitations: The study is limited to one city only. Its findings, therefore, cannot be generalised for the entire country.
Originality/Value: The study contributes to the existing research by examining the factors that prompt a woman to become an entrepreneur, which ultimately lead to her empowerment that may be of immense help to inspire women entrepreneurs to start new business venture.
turn, ensure rapid economic development. In spite INTRODUCTIONof the fact that entrepreneurship plays a crucial role in a developing economy, research in entrepreneurship is mainly confined to advanced Entrepreneurship has gained attention of economies, like the United States (Gupta, Turban, researchers during the recent decades due to its Wasti and Sikdar, 2009). This is equally true for the significance as the growth engine for an economy. issues concerning women entrepreneurship, as In a developing economy, l ike India, numerous studies are theorised and experimented entrepreneurship is an indispensible tool for in the context of developed Western countries eradicating poverty and unemployment, which, in

(Welter, Smallbone & Isakova, 2006). encapsulates the issue of women empowerment, i.e., whether entrepreneurial orientation helps in
A developing economy witnesses a slower growth promoting empowerment among women in the of women entrepreneurship as compared to society. developed ones due to the socio-cultural and financial hindrances. Easy access to adequate source of finance is a prerequisite for emergence REVIEW OF LITERATUREand rapid growth of entrepreneurship.
Selected studies on women entrepreneurship, and Entrepreneurship researches have revealed that its antecedents, like financial capital, expertise and financial capital is a must for entrepreneurship (de exper ience, and i ts consequence, l ike Bettignies & Brander, 2007; Kim, Aldrich & empowerment, are reviewed in the following Keister, 2006). Larger financial capital enables paragraphs.entrepreneurs to adopt myriads of strategies to start
and administer their business smoothly (Pena, 2002). Yet, having an access to adequate financial Financial Capital and Women capital is not sufficient to start and operate business Entrepreneurshipventure without sound business acumen and
According to Coleman (2007), financial capital is a expertise in managing an enterprise. Experience, firm's capability in procuring external capital and knowledge and ability are the key factors that comprises of factors that affect the owner's access govern the promotion and development of to raise external capital and his/her willingness to entrepreneurship (Brandstatter, 2011). Prior use it. During the recent decades, women experience is the vital component of an entrepreneur's capability to secure adequate entrepreneurship, which shows the degree of finance has been one of the subject matters of growth of a manager's know-how and capability. entrepreneurial research (Orser, Riding & Manley, 2006). Bygrave, Hay, Ng and Reynolds (2002, p. Women entrepreneurs in emerging economy, like 105) stated the importance of venture capital as, India is found to be actively engaged in collective “Entrepreneurs are the engines that drive new entrepreneurship as a means to secure economic companies, and financing is the fuel that drives and psychological empowerment (Datta & Gailey, them. Hence, financial support, especially equity 2012). The revenue earned by running enterprise finance for starting a company, is an important enables a women entrepreneurs to gain bargaining entrepreneurial framework condition.” Easy access power in family matters, take decisions on their to more financial capital increases the earning own and take personal actions to bring about capacity of the firm (Honig, 1998). In this regard, positive changes in their life (Datta & Gailey, Cetindamar, Gupta, Karadeniz and Egrican (2012) 2012), which consequently empower them assessed the impact of financial capital on psychologically. Although conventionally male are entrepreneurial orientation and found that financial thought to be more entrepreneurial oriented as capital is essential for starting an enterprise. compared to women across the world (Minniti, Women entrepreneurs with easy access to financial Arenius & Langowitz, 2005), but entrepreneurial capital generally find it easy to survive and grow in activities tend to be more among women in market. Entrepreneur's family financial support emerging economies as compared to advanced and business partner's capital help them to grow countries (Bosma & Harding, 2006). their business smoothly. Thus, women entrepreneurs with adequate financial capital have The present study makes three contributions to the good potential to emerge as a successful existing literature. First, it explains how far entrepreneur. availability of financial capital determines
woman's entry into entrepreneurship. Second, it Although the popular media is replete with stories explores the role of entrepreneurial experience and about entrepreneurs who started with negligible expertise possessed by women in starting and financial capital, there seems to be a general running business venture. Last, the study
agreement that entrepreneurship is enhanced by initiatives (Peng, 2001). Though, Lyles and Baird access to more finance (Marlow & Patton, 2005). A (1994) argued that the managerial experience and larger amount of financial capital provides technical know-how learnt previously may not be entrepreneurs with more flexibility to undertake a helpful in a new assignment, as they may become wider array of strategies to start and manage their irrelevant to new role. However, Wiklund and businesses (Pena, 2002). An implicit economic Shepherd (2003) found that highly qualified and assumption in the existing literature is that those experienced entrepreneurs witness growth rate at with sufficient available financial resources have faster pace with growth aspiration. In this regard, better chances of succeeding as an entrepreneur. Manolova, Carter, Manev and Gyoshev (2007) The perceived relationship between financial noted that the growth potential of a woman-owned capital and entrepreneurial success has led firm is substantially affected by the advantages researchers and policy-makers to consider derived from the past experience and the factors availability of loans, angel funding and venture influencing the growth potential of women-owned capital to entrepreneurs as key reasons for the firms differ substantially as compared to those higher rate of entrepreneurial activity in the US, owned by men, due to the unique socialisation compared to many other countries in the world experience of women. Shaver and Scott (1991) (Gupta & York, 2008). In most developing aptly argued that the people who are better able to countries, people are dependent on their income to look for and process the information are more weaken the financial constraints they may confront likely to be successful at opportunity recognition in starting their business (Smallbone & Welter, than other people. 2001).
Entrepreneurship and EmpowermentEntrepreneur's Experience and Expertise
Empowerment of women is one of the most-As a business firm grows, the entrepreneurs gain discussed contemporary issues in social and valuable knowledge in the form of experience and behavioural science. Empowerment is defined as expertise. Education and past experience are the the motivational process of a person's experience of core constituents of a firm's human capital, which feeling empowered (Corsun & Enz, 1999). show the extent of development, managerial know- Empowerment implies granting authority to how and capability (Becker, 1993) and, thus every exercise personal discretion on one's own conduct entrepreneur needs to lay emphasis on acquiring at work place. There seems to be unanimity on the new knowledge and keep updating the existing view that empowerment is a process (Kabeer, knowledge, which, in turn, assists in achieving 2005) rather than a purpose (Akhter & Ward, 2009). desired output level. Researchers have proven that Further, its implication is concerned with less there is a strong significant relationship between empowered individuals (GlenMaye, 1998). Extant the previous work experience in the same industry literature primarily relates empowerment with or business line and the firm's success (Bruderl, women (Elson, 1999; Wieringa, 1994), which Preisendorfer & Ziegler, 1992). Professional pertains to the process and agency in which women entrepreneurs who are well- conversant with are important contributor and actors in the change entrepreneurial skills are likely to spend minimum process (Mehra, 1997). Indeed, “unless the time in matters, like collecting and analysing the intervening processes involve women as agents of information as they are already well-versed with that change rather than merely as its recipients, the industry and institutional infrastructure (Forbes, overall process would not be considered or defined 2005) . Therefore , exper ienced women as empowerment” (Malhotra and Dash, 2013). entrepreneurs have high possibil i ty of C o n g e r a n d K a n u n g o ( 1 9 8 8 ) t e r m e d accomplishment of their entrepreneurial goals. entrepreneurship as the motivational approach of Well-trained and professional entrepreneurs can self-efficacy. Having reviewed pertinent literature, achieve high business growth as a result of better Thomas and Velthouse (1990) advocated that technology, increased professionalism and empowerment is reflected in various form and its legitimacy that accompany their business crux cannot be explained by a mere single concept.
NICE Journal of Business • Vol. 11 • Nos. 1 & 2 • January - December, 2016 61
Role of Financial Capital and Experience in Women Entrepreneurship and Empowerment
NICE Journal of Business • Vol. 11 • Nos. 1 & 2 • January - December, 2016 60
Gurjeet Kaur and Stanzin Mantok

They defined empowerment as enhanced inner expertise of a woman to start a new business motivation reflected through a set of four psychic venture; and expressions in one's perception of his/her work, i.e.,
3. To examine the strategic importance of meaning, competence, self-determination and
entrepreneurial drive in empowering women impact. Kabeer (1999) described empowerment as empowerment in the society.increasing individual's strength to take decisions
especially in the circumstances restricting the exercise of this strength. Field of entrepreneurship
Hypothesesprovides enormous scope to women entrepreneurs for exercising their latent psychological abilities The following hypotheses were formulated for and personal skills to attain life goals. This testing:autonomy in exercising capabilities helps them feel
H : Financial capital has a significant role in 01highly empowered.promoting women entrepreneurship.
Entrepreneurial tendency of an aspiring woman H : The experience and expertise of a woman have 02
entrepreneur enables her to secure psychological significant role in promoting entrepreneurship.autonomy, which helps her to feel empowered.
H : Entrepreneurship leads to empowerment of 03Datta and Gailey (2012) reported that women women.entrepreneurs in developing economies, like, India
actively pursued their career in entrepreneurship to gain financial and social empowerment. Women
RESEARCH METHODOLOGYentrepreneurs witness good results of their being an entrepreneur in social, business and individual life (Ufuk & Ozgen, 2001). Abbasian and Bildt (2009) Sample Design and Data Collectionadvocated that entrepreneurship is perceived as a
In order to test the hypotheses, the data was result oriented profession to secure empowerment collected from 169 registered SMEs women among modern educated women. The entry to entrepreneurs from Ahmedabad (one of the highly e n t r e p r e n e u r s h i p m a k e s w o m e n f e e l industrialised cities of India). The rationale behind psychologically and economically independent, choosing the Ahmedabad city is that the population which subsequently helps them feel empowered. of women entrepreneurs is larger in Ahmedabad as compared to other districts of the state (Census Limited research studies have been conducted on
women entrepreneurship in emerging economies. 2011, Government of India, Gujarat state). A list of Therefore the present study seeks to bridge this gap 574 registered women SME units engaged in by studying the role of financial capital and manufacturing was obtained from the Gujarat experience in promoting women entrepreneurship, Chambers of Commerce and Industry (GCCI- which eventually improves women empowerment. women wing), Ahmedabad. The sample units were Moreover, most of the previous studies are engaged in chemical, dyes and intermediates and qualitative in nature, so there is lack of quantitative hosiery and textiles. A structured questionnaire was study, which shall be addressed by the present developed to gather the required information. study. Based on the five-point Likert scale, a survey
instrument was constructed for gathering requisite data pertaining to the research question.
OBJECTIVES OF THE STUDY
The study has the following objectives:Generation of Scale-items
1. To examine the role of financial capital in The study used four major constructs, viz., women inspiring women to commence business venture;entrepreneurship, experience and expertise,
2. To investigate the role of experience and financial capital and women empowerment, so as to
accomplish the objectives of the study (Table 1). In 1986), self-determination (Hackman & Oldham, order to understand the women entrepreneurship of 1980) and impact (Ashforth, 1989), which SMEs in Ahmedabad, three items each of three comprised three items each. These three dimensions of entrepreneurial orientation, i.e., dimensions are important to determine innovativeness, pro activeness and risk-taking empowerment as they reflect different forms of were adopted (Covin & Slevin, 1989). The study increased inner motivation (Thomas & Velthouse, borrowed eight items to measure experience and 1990). A 5-point Likert scale was used for each item expertise of women entrepreneurs (Bontis, 1998) ranging from 'strongly disagree' (1) to 'strongly while self-developed eight items were used for agree' (5).financial capital. Furthermore, empowerment of women was measured through competence (Jones,
Table 1: Generation of Scale Items
Construct Source
Financial Capital Self developed
Experience and Expertise Bontis (1998)
Women Entrepreneurship Covin and Slevin (1989)
Women EmpowermentJones (1986); Hackman and Oldham (1980) and Ashforth (1989).
Note: Previous literature for item generation.
less than the threshold limit of 0.90 (Pavlou, Liang DATA ANALYSIS AND & Xue, 2006). Thus, these results confirm that the INTERPRETATIONcommon method variance is not a problem in the
The study used two different techniques to analyse present study. the common method variance (Podsakoff, MacKenzie, Lee & Podsakoff, 2003). First,
Descriptive Statisticsconfirmatory factor analysis (CFA) single-factor model was used in which all the manifest variables Table 2 shows the mean, standard deviation and of the latent constructs were loaded onto first-order correlation co-efficient of control variables, viz., CFA and in this regard, the study revealed poor firm's age, firm's size, manager's age and model fit (CMIN/df= 9.85; GFI= .41; AGFI= .32; qualification, and the main variables, viz., women NFI= .15; TLI= .12; CFI=.16; RMSEA=.18). entrepreneurship, financial capital, experience and Second, we examined the correlation matrix of the expertise, and empowerment. latent constructs and found that 0.575 is the greatest value in the correlation matrix (Table 2), which is
Table 2: Mean, Standard Deviation and Correlation Matrix
NICE Journal of Business • Vol. 11 • Nos. 1 & 2 • January - December, 2016 63
Role of Financial Capital and Experience in Women Entrepreneurship and Empowerment
NICE Journal of Business • Vol. 11 • Nos. 1 & 2 • January - December, 2016 62
Gurjeet Kaur and Stanzin Mantok
3.Manager’sAge 52.63 6.62 0.158 0.317
* --
S. No. Variable Mean S.D 1 2 3 4 5 6 7 81. Firm Age 13.64 9.31 --
2. Firm Size 16.13 14.83 --0.317*

As shown in the table, the average age of the firm is Reliability and Validity of the Constructs13.64 years, while that of the manager is 52.63
Alternative way of testing reliability is through years. In addition, the highest correlation exists composite reliability and in the present study; the between women entrepreneurship and their value of composite reliability of all the latent experience and expertise whereas the lowest constructs is above .90, which indicate internal correlation is being observed in case of financial consistency of the data. The dimension-wise capital and experience and expertise. composite reliability, average variance extracted
CFA was performed to assess fitness, reliability and and the Cronbach alpha are shown in Table 3. The validity of latent construct. Fit indices of table reveals that the threshold criterion for measurement model reveal that the Chi-square establishing reliability and validity through AVE, statistics was less than recommended 5.0 level and composite reliability and Cronbach's alpha stands GFI, AGFI, NFI, TLI and CFI values exceeded the fulfilled. recommended value of .90 (Inman, Lair & Green, 2009; Hoe, 2008).
*** Note: S.D= Standard Deviation, n = 169; * p < 0.05; ** p < 0.01; p<0.00 (2-tailed).
Table 3: Reliability and Validity of Latent Constructs
S. No. ConstructsAverageVariance
Extracted
CompositeReliability
Cronbach’sAlpha
1. Financial Capital 0.967 0.994 0.7982. Experience and Expertise 0.946 0.992 0.7763. Women Entrepreneurship 0.992 0.991 0.7904. Women Empowerment 0.992 0.993 0.736
In addition, validity of the scale has been includes convergent validity (Lim & Ployhart, established through construct validity, which 2006) and discriminant validity (Fornell & Larcker,
Table 4: Descriptive Statistics of Measurement Models
Value
1. Financial Capital 0.967 0.994 0.798
Help through bank loan to grow business 3.98 0.862 0.881 4.533
Willing to apply for loans as and when required 4.25 0.809 0.660 --
Confident of acquiring funds 4.23 0.920 0.895 4.552
Earned money making more confident 4.63 0.490 0.472 2.693
Difficulty without financial support from family 4.40 0.632 0.475 2.709
2. Experience and Expertise 0.946 0.992 0.776
Low labour-turnover ratio 3.35 0.975 0.635 2.886
Self-respect 4.05 0.815 0.505 2.513
Cost-effectiveness 3.83 0.844 0.872 --
Higher productivity 4.33 0.694 0.517 2.560
3. Women Entrepreneurship 0.992 0.991 0.790
(a) Innovativeness
Focus on product already tried 4.30 0.464 0.659 3.892
Launching of new product line 4.25 0.439 0.856 4.539
Radical changes in product line 4.05 0.677 0.776 -
(b) Risk-taking
High-risk appetite 4.50 0.506 0.830 5.216
Construct Mean S.D SRW t-AVE CR Value
á-
NICE Journal of Business • Vol. 11 • Nos. 1 & 2 • January - December, 2016 65
Role of Financial Capital and Experience in Women Entrepreneurship and Empowerment
NICE Journal of Business • Vol. 11 • Nos. 1 & 2 • January - December, 2016 64
4. Qualification 3.68 1.16 -0.271 -0.158 0.575** --
5.Women Entrepre-neurship
4.29 0.57 0.008 -.271 0.052 0.009 --
6.Financial Capital 3.88 0.65 -0.103 0.306 0.056 -0.016 0.248 --
7.
Experience
and Expertise
4.36 0.32 0.030 0.007 0.183 0.074 0.285 0.040 --
8.
Women
Empower-
ment4.30 0.45 -0.305 0.019 0.066 0.077 0.266 0.098 0.043 --
1981). average variance extracted and it gets established as majority of factor loadings and average variance
The descriptive statistics of principal constructs of extracted are above .50. the study are shown in Table 4. Convergent validity has been established through factor loading and
Gurjeet Kaur and Stanzin Mantok

Goal-oriented 4.48 0.506 0.761 4.901
Aggressive exploitation of opportunities 4.40 0.591 0.839 -
(c) Proactiveness
Imitativeness in action 4.53 0.506 0.930 2.239
Initiative-oriented 4.53 0.506 0.858 2.291
New product and technology 4.30 0.564 0.372-
4. Women Empowerment 0.992 0.993 0.736
(a) Competence
Self-confidence 4.25 0.494 0.503 --
Self-assurance 4.10 0.841 0.909 4.176
Mastery over work 4.08 0.859 0.952 4.212
(b) Self-determination
Self-autonomous 4.48 0.506 0.795 5.832
Decision-making capability 4.45 0.552 0.864 6.319
Work-freedom 4.50 0.555 0.878 --
(c) Impact
Self-impact on work 4.35 0.770 0.957 --
Control over firm 4.35 0.736 0.904 8.352
Influence over firm’s routine 4.20 0.723 0.503 3.681
Note: S.D= Standard Deviation; SRW= Standard Regression Weight; AVE= Average Variance Extracted; CR= Composite Reliability.
Discriminant validity analysis is estimated to corresponding inter-factor squared correlation examine the degree to which a construct is distinct estimates below the diagonal (Malhotra, 2007). from other constructs (Hair, Black, Babin, Thus, discriminant validity gets established, Anderson & Tatham, 2009). thereby implying that major constructs are unique.
Table 5 shows that each explained variance estimate on the diagonal is greater than the
Table 5: Discriminant Validity of Latent Constructs
Hypothesis Testing through Structural and expertise and women entrepreneurship as well as the link between women entrepreneurship and Equation Modelling (SEM)empowerment. The proposed three relationships turn out to be significant, thereby indicating that We examined all hypotheses using the SEM, as study hypotheses stand accepted.shown in Figure 1. The figure shows the
relationship between financial capital, experience
Figure 1: Structural Model of Financial Capital, Experience and Expertise inPromoting
Women Entrepreneurship and Empowerment
â=0.329.030
â=0.346.021
â=0.407.005
FinancialCapital
Experience andExpertise
WomenEntrepreneurship
WomenEmpowerment
The SEM results reveal that the financial capital empowerment (â=0.346, t=2.306, p=0.021). Thus, (â=0.329, t=2.174, p=0.030), and experience and women empowerment is the resultant outcome of expertise (â=0.407, t=2.798, p=0.005) are the women entrepreneurship, which leads to the signif icant factors determining women acceptance of H . o3
entrepreneurship. It leads to the acceptance of H o1
Table 6 represents the results of the proposed and H . Moreover, women entrepreneurship is o2
relationships.positively and significantly related to women
S.No. AVEFinancial Capital
Experienceand Expertise
WomenEntrepreneurship
WomenEmpowerment
1. Financial Capital (0.967)
2.Experience and Expertise 0.0125 (0.946)
3.Women Entrepreneurship
0.0056 0.0077 (0.992)
4.Women Empowerment 0.0062 0.3010 0.2471 (0.992)
Note: Average Variance Extracted (AVE) on the diagonal and squared multiple correlation between constructs below the diagonal.
NICE Journal of Business • Vol. 11 • Nos. 1 & 2 • January - December, 2016 67
Role of Financial Capital and Experience in Women Entrepreneurship and Empowerment
NICE Journal of Business • Vol. 11 • Nos. 1 & 2 • January - December, 2016 66
Gurjeet Kaur and Stanzin Mantok

Relationships SRW t-Value 'p'
Financial Capital ? Women Entrepreneurship 0.329 2.174 0.030
Experience and Expertise ? Women Entrepreneurship
0.407 2.798 0.005
Women Entrepreneurship ? Women Empowerment
0.346 2.306 0.021
Table 6: Results of Structural Equation Model
Note: SRW= Standardised Regression Weight
Policy Implications while extending financial assistance. Moreover, the concept of interest subvention has to be introduced
The study contributes to the relevant literature in by government agencies to persuade young women
two different ways; First, most of the existing entrepreneurs to avail loan facilities from financial
studies on women entrepreneurship primarily institutions. Traditionally, woman is seen as house
focused on identification of problems being faced maker in Indian society but this social barrier is
by women entrepreneurs and finding their solution, weakening in the recent past decades and women
but we moved a step further by exploring the latent are assuming versatile role in every walks of life.
factors that prompt a woman to become an entrepreneur and resultant outcome of starting a business unit. Secondly, the present study examines CONCLUSIONhow entrepreneurial orientation of a woman
The purpose of the study is to examine the factors enables her to achieve sense of empowerment. The determining women entrepreneurship and its findings of the study shall facilitate government consequences in an emerging economy context like agencies to devise appropriate programmes and India. The study found that financial capital and policies for encouraging and promoting women entrepreneur's experience and expertise play entrepreneurship in a country.i m p o r t a n t r o l e i n p r o m o t i n g w o m e n
The results of the study have certain inferences, entrepreneurship. This result is consistent with the which need proper attention of government, previous studies like Coleman (2007) and academicians, policy makers and society at large. Cetindamar et al. (2012). In any society, becoming Though women belonging to business family in an entrepreneur is considered as an uphill task, as it Gujarat enjoy easy social acknowledgement of involves accumulation of social support, being an entrepreneur, yet first generation women procurement of sound human resources, raising entrepreneurs need special care and social adequate financial capital and above all, making acceptance of society to encourage budding young things happen in most desired way. Easy entrepreneurs. Policy-makers are required to availability of all these resources and competency introduce appropriate schemes or programmes so to manage these limited resources in a resource as to encourage more and more young women to constraint environment facilitate prospective embark upon becoming a successful entrepreneur. women entrepreneurs to start her venture Financial institutions and friends are found to be successfully. We found that conducive social reluctant in providing financial aid to newly created atmosphere in Gujarat helps many women to start women owned firms. Hence, it is the need of the their business unit successfully. hour that various financial institutions accord equal consideration without any gender discrimination
In addition, we found that empowerment is the
consequence of women entrepreneurship. This Entrepreneurship Development, 6(3/4), 7-20result finds support from the previous study
Akhter, R., & Ward, K. B. (2009) Globalization and conducted by Datta and Gailey (2012). Gender Equality: A critical analysis of women's Independence and flexibility in working hours aid empowerment in the global economy. Advances in experiencing certain intrinsic feeling of Gender Research, 13, 141-173empowerment among women entrepreneurs
because they feel psychologically empowered to Ashforth, B. E. (1989) The Experience of convert their business ideas into a successful powerlessness in organisations, Organisational business unit. Moreover, their inclination towards Behaviour and Human Decision Processes, 43(2), entrepreneurship enables them to perform excellent 207-242in their chosen career, which gets reflected in the
performance of their firm. Bontis, N. (1998), Intellectual Capital: An Exploratory study that develops measures and models. Management Decision, 36(2), 63-76Limitations and Future Research
Our study suffers from certain limitations. Firstly, Bosma, N., & Harding, R. (2006), Global we considered only a few factors as determinants of entrepreneurship monitor, Wellesley/London: women entrepreneurship but there are other factors Babson College/London Business School, Global like social capital and psychological factors, which Entrepreneurship Research Consortium.may also serve as strong predictors of women
Brandstatter, H. (2011) Personality aspects of entrepreneurship. Secondly, the data was collected entrepreneurship: A look at five meta-analyses. from the Ahmedabad city in Gujarat state, where Personality and Individual Differences, 51(3), 222-business- friendly social environment inspires 230.prospective women entrepreneurs to choose
entrepreneurship as their career but the Bruderl, J., Preisendorfer, P., & Ziegler, R. (1992), generalisation of the results need to be examined in Survival chances of newly founded business other environmental context. Finally, we examined organizations, American Sociological Review, only empowerment as one of the outcomes of 57(2), 227-242women entrepreneurship, but there may be other
outcomes, like satisfaction and financial Bygrave, W. D., Hay, M., Ng, E., & Reynolds, P.
performance of women entrepreneurs. (2002), A study of investing in 29 nations composing the global entrepreneurship monitor, The study can emerge as a good source for P r e s e n t e d a t t h e B a b s o n - K a u f f m a n exploring the prospective factors, which might Entrepreneurship Research Conference, Boulderhave bearing on the promotion and development of
women entrepreneurship. Future research can Cetindamar, D., Gupta, V. K., Karadeniz, E. E., &
verify the results of this study in other Egrican, N. (2012) What the numbers tell: The
environmental and cultural context. A study can impact of human, family and financial capital on also be conducted to examine various facets of women and men's entry into entrepreneurship in women entrepreneurship in the service sector. Turkey, Entrepreneurship and Regional
Development, 24(1-2), 29-51.
Conger, J. A., & Kanungo, R. N. (1988), The REFERENCESEmpowerment process: Integrating theory and practice. Academy of Management Review, 13(3), Abbasian, S., & Bildt, C. (2009) Empowerment 471-48through entrepreneurship: A tool for integration
among immigrant women, IUP Journal of
NICE Journal of Business • Vol. 11 • Nos. 1 & 2 • January - December, 2016 69
Role of Financial Capital and Experience in Women Entrepreneurship and Empowerment
NICE Journal of Business • Vol. 11 • Nos. 1 & 2 • January - December, 2016 68
Gurjeet Kaur and Stanzin Mantok

Corsun, D. L., & Enz, C. A. (1999), Predicting and Practice, 33(2), 397-417psychological Empowerment among Service
Hackman, J. R., & Oldham, G. R. (1980), Work workers: The effect of support-based relationships, Redesign, Reading, MA: Addison-WesleyHuman Relations, 52(2), 205-224
Hair, J. F., William, C. B., Barry, J. B., Rolph, E. A., Covin, J. G., & Slevin, D. P. (1989), Strategic & Ronald, L. T. (2009) Multivariate Data Analysis, management of small firms in hostile and benign 6th ed. New Delhi: Pearson Educationenvironment, Strategic Management Journal,
10(1), 75-87Hoe, S. L. (2008), Issues and procedure in adopting structural equation modelling technique, Journal of Datta, P. B., & Gailey, R. (2012), Empowering Applied Quantitative Method, 3(1), 76-83 women through social entrepreneurship: Case
study of a Women's cooperative in India. Honig, B. (1998), What determines success? Entrepreneurship Theory and Practice, 36(3), 569-Examining the human, financial, and social capital 587of Jamaican micro entrepreneurs, Journal of
De Bettignies, J. E., & Brander, J. A. (2007), Business Venturing, 13(5), 371-394Financing Entrepreneurship: Bank finance versus Venture Capital, Journal of Business Venturing, Inman, R. A., Lair S. M., & Green J. K.W. (2009), 22(6), 808-832 Analysis of the relationships among TOC use, TOC
outcomes, and organizational performance, Elson, D. (1999), Labour Markets as gendered International Journal of Operations & Production institutions: Equality, efficiency and empowerment Management, 29(4), 341-356issues, World Development, 27(3), 611-627
Jones, G. R. (1986), Socialisation tactics, self-Forbes, D. P. (2005), Are some entrepreneurs more efficacy, and newcomers' adjustments to overconfident than others?, Journal of Business organisations, Academy of Management Journal, Venturing, 20(5), 623-640 29(2), 262-279
Fornell, C., & Larcker, D. F. (1981), Evaluating Kabeer, N. (1999), Resources, agency, structural equation models with unobservable achievements: Reflections on the measurement of variables and measurement error, Journal of women's empowerment, Development and Marketing Research, 18, 39-50. Change, 30(3), 435-464
Glen Maye, L. (1998), Empowerment of Women, Kabeer, N. (2005), Gender equality and women's Empowerment in Social Work Practice: A empowerment: A critical analysis of the third Sourcebook, Pacific Grove, CA: Brooks/Cole, 29- millennium development goal, Gender and 51 Development, 13(1), 13-24
Gupta, V. K., & York, A. S. (2008), The Effects of Kim, P. H., Aldrich, H. E., & Keister, L. A. (2006), geography and age on women's attitudes towards Access (not) denied: the impact of financial, entrepreneurship: Evidence from the state of human, and cultural capital on entrepreneurial N e b r a s k a . I n t e r n a t i o n a l J o u r n a l o f entry in the United States, Small Business Entrepreneurship and Innovation, 9(4), 251-262 Economics, 27(1), 5-22
Lim, B. C., & Ployhart, R. E. (2006), Assessing the Gupta, V. K., Turban, D. B., Wasti, S. A., & Sikdar, convergent and discriminant validity of Goldberg's A. (2009), The role of gender stereotypes in international personality item pool: A multi-trait perceptions of entrepreneurs and intentions to multi-method examination, Organizational become an entrepreneur, Entrepreneurship Theory Research Methods, 9(1), 29-54
perspective, MIS Quarterly, 31(1), 105-136Lyles, M. A., & Baird, I. S. (1994). Performance of international joint ventures in two Eastern Pena, I. (2002), Intellectual Capital and Business European countries: The case of Hungary and start-up success, Journal of Intellectual Capital, Poland. MIR: Management International Review, 3(2), 180-19834(4), 313-329
Peng, M. W. (2001), How entrepreneurs create Malhotra, N. K. (2002), Integrating technology in wealth in transition economies?, Academy of marketing education: Perspective for the new Management Executive, 15(1), 95-108millennium, Marketing Education Review, 12(3),
Podsakoff, P. M., MacKenzie, S. B., Lee, J. Y., & 1-5Podsakoff, N. P. (2003), Common method biases in behavioural research: A critical review of the Malhotra, N. K., and Satya Bhushan Das (2013), literature and recommended remedies, Journal of Marketing Research: An Applied Orientation. New Applied Psychology, 88(5), 879-903Delhi: Pearson Education
Scott, J. W. (1991), The Evidence of Experience, Manolova, T. S., Carter, N. M., Manev, I. M., & Critical Inquiry, 17(4), 773-797Gyoshev, B. S. (2007), The Differential effect of
Men and Women Entrepreneurs' human capital and Smallbone, D., & Welter, F. (2001), The networking on growth expectancies in Bulgaria, distinctiveness of Entrepreneurship in transition Entrepreneurship Theory and Practice, 31(3), 407-Economies, Small Business Economics, 16(4), 426249-262
Marlow, S. C., & Patton, D. (2005), The financing Thomas, K. W., & Velthouse, B. A. (1990), of small businesses: Female experiences and Cognitive elements of Empowerment: An strategies. International Handbook of Women and “Interpretive” Model of intrinsic task motivation, Small Business Entrepreneurship, London: Academy of Management Review, 15(4), 666-681Edward Elgar Publishing Ltd. 66-77
Ufuk, H., & Ozgen, O. (2001), Interaction between Mehra, R. (1997), Women Empowerment and the business and family lives of women Economic Development, The Annals of the entrepreneurs in Turkey, Journal of Business American Academy of Political and Social Science, Ethics, 31(2), 95-106554, 136-149
Welter, F., Smallbone, D., & Isakova, N. B. (2006), Minniti, M., Arenius, P., & Langowitz, N. (2005), Enterprising Women in Transition Economies, Global Entrepreneurship Monitor 2004: Report on (Eds), Aldershot U.K: Ashgate Publishing, Ltd.Women and Entrepreneurship, Babson College and
London business school, Gains from public-private Wieringa, S. (1994), Women's interests and collaborations to improve community health. empowerment: Gender planning reconsidered, Journal of Healthcare Management, 43(6), 498-Development and Change, 25(4), 829-848510
Wiklund, J., & Shepherd, D. (2003), Knowledge-Orser, B. J., Riding, A. L., & Manley, K. (2006), based resources, entrepreneurial orientation, and Women Entrepreneurs and Financial Capital, the performance of small and medium-sized Entrepreneurship Theory and Practice, 30(5), 643-businesses, Strategic Management Journal, 66524(13), 1307-1314
Pavlou, P. A., Liang, H., & Xue, Y. (2006), Understanding and mitigating Uncertainty in
Online Environments: A Principal-agent
NICE Journal of Business • Vol. 11 • Nos. 1 & 2 • January - December, 2016 71
Role of Financial Capital and Experience in Women Entrepreneurship and Empowerment
NICE Journal of Business • Vol. 11 • Nos. 1 & 2 • January - December, 2016 70
Gurjeet Kaur and Stanzin Mantok

In the last issue of our journal, we raised a matter of public concern, namely the menace of plagiarism, which is widespread and going unabated. We often receive articles for publication which are either partly or fully copied from others’ works, despite the author having given a declaration to the effect that the article is original and an exclusive contribution to our journal, and having submitted a certificate of cessation of copyright in our favour. The dare-devilry is shocking! This is outright deceit and cheating. Amusingly, the practice is not confined to Indian authors; foreign authors are no exception.
This time again, we came across two such cases, one each from Indian and foreign authors. The articles could have gone into print, but for the alacrity and the incisive eye of our referees.
We have been facing another problem of somewhat similar nature, involving professional ethics. We spend a lot of efforts, time, and money in reviewing, short listing, and editing of each article which passes the preliminary scrutiny. When asked to make further revision or supply the missing information, some of the authors stop communicating with us and submit the paper improved through our efforts to some other journal. They do so despite the fact that they have submitted a declaration that the paper is original and an exclusive contribution to our journal, and shall not be withdrawn at a subsequent stage, unless rejected/permitted by the Editor, and have ceded the copyright in our favour.
It needs no emphasis that plagiarism is not only an unethical practice, particularly so for an academician, it is also a violation of the code of conduct governing the services of University teachers, but also amounts to a criminal offence, under the Copyright Act, 1957 (which certainly does not grant us a ‘right to copy!’). Any infringement of copyright under the Act is an offence, punishable with imprisonment for a minimum period of six months, extendable up to three years, and a fine, ranging from Rs. 50,000 to Rs 2 lakhs.
It is worthwhile to caution such unscrupulous people. Many people have already faced disciplinary action leading to their dismissal from service. These include teachers at all levels – lecturers, associate professors, professors (including one in a top Central university, one in a top IIM, and one in a State university), and one Vice-Chancellor of a State university. Recently, a Vice-Chancellor of a reputed central university had to face imprisonment.
Writing an article is a demanding as well as a rewarding task. Those looking for an unearned reward are surely inviting trouble.
- Editor
MENACE OF PLAGIARISM

CONSUMER PERCEPTION OF VARIOUS ATTRIBUTESOF MODERN RETAIL STORES
Shamsher Singh*
* Professor & Officiating Director, Banarsidas Chandiwala Institute of Professional Studies, Dwarka, New Delhi; e-mail: [email protected]
Key words: Consumer perception, Store attributes, Modern retail store, Traditional store
Abstract
Purpose: The study was conducted to explore how attributes of a retail store influence consumers' perception and how demographic factors affect the operation of such store. The price, product, variety, in-store services, shopping convenience and the store ambience were the attributes selected for the study.
Methodology: The study is based on both secondary and primary data. While the secondary data was used to gain an in-depth knowledge of the retail sector, the primary data was collected to measure the consumer perception. The sample consisted of 100 customers. The questionnaire was administered, personally, at selected shopping malls in different parts of the metropolitan city of Delhi. The data was analysed, using the frequency analysis, ANOVA, and the t-test.
Findings: A modern retail store is preferred by consumers due to the availability of a variety of brands and better quality perceived by them. The consumer visits such a store not only for shopping but also for entertainment. Trained and supportive staff and pleasant ambience also influence the consumer preference for such a retail store.
Limitations: The findings can be generalised only for the urban areas as the geographical area was of the study limited to the metroploitan city of Delhi.
Value/Contribution: The study brings out useful information for the decision-makers of retail stores, so that they can improve their marketing efforts and boost their sales.
for over 10 per cent of the country's Gross INTRODUCTIONDomestic Product (GDP) and provides employment to around 8 per cent of the population. The retail industry has emerged as one of the most India is the world's fifth-largest global destination
dynamic and fast-paced industries in India, in the retail space. Its retail market is expected to prompting the entry of several players. It accounts increase to US$ 1 trillion by 2020 from US$ 600

NICE Journal of Business • Vol. 11 • Nos. 1 & 2 • January - December, 2016 75
Consumer Perception of Various Attributes of Modern Retail Stores
NICE Journal of Business • Vol. 11 • Nos. 1 & 2 • January - December, 2016 74
billion in 2015(IBEF, 2016). There has been a service store where customer picks and chooses significant development in the past decade in the his product and brings to the billing section and retail industry, which includes transformation of takes the delivery after making payment. It is traditional small stores, usually owned by family larger in size than the traditional grocery store members, into modern retail shopping centres. The and has a wide variety of products. liberalisation of the Indian economy, in 1991, considerably facilitated this transformation. A 4. Specialty Store: Such a store is set up for number of manufactures and big business houses specialised products or services and items ventured out to set up retail chains across the associated with those products or services and country. According to India Retail Market View carry a large stock. Wedding malls and gold (2013), organised retail in India witnessed 78 per store are the examples of such stores (Sinha, and cent growth over the total mall supply from 2.5 Kar, 2007, Kotler and Keller, 2016).million square feet, in 2012, to 4.7 million square feet, in 2013. According to the Department of
Major Organised Retailers in IndiaIndustrial Policy and Promotion of the Government of India, the FDI inflow has been US$ 537.61
1. Future Group: Pantaloons was the first retail million during April 2000–March 2016 (IBEF, outlet launched by Future Group. Future Group 2016)operates more than 450 stores across India. 'Big Bazaar' is another retail chain launched by the Global retail giants are keen to enter India because Future Group.of a growing middle-class and an untapped retail
industry. Delhi and its suburbs have emerged as 2. Tata Group: Tata established its subsidiary, front runner for organised retail stores. Moreover,
Trent, in 1998. It also operates Star India Bazaar, 1000 malls were at the development stage in Westside, and Landmark. Trent is also in talks smaller towns. Rise in the Consumers' purchasing with global retail players for joint operations.power, coupled with availability of land makes
these towns attractive destination for retail stores. It 3. RPG Group: They operate Food World stores has also been noted that the consumer tastes and
and 'Health and Glow'. They were the early preferences are changing in tune with the global entrants in retail trade, focusing on food and preferences, lifestyles, and spending patterns. grocery retailing, since 1996.
Modern Retail Formats 4. Reliance Group: This group operates Reliance Fresh stores and Reliance Mart and has more
1. Shopping Mall: A shopping mall has a number than 300 stores, viz., both the stores have created of retail outlets having a built up area of around their own niche in the Indian retail market. 60,000 sq. ft. to 7, 00,000 sq. ft., where the Reliance retail is the first store in India to cross customers can easily move from one shop to Rs 10,000 crore turnover (Business Line 2013).another . They have all kinds of retail outlets, ranging from grocery, apparel, FMCG, food 5. AV Birla Group: This group has created Peter court and Cineplex (Sinha and Kar, 2007) England, Louis Philippe Allen Solly and Van
Heusen. These are the leading stores in the 2. Department Store: It is usually a large store Indian apparel retailing.
divided in to departments on the basis of a range of products, including electronics, furniture,
REVIEW OF LITERATUREapparel, electrical appliances, and sports goods.
Satish and Raju (2010) found that the major Indian 3. Hypermarket/Supermarket: It is mainly a self-
.
retailers, including Future Group and Reliance revolution, establishment of supermarkets, Group, have played the leading role in the shopping mall and departmental stores has lead to development of the retail sector in India. It was boom in retails industry. The study by Satish and noted that almost all the top retailers were working Raju (2010), also point out in the similar direction on their expansion plans. This includes retailers, and it is expected that theoverall development of such as Reliance Retail, Shoppers’ Stop, Pantaloon the economy would further accelerate the growth of (Talwar, 2010). India is expanding internationally retail industry. Rahman (2012) remarked that the due to the challenges faced by international retail bazaar in India was booming beyond retailers in their own countries (Halepete, et al. everyone's expectation. (2008). This is the reason why Wal-Mart had partnership with Bharti Airtel. Aggarwal (2008) noted that retailing had assumed
the status of an industry and was no longer Bhatnagar (2015) explored the journey of the considered a distribution function. He found that Indian retailing from the unorganised to the organised retailing has immensely contributed to organised retailing. The author noted that the retail the economic development of India. Murugavel sector witnessed a rapid growth in the organised (2011) observed that the retail has been one of the sector with the entry of corporate groups, such as fastest growing industries in India over the last Tata, RPG, ITC, and Bennett Coleman & couple of years. Company. The whole concept of shopping has transformed in terms of layout and consumer
Studies on Consumer Perception of Retail buying behaviour, ushering in an uprising in Storesshopping. Modern retail is seen as swanky The market share of traditional retail stores has shopping centres, multi-storied malls and huge decreased, whereas the share of modern retail complexes offer shopping, entertainment and food, outlets has witnessed expansion due to the all under one roof. It was also found that the social changing consumer preference and the rise in the changes, such as the increase in the number of consumers' economic ability (Hino, 2010). The nuclear families and working couples, resulting in shopping experience includes the availability of a increased purchasing power, also contributed to the wide range of products, discounts, globally-increase in the Indian consumers' personal recognised brands, and theaters with multiple consumption. Joshi et al.(2015) also had similar screens for entertainment as well as food outlets to findings and reinforced the study of Bhatnagar satisfy their hunger. Consumers in different (2015).counties have varied type of taste and preferences. The US consumers expect high level of services The global consultancy firm, Cushman & and merchandise quality (Swinyard, 1997).Wakefield, in their India Retail Report (2014) ,
projected that the approximately 14 million square feet (m.s.f.) of fresh retail space was added by the
Gupta (2007) studied the changing consumer end of 2014 in the top eight cities of India. This
perception in India and found that a variety of addition in the retail space is 200 per cent more than
products and their availability have a strong and the 4.6 m.s.f space which was added in 2013.
positive impact on their consumption. He also Majority of it (approximately 60% or 8.2 m.s.f of
found that consumers have shifted their preference mall space) was created in NCR, whereas 2.86
to the shopping malls. Several studies highlighted m.s.f. was added in Bengaluru (India Retail Report,
the demographic dividends, such as 55 per cent 2014).
India's population is under the age of 20, increase in the earning members of a family, growing middle
India Retail Report (2009) focused on the various class leading to higher consumption and
drivers of the growth of retail industry in India and contributing growth in organised retailing in India.
found that friendly investment climate, retail
Shamsher Singh

NICE Journal of Business • Vol. 11 • Nos. 1 & 2 • January - December, 2016 77
Consumer Perception of Various Attributes of Modern Retail Stores
NICE Journal of Business • Vol. 11 • Nos. 1 & 2 • January - December, 2016 76
(CII, 2008; and Ghosh et al., 2010) and better-quality products are available in Indian market. This has also been realised by global player and they considered India as the most favoured Luceri and Latusi (2016) investigated the cross-retail destination (Jasola 2007).format shopping behaviour in the apparel sector.
They found that the socio-demographic characteristics-age, gender, employment status and
Demographic Trends in India the citizenship-have an impact on the multi-store format patronage patterns for apparel purchases. In India, not only there are dual career families but Moreover, the store format preference and the sale also multiple earning members in the family. This proneness proved to be the additional determinants has resulted in increasing income levels of family of cross-format mobility. Kesar and Sharma (2015) and high disposable income which is responsible noted that consumers showed preference for for the growing middle-class and the emergence of modern multi-brand retail stores as compared to consuming class (Goyal and Aggarwal, 2009; and traditional 'kiryana' stores. Ali and Kapoor, 2010). This has led to the
development and growth of retail industry. Food Nagar, et al. (2015) sought to explore the consumer and grocery, apparel, consumer durables, jewelry, behavioural changes while purchasing grocery and and health and beauty are the segments of retail food products. They found that their decision to which have emerged as growth-driver (Shukla and purchase grocery and food products, either from an Jain, 2007).organised retail outlet or from an un-organised retail market, depended on the patronage Lalitha (2015) found that the growth in the Indian behaviour, which is influenced by various other organised retail market is mainly due to change in factors. The factors identified were categorised on the consumer behaviour. This change has come due antecedents, socialisation, mental and behavioural to increased income, changing lifestyles, and outcomes and retail outlets that have a good and patterns of demography, which are favourable to pleasant environment for shoppers. retail industry. Choudhary (2015) investigated the
impulse buying behaviour of the shoppers in Kolkata when they visited shopping malls or retail Studies on Scope of Organised Retailing in Indiaoutlets. He found that the demographics (age,
Various studies have revealed a vast scope of income and gender) had impact on impulse buying. organised retailing in India. Aggarwal (2008), and Mariyappa (2014) examined the consumers' Bhardwaj and Makkar (2007) have noted that there shopping behaviour in different retail outlets in was a positive impact of retail industry on the Bangalore and found that there was tremendous Indian economy. The benefits highlighted by them potential for hyper-markets and super-markets in included employment generation, growth of real Bangalore.estate, and development of retail ancillary market. The change in the preferences of consumers has Mathur et. al.(2013) found demographic factors, forced Indian retail chains to bring modern retail like income and occupation, to be the major formats. Gupta (2007) examined the changing influencers, having major influence on consumer consumer behaviour and found positive impact on buying behaviour. They also found that that family their consumption due to availability of a variety of was the main influencer in country, like India, products. where the joint family system was an important
societal feature. Prasad (2012) found that in the A number of other studies have re-enforced the fast-changing face of organised retailing, earlier findings that the modern Indian consumers especially in the apparel shopping was more a have many options for shopping. They can choose matter of non-fun mundane, but an exciting and from the local shopkeeper, supermarket, entertainment activity. departmental store, or a mall. All kinds of the latest
decade. A number of business organisations, such as Reliance, Tata, Birla, and Future group, have Preferences for Modern Retail Formatsdiversified their business to include retailing in
Why consumers choose shopping malls over their business. That is why a number of shopping traditional market stores? Different studies have malls have come in almost all parts of NCR-Delhi. tried to find the answer. The studies of Thang et al. The findings of the study can be utilised by modern (2003) and Dalwadi et al. (2010) revealed that there retail stores to influence the customers perception were various factors, such as in-store services, towards them.ambience of the mall, range of products, attractive promotion schemes. These facilities drive the consumers towards the malls rather than the local OBJECTIVES OF THE STUDY shops. Consumer finds it more convenient and
The study was undertaken to measure the time-saving to shop at one place instead of going to consumers' perception of modern retail stores and different markets at different location across cities. their attributes and to examine the influence of The study of Jackson et al (2011) also supported demographic factors on the operation of these these findings. stores.
Numerous authors have tried to identify the key differentiator which consumers care while making Hypotheses:a choice in the type of retail formats where they would go for shopping. They have identified the The following hypotheses were formulated for following factors: the quality of merchandise, testing: advertising, assortment of merchandise, convenience services, store reputation, H There is no significant difference in the 01
merchandise-mix, technology-based operations, perception of male and female consumers in value-added services and the store layout. (Mittal respect of the attributes of modern retail store.and Mittal (2008), Gupta (2007) , Lather et al.
H : There is no significant difference in the 02(2006), Jain and Bagdare (2009), Jacobs et al. perception of consumers in respect of attributes of (2010), and Ghosh and Tripathi (2010).the store across different age groups.
Singh (2007) found that the urban respondents had H : There is no significant difference in the 03
higher degree of brand awareness of various food perception of consumers in respect of attributes of products as compared to the rural respondents. This the store across educational level.is further emphasised in the study of Kaur et.al (2007). Supermarkets are generally preferred by H : There is no significant difference in the 04professional consumers whereas less educated perception of consumers in respect of attributes of consumers prefer discount store. The households the store across occupations. with small children, engaged in professional
H : There is no significant difference in the activities, generally preferred shopping at 05
perception of consumers in respect of attributes of hypermarkets (Benito et. al. 2006). the store across income groups.
H : There is no significant difference in the 06Rationale of the Studyconsumers perception of prices of products in the
There is no specific study which targets the modern stores and neighbourhood stores. metropolitan consumers in the changing
H : There is no significant difference in the 07demographic scenario of urban areas. NCR of consumers perception of services and facilities Delhi has witnessed the rapid growth in the offered in the modern stores and neighbourhood organised retail-sector, especially in the last
:
Shamsher Singh
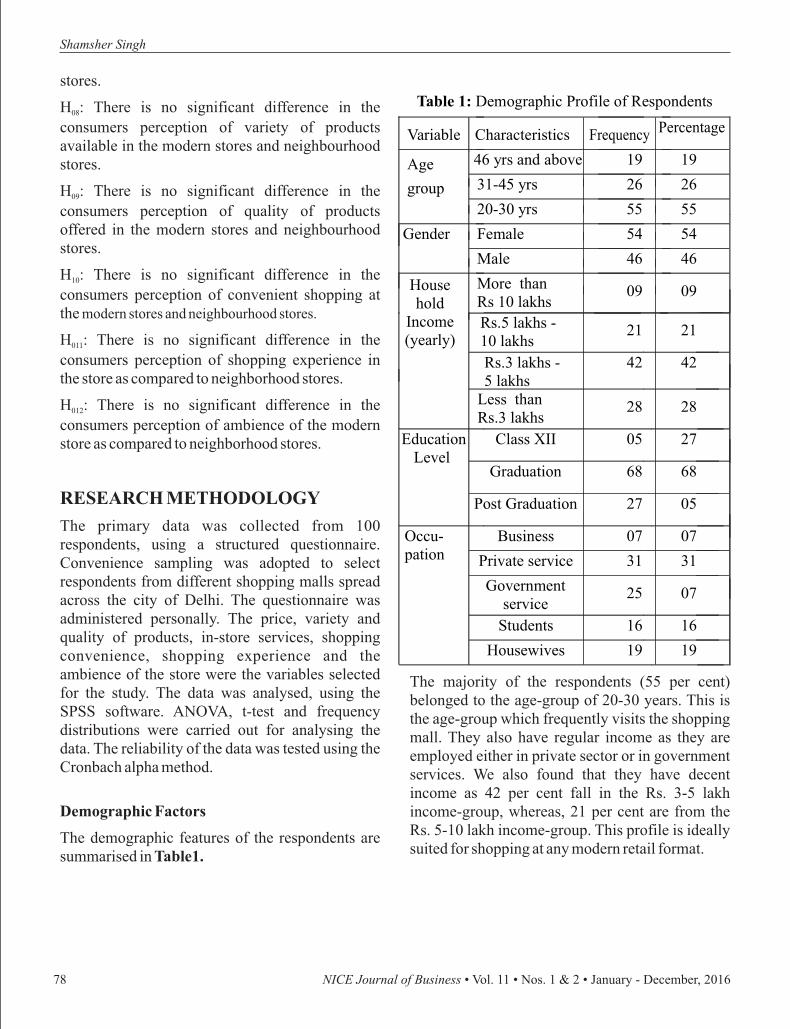
DATA ANALYSIS AND INTERPRETATION
Reliability Analysis The test score of 0.899 suggests good internal
Reliability is the indicator of internal consistency consistency.of the data. It can be measured by different scales.
Hypothesis Testing However, most of the researchers use Cronbach's alpha scale. The score of 1 indicates 100 per cent ANOVA Computation for Genderreliability, which is generally not found. Hence a
In order to test the hypothesis ANOVA and t-test score of 0.7 or above was considered as a reliable were carried out. The summary of ANOVA score (Nunnaly's (1978). The Cronbach Alpha computations on the basis of the respondents' score is given in Table 2. gender is given in Table 3.
Table 3: Computation of ANOVA on the basis of Gender
Sum ofSquares df Mean Square F Sig.
Product price 0.004 1 0.004 0.004 0.950Services and
facilities3.275 1 3.275 2.815 0.097
Large varietyof products
5.159 1 5.159 4.427 0.038
Good qualityof products
3.726 1 3.726 3.918 0.051
Convenientshopping
1.072 1 1.072 0.892 0.347
Goodshoppingexperience
3.588 1 3.588 3.398 0.068
Ambience ofstore
2.145 1 2.145 2.176 0.143
As shown in the table, there is no significant have similar perception of store attributes.difference in the perception of male and female
ANOVA Computation for Agerespondents in respect of the attributes of a modern retail store, except for the variety of products. The ANOVA computations on the basis of the age Hence, we accept the null hypothesis H . This 01 of the respondent are given in Table 4.indicates that both the male and female customers
NICE Journal of Business • Vol. 11 • Nos. 1 & 2 • January - December, 2016 79
Consumer Perception of Various Attributes of Modern Retail Stores
NICE Journal of Business • Vol. 11 • Nos. 1 & 2 • January - December, 2016 78
stores.
H There is no significant difference in the 08
consumers perception of variety of products available in the modern stores and neighbourhood stores.
H : There is no significant difference in the 09
consumers perception of quality of products offered in the modern stores and neighbourhood stores.
H : There is no significant difference in the 10
consumers perception of convenient shopping at the modern stores and neighbourhood stores.
H : There is no significant difference in the 011
consumers perception of shopping experience in the store as compared to neighborhood stores.
H : There is no significant difference in the 012
consumers perception of ambience of the modern store as compared to neighborhood stores.
RESEARCH METHODOLOGY
The primary data was collected from 100 respondents, using a structured questionnaire. Convenience sampling was adopted to select respondents from different shopping malls spread across the city of Delhi. The questionnaire was administered personally. The price, variety and quality of products, in-store services, shopping convenience, shopping experience and the ambience of the store were the variables selected The majority of the respondents (55 per cent) for the study. The data was analysed, using the belonged to the age-group of 20-30 years. This is SPSS software. ANOVA, t-test and frequency the age-group which frequently visits the shopping distributions were carried out for analysing the mall. They also have regular income as they are data. The reliability of the data was tested using the employed either in private sector or in government Cronbach alpha method. services. We also found that they have decent
income as 42 per cent fall in the Rs. 3-5 lakh Demographic Factors income-group, whereas, 21 per cent are from the
Rs. 5-10 lakh income-group. This profile is ideally The demographic features of the respondents are suited for shopping at any modern retail format.summarised in Table1.
: Table 1: Demographic Profile of Respondents
Variable Characteristics Frequency Percentage
Age
group
46 yrs and above 19 19
31-45 yrs 26 26
20-30 yrs 55 55
Gender Female 54 54
Male 46 46
More than Rs 10 lakhs
09 09House hold
Income(yearly)
Rs.5 lakhs -10 lakhs
21 21
Rs.3 lakhs -5 lakhs
42 42
Less than Rs.3 lakhs
28 28
EducationLevel
Class XII 05 27
Graduation 68 68
Post Graduation 27 05
Occu-pation
Business 07 07
Private service 31 31
Government service
25 07
Students 16 16
Housewives 19 19
Table 4: Computation of ANOVA on the basis of age -group
Sum ofSquares Df Mean Square F Sig.
Product price 1.724 2 0.862 0.961 0.386Services and facilities 4.978 2 2.489 2.149 0.122
Large variety of products 4.237 2 2.119 1.785 0.173Good quality of products 5.296 2 2.648 2.804 0.066
Convenient shopping 0.783 2 0.392 0.322 0.726Good shopping experience 2.783 2 1.392 1.295 0.279
Ambience of store 3.493 2 1.747 1.779 0.174
Cronbach's Alpha N of Items
0.899 12
Table 2 : Validity and Reliability Statistics
Shamsher Singh

Test Value = 0 Retail Store Attributes
t df
Sig.(2-
tailed)
MeanDifference
95%Confidence
Interval of theDifference
Lower Upper‘Prices of the products are more reasonable in modern retail stores as compared to the neighborhood shops’.
31.157 99 0.000 2.95000 2.7621 3.1379
‘More services and facilities are offered in modern retail stores as compared to the neighbourhood shops’.
35.552 99 0.000 3.87000 3.6540 4.0860
‘A large variety of products is available in modern retail stores as compared to the neighbourhood shops’.
35.700 99 0.000 3.92000 3.7021 4.1379
‘Good quality products are available in modern retail stores as compared to the neighbourhood shops’.
35.072 99 0.000 3.47000 3.2737 3.6663
‘It is more convenient to shop from the neighborhood shops as compared to the modern retail stores’.
31.580 99 0.000 3.46000 3.2426 3.6774
‘Shopping experience in the modern retail storesis great as compared to the neighborhood stores’.
35.006 99 0.000 3.64000 3.4337 3.8463
‘Ambience of the modern retail stores is better as compared to the neighborhood shops’.
40.551 99 0.000 4.05000 3.8518 4.2482
Table 8: t-Test Computations
As shown in the table, there is no significant similar. difference in the perception of respondents of
ANOVA based on Educationdifferent age-groups in respect of the attributes of a modern retail store, except for the quality of The ANOVA computations based on the products. Thus, we accept the null hypothesis H . 02 respondents' education level are given in Table 5.This indicates that irrespective of the age of the customers, they perceive that the store attributes are
As shown in the table, there is no significant similar perception of attributes.difference in the consumers' perception in respect
ANOVA based on Incomeof attributes of a modern retail stores. Hence, we accept the null hypothesis H . This indicates that 04 The result of ANOVA computation on the basis of irrespective of the occupation, the consumers have the respondents' income is presented in Table 7.
The table shows no significant difference in the similar perception of the store attributes.perception of respondents having different
ANOVA based on Occupation educational qualifications in respect of the attributes of a modern retail stores. Hence, we The ANOVA computation based on the occupation accept the null hypothesis H . This suggests that 03 of the respondents was summarised in Table 6 irrespective of their education consumers have a
The table shows no significant difference in the are given in Table 8. The P-value is significant perception of respondents' belonging to different value and P value of 0.05, is the cut-off value for income-groups in respects of the attributes of acceptance or rejection of the null hypothesis. If the modern retail stores. Hence, we accept the null value is lower than 0.05, the null hypotheses is hypothesis H . This indicates that irrespective of rejected and if the value is higher then, it is 05
their income, consumers perceived the store accepted. Based on the significance value (0.000), attributes to be similar. we reject the null hypothesis H The frequency 06.
analysis also supports this finding as 36 per cent of the respondents were in agreement with the Hypothesis Testing: t-Test Computationsstatement and only 26 per cent in disagreement.
In order to test the remaining hypotheses, the one- sample t- test was carried out .The results of the test
Sum ofSquares Df Mean Square F Sig.
Products price 0.722 2 0.361 0.398 0.673Services and facilities 1.657 2 0.829 0.695 0.502
Large variety of products 3.457 2 1.729 1.447 0.240Good quality of products 4.452 2 2.226 2.335 0.102
Convenient shopping 4.896 2 2.448 2.084 0.130Good shopping experience 3.262 2 1.631 1.525 0.223
Ambience of store 0.931 2 0.465 0.461 0.632
Table 5: Computation of ANOVA on the basis of Educational Qualification
Table 6: Computation of ANOVA on the basis of Occupation
Sum ofSquares df Mean Square F Sig.
Product price 2.838 5 0.568 0.621 0.684Services and facilities 4.752 5 0.950 0.794 0.557
Large variety of products 5.430 5 1.086 0.896 0.487Good quality of products 3.407 5 0.681 0.685 0.636
Convenient shopping 5.245 5 1.049 0.868 0.506Good shopping experience 6.026 5 1.205 1.121 0.354
Ambience of store 3.869 5 0.774 0.767 0.576
Good quality of products 3.058 3 1.019 1.043 0.377Convenient shopping 0.432 3 0.144 0.117 0.950
Good shopping experience 1.118 3 0.373 0.338 0.798Ambience of store 1.878 3 0.626 0.620 0.604
NICE Journal of Business • Vol. 11 • Nos. 1 & 2 • January - December, 2016 81
Consumer Perception of Various Attributes of Modern Retail Stores
NICE Journal of Business • Vol. 11 • Nos. 1 & 2 • January - December, 2016 80
Table 7: Computation of ANOVA on the basis of Income level
Sum ofSquares df Mean Square F Sig.
Product price 1.239 3 0.413 0.453 0.716Services and facilities 6.305 3 2.102 1.818 0.149
Large variety of products 5.694 3 1.898 1.603 0.194
Shamsher Singh

Hypothesis H was also rejected on the basis of the proposition as 85 per cent of the respondents agreed 07
significance level of 0.000. This conclusion that retail stores had a better ambience than the supports the propositions that modern retail stores neighborhood shops. offer more services and facilities. The frequency
The customer response and the significance level of table also supports this conclusion; there is 78 per 0.000 lead to the rejection of H Therefore, it is 012. cent of agreement with the statement as compared essential that the retail organisations should to just 13 per cent disagreement. Based on the maintain their store ambience and appearance customer responses and the significance level of which bring a large number of the customers. 0.000 and support from the frequency analysis, the
H is also rejected There is 80 per cent agreement 08 .
Frequency Distribution of Consumerwith the statement. This proves that shopping malls Perceptiondoes house a large variety of products. Similarly,
based upon the significance level of 0.000, both H o9 In order to support the result of the t-test, frequency and H are rejected This conclusion also finds o10 . distribution was carried out. The result is presented support from frequency analysis, with 54 per cent
in Table 9. 'Strongly agree' and 'agree' responses and 52 per cent respondents supporting the
are the supporting responses of the statement conclusion. This shows that customers believe that relating to a particular attribute of the modern retail good quality products were there in these stores. format. 'Disagree' and 'strongly agree' responses However, they find it more convenient to buy from are those which do not support the statement related a neighborhood shops rather than from a modern to a particular attribute. Neutral responses neither retail store. support nor oppose the attribute.
Based on the significance level of 0.000, we reject H The customer responses also support this 011.
Table 9: Frequency distribution of Consumers Perception
Retail Store Attributes StronglyAgree
Agree Neutral Disagree StronglyDisagree
Prices of the products are more reasonable inmodern retail stores as compared to theneighborhood shops.
7 29 38 24 2
More services and facilities are offered in modern retail stores as compared to the neighborhood shops.
28 50 9 7 6
A large variety of products are available in modern retail stores as compared to the neighborhood shops.
30 50 10 2 8
Good quality products are available in modern retail stores as compared to the neighborhood shops.
12 42 32 9 5
It is more convenient to shop from neighborhood shops as compared to the modern retail stores.
18 34 29 14 5
Shopping experience in modern retail stores is great as compared to neighborhood stores.
19 44 24 8 5
Ambience of the modern retail stores is better than the neighborhood shops.
31 54 6 4 5
As shown in the table, 36 per cent of the customers occupation had major influence on consumer either 'agreed' or 'strongly agreed' that the prices of buying behaviour whether the consumer did the the products in a modern retail store were shopping from a modern retail format or from a reasonable. Only, 26 per cent of the customers did conventional store. They also found that that family not agree with the statement. Whereas 78 per cent was the main influencer in a country like India customers either agreed or strongly agreed that where joint-family system was an important social more services and facilities were offered by feature. This contrast in the findings was perhaps modern retail stores, only 13 per cent did not agree due to the similarity in the demographic profile, with the statement. It was also found that 54 per where the education and income were very high in cent of the respondents either agreed or strongly the metropolitan area of Delhi and a number of agreed that good quality products were offered in modern shopping malls were available in the city. modern retail stores and only 14 per cent did not The study has revealed that there is significant agreed with the statement . variation some attribute such as variety and quality
of products. It has reinforced the general perception Moreover, while 52 per cent of the respondents
and findings of earlier studies that two types of either agreed or strongly agreed that it was more
factors, environment of the retail store and other convenient to shop in neighborhood shop as
related to price of products dealt in stored in these compared to modern retail stores, only 19 per
retail outlets. However, there is general perception cent did not agree with the statement. Similarly, 63
that these store charge higher price than the per cent respondents either agreed or strongly
traditional store. Moreover, there is a positive agreed that shopping experience was great in
perception of ambience, large variety of products modern retail stores. As many as, 85 per cent of the
and more services and facilities. respondents either agreed or strongly agreed that the ambience of modern retail stores is better than the neighborhood shop; only 9 per cent did not REFERENCES agree with the view.
Aggarwal, V. (2008), “The Era of Retail Revolution: Contribution to Economy” in
CONCLUSION Research in Management and Technology, Ed. by Aneet and Ramanjeet Singh, Deep and Deep The study did not reveal any significant variation in Publications New Delhi, pp. 429-442the customer perception on majority of store
attributes based on demographic variable such as Ali, J., Kapoor, S., and Moorthy, J. (2010), “Buying gender, age, education, income and profession. Behaviour of Consumers for Food Products in an This indicates that customers perceive these stores Emerging Economy”, British Food Journal, in similar way irrespective of their gender, age, Vol.112, No.2, pp. 109-124education, income or occupation. This is in contrast to the findings of Luceri and Latusi (2016), who Benito, O.G., Reyes, C.A.B, and Gallego, P.A.M. investigated the cross-format shopping behaviour (2006), “Isolating the Geo-demographic in the apparel sector. They found that socio- Characterisation of Retail Format Choice from the demographic characteristics of age, gender, E f f e c t s o f S p a t i a l C o n v e n i e n c e ” , employment status and citizenship had an impact http://link.springer.com/article/10.1007/s11002-on multi-store format patronage patterns for the 006-9000-z#page-1.(accessed on apparels. Choudhary (2015) investigated the impulse buying behaviour of the shoppers in Bhardwaj, R.K., and Makkar, Urvashi. (2007), Kolkata and found that the demographics (age, “Retail Revolution: Emerging Challenges and income and gender) had an impact on the impulse Issues”, Journal of IMS Group, Vol.4, No.2, pp. 09-buying. Similarly, Mathuret et al. (2013) found that 12the demographic factors, like income and
07-09-2016)
NICE Journal of Business • Vol. 11 • Nos. 1 & 2 • January - December, 2016 83
Consumer Perception of Various Attributes of Modern Retail Stores
NICE Journal of Business • Vol. 11 • Nos. 1 & 2 • January - December, 2016 82
Shamsher Singh

NICE Journal of Business • Vol. 11 • Nos. 1 & 2 • January - December, 2016 85
Consumer Perception of Various Attributes of Modern Retail Stores
NICE Journal of Business • Vol. 11 • Nos. 1 & 2 • January - December, 2016 84
Bhatnagar, S.(2015), “The Changing Face of Indian Retail Industry- A Journey from Halepete, J., Seshadri, K.V., and Park, S.C. (2008), Unorganised Retail to Organised Retail, Elixir “Wal-Mart in India: A Success or Failure?” O n l i n e J o u r n a l ; International Journal of Retail and Distribution http://www.elixirpublishers.com/index.php?route Management, Vol.36, No.9, pp. 701-713=articles/archives&month=June&year=2015&p
Hino (2010), “Antecedents of Supermarket age=2(accessed on 09-08-2016)formats` Adoption and Usage: A Study in Context B u s i n e s s L i n e ( 2 0 1 3 ) , of Non-Western Customers”, Journal of Retailing http://www.thehindubusinessline.com/companies/and Consumer Services, Vol.17, No.1, pp. 61-72reliance-industries-retail-business-clocks-rs-
10000-cr-in-sales/article4787600.ece (accessed on IBEF (2016), “Retail Industry in India”, 07/11/2016)http://www.ibef.org/industry/retail-india.aspx
Chaudhuri,S.(2015),“A Study on the Impact of (accessed on 19-10-2016)Hedonic Shopping Value on Impulse Buying among Consumers in Kolkata”, Researchers World IMF and World Bank Prediction (2015), - Journal of Arts Science and Commerce ,Vol.6, http://articles.economictimes.indiatimes.com/201No.2, pp. 159-166 5-04-15/news/61180189_1_south-asia-economic-
focus-cent-gdp-growth-investment-growth, CII Report (2008) “Retail Scenario in India- (accessed on 2-6-2016)U n l i m i t e d O p p o r t u n i t y ” , I n d i a R e t a i l M a r k e t Vi e w ( 2 0 1 3 ) , http://www.ibef.org/attachdisplay.aspx?cat_id=37 http://www.ibef.org/industry/retail-india.aspx 5andart_id=4165.(accessed on (accessed on 15-06-2014)Cushman & Wakefield “India Retail Report” (2014)
h t t p : / / w w w. c u s h m a n w a k e f i e l d . c o . i n / e n - I n d i a R e t a i l R e p o r t ( 2 0 1 4 ) , gb/news/2014/04/q1-14-india-retail-report/ , ht tp : / /www.cushmanwakef ie ld .co . in /en-(accessed on 19-10-2016) g b / n e w s / 2 0 1 4 / 0 4 / q 1 - 1 4 - i n d i a - r e t a i l -
report/#_ftnref1 (accessed on 23-08-2016)Dalwadi, R., Rathod H.S. and Patel, A. (2010), “Key Retail Store Attributes Determining Jasola, M. (2007), “Emerging Trends in Retail Consumers' Retail Stores Located in Ahmadabad Sector”. Journal of IMS Group, Vol.4, No.2, pp. 22-(Gujarat)”, SIES Journal of Management,Vol. 7, 28No.1, pp. 20-34
Jackson, V., Stoel, S., and Brantley, A. (2011), Gupta, D.D.(2007), “Retailing in India and the “Mall Attributes and Shopping Value: Differences Role of the Marketing Mix”, European Retail by Gender and Generational Cohort”, Journal of Digest,Vol.53, pp. 17-20 Retailing and Consumer Services, Vol.18, No.5,
pp. 1-9Ghosh, P., Tripathi, V. and Kumar, A. (2010), “Customer Expectations of Store Attributes: A
Jacobs, S., D.V. Merwe, E. Lomard, and N. Kruger, Study of Organised Retail outlets in India”, Journal
(2010), “Exploring Consumers' Preferences with of Retail & Leisure Property, Vol.9, No.1, pp.
Regard to Department and Specialist Food Stores”, 75–87
International Journal of Consumer Studies, Vol.34, pp. 69-78Goyal, B. and Aggarwal, M. (2009), “Organised
Retailing In India- An Empirical Study of Jain, R., and Bagdare, S. (2009), “Determinants of
Appropriate Formats and Expected Trends”, Customer Experience in New Format Retail
Global Journal of Business Research, Vol.3, No.2, Stores”. Journal of Marketing & Communication,
pp. 77-83Vol. 5, No.2, 34-44
05-09-2016)
of Retailing and Rural Business perspective ;Vol.3, Joshi Brijesh H, Waghela, Rajendra Singh, and No.4, pp. 1369-1376Patel Kalpesh (2015), “Indian Organised Retailing:
Mathur , D., Jain, A.and Sharma M.K, Problems, Opportunities And Outlook”, (2013),“Analysis of Factors Influencing Consumer International Journal of Marketing, Financial Buying Behaviour In Modern as well as Services and Management Research ;Vol.4, No.6, Conventional Retail Stores, International Journal pp. 1-8of Innovative Research and Development,Vol.2,
Kaur, P., and Singh, R. (2007), “Uncovering Retail No.6, pp. 409-415Shopping Motives of Indian Youth”,Young
Mittal, A. and Mittal, R. (2008), “Store Choice in Consumers, Vol.8, No.2, pp. 128-138the Emerging Indian Apparel Retail Market: An
Kesar, V., and Sharma, V. (2015),“Understanding Empirical Analysis”, IBSU Scientific Journal, changing Buying Behaviour towards FMCG Vol.2, No.2, pp. 21-46segment in different retail formats: A Study of
Murugavel, M.V.D. (2011), “Problems faced by the Jammu Region” , Asian Journal of Management Retailers and Customer: An Empirical Study”, Research,Vol.6, No.2, pp. 286-298Indian Journal of Commerce & Management Studies, Vol.2, No.1, pp. 196-209Kotler, Philip, and Lane Keller Kevin (2016),
Marketing Management: A South Asian th Nunnaly, J. (1978). Psychometric Theory. New Perspective, (15 ed.) Pearson Education, New
York: McGraw-Hill Delhi
Nagar, J., Chandra A.K. and Guha, S. (2015), Kuruvilla, S.J., and Joshi, N. (2010), “Influence of “Consumer Behavioural Changes in Grocery and demographics, psychographics, shopping Food Products Retailing”, Academician: An orientation, mall shopping attitude and purchase International Multidisciplinary Research Journal , patterns on mall patronage in India”, Journal of Vol.5, No.2, pp. 168-172Retailing and Consumer Services,Vol.17, No.4, pp.
259-269Prasad, Y. R. (2012), “A Study on Attributes influencing the Purchasing behaviour of Apparel Lather, A.S., and Kaur, T. (2006) “Shopping Malls: Consumers in Organised Outlets”,African Journal New Retail Formats Keeping Pace with the of Business Management, Vol.6, No.45, pp. 11294-Shoppers Mood”, The Journal of Indian 11303Management and Strategy, Vol.11, No.4, pp. 22-28
Rahman, T.(2012), “Organised Retail Industry in Luceri, B., and Latusi, S. (2016), “The Cross-India- Opportuni t ies and Chal lenges”, shopping Behaviour: Patterns of Store format International Journal of Research in Finance & mobility in the Apparel Sector”, International Marketing, Vol.2, No.2, pp. 82-94 Journal of Retail & Distribution Management,
Vol.44, No.1, pp. 89-104Satish, D. and Raju, V. (2010), “The Growth of Indian Retail Industry”, Advances in Management, Lalitha,P.(2015), “A Study On Consumer Buying Vol.3, No.7, pp. 15-19Behaviour Factors In Shopping Malls In
Hyderabad City”, International Journal of Sinha, P.K. and Kar, S. K. ( 2007). “An Insight into
Engineering and Management Science , Vol.6, the Growth of New Retail Formats in India”
No.4, pp. 211-214Wo r k i n g P a p e r o f I I M A h m e d a b a d http://iimahd.ernet.in/assets/snippets/workingpapMariyappa,B.(2014),“Consumer Shopping erpdf/2007-03-04_PKSinha.pdf (accessed on 9-9-Behaviour among Modern Retail Formats in 2016)Bengaluru: A Case Study”, International Journal
Shamsher Singh

NICE Journal of Business • Vol. 11 • Nos. 1 & 2 • January - December, 2016 86
Talwar, S.L. (2010),“Organised Retail in Northern Singh, H. (2007), “Consumer Awareness and and Western States”, Retailer Magazine, Vol. 5, No. Consumption Pattern of Food products in 7. pp. 24-32Haryana”, Journal of IMS Group, Vol.3, No.1, pp.
Thang, D.C.L. and Tan, B.L.B. (2003), “Linking 24-33Consumer Perception to preference of Retail
Shukla, A and Jain, V. (2007), “Paradigm Shift of Stores: An Empirical assessment of the Multi-Indian Retailing: A Global Perspective”, Journal of attributes of Store Image”, Journal of Retailing and IMS Group, Vol.4, No.2, pp. 29-36 Consumer Services, Vol.10, No.4, pp. 193-200
Srivastava, R.K. (2008), “Changing Retail Scene in Yes Bank-ASSOCHAM Study, (2014), “Indian India”, International Journal of Retail and Retail Market to reach 47 lakh crore by 2016-Distribution Management, Vol.36, No.9, pp. 714- 17”http://www.thehindu.com/business/Industry/in721 dian-retail-market-to-reach-47-lakh-crore-by-
201617-study/article5677176.ece (accessed on Swinyard, W.R. (1997) “Retailing Trends in the 14/09/2016.)USA: Competition, Consumers, Technology and the Economy”, International Journal of Retail and Distribution Management, Vol.25, No.8, pp. 244-255
“I never took a day off in my twenties. Not one.”
Bill Gates
Co-founder, Microsoft
?????
“It is always the start that requires the greatest effort.”
James Cash Penney Founder and CEO, J.C. Penny
?????
“The most valuable thing you can make is a mistake – you can't learn anything from being perfect”
Adam Osborne
Shamsher Singh

Keywords: Financial inclusion, On-line banking, Customer occupation, Customer awareness, Usage level
through on-line banking. Multiple types of INTRODUCTIONtechnology-based services are provided by banks to the customers such as on-line banking, tele-Technology plays an important role in achieving banking, mobile banking, mobile wallet, and
the objective of financial inclusion in developing payment apps. The most popular service is the on-countries, like India, and thereby taking this route line banking which has emerged as the most for inclusive growth. Banks in India have taken commonly used service for banking transactions. numerous initiatives for including the unbanked On-line banking is an electronic payment system population under formal financial system with the which allows the customer of the bank to conduct help of technology. It has also helped in reducing banking transaction through bank's website. It is the cost of banking transactions not only for the also known by various names, such as the Internet banks but also for the customers. The cost of setting banking, e-banking, and virtual banking. up branches in unbanked areas can be done away
Abstract
Inclusive growth can be achieved only through financial inclusion, wherein every person is a part of the formal financial system. With the help of technology, banks can play a vital role in financial inclusion. Advancement of technology has changed the way people use to do banking transactions. The services provided by banks, include on-line banking, tele-banking, SMS-banking, and mobile-banking. The most popular among these is the on-line banking. The usage of this service has been observed differently with respect to customer occupation, i.e., employed and self-employed. The present study focusses on assessing the impact of customer occupation on awareness, usage and frequency of usage of on-line banking service. The primary data was collected through a structured questionnaire from 752 respondents in the Delhi NCR. Statistical Package SPSS 20 was used for data analysis and the tests, such as the Cross Tab, Chi-square, and the Mann-Whitney U test, were conducted to arrive at the conclusion. The study has revealed that occupation has an impact on on-line banking services in terms of awareness, usage and the frequency of usage. The overall usage and frequency of usage are low. Hence, the customer occupation must be taken into account by banks when planning the strategy for better usage and frequency of usage of on-line banking services.
FINANCIAL INCLUSION THROUGH ON-LINE BANKINGImpact of Customer Occupation on Awareness and Usage Level
Shweta Anand* and Deepika Saxena**
* Professor, School of Management, Gautam Buddha University, Greater Noida, e-mail: [email protected] ** Assistant Professor, Jagan Institute of Management Studies, Rohini, Delhi, e-mail: [email protected]

On-line banking provides number of banking (GDP) and the human development measured by services, such as balance enquiry, bank statement, the United Nations Human Development Index request for issue of cheque book, request for issue (HDI). The relationship between the GDP and the of demand draft, utility bill payment, funds transfer HDI with financial inclusion as mediator, using between own account and to other bank accounts multiple regression, has been validated on a global through NEFT (National Electronic Funds level which is based on the data from 162 countries, Transfer) and RTGS (Real-Time Gross for the year 2011. The study holds valid in the Settlement), opening new account, opening global context of income inequality, which is recurring deposit account, making fixed / term prevailing in developed, developing and deposits, ‘stop payment’ request, cash and draft underdeveloped countries, as it validates the delivery and on-line ticket booking by rail, road or argument that an impressive GDP performance air. does not ensure equity in economic growth. The
financial inclusion levels are calculated on the basis The main advantage of on-line banking is to have of the Index for Financial Inclusion (IFI), based on easy access to the bank account anytime and any three dimensions – penetration, availability and where. It saves time, money and effort of the usage. The study revealed that human development customer. Distance to the branch is also a problem cannot arise only from the national average, but it for the customers. On-line banking is the solution should incorporate three aspects, viz., national for these problems for doing all kinds of banking average, equity and deprivation. It has been transactions sitting at one place, with no time concluded that any change in the levels of financial constraints. inclusion indirectly boost the overall human
development in an economy. The significance of The main apprehension in the mind of customers
financial inclusion towards overall human for using on-line banking is of the security. On-line
development is well-established in this study.banking cannot be performed without the security of customers' financial information and their Bihari (2011) proposed an Index of Financial credentials. Similarly, risks-related to the Inclusion (IFI) following a multi-dimensional reputation of the banks themselves is equally approach. The IFI developed can be used to important. For this purpose, the banks are in the compare levels of financial inclusion across process of setting up various security processes different economies at a particular point of time. It which tend to reduce the risk of unauthorised on- can also be used to monitor the progress of policy line access to the financial information. initiatives related to financial inclusion for a period
of time. The study explored the relationship of financial inclusion and economic development.
LITERATURE REVIEWThe author has proposed an index for measuring financial inclusion. He has taken into consideration Various studies have been conducted in the area of three basic dimensions; the banking penetration, financial inclusion which have shown that there are availability of banking services and the frequency three important parameters of initiatives: On-line of usage The study revealed that index of financial banking taken towards financial inclusion, viz., inclusion of India is low. It concluded that the awareness, usage and frequency. Therefore, for developing and the under-developed economies all assessing the impact of customer occupation on over the world must look for new ways to include on-line banking, these parameters have been their population in the financial system.It is now studied. becoming increasingly visible that addressing financial exclusion requires a holistic approach on Unnikrishnan and Jagannathan (2015) noted in the the part of the banks in creating awareness about study on the current value of global financial financial products, education and advice on money inclusion and its relationship with economic management, debt counseling, savings and growth measured by the Gross Domestic Product
.
affordable credit. On-line banking is a viable Sarma (2015) proposed an Index of Financial solution to ensure financial inclusion in unbanked Inclusion which is a measure of inclusion of a areas at low operational cost. financial system that includes information on
various dimensions of the financial inclusion in Bapat (2010) examined the penetration level of numbers lying between 0 and 1. The proposed bank in the village and studied the relationship index is comparable all over the world and is unit-between bank accounts and demographic factors, free, monotonous and homogeneous. The study such as occupation, income, and asset-holding has shown that merely having bank account may status. For the purpose of the study various not imply financial inclusion if people do not use parameters were considered, such as usage, the account. The reasons for non-use of the bank adequacy, timeliness, cost, security, convenience, account can be due to remoteness, cost of comfort, friendly staff and banking transaction. transactions and psychological barriers. A measure Statistical tools such as cross tabulation, chi-square based on the proportion of adults with a bank and t-test have been used to arrive at the reults. The account explains only one aspect of financial study revealed that 75.2 per cent of the respondents inclusion, i.e.., financial penetration. However, it had bank accounts and 26.7 per cent of the ignores other important aspects such as availability, respondents avail credit facilities provided by the affordability, quality and usage of financial system banks. Two-thirds of respondents had inclination to that together form an inclusive financial system. availed credit facility for dairy and for other The study took into account three dimensions: business activities. The study also showed that banking penetration, availability and usage and opening and maintaining a bank account has developed the financial inclusion index. This index significant relationship with income . The study can be used to measure financial inclusion at also suggested to the banks to provide the banking different points and at different levels of economic services in rural areas also. aggregation (village, province, state, nation and so
on) and policy makers to monitor progress of Nagadevara (2009) analysed the factors
financial inclusion initiatives and develop inter-influencing supply and demand side of financial
linkages between financial inclusion, income and inclusion. He used Artificial Neural Networks to
inequality. On-line banking also improves identify the specific factors that influence different
availability, affordability, quality and usage of financial products on the supply side and different
financial system.sources of borrowing on the demand side. Supply side financial products were categorised into long- Sarma and Pais (2008) studied several indicators to term instruments, banking products, small savings assess the extent of financial inclusion. Index of (post office-oriented instruments) and insurance Financial Inclusion (IFI), which is a multi-products. Various sources of loans and borrowings, dimensional measure developed in line with well-i.e., demand-side sources were money-lenders, known development indexes, such as HDI, HPI, private and public financial institutions, co- GDI, and GEM. IFI was used to compare the extent operative banks and societies, relatives and friends of financial inclusion across different countries. It and others, including SHGs and chit funds. The is also used to monitor the progress of the countries study revealed that the common factors, like annual with respect to financial inclusion over different investible surplus, annual expenditure, annual periods of time. The index of financial inclusion income, age-group, occupation and ownership of expressed three basic dimensions of a financial occupied house are specific to demand side. Factors system for inclusive growth: penetration of related to supply side were media exposure, banking services, their availability and usage of the typology (rural/urban), gender, exposure to radio banking system. Using data on all three and marital status. These factors can be used for dimensions (penetration, availability and usage) evolving appropriate strategies for enhancing for 55 countries and data for availability and usage financial inclusion. dimensions for 100 countries for the year 2004,
88 89
Financial Inclusion through On-line Banking ServicesShweta Anand and Deepika Saxena Shweta Anand and Deepika Saxena
NICE Journal of Business • Vol. 11 • Nos. 1 & 2 • January - December, 2016 NICE Journal of Business • Vol. 11 • Nos. 1 & 2 • January - December, 2016

index of financial inclusion values were computed. study also emphasized that branch distribution per sq km in the states is quite unfavourable for the
Subramaniam, Chattopadhyay, and Tyagi (2008) region compared to the Indian average, which proposed ways as to how IT can support different negates the advantage of lower APPBO (Average collaborative models to implement and sustain the Population per Branch Office) in some of the states. financial inclusion initiatives. They emphasised IT- The study concluded that the banks should create led e-Governance models for financial inclusion, awareness by adopting a flexible approach and i.e., postal network, mobile banking, on-line imparting financial education about the financial banking and ubiquitous technology. They observed products and their benefits. Moreover, the that e-governance was necessary for successful Information Technology can also play an important implementation of financial inclusion. Also, the role in reaching the financially-unreached. Better success and evolution of financial inclusion technological facilities, such as ATMs, e-banking, initiatives is largely dependent on the collaboration etc., can also help in removing the problems of the among the private and public sector and this would distance and will surely bring down the be driven by progressive governance policy and dependency on informal sources. The banks should framework. Hence, online banking can largely lead see this as opportunity and should start taking the success of financial inclusion initiatives. financial inclusion of low-income groups both as
business and corporate social responsibility. Toxopeus and Lensink (2007) studied the relationship between remittance in flows and
The review of literature has shown that the financial inclusion in developing countries. They awareness of on-line banking services and its usage explored that research could improve by including play an important role in order to ascertain the other characteristics of the migrants into the extent and impact of financial inclusion. For the analysis, such as income level, since this is likely to purpose of the study, impact is sought to be play a role in the effect of remittances on financial explored through the level of awareness of people, usage. This would gave better insight into the their usage and the frequency of usage of on-line categories of migrants doing banking transactions, banking services. The study focusses on the impact who become banking individuals because of of occupation, i.e., whether employed or self-remittances, and who still do not use any formal employed, on the level of awareness of the on-line financial services. Policy can then be focused on banking service, its usage and the frequency of the groups who are yet to become banking usage.individuals. The study has shown that single
equation estimates on remittances and financial inclusion, and system estimates in which economic OBJECTIVES OF THE STUDYgrowth is explained by financial inclusion, and
The objective of the study is to assess the impact of further financial inclusion is explained by customer occupation on the awareness and usage of remittances inflows. These regressions confirmed on-line banking services provided by the the main hypothesis that remittances have a commercial banks as a step towards the financial development impact through their effect on inclusion initiatives.financial inclusion. On-line banking makes such
remittances low-cost and high-speed and hence needs a push towards ensuring financial inclusion.
RESEARCH METHODOLOGYGoyal (2008) explored various circumstances which led to the growing consensus about financial The research design of the study is descriptive in inclusion or exclusion in past years. The study nature. The primary data was collected with the attempted and made a comparative analysis of the help of a well-structured questionnaire, from 752 status of financial inclusion in Assam, North respondents in Delhi-NCR. For the purpose of Eastern Region (NER) and India as a whole. The
analysing the data, statistical software SPSS 20 was includes besides Delhi, the nearby towns of used. The descriptive statistics, such as frequency Baghpath, Gurgaon, Sonepat, Faridabad, distribution, cross-tabulation, Chi-square test, and Ghaziabad, Noida, and Greater Noida. There has the non-parametric tests, such as the Mann- been tremendous development in transportation, Whitney U test, were applied on the data to arrive at education and other facilities offered by the the conclusions. government and other agencies in Delhi-NCR. This
has become the attraction for people from all over India to come to Delhi for employment. People
Hypotheses usually come as migrants from different parts of the country and get settled in Delhi. These people
The following hypotheses were formulated: generally come for employment and education and remain here as resident of Delhi for rest of their life. H : There is no significant impact of customer 01A large portion of the population of Delhi is occupation on the awareness level of on-line comprised of such migrants. (India Online Pages, banking services.2015). The city of Delhi is a multi-culture and multi-linguistic with people from almost every part H : There is no significant impact of customer 02
of India. The impact of different states can also be occupation on the usage level of on-line banking found in the languages as well as in the lifestyles of services.the people in Delhi.
H : There is no significant impact of customer 03
occupation on the frequency of usage of on-line banking services. DATA ANALYSIS AND
INTERPRETATIONSample Profile
The following are the findings and analysis of the The study was confined to the National Capital study:Region (NCR), which is given a special status
under the Indian Constitution. The NCR zone
Awareness FrequencyFrequency of Users
N=425 (56.5%)Frequency (Break up of
56.5%)Yes 556 (73.9%) Rarely 24 (3.2%)
No 196 (26.1%) Sometimes 111 (14.8%)
Total 752 (100%) Frequently 290 (38.6%)
Total 425 (56.5%)
Table 1: Frequency Distribution of Online Banking Services
Shweta Anand and Deepika Saxena Financial Inclusion through On-line Banking Services
The frequency distribution revealed that out of 752 the total), followed by 5.6% respondents using it respondents, 556 (i.e. 73.9%) were aware about the rarely (3% of the total).
25% -Not Awareon-line banking services offered by banks. Out of 20% -Aware never usedthese respondents, 425 (i.e., 56.5%) respondents 2% -Rarely usewere using this service. Hence, 20% of the 13% -Sometimes Use
respondents' were aware but were not using the 40% - Frequently used
service out of the respondents who used online banking services 68.3% were using this service Overall, despite the banks having introduced on-frequently, implying 40% of total, 111 (i.e. 26%) line banking 50% of the population has never used respondents used the service sometimes (15% of its benefits and still uses physical banking facility.
90 91NICE Journal of Business • Vol. 11 • Nos. 1 & 2 • January - December, 2016 NICE Journal of Business • Vol. 11 • Nos. 1 & 2 • January - December, 2016
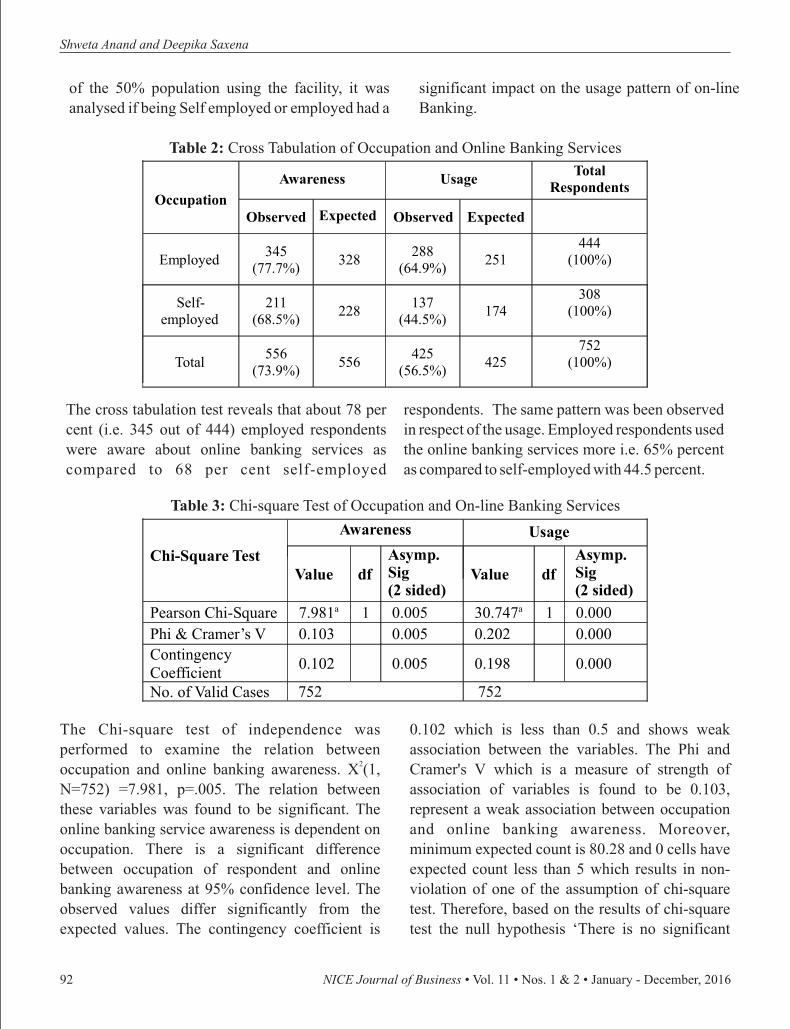
Table 2: Cross Tabulation of Occupation and Online Banking Services
The cross tabulation test reveals that about 78 per respondents. The same pattern was been observed cent (i.e. 345 out of 444) employed respondents in respect of the usage. Employed respondents used were aware about online banking services as the online banking services more i.e. 65% percent compared to 68 per cent self-employed as compared to self-employed with 44.5 percent.
Table 3: Chi-square Test of Occupation and On-line Banking Services
Occupation
Awareness UsageTotal
Respondents
Observed Expected Observed Expected
Employed345
(77.7%)328
288(64.9%)
251444
(100%)
Self-employed
211(68.5%)
228137
(44.5%)174
308(100%)
Total556
(73.9%)556
425(56.5%)
425752
(100%)
Chi-Square Test
Awareness Usage
Value dfAsymp. Sig (2 sided)
Value dfAsymp. Sig(2 sided)
Pearson Chi-Square 7.981a 1 0.005 30.747a 1 0.000
Phi & Cramer’s V 0.103 0.005 0.202 0.000
Contingency Coefficient
0.102 0.005 0.198 0.000
No. of Valid Cases 752 752
The Chi-square test of independence was 0.102 which is less than 0.5 and shows weak performed to examine the relation between association between the variables. The Phi and
2occupation and online banking awareness. X (1, Cramer's V which is a measure of strength of N=752) =7.981, p=.005. The relation between association of variables is found to be 0.103, these variables was found to be significant. The represent a weak association between occupation online banking service awareness is dependent on and online banking awareness. Moreover, occupation. There is a significant difference minimum expected count is 80.28 and 0 cells have between occupation of respondent and online expected count less than 5 which results in non-banking awareness at 95% confidence level. The violation of one of the assumption of chi-square observed values differ significantly from the test. Therefore, based on the results of chi-square expected values. The contingency coefficient is test the null hypothesis ‘There is no significant
Shweta Anand and Deepika Saxena Financial Inclusion through On-line Banking Services
of the 50% population using the facility, it was significant impact on the usage pattern of on-line analysed if being Self employed or employed had a Banking.
difference between the awareness level of people of The Mann-Whitney U Test has been conducted to Delhi towards online banking services and their examine whether there is significant difference occupation’, is rejected and alternate hypothesis is between the frequency of usage in online banking accepted. The result of this test shows that services and the occupation of respondents. The occupation has an impact on the awareness level of test results revealed that there is a significant people of Delhi towards online banking services difference between the two variables. U=12795, provided by commercial banks. The computations p=0.000 (2 tailed) < 0.025, with mean rank of are shown in Table 4 237.07 for employed and 162.39 for self-
employed. Therefore, based on the results of mann-The same test was conducted for examining whitney test the null hypothesis, ‘There is no relation between occupation and online banking significant difference between the frequency of 2usage. X (1, N=752) =30.747, p=0.000 usage of people of Delhi towards online banking
services and their occupation’, is rejected and the There is a significant difference between alternate hypothesis is accepted. This test shows occupation of respondents and online banking that employed people use the online banking usage at 99 per cent confidence level. The relation service more frequently as compared to the self-between these variables was found to be employed people and that the occupation has an significant. The observed values differ impact on the frequency of usage of online banking significantly from the expected values. The services provided by commercial banks.contingency coefficient is 0.198 which is less than
0.5, and shows weak association between the variables. CONCLUSION
On-line banking is being used by nearly 50 per cent The Phi and Cramer's V is found to be 0.202, which of the customers. However, many people are still suggest a moderate association between not aware of the on-line banking facilities available occupation and online banking. Moreover, the to them. They have been using conventional minimum expected count is 133.93, and 0 cells methods for banking from small to big value have expected count less than 5. Therefore, based transactions, getting the bank statements etc. This on the results of chi-square test the null hypothesis, is because of the lack of financial knowledge, i.e., ‘There is no significant difference between the hesitation to take the first step in on-line service, usage level of people of Delhi towards online and unavailability of resources. Another major banking services and their occupation’, is rejected issue which pull the people from using on-line and alternate hypothesis is accepted. The result of banking service is the lack of trust in the system. the test shows that occupation has an impact on the Security is one of the major concerns for people. usage level of people of Delhi towards on-line The banks should take initiative to create banking services provided by commercial banks.awareness about on-line banking to customers when they visit the bank or the ATM. More usage is a win-win situation. The banks stand to save overhead costs by lowering the footfalls in the branches or need for new branches. Customers gain by saving time energy and money for simple tasks such as seeing updated transaction statements, balance enquiry, funds transfer using the RTGS/NEFT, DD and ordering online.
Occupation N Mean Rank Tests Statistics
Employed 288 237.07 Mann-Whitney U
12794.500
Self-employed
137 162.39 Asymp.sig (2 tailed)
.000
Total 425
Table 4: Frequency of Use
92 93NICE Journal of Business • Vol. 11 • Nos. 1 & 2 • January - December, 2016 NICE Journal of Business • Vol. 11 • Nos. 1 & 2 • January - December, 2016
Shweta Anand and Deepika Saxena
They should take initiative on a mass level to Special Reference to Assam, The ICFAI University Press , pp.54-64discuss the apprehensions and issues related to
online banking with the users and non-users of this Nagadevara, Vishnuprasad (2009), ”Indetifying
service. Bank must also take multiple initiatives to Supply and Demand Side Factors That Influence
make the security systems stronger in order to Financial Inclusion: An Application of ANNs”, safeguard the interests of the users of the online Journal of International Business and Economics, banking. Customers have apprehension about Vol. 9, No.4, pp.88-93identity theft, phishing and other financial cyber
Sarma, Mandira (2015), “Measuring Financial crimes.Inclusion”, Economics Bulletin, Vol. 35, No.1, pp.
People should also come forward and create 604-611demand for awareness specially the self-employed
Sarma, Mandira, and Jasim Paise (2008), who generally have staff employed to go to banks “Financial Inclusion and Development”, Journal of
for all kind of banking transactions. The benefit and International Development , pp. 613-628
gains of online banking must be popularised as it also supports financial inclusion of the population Subramanian, Jayalakshmi, Tapas Chattopadhyay
and Rajat Tyagi (2008), “IT Led Financial which is far away from physical bank branches.Inclusion in India” Data Centre for Government, www.egovonline.net (accessed on 24.9.2015)
REFERENCESToxopeus, Helen S., and Robert Lensink (2007),
Bapat, Dhananjay (2010), “Perception on Banking “Remittances and Financial Inclusion in Service in Rural India: An Empirical Study”, Development”, UNU-WIDER, United Nations International Journal of Rural Management, Vol. University (UNU), pp. 496, No.2, pp.303-321
Unnikrishnan, Roshny, and Lakshmi Jagannathan Bihari, Suresh Chandra (2011), “Growth through (2015), “Unearthing Global Financial Inclusion Financial Inclusion in India”, Journal of Levels and Analysis of Financial Inclusion as a International Business Ethics, Vol.4 No.1, pp.28- Mediating Factor in Global Human Development”, 41 Serbian Journal of Management, Vol. 10, No. 1,
pp.19-32Chakrabarty, K.C. (2012), “Exploring the Challenges of Financial Education across Wo r l d P o p u l a t i o n R e v i e w . ( 2 0 1 5 ) Emerging Economies”. Keynote Address at the http:/ /worldpopulationreview.com/world-Visa-FT Financial Literacy Forum Series. Mumbai c i t ies /delhi -popula t ion/ re t r ieved f rom
http://www.indiaonlinepages.com/population/delhGoyal, Chandan Kumar (2008), Financial i-population.html(accessed on 10.01.16 )Inclusion in the North Eastern Region of India with
94 NICE Journal of Business • Vol. 11 • Nos. 1 & 2 • January - December, 2016
“Be undeniably good. No marketing effort or social media buzzword can be a substitute for that.”
Anthony Volodkin
Founder, Hype Machine

PERFORMANCE EVALUATION OF PUBLIC-SECTOR BANKS DURING THE SECOND PHASE OF ECONOMIC REFORMS
Vaishali* and R C Dangwal**
* Assistant Professor, School of Management, Doon University, Dehradun; e-mail: [email protected] ** Professor, Department of Commerce, HNB Garhwal University, Srinagar (Uttarakhand); e-mail: [email protected]
Key words: Co-efficient of variation, Exponential growth rate, Performance evaluation, Public-sector Banks, Second-phase reforms
Abstract
Banking constitutes the core of the financial services industry. It plays a pivotal role in the economic development of the country. Performance evaluation of banks becomes more important with the introduction of Second Reforms phase. The present study examines on the factors affecting the growth and performance of banks with reference to deposits, total expenditure, spread, net profit, and total assets after the Second Reforms phase. Sixteen public-sector banks were taken up for the study for the period 1998-99 to 2012-13. The tools used to evaluate the performance include, simple growth rate, exponential growth rate, mean, standard deviation and coefficient of variation. The study has revealed that among the public-sector banks, the mean of deposits, total expenditure, spread, net profit and total assets were highest for the State Bank of India, followed by the Punjab National Bank. The deposits, total expenditure and total assets, in terms of dispersion were more consistent with the SBI. The spread in terms of dispersion was more consistent with the Central Bank of India and the net profit in terms of dispersion, was more consistent with the State Bank of Patiala. Furthermore, among the public-sector banks, the EGR of deposits, total expenditure, spread, net profit and total assets was highest for the IDBI.
the banking plays a positive role in supporting the INTRODUCTION financing needs of the country's growing economy. In view of the fact that the banking sector has important effects on the domestic as well as on the Banks performance is the vital indicator of global economy, it is perhaps the most heavily economic performance of an economy. It becomes regulated sector in the country. To improve the a major area of concern for the management of performance of the commercial banks, the first banks. Despite the increasing risks in the domestic phase of banking-sector reforms were introduced in and global macro-economic conditions, the 1991 and after its success, the government took up banking sector in India has remained robust. The the second phase of reforms in 1998. regulatory responses and the inherent strengths
underlying the Indian economy have to ensure that

In the present study, an attempt has been made to banking sector from 2002-03 to 2011-12. Their assess the performance of public-sector banks. and study revealed that the operational efficiency of the to evaluate the measured variations in the foreign banks was better than that of the public and performance of such banks. private-sector banks. The study also indicated that
there were significant differences in the operational efficiency of the Indian banking industry with
REVIEW OF LITERATURE respect to the variables selected for the study except the net NPA as a percentage of the net advances.
By reviewing various studies on the performance evaluation of bank, an insight is developed regarding the factors which have impact on banks' Productivity of Banksperformance. These studies have been categorised
Bhandari (2010)into three heads on the basis of different determinants.
Efficiency of Banks
Sathye (2005) examined the effect of banks privatisation on their performance and efficiency. For this, the data published by the Indian Banks’ Association for five years from 1998 to 2002 were The analysed, using the Difference of Means test. The changes in the Total Factor Productivity (TFP) of synchronic approach was used and comparison was 19 nationalised banks for the post-reform period made between India's gradual privatisation strategy 2003-2008 was evaluated by Dangwal et al. (2011). with that of some other countries, like Poland, TFP indices were estimated using the Malmquist Mexico and Mozambique. The analysis reveals that Productivity Index approach through Data the partially-privatised banks performed better than Envelopment Analysis. TFP change indices were the fully public-sector banks. decomposed into efficiency change and technical
change. The study revealed that, on an average, the Arora and Verma (2007) used the Average
TFP growth was more due to the technological Compound Growth Rate (ACGR) method to study
changes than the efficiency change.the relative efficiency of the public-sector banks from 1991-92 to 2003-04. They found that if the public-sector banks want to improve their position Financial Performance of Banks (based on further they need to greatly improve the efficiency CAMEL Model and other approaches)through the introduction of computer and should
Aspal and Malhotra (2013) evaluated the financial reach the International Standards of Capital performance of Indian public sector banks, Adequacy and NPAs. According to Mistry (2012), excluding the State Bank Group, for the period of the assets size, assets utilisation and operational 2007-11, using the 'Capital Adequacy, Assets, efficiency have impact on the return on assets and Management Capability, Earnings, Liquidity and the interest income. He also noted that the return on Sensitivity' (CAMEL) model. The authors found assets and interest income have negative the top-ranking banking with respect to financial relationship with the operational efficiency and the performance was because of better performance in positive relationship with asset management and the areas of liquidity and asset quality. However, bank size. other factors were also important, such as management efficiency and capital adequacy. A Dangwal and Vaishali (2014) made an attempt to study of performance of Indian banking sector examine the operational efficiency of the Indian
examined the overall total factor productivity improvement achieved by 68 Indian commercial banks, from 1998-99 to 2006-07, with respect to the components technical change, technical efficiency change and scale (efficiency) change factor, using the Data Envelopment Analysis (DEA) methodology. He suggested that the government should cautiously approach the liberalisation of the banking sector and should not blindly invite more foreign players to it.
amidst the Global Financial Turmoil was Table 1: List of Bank studiedundertaken by Bhatnagar and Sharma (2010). Their study revealed that all the banks under study had shown growth, but the most important challenge faced by the government during that period was to ensure a balance between inflation and growth.
Vohra (2009) examined the various financial components of selected private banks from 2001-02 to 2006-07. The indicators used for analysis included structure and trend ratio of total deposits, source-wise deposits, deposit-credit ratio and deposit- to-total-resource ratio. The study revealed that the volume of investment in private-sector banks had increased by nearly 200% during the period of study.
Thus, although there are number of valuable studies related to banks performance in India, there is a need to conduct a systematic and comprehensive study for the period 1998-99 to 2012-13 to fill the gap. The previous studies have been reviewed critically to identify the gap that existed in the literature in this area. The present study was undertaken to fill the gap in this important field of
Data Collectionbusiness. The study is based on the secondary data. The data was collected through Report on Trends and Progress of Banking in India and statistical tables OBJECTIVES OF THE STUDYrelating to banks in India.
The study has two objectives:
1. To examine the performance of public-sector Tools of Analysisbanks in India during the period 1998-99 to
To evaluate the performance of banks, simple 2012-13; and growth rate, exponential growth rate, mean,
2. To identify the factors affecting the performance standard deviation, and coefficient of variation of public-sector banks. were applied. To analyse their performance, five
parameters were selected. These are deposits, total expenditure, spread, net profit, and total assets.RESEARCH METHODOLOGY
The SampleDATA ANALYSIS AND FINDINGS
The sample consisted of sixteen public sector banks selected from the universe of public-sector banks in
Deposits over the YearsIndia. These banks included twelve from nationalised banks' group, four from SBI and its The growth of deposits (in percentage) of public-associates. Random sampling technique was used sector banks for the period 1998-99 to 2012-13, for the study. The samples banks are listed in taking the previous year as the base year, is shown
in Table 2.Table 1.
Vaishali and R C Dangwal
NICE Journal of Business • Vol. 11 • Nos. 1 & 2 • January - December, 2016 97
Performance Evaluation of Public-sector Banks During the Second Phase of Economic Reforms in India
NICE Journal of Business • Vol. 11 • Nos. 1 & 2 • January - December, 2016 96
S.No.
Public-Sector Banks
1 Allahabad Bank (AB)2 Bank of Baroda (BOB)3 Bank of India (BOI)4 Canara Bank (CAB)5 Central Bank of India (CBI)6 Corporation Bank (COB)7 IDBI Bank Ltd. (IDBI)8 Indian Overseas Bank (IOB)9 Oriental Bank of Commerce (OBC)
10 Punjab National Bank (PNB)11 Syndicate Bank (SB)12 State Bank of Bikaner and Jaipur (SBBJ)13 State Bank of Hyderabad (SBH)14 State Bank of India (SBI)15 State Bank of Patiala (SBP)16 Union Bank of India (UBI)
* IDBI continued to serve as a development financial institution till the year 2004, when it was converted into a bank. In 2008, the name of IDBI Ltd. was changed to IDBI Bank Ltd.

As shown in the table, the maximum growth rate of group mean of public sector banks is 1,16,50,291 deposits (72.16%) among the public-sector banks lakhs. The analysis also reveals that, among the was achieved by IDBI Bank in the year 2005-06 public-sector banks 5 banks (SBI, PNB, Canara and the minimum growth rate was achieved by Bank, BOI and BOB) have mean greater than the Syndicate Bank (0.98%) in 2009-10. During the group mean of public-sector banks under study. year 1999-2000, the OBC (31.48%) got the first The SBI (5,29,36,808 lakhs) is at first rank in terms rank, followed by the IDBI Bank (25.33%) and of mean followed by PNB (1,62,97,008 lakhs) and
nd rdSyndicate Bank (18.78%) got the second and third Canara Bank (1,52,00,605 lakhs) at 2 and 3 rank, ranks respectively. The table also reveals that the respectively. The five banks i.e. Allahabad Bank, BOI (7.46%) occupied the lowest rank, followed by BOB, BOI, Corporation Bank and IDBI have the UBI (10.55%) and IOB (10.97%) occupied the coefficient of variation above the group coefficient lowest second and third rank, respectively, in terms of variation (75.87%) of public-sector banks. of the growth rate of deposits in the year 1999- Moreover the data reveals that among public sector 2000. In the year 2012-13, the growth rate of banks the variation in IDBI (115.95%) is maximum deposits was highest for the BOB (23.13%), having the highest value of CV. The deposits in followed by Corporation Bank (21.93%) and BOI terms of dispersion are more consistent with SBI
st nd rd(19.99%) occupied the top 1 , 2 and 3 ranks, (62.82%). The three banks have recorded higher respectively, during the study period. EGR than the group EGR of deposits of public
sector banks (17.07%). The IDBI has highest EGR On the other side, the least growth rate in deposits of deposits i.e. 31.52% followed by Corporation in 2012-13 was shown by the PNB (3.15%), Bank (18.41%) and Allahabad Bank (17.46%) followed by IDBI Bank (7.90%) and Canara Bank while it is lowest in SBI (14.01%) followed by
st nd rd(8.81%), occupying the lowest 1 , 2 and 3 rank, CBI(14.27) and Canara Bank (15.27%).respectively. The statistical analysis reveals that the
As shown in the table, the maximum growth rate of 2012-13 was shown by IOB (-45.99%), followed net profit among public-sector banks was achieved by Allahabad Bank (-36.51%) and SBP (-16.27%),
st nd rdby the CBI (251.48%) in the year 2001-02, occupying the lowest 1 , 2 and 3 ranks, followed by the OBC (156.33%) in 2008-09, and respectively. It is also noticed that the growth rate in the IDBI Bank (131.96%) in 2004-05. On the other net profit is negative for 8 banks, namely, hand, the minimum growth rate was obtained by the Allahabad Bank, BOB, Canara Bank, Corporation Central Bank of India (-69.17%) in 2000-01, Bank, IOB, IDBI Bank, SBP and PNB in the year followed by IDBI Bank (-68.26%) in years 2000-01 2012-13. The analysis reveals that the group mean and 2001-02. The growth rate in terms of net profit of net profit of public- sector banks was 1,40,297 was maximum for SBI (99.61%) followed by IDBI lakhs. Moreover, among the public-sector banks, 4 Bank (98.28%) in 1999-2000. banks (SBI, PNB, Canara Bank and BOB) have a
mean greater than the group mean of the public-It is also noted that the growth rate was least for sector banks under study. The SBI (8,09,935 lakhs) Allahabad Bank (-48.64%) followed by Union got at first rank in terms of mean, followed by PNB Bank of India (-36.81%) in 1999-2000. In 2012-13, (2,74,913 lakhs) and Bank of Baroda (1,76,435 the highest growth rate of net profit was for CBI nd rdlakhs), at 2 and 3 ranks, respectively. The five (90.43%), followed by Syndicate bank (52.61%) banks SBI, BOB , Allahabad Bank, PNB and IDBI st nd rdand UBI (20.75%), occupying the top 1 , 2 and 3 Bank have coefficient of variation above the group rank, respectively during the study period. On the coefficient of variation (78.33%) of public sector other side, the least growth rate in net profit in banks. Moreover the data reveals that among public
AB
BOB
BOI
CAB
CBI
COB
IDBI
IOB
OBC
PNB
SB
SBBJ
SBH
SBI
SBP
UBI
PUSB
1
2
3
4
5
6
7
8
9
10
11
12
13
14
15
16
13.74
15.00
7.46
14.40
17.04
13.32
25.33
10.97
31.48
16.44
18.78
17.22
18.01
16.43
15.08
10.55
16.33
13.97
5.23
8.24
23.05
15.74
15.97
3.46
12.73
11.70
18.21
6.08
13.80
18.48
23.37
13.68
12.16
13.49
12.73
14.48
15.54
8.40
13.53
14.28
46.73
16.03
15.43
14.24
13.76
12.93
17.25
11.42
20.50
14.06
16.33
12.34
7.38
7.94
12.59
8.54
14.80
15.24
15.37
4.63
18.23
7.40
13.49
18.37
9.45
28.12
12.45
12.90
23.61
9.95
10.16
19.76
9.27
6.75
66.57
13.03
19.67
15.96
38.89
18.20
17.76
7.60
25.76
12.98
19.74
29.50
11.46
11.01
12.23
8.66
17.43
50.30
6.65
34.13
17.35
8.71
21.71
19.26
15.20
17.90
22.29
18.99
18.98
15.16
19.17
20.53
9.43
20.72
72.16
14.21
4.90
16.01
15.83
13.95
17.61
3.54
27.48
19.83
19.34
22.77
33.37
27.63
21.90
24.51
28.84
66.74
36.04
27.49
16.86
46.64
31.28
21.98
14.60
16.00
14.96
28.22
20.27
21.71
25.13
8.21
33.27
30.85
68.38
22.67
21.66
19.02
21.03
19.76
20.73
23.40
23.95
21.93
25.12
18.65
26.55
26.46
21.30
18.99
33.49
53.98
18.72
26.35
26.01
21.76
14.99
24.63
38.08
23.54
33.55
26.69
24.81
25.40
21.11
25.55
23.49
25.34
49.17
10.67
22.25
18.86
0.98
17.42
16.85
8.36
7.57
22.59
20.03
BanksS.
No.
1999-
2000
2000-01
2001-02
2002-03
2003-04
2004-05
2005-06
2006-07
2007-08
2008-09
2009-10
Growth Rate (in percentage)
24.36
26.60
30.08
25.28
10.64
25.90
7.64
31.08
15.63
25.49
15.87
16.92
21.46
16.14
5.44
19.07
19.85
21.00
26.00
6.47
11.25
9.38
16.61
16.62
22.86
12.16
21.31
16.48
14.33
11.40
11.75
16.68
10.08
15.27
11.99
23.13
19.99
8.81
15.22
21.93
7.90
13.29
12.78
3.15
17.36
17.12
14.78
15.24
11.65
18.35
14.54
6763571
13162330
14667195
15200605
9850182
5671898
7244669
7787876
7246633
16297008
7706571
2958817
4606080
52936808
3957557
10346857
11650291
5375807
10495244
11150981
10514338
6478888
4944935
8400335
5816236
5297433
11951748
5420858
2075758
3367843
33253993
2692481
7758447
8437208
79.48
79.74
76.03
69.17
65.77
87.18
115.95
74.68
73.10
73.33
70.34
70.15
73.11
62.82
68.03
74.98
75.87
17.46
16.88
15.36
15.27
14.27
18.41
31.52
15.87
16.77
16.16
15.93
15.94
16.91
14.01
16.46
15.98
17.07
2010-11
2011-12
2012-13 Lakhs
Mean SD CV EGR
Lakhs % %
Table 2: Deposits of Public-Sector Banks
AB
BOB
BOI
CAB
CBI
COB
IDBI
IOB
OBC
PNB
SB
SBBJ
SBH
SBI
SBP
UBI
PUSB
1
2
3
4
5
6
7
8
9
10
11
12
13
14
15
16
-48.64
19.30
-14.08
4.88
3.03
21.04
98.28
-24.37
21.08
9.68
51.25
31.06
14.59
99.61
29.14
-36.81
17.44
-42.43
-45.37
45.75
20.78
-69.17
12.65
-68.26
187.38
-27.18
13.60
8.94
-12.50
17.54
-21.80
23.27
53.56
6.05
100.98
98.76
102.01
160.05
251.48
17.67
-68.26
98.58
57.99
21.30
6.64
56.12
50.77
51.55
44.59
102.05
72.02
106.94
41.55
67.25
37.43
87.08
35.02
35.63
80.79
42.55
49.75
37.34
23.57
33.07
27.71
38.24
75.94
51.24
179.16
25.13
18.49
31.32
102.31
21.19
86.30
23.19
50.14
31.64
26.16
48.32
26.48
18.55
33.64
28.84
46.93
16.92
-30.00
-66.27
-17.08
-42.18
-20.22
131.96
27.03
10.89
27.19
-7.20
-31.78
-34.17
7.44
-33.29
0.98
-3.74
30.34
22.18
106.27
21.06
-27.98
10.51
82.55
20.26
-26.76
2.07
33.17
-29.48
70.18
11.43
5.59
-6.09
20.33
6.23
24.13
60.12
5.77
93.47
20.63
12.38
28.73
4.23
6.99
33.18
110.84
18.38
3.05
20.93
25.20
29.64
29.94
39.85
78.90
9.59
10.47
37.09
15.73
19.23
-39.18
33.03
18.44
3.00
10.18
48.17
12.87
64.07
24.46
-21.15
55.15
49.66
32.42
3.83
21.47
17.69
10.27
156.33
50.86
7.64
28.07
10.56
35.55
28.48
24.48
31.95
56.95
37.31
-42.10
45.79
85.25
31.08
20.10
-46.68
25.32
26.35
-10.90
12.82
33.60
0.49
3.64
20.18
18.70
BanksS.
No.
1999-
2000
2000-01
2001-02
2002-03
2003-04
2004-05
2005-06
2006-07
2007-08
2008-09
2009-10
Growth Rate (in percentage)
17.97
38.69
42.94
33.24
18.35
20.77
60.05
51.70
32.45
13.52
24.84
21.03
41.75
-9.83
18.53
0.34
26.65
31.18
18.04
7.58
-18.46
-57.44
6.56
23.10
-2.09
-24.04
10.16
25.34
18.35
41.75
41.66
21.97
-14.16
8.09
-36.51
-10.51
2.68
-12.51
90.43
-4.73
-7.36
-45.99
16.32
-2.79
52.61
11.99
11.33
20.48
-16.27
20.75
5.62
69178
176435
132212
163710
50154
69662
66991
64911
69597
274913
68115
31667
54615
809935
39649
103006
140297
55811
163337
102875
118083
36339
46901
69849
42421
42020
283630
50353
20298
40885
953878
20864
76243
132737
80.68
92.58
77.81
72.13
72.45
67.33
104.27
65.35
60.38
103.17
73.92
64.09
74.86
117.77
52.62
74.02
78.33
15.52
16.88
18.68
18.19
13.84
14.36
29.38
16.88
12.52
18.19
18.88
14.80
17.26
18.71
13.47
18.57
17.25
2010-11
2011-12
2012-13 Lakhs
Mean SD CV EGR
Lakhs % %
Table 3: Net Profit of Public-Sector Banks
Vaishali and R C Dangwal
NICE Journal of Business • Vol. 11 • Nos. 1 & 2 • January - December, 2016 99NICE Journal of Business • Vol. 11 • Nos. 1 & 2 • January - December, 2016 98
taking the previous year as the base year is Net Profit of Public-Sector Bankssummarised in Table 3.
The growth of net profit (in percentage) of public-sector banks for the period 1998-99 to 2012-13,
Performance Evaluation of Public-sector Banks During the Second Phase of Economic Reforms in India

Table 4: Total Expenditure of Public-Sector Banks
AB
BOB
BOI
CAB
CBI
COB
IDBI
IOB
OBC
PNB
SB
SBBJ
SBH
SBI
SBP
UBI
PUSB
1
2
3
4
5
6
7
8
9
10
11
12
13
14
15
16
15.72
7.98
8.53
9.22
12.96
16.11
38.62
7.30
30.91
21.35
13.45
13.76
16.99
13.87
9.88
14.21
15.68
12.52
12.83
11.72
13.44
13.29
7.90
36.63
8.00
14.67
12.54
12.67
12.70
14.65
20.80
13.29
9.64
14.20
10.05
3.91
-1.98
13.65
6.79
8.96
-5.80
10.61
4.21
7.99
0.99
2.42
9.79
7.23
7.98
3.18
5.62
14.63
0.06
4.54
0.48
3.27
4.52
18.53
4.10
2.90
4.33
-1.84
5.49
5.19
3.98
13.71
4.97
5.55
-1.42
-4.64
-3.51
0.79
-4.33
1.63
9.83
-1.31
-6.86
1.68
2.02
3.47
7.64
-1.83
10.61
0.99
0.92
8.29
0.99
7.12
4.97
0.37
-2.96
341.16
2.66
14.25
13.83
18.56
7.99
6.68
0.13
7.99
7.71
27.48
17.17
15.19
13.70
14.50
4.56
22.14
100.57
10.65
22.35
6.89
8.30
15.95
21.50
12.46
26.92
17.51
20.64
28.98
27.33
28.20
32.44
15.30
33.06
10.33
29.39
28.50
17.74
46.38
26.29
19.12
9.79
30.91
24.04
25.49
35.96
37.19
29.02
35.86
38.09
38.84
28.72
45.39
39.46
31.09
38.89
30.82
38.94
26.31
51.81
31.08
36.09
16.78
23.85
29.44
14.96
34.18
36.76
39.89
28.63
32.18
34.64
19.66
22.08
26.58
31.49
32.56
29.37
28.31
11.07
7.57
13.25
6.99
16.38
16.99
27.42
9.53
9.62
7.30
6.53
4.63
5.39
15.50
-2.34
12.91
10.55
BanksS.
No.
1999-
2000
2000-01
2001-02
2002-03
2003-04
2004-05
2005-06
2006-07
2007-08
2008-09
2009-10
Growth Rate (in percentage)
27.18
21.58
20.39
18.80
18.34
23.53
11.39
9.65
8.49
21.67
2.95
17.50
19.45
6.27
2.48
22.11
15.74
39.88
38.40
32.08
41.58
27.61
48.71
29.68
53.30
41.95
39.33
35.16
25.72
38.40
24.23
29.86
28.45
35.90
18.96
21.67
12.38
12.59
14.81
19.31
6.50
17.38
12.61
17.27
14.22
20.57
17.93
17.14
22.43
21.24
16.69
536328
1080840
1095439
1208559
807498
436331
758872
660888
585205
1279794
605850
259510
384734
4563624
331611
802682
962360
430866
785927
780324
857251
546865
397962
802191
517371
450367
958502
416405
172756
295278
2654453
253292
604114
682745
80.34
72.71
71.23
70.93
67.72
91.21
105.71
78.28
76.96
74.89
68.73
66.57
76.75
58.16
76.38
75.26
75.74
16.37
13.58
13.18
14.08
12.93
17.21
31.30
14.69
16.03
15.23
13.73
13.63
15.93
12.21
16.24
14.70
15.69
2010-11
2011-12
2012-13 Lakhs
Mean SD CV EGR
Lakhs % %
As shown in the table, the maximum growth rate of BOI (12.38%) and Canara Bank (12.59%), st nd rdtotal expenditure among public-sector banks is occupying the lowest 1 , 2 and 3 ranks,
shown by IDBI Bank (341.16%) in the year 2004- respectively, during the study period. The statistical 05, followed again by IDBI Bank (100.57%), in the analysis reveals that the group mean of total year 2005-06. On the other side the minimum expenditure of the banks is 9,62,360 lakhs. The growth is shown by OBC (-6.86% in 2003-04, analysis further reveals that among the public followed by IDBI Bank (-5.80%) in the year 2001- sector banks, 5 banks, namely, SBI, PNB, Canara 02. The IDBI Bank (38.62%) has shown maximum Bank, BOI, and BOB, have greater mean than the growth rate of total expenditure, followed by OBC group mean of the banks study. The SBI (45,63,624 (30.91%) and the minimum growth rate is shown lakhs) is at first rank in terms of mean, followed by by IOB (7.30%), followed by BOB (7.98%) in the PNB (12,79,794 lakhs), and Canara Bank
nd rdyear 1999-2000. In the year 2012-13, the growth (12,08,559 lakhs) at 2 and 3 rank, respectively. rate of total expenditure was highest for SBP The seven banks, i.e., SBH, OBC, IOB, Allahabad (22.43%), followed by BOB (21.67%), and UBI Bank, SBP, Corporation Bank and IDBI, have
st nd rd(21.24%) occupying the highest 1 , 2 and 3 coefficient of variation above the group coefficient ranks, respectively, during the study period. On the of variation (75.74%) of the banks. Moreover, the other side, the least growth rate in total expenditure data reveals that among the public-sector banks, the in 2012-13 is shown by IDBI (6.50%) followed by variation in IDBI (105.71%) is maximum having
Table 5: Spread of Public-Sector Banks
AB
BOB
BOI
CAB
CBI
COB
IDBI
IOB
OBC
PNB
SB
SBBJ
SBH
SBI
SBP
UBI
PUSB
1
2
3
4
5
6
7
8
9
10
11
12
13
14
15
16
14.96
8.90
-8.24
-7.86
16.94
21.20
42.21
19.91
22.23
-2.19
10.75
13.11
11.83
14.27
24.01
-8.95
12.07
20.67
12.97
27.82
31.01
18.17
26.84
11.44
29.85
10.92.
26.11
32.51
22.03
17.54
19.04
27.22
61.01
24.70
7.29
-2.91
11.24
-3.33
5.92
7.55
41.34
10.14
22.95
12.60
1.27
7.53
6.28
10.10
8.61
9.65
9.76
24.55
11.91
10.68
22.67
23.61
26.70
40.41
25.91
23.94
36.09
9.22
12.46
15.09
9.87
20.10
12.05
20.33
19.34
22.26
8.11
20.13
11.85
21.68
64.19
25.91
20.84
16.04
18.14
29.94
12.52
12.11
4.20
15.92
20.20
25.63
15.85
1.61
17.45
11.91
17.17
-43.26
16.01
4.66
10.54
18.51
21.28
14.38
24.66
18.74
18.91
12.13
15.65
6.56
17.66
13.68
0.21
8.62
102.23
11.41
5.34
16.47
11.04
14.27
13.71
11.79
2.09
15.00
16.61
10.99
19.25
30.71
12.43
3.96
6.63
73.19
23.88
5.37
18.17
14.31
-5.45
12.21
2.98
11.42
17.53
16.10
1.71
3.32
22.92
-12.14
-10.16
10.34
2.82
4.63
-1.20
0.35
-3.59
0.03
-9.37
6.02
-19.80
2.26
-0.12
21.22
30.97
30.02
33.35
0.24
17.16
96.00
7.09
19.48
27.04
22.92
17.48
31.80
22.63
26.63
33.64
27.35
22.78
15.93
4.67
20.41
14.22
-30.79
70.16
10.39
45.63
20.58
7.54
9.82
27.03
13.41
36.04
9.93
18.61
BanksS.
No.
1999-
2000
2000-01
2001-02
2002-03
2003-04
2004-05
2005-06
2006-07
2007-08
2008-09
2009-10
Growth Rate (in percentage)
51.76
48.20
35.70
37.72
109.22
20.77
91.87
32.83
43.68
39.27
59.96
46.07
52.88
37.41
52.09
48.27
50.48
28.34
17.21
6.44
-1.71
-2.94
7.05
4.99
19.20
0.91
13.61
16.02
25.52
18.11
33.09
0.49
11.41
19.58
-5.74
9.68
8.55
2.47
11.00
8.86
18.22
4.70
11.51
10.75
7.26
15.50
16.45
2.40
4.48
9.17
8.45
198636
447511
395843
398015
264912
131692
137760
237281
201391
597738
228891
103528
144623
1858579
116641
307567
360663
153908
322273
267676
230422
150488
88899
184989
151819
134873
432592
152589
66952
108405
1241190
68690
222190
248622
77.48
72.01
67.62
57.89
56.81
67.50
134.28
63.98
66.97
72.37
66.66
64.67
74.96
66.78
58.89
72.24
71.31
16.39
14.09
13.26
11.57
12.14
15.74
31.63
15.92
14.91
15.69
15.07
14.64
15.22
14.21
13.25
15.75
15.59
2010-11
2011-12
2012-13 Lakhs
Mean SD CV EGR
Lakhs % %
NICE Journal of Business • Vol. 11 • Nos. 1 & 2 • January - December, 2016 100 NICE Journal of Business • Vol. 11 • Nos. 1 & 2 • January - December, 2016 101
Vaishali and R C Dangwal
sector banks the variation in SBI (117.77%) is Commerce (12.52%).maximum having the highest value of CV. Net Profit in terms of dispersion is more consistent with Total ExpenditureState Bank of Patiala (52.62%). The eight banks
The status of total expenditure growth rate (in have recorded higher EGR than the group EGR of percentage) of public sector banks for the period net profit of public sector banks (17.25%). The 1998-99 to 2012-13 taking the previous year as the IDBI Bank has highest EGR of net profit i.e. base year is summarised in Table 4. 29.38% while it is lowest in Oriental Bank of
the highest value of CV. Total expenditure in terms Spreadof dispersion is more consistent with SBI (58.16%).
Higher the spread, greater will be the profit margin The six banks recorded higher EGR than the group for the banks. The growth of spread (in percentage)
EGR of total expenditure of public-sector banks of public-sector banks for the period 1998-99 to (15.69%). The IDBI has highest EGR of total 2012-13, taking the previous year as the base year is expenditure (31.30%), followed by Corporation summarised in Table 5.Bank (17.21%), while it is lowest in SBI (12.21%), followed by CBI (12.93%). The lowest value of EGR for SBI indicates its improved profitability.
As shown in the table, the maximum growth rate of On the other hand, the least growth rate the spread the spread among the banks was achieved by CBI in 2012-13, is shown by Allahabad Bank (-5.74%), (109.22%) in the year 2010-11, followed by IDBI followed by SBI (2.40%) and Canara Bank
st nd rdBank (102.23%) in 2005-06. The least growth rate (2.47%), occupying the lowest 1 , 2 and 3 ranks of spread in the selected banks is shown by IDBI respectively. It is also noticed that only one bank, Bank (-43.26%), in the year 2004-05, followed by namely, Allahabad Bank has shown negative Corporation Bank (-30.79%), in the year 2009-10. growth rate in spread (-5.74%) in the year 2012-13. The growth rate of the spread is maximum for IDBI The statistical analysis reveals that the group mean Bank (42.21%), followed by SBP (24.01%) and of spread of public-sector banks is 3,60,663 lakhs. OBC (22.23%) in the year 1999-2000. On the other The analysis further reveals that among the public- hard, the minimum growth rate of the spread in sector, banks 5 banks, namely, SBI, PNB, Canara 1999-2000 is shown by UBI (-8.95%), followed by Bank, BOI, and BOB have mean greater than the BOI ( -8.24%), and Canara Bank (-7.86%). In the group mean of public sector banks selected in the year 2012-13, the growth rate of spread was highest study. The SBI (Rs. 18,58,579 lakhs) is at the first for IDBI (18.22%), followed by SBH (16.45%) and rank in terms of mean followed by PNB
st nd rdSBBJ (15.50%) occupying the top 1 , 2 and 3 (Rs. 5,97,738 lakhs) and BOB (Rs. 4,47,511 lakhs) nd rdranks, respectively. at 2 and 3 rank respectively. The six banks, SBH,
Performance Evaluation of Public-sector Banks During the Second Phase of Economic Reforms in India

AB
BOB
BOI
CAB
CBI
COB
IDBI
IOB
OBC
PNB
SB
SBBJ
SBH
SBI
SBP
UBI
PUSB
1
2
3
4
5
6
7
8
9
10
11
12
13
14
15
16
13.14
12.20
3.97
13.06
17.39
11.87
31.96
12.91
30.65
16.85
24.06
21.91
17.60
17.52
13.43
12.02
16.91
11.90
8.05
6.25
22.12
13.95
17.54
9.00
9.68
10.31
17.32
3.98
11.20
18.27
20.70
16.35
11.41
13.00
12.28
11.98
17.19
8.69
11.33
19.80
35.02
16.99
19.17
14.82
12.44
12.16
20.61
10.32
21.03
13.85
16.10
13.27
7.77
9.77
13.63
8.54
11.30
19.39
16.12
5.34
18.25
8.44
15.98
18.13
7.94
22.79
15.07
13.23
23.72
11.37
10.74
21.31
10.93
10.97
63.99
14.98
20.65
18.68
37.13
12.30
17.28
8.50
26.34
14.21
20.19
30.08
11.23
11.92
10.81
8.29
16.36
525.74
7.38
31.85
23.36
10.35
15.53
13.95
12.77
17.12
24.17
48.18
22.48
19.78
18.21
20.41
8.87
19.40
8.85
16.81
9.00
15.07
17.21
17.57
16.34
7.42
30.89
23.08
16.96
22.37
26.24
26.15
24.95
24.54
30.15
17.25
37.58
25.45
11.81
46.17
25.42
20.71
14.68
15.10
15.20
24.04
22.57
25.46
26.26
8.78
33.27
26.32
25.86
23.83
22.68
22.53
20.00
19.26
25.62
27.35
24.44
20.76
23.44
17.73
26.62
26.09
21.67
19.12
30.49
31.91
18.86
24.12
24.07
21.58
12.67
24.51
33.66
17.96
29.83
23.80
24.63
22.39
21.93
20.53
23.71
28.49
35.48
8.28
22.07
20.13
6.75
16.86
15.48
9.23
9.20
21.24
19.15
BanksS.
No.
1999-
2000
2000-01
2001-02
2002-03
2003-04
2004-05
2005-06
2006-07
2007-08
2008-09
2009-10
Growth Rate (in percentage)
24.31
28.77
27.71
26.95
14.83
28.51
8.48
36.38
17.40
27.54
12.58
16.17
20.42
16.17
6.85
20.92
20.87
20.92
24.81
9.50
11.33
9.55
13.97
14.78
22.86
10.40
21.11
16.56
15.21
10.89
9.13
21.17
11.11
15.20
11.72
22.31
17.70
10.20
16.68
18.27
10.98
11.38
12.67
4.51
17.89
18.60
15.01
17.28
10.20
18.93
14.64
7704612
18639840
17448970
17462347
11302543
6822077
11452255
9305620
13621510
19448830
8824980
3593640
5590493
68779625
4775643
12088996
14803874
6196830
15555444
13282887
12112283
7643437
5853879
11438413
7207844
23463482
14622147
6318373
2383995
4025980
43274116
3263260
9152899
11612204
80.43
83.45
76.12
69.36
67.62
85.81
99.88
77.46
172.25
75.18
71.60
66.34
72.01
62.92
68.33
75.71
81.53
17.59
16.78
15.20
15.34
14.48
18.27
32.48
16.45
16.92
16.68
16.32
15.21
16.67
13.94
16.45
16.44
17.20
2010-11
2011-12
2012-13 Lakhs
Mean SD CV EGR
Lakhs % %
Table 6: Total Assets of Public-Sector Banks
As shown in the table, the maximum growth rate of Bank (31.96%), followed by OBC (30.65%) and total assets among public-sector banks is shown by Syndicate Bank (24.06%). In the year 2012-13, the IDBI (525.74%) in the year 2004-05, followed growth rate of total assets is highest for BOB again by IDBI Bank (63.99%), in the year 2003-04. (22.31%), followed by UBI (18.93%) and SBBJ
st nd rdThe minimum growth rate is shown by BOI (18.60%), occupying the 1 , 2 and 3 ranks, (3.97%) in the year 1999-2000, followed by PNB respectively. (4.51%) in the year 2012-13 and OBC (5.34%) in
On the other side, the least growth rate in total the year 2002-03. The minimum growth rate of assets in 2012-13 is shown by PNB (4.51%), total assets in the year 1999-2000 is shown by BOI followed by Canara Bank and SBP (10.20%), both (3.97%), followed by Corporation Bank (11.87%)
ndand UBI (12.02%). The maximum growth rate of occupying the lowest 2 rank and IDBI Bank rdtotal assets in the year 1999-2000 is shown by IDBI (10.98%) at 3 rank. The statistical analysis reveals
Vaishali and R C Dangwal
NICE Journal of Business • Vol. 11 • Nos. 1 & 2 • January - December, 2016 102 NICE Journal of Business • Vol. 11 • Nos. 1 & 2 • January - December, 2016 103
BOB , Allahbad Bank, UBI, PNB, and IDBI Bank Bank (16.39%), while it is the lowest in Canara have coefficient of variation above the group Bank (11.57%) and CBI (12.14%). coefficient of variation (71.31%) of the public- sector banks.
Total Assets The data also reveals that among public-sector
The relevant data pertaining to the growth of total banks, the variation in IDBI Bank (134.28%) is assets (in percentage) of public-sector banks for the maximum, having the highest value of CV. Spread period 1998-99 to 2012-13, taking the previous in terms of dispersion is more consistent with CBI year as the base year, is summarised in Table 6.(56.81%). The six banks have recorded higher EGR
than the group EGR of spread of public sector banks (15.59%). The IDBI Bank has the highest EGR of spread (31.63%) followed by Allahabad
that the group mean of total assets of public-sector banks is 14803874 lakhs. The analysis further Aspal, P. K., and N. Malhotra (2013),
“Performance Appraisal of Indian Commercial reveals that among the selected banks, five banks Banks”, World Journal of Social Sciences, Vol. 3, i.e. SBI, PNB, Canara Bank, BOI and BOB have No. 3, pp. 71–88mean greater than the group mean of banks selected
in the study. The SBI (6,87,79,625 lakhs) is at first Bhandari, A.K. (2010), “Total Factor Productivity rank in terms of mean followed by PNB Growth and its Decomposition: An Assessment of (1,94,48,830 lakhs) and BOB (1,86,39,840 lakhs) the Indian Banking Sector in the True Liberalized nd rdat 2 and 3 ranks respectively. The four banks, i.e., Era”, Working Paper 435, www.cds.edu.
Corporation Bank, BOB, OBC and IDBI Bank, have coefficient of variation above the group Bhatnagar, V.K., and P. Sharma (2010), coefficient of variation (81.53%) of public-sector “Performance of Indian Banking Sector amidst banks. Global Financial Turmoil”, Journal of Banking, IT
and Management, Vol.7, No.2, pp.71-78The data also reveals that among public sector banks the variation in OOBC (172.25%) is Dangwal, R.C., and R. Kapoor (2010), “Financial maximum having the highest value of CV. Total
Performance of Nationalised Banks”, NICE assets, in terms of dispersion, are more consistent
Journal of Business, Vol.5, No. 2, pp. 67-79with SBI (62.92%). The three banks recorded higher EGR than the group EGR of total assets of
Dangwal, R.C., N. K. Batra, and R. Kapoor (2011), these banks (17.20%). The IDBI Bank has the “Nationalised Banks in Liberalisation Era”, Indian highest EGR of total assets (32.48%), followed by Management Studies Journal, Vol. 15, No. 1, pp. Corporation Bank (18.27%) while it is the lowest in
SBI (13.94%), followed by CBI (14.48%). 145-158
Dangwal, R.C., and Vaishali (2014), “Operational CONCLUSION Efficiency of Domestic and Foreign Sector Banks
in India: A Comparative Analysis”, PCMA Journal The study has revealed that among the public-
of Business, Vol.7, No.1, pp.15-24sector banks, the mean of deposits, total expenditure, spread, net profit and total assets were
Das, S.K. (2010), “Financial Liberalisation and highest in the case of the SBI, followed by the PNB. Banking Sector Efficiency: The Indian The deposits, total expenditure, and total assets, in
thExperience” 12 Money and Finance Conference, terms of dispersion, were more consistent with the 11-12 March, IGIDR, MumbaiSBI. Spread, in terms of dispersion was more
consistent with the CBI and net profit’ in terms of Das, S.K., and I. Drine (2011), “Financial dispersion, was more consistent with the SBP. Liberalization and Banking Sector Efficiency in Furthermore, the EGR of deposits, total India: A Fourier Flexible functional form and expenditure, spread, net profit and total assets was Stochastic Frontier Approach”, International highest for the IDBI. Business and Management, Vol. 2, No. 1, pp. 42-58
Kodan, A.S., S. Mahalan, and D. Bandhu (2010), REFERENCES“Operational Efficiency of Banking Industry: An Inter Sectoral Analysis”, Management and Labour Arora, U., and R. Verma (2007), “An Analysis of Studies, Vol.35, No.3, pp.357-368Operational and Productivity Efficiency of Public
Sector Banks in India”, Finance India, Vol. 21, No. 1, pp. 167-176
Performance Evaluation of Public-sector Banks During the Second Phase of Economic Reforms in India

Vaishali and R C Dangwal
NICE Journal of Business • Vol. 11 • Nos. 1 & 2 • January - December, 2016 104
Kumar, M., and V. Charles (2012), “Evaluating the Commercial Banks”, Finance India, Vol. 21, No.2, Performance of Indian Banking Sector using Data pp. 591-597Envelopment Analysis during Post-Reform and
Sathye, Milind (2005), “Privatisation, Performance Global Financial Crisis”, Centrum Catolica's and Efficiency: A Study of Indian Banks”, Vikalpa, Working Paper Series, No. 2012-09-0007Vol. 30, No.1, pp.7-16
Mistry, D.S. (2012), “A Comparative Study on the Vohra, P.S. (2009), “Operational Efficiency of
Profitability Performance in the Banking Sector: Selected Private Banks of India”, Finance India,
Evidence from Indian Public-sector Banks”, Vol. 25, No.1, pp.209-214
Finance India, Vol. 26, No.2, pp. 531-544
Rao, D.S. (2007), “Reforms in Indian Banking Sector: Evaluation of the Performance of
“Success is not in what you have, but who you are.”
Bo Bennett
Founder, eBookit.com
?????
“Your most unhappy customers are your greatest source of learning.”
Bill Gates Founder and CEO, Microsoft
?????
“If you just work on stuff that you like and you're passionate about, you don't have to have a master plan with how things will play out.”
Mark Zuckerberg Founder and CEO, Facebook
?????
"Courage is grace under pressure."
Ernest Hemingway

DETERMINANTS OF CAPITAL STRUCTURE IN AUTOMOBILE COMPANIES
An Empirical Study
Poornima B.G.* and Y.V. Reddy**
* Research Scholar, Department of Commerce, Goa University, Goa; e-mail: [email protected]** Professor and Dean, Faculty of Commerce and Management Studies, Goa University, Goa; e-mail: [email protected]
Key words: Capital structure, Automobile sector, Financial leverage, Liquidity, Profitability, India
Abstract
Capital structure is the way a company arranges its finances through a combination of equity and debt. It is designed with the aim of maximizing the market value of the company in the long run. The study seeks to explore the determinants of capital structure with the financial leverage of the Indian listed Automobile companies for the period 2008-09 to 2014-15. Automotive industry is perhaps the greatest engine of economic growth. In India, automobile is one of the largest industries, showing impressive growth and contributing significantly to the overall industrial development in the country. The determinants include liquidity, size, tangibility, profitability, risk, non-debt tax shield and growth. The study employs the Panel Data Models to examine the relation between capital structure determinants and financial leverage. The study has revealed that profitability, growth and tangibility significantly influence the financial leverage.
capital structure decisions. Capital structure means INTRODUCTION a certain proportion of equity and debt made use of by the firms to finance their assets. The main function of a finance manager is to make sure that it Finance lays the foundation that helps the accrues lesser cost in raising capital whereby
organisation to grow. It is the circulatory system maximizing shareholders wealth. A right blend of which provides an enterprise the needed co- debt-equity assumes implication as it affects the operation between various activities. The most risk return profile of the business. Excessive crucial function of finance is to accumulate finance amount of debt will jeopardize the continued as and when it is needed for a new activity and for a existence of the business. On the contrary, higher follow- up activity. It is mainly concerned with the equity component in the financing mix will result in identification of potential sources of funds and lower earnings per share for the shareholders. tapping these sources as per the funding Capital structure must be planned vigilantly requirements of the firm, often referred to as the keeping in mind the shareholders wealth.

Poornima BG and Y.V. Reddy
NICE Journal of Business • Vol. 11 • Nos. 1 & 2 • January - December, 2016 107
Determinants of Capital Structure in Automobile Companies
NICE Journal of Business • Vol. 11 • Nos. 1 & 2 • January - December, 2016 106
Capital structure is the vital one, since the Tangibility profitability of an enterprise is directly affected by Asset tangibility refers to all types of tangible such decision. The successful selection and use of assets that possess some degree of debt capacity. capital is one of the key elements of the firm's When the firms possess high tangible assets, it financial strategy. Hence, proper care and attention gives them the prospects for raising higher level of need to be given while determining the capital debt using assets as the collateral. The lenders also structure decision. reduce their risk of suffering from agency costs.
Relevant Concepts Size of the firm
The following section gives a brief description of Size of the firm also acts as an influential factor in the variables which affect the capital structure of the financing decision of the company. It is the firm. measured as a sales volume of a firm. Larger the
size, more stable is the cash flow, easier excess to Financial Leverage the capital market. But, it is not quite the same for
the small size firms. In contrast to the small size Financial leverage, also referred to as trading on firms, financial distress risk is lower for large size equity, occurs when firms organize debt funds with firms. some interest charges. Higher the financial
leverage, lower the cushion for paying interest on Growth borrowings and vice-versa. Capital structure
decisions should always aim at having debt Yet another determinant that influences the capital component in total component in order to increase structure decision of the firms. When the firm has a the earnings available for equity shareholders. lower growth rate, it means that it uses internally Total debt ratio indicates the fraction of a generated funds and if the firm is growing at a faster company's assets offered in comparison to debt. pace than it uses external funds as investors are
willing to invest in such businesses. Liquidity Risk Liquidity is yet another factor affecting the capital
Bankruptcy and agency cost implies a negative structure. Greater the liquidity of a firm, the lesser relation between capital structure and business risk. will be the risk of bankruptcy. This would instil the It states that if the firm's earnings are less stable confidence of investors in the company. Liquidity then the chances for the failure of the business and is the ability to convert an asset to cash the bankruptcy costs will also be greater. This immediately. It is also known as “marketability”. would lead to an increase in business risk. And as a The balancing of debt and equity is possible only result of that the lenders will not lend fearing the when the marketability is created for the securities company's failure in the repayment of loans. of the firm. Capital structure decisions will be Hence, debt portion in the capital structure would affected by the firm's ability to market its securities.be lesser.
Profitability Non-debt Tax Shield
The earnings that are generated determine the In order to reduce the tax bill, firms want to exploit efficiency of the capital that is employed in the the tax deductibility of interest. If they have other business. It is the benefit that is gained when tax deductible item which they can use as tax shield revenue exceeds expenditure, costs and also taxes. other than debt then the leverage will be low. So, It is assumed that higher the profit earned by the there exists a negative relationship between non- firm would result in higher retained earnings and debt tax shield and leverage.ultimately firms would use lesser debt funds and vice-versa.
decision
more on equity rather than debt finance. Secondly, REVIEW OF LITERATUREthe paper infers that Indian pharmaceutical
The capital structure is considered to be a very companies finance their investments mainly important decision, as it affects the cost of capital, through internal funds and the rest is financed earnings per share, net profit, and liquidity of the through equity share capitals. firm. These factors have a significant impact on the value of the firm. In this regard, one needs to know Raj and Ajit (1996) examined the effect of various capital structure theories, propounded by financing decisions on the value of the firm both at Modigliani and Miller (1958, 1963 & 1977), the the micro and macro level. They found that there is Pecking Order Theory, proposed by Myers and no significant relationship between change in Majluf (1984) and the Agency Theory of Jensen capital structure and the value of the firm at the and Meckling (1976). micro level and concluded that in India too,
wherein the capital markets are imperfect as in Modigliani and Miller Theory (1958) showed that west, companies have no definite way of under perfect market capital structure decision is determining their optimal capital structure. irrelevant to the value of the firm. In 1963, they Because capital structure is just one of the many argued that the capital structure is relevant to the factors like the reputation of promoters, firm-value under taxation condition. In 1977, they management of the company, economic and modified their theory and said that personal taxes political conditions, role of bulls and bears, are relevant to value of the firm. government policies, etc., which are not
measurable as they are qualitative in nature. The pecking Order Theory states that the firm will borrow, rather than issuing equity, when Chang, Chen and Liao (2014) identified internal cash flow is not sufficient to fund the profitability, industry leverage, asset growth, capital expenditures. Thus, the amount of debt tangibility, firm size and state control variables as reflects the firms' cumulative need for external the factors which effect the book leverage of the fund. Chinese firm. They concluded that the state-control
as a dummy variable was negatively associated The agency cost theory is based on the assumption with the book leverage. that agents may not always act in the interest of the principals and it will lead to conflict of interest Anshu and Kapil, (2014) sought to identify major between the agent with those of the principal and determinants of capital structure of 870listed will result in loss in return to the principal. Agency Indian firms, comprising both private-sector cost includes monitoring expenditures of principal, companies and government companies for the bonding expenditure by the agent and residual loss. period 2001 to 2010. They concluded that the
factors, such as profitability, growth, asset Venkatamuni and Hemanth (2008) investigated the tangibility, size, cost of debt, tax rate, and the debt-nature and pattern of financing the capital structure serving capacity have significant impact on the of Indian Corporate in general and Pharmaceutical leverage structure chosen by firms in India. companies which are registered at NSE in specific. The hypothesis associated with target adjustment Saurabh and Anil (2015) study the impact of capital model and pecking order model are tested using structure on firm financial performance. 422
companies which are listed on Bombay Stock OLS, GLS and Fixed Effects Models. The results Exchange are accounted for to analyze the obtained contradict the pecking order model and relationship between leverage and firm supports the target adjustment model. Firstly, the performance for a period of 10 years ranging from study finds that the companies are financially stable 2003 to 2013. The authors have employed Ratio and mostly finances their investments from analysis and panel data approach to perform the retained earnings, and for the rest, they depend

Table 2: Descriptive Statistics
Variables FL Liq. Prof. Tang. Size Growth Risk NDTS
Mean 0.1876 1.2723 0.1946 0.2834 4.8625 0.3104 2.3895 0.0332
Std Error 0.0359 0.3174 0.0215 0.0283 0.1325 0.0210 0.2636 0.0035
Median 0.1712 0.9401 0.1802 0.2732 4.9056 0.3237 2.0679 0.0292
Std Deviation 0.1391 1.2292 0.0833 0.1097 0.5132 0.0813 1.0210 0.0136
Variance 0.0193 1.5109 0.0069 0.0120 0.2634 0.0066 1.0424 0.0002
Kurtosis -0.8785 10.4468 -0.2433 -1.0981 -0.8241 -0.5219 3.3259 -0.1459
Skewness 0.4649 3.0411 0.5401 -0.1554 -0.1866 -0.3444 1.7079 0.6636
empirical study. Return on asset, return on equity understand the impact of each independent and Tobin's Q are used as the proxy for measuring variable, while raising total debt for Indian firms in
the automobile sector. the firm's financial performance. It was found that financial leverage has no impact on the firm's financial performance parameters of return on asset
OBJECTIVES OF THE STUDYand Tobin's Q. However, it is negative and significantly correlated with return on equity. Other The present study seeks to achieve the following independent variables like size, age, tangibility, objectives: sales growth, asset turnover and ownership structure are significant determinants of a firm's 1. To identify the various factors that influence the financial performance in the Indian manufacturing capital structure of a firm; and sector.
2. To assess the impact of each independent variable, while raising total debt for an
Arindam and Anupam (2015) investigate the automobile company in India.
influence of capital structure on dividend payout ratio of the companies listed in BSE500 in India during the pre- and post-period of the recent global Hypothesesrecession. The pre-recession period has been taken from 2001–2002 to 2006–2007 while the post- The following hypothesis was formulated :recession period from 2007–2008 to 2012–2013. The dependent variable taken into consideration is H : There is no significant relationship amongst 0the Dividend Payout ratio and 10 independent financial leverage and the explanatory variables variables taken into consideration are Business (liquidity, profitability, tangibility, size of the firm, Risk, Size (Log Sales), Size (Log assets), and growth, risk, non-debt tax shield). Growth Rate (Assets), Interest Coverage Ratio, Degree of Operating Leverage, Financial Leverage, Return on Assets, Tangibility and Non- RESEARCH METHODOLOGY Debt Tax Shield. Logistic regression has been utilized in this study. It is found from the study that Data and Data Source Growth Rate (Assets) and Profitability (Return of
The study focuses on the capital structure in the Assets) are significant variables influencing the selected Indian Automobile sector. The necessary dividend payout ratio in the prerecession period,
while Profitability (Return of Assets) and Financial data has been acquired from 'PROWESS Database' Leverage are significant variables influencing of CMIE. Data was extracted by analysing the dividend payout ratio in the post-recession period. financial statements for the years 2008-2009 to
2014-2015. The total number of companies listed in Auto Index National Stock Exchange are 15 which Reasons for selecting Automobile industryare as follows: Amarajabat Ltd, Ashok Leyland Ltd
The present study is conducted in the context of Apollo Tyres Ltd, Amtek Auto Ltd, Bharat Forge Indian Automobile industry, considered as the Ltd, Bajaj Auto Ltd, Bosch Ltd, Eicher Motors Ltd, fastest growing sectors in the economy. Evolution Exide Industries Ltd, Hero MotoCorp Ltd, MRF of the automotive component industry inevitably Ltd, Mahindra and Mahindra Ltd, Maruti Suzuki followed the growth of the Auto industry. In the India Ltd, MothersonSumi Systems Ltd, Tata last decade, Automobile industry has contributed Motors Ltd. 5% GDP in the Indian economy. It has the capacity to develop into a significant market for automobile manufacturers. As such through this study, the Variables Consideredvarious factors considered in financing decisions of
On the basis of an enormous literature review, the automobile sectors were identified and are used to
variables (factors) affecting the capital structure decisions were identified. These are listed in Table 1.
Table 1: Factors affecting Capital Structure
Econometric Models Employed independent variables or the error. Specification
Tests, like the F-test, the LM test and the Hausman Panel Data Econometric Models were employed to test are used to establish as to which model is study the precise factors of capital structure in the appropriate to establish the relationship amongst automobile sector in India. The Panel data analysis financial leverage and capital structure uses both time dimensions and cross section determinants. dimensions. The Fixed Effects model and the Random Effects model are the most widely used models under the Panel data. In the Fixed Effects Empirical Results model, each cross- sectional unit has its own intercept value, while in the Random Effects Descriptive Statisticsmodel, the mean value of all cross-sectional
The descriptive statistics of the selected capital intercepts is represented by others intercept. This structure variables of 15 automobile companies are model is based on the assumption that the constant summarised in Table 2.will be randomly determined to ascertain the
Profitability EBIT/Total Assets Independent
Tangibility Net Fixed Assets/ Total Assets Independent Size of the firm Log of Sales Independent
Growth Change in Total Assets Independent Risk EBIT/ EAIT Independent
Non- Debt Taxshield
Depreciation/ Total Assets Independent
Variables Definition Type of Variables
Financial Leverage Total Debt/ Total Assets Dependent
Liquidity Total Current Assets/ Total CurrentLiabilities
Independent
NICE Journal of Business • Vol. 11 • Nos. 1 & 2 • January - December, 2016 109
Determinants of Capital Structure in Automobile Companies
NICE Journal of Business • Vol. 11 • Nos. 1 & 2 • January - December, 2016 108
Poornima BG and Y.V. Reddy

As shown in the table, the growth rate of the Correlation Analysiscompanies in automobile sector is 31%, on an
The results obtained from the correlation analysis average, and the profitability is 19% which are summarised in Table 3.appears to be reasonably good. The Non-debt Tax
Shield is only 3%.
Table 3: Correlation Matrix
Variables FL Liq. Prof. Tang. Size Growth Risk NDTS
FL 1
LIQ 0.52 1
PROF -0.64 -0.350 1
TANG 0.77 0.411 -0.450 1
SIZE -0.15 -0.465 0.094 -0.193 1
GROWTH -0.039 -0.485 -0.014 0.009 0.635 1
RISK 0.743 0.245 -0.666 0.442 0.171 0.106 1
NDTS -0.111 -0.169 0.293 0.161 0.231 -0.170 -0.095 1
As shown in the table, the financial leverage has a Panel Data Analysis mild negative correlation with the profitability,
In the panel data framework, three types of models size, growth and NDTS. On the other hand, it has are widely used. These are: Pooled Ordinary Least high degree of positive correlation with tangibility Square (OLS) regression model, Random Effects and risk. FL has an average degree of correlation Model (REM) and Fixed Effects Model (FEM). with liquidity. Liquidity shows a moderate degree Fixed Effects Test, LM Test and Hausmantests are of negative correlation with profitability, size, used to select the appropriate models under growth and NDTS, and a modest positive consideration. Fixed Effects (F-test) helps to decide correlation with tangibility. Profitability shows a between Fixed Effects Model and OLS. The LM negative correlation between tangibility, growth test identifies whether REM or OLS is appropriate. and risk and a very low degree of positive We are unsuccessful not to reject the null correlation with NDTS. Tangibility portrays no hypothesis using LM test and conclude that REM is
relation with the growth as its value is close to zero. appropriate, which means that variance across the
Similarly, Size shows a low degree of positive companies under consideration is not zero. In other
correlation with Risk and NDTS. Growth indicates words, there exists significant difference across the
a negative correlation with NDTS and a very low companies under study. While the Hausman Test
positive correlation with risk. Risk explains a helps to decide between Random Effects Model
negative correlation with profitability and a low and Fixed Effects Model. On the basis of the
positive correlation with liquidity, size and growth. inferences shown in the above table we it conclude
It also indicates a high degree of correlation with that null hypothesis of the Hausman tests cannot be
financial leverage. NDTS shows a negative and a rejected at 10% significance level and hence REM
very low degree of correlation with all the other is more appropriate than OLS and FEM. Therefore
variables in the study. Correlations analysis shows OLS and FEM are not suitable to evaluate the
that there is no evidence of severe multi-relationship between Financial Leverage and the
collinearity among the variables under factors affecting Financial Leverage. It is also consideration. evident from the REM that we cannot reject the
hypothesis due to the absence of correlation association and rest of the variables has positive amongst firms? unobservable individual effects impact on financial leverage under both FEM and and Financial Leverage. But one can notice the REM. As per random effects model, growth is similarities of impact in terms of signs of all the significant positively at 1%, profitability and variables between FEM and REM. That is, tangibility are significant at 10%. profitability, tangibility and size has negative
OLS FEM REM
CONSTANT 0.011101
(0.112244)/ [0.098897]
0.210304
(0.239711)/ [0.877323]
0.102646
(0.154923)/ [0.662564]
GROWTH 0.038532
(0.030100)/ [1.280138]
0.035243
(0.021165)/ [1.665147]
0.038206***
(0.019362)/ [1.973262]
LIQ 0.011811
(0.007522)/ [1.570248]
0.001320
(0.006646)/ [0.198656]
0.002586
(0.006187)./ [0.417942]
NDTS -0.563190
(0.621066)/ [-0.906812]
0.217456
(0.538863)/[ 0.403546]
0.117471
(0.505762)/ [0.232266]
PROF -0.397566*
(0.140353)/ [-2.832617]
-0.395594**
(0.171035)/[ -2.312940]
-0.452902*
(0.146190)/ [-3.098039]
RISK 0.015852**
(0.007769)/ [2.040265]
-0.004172
(0.005503)/ [-0.758138]
-0.001447
(0.005355)/ [-0.270285]
SIZE -0.000338
(0.020827)/ [-0.016220]
-0.041596
(0.050760)/ [-0.819460]
-0.015621
(0.030522)/ [-0.511790]
TANG 0.738916*
(0.105154)/ [7.026977]
0.870520*
(0.175858)/ [4.950135]
0.823899*
(0.132740)/ [6.206878]
R2 0.704228 0.919370 0.535731
F Statistics 22.78937*** 28.77720*** 11.04469***
Fixed Effects (FTest) F(7, 53) = 6.67542***
Breush Pagan LM
test
Chi-square(1) =
41.0505***
Hausman test Chi-square(7) = 10.0432
Note : The values in small brackets ( ) are Standard Errors and the values in square brackets [ ] are statistic s.
Table 4: Panel Data Analysis
NICE Journal of Business • Vol. 11 • Nos. 1 & 2 • January - December, 2016 111
Determinants of Capital Structure in Automobile Companies
NICE Journal of Business • Vol. 11 • Nos. 1 & 2 • January - December, 2016 110
and the profitability. As the profit increases, CONCLUSION companies rely less on the external debt. But still automobile sectors seem to employ more long term We analysed the various the financial leverage debt. Higher financial leverage indicates the lower determinants, using the Panel data Models on 15 interest outflow despite its negative relation automobile companies. Our findings support the amongst capital structure and risk. Evidently, firms assumption of the theory of capital structure, called in the automobile sector have high growth the pecking order theory, which states an inverse opportunities with the growing demand in the relationship between the level of the debt employed
Poornima BG and Y.V. Reddy

NICE Journal of Business • Vol. 11 • Nos. 1 & 2 • January - December, 2016 112
sector, as the relation of growth with financial ownership structure. Journal of Financial leverage has been found positive, statistically Economics, 3(4), 305-360 significant in the study. This indicates, higher
Modigliani, F., & Miller, M. (1958). The cost of growth motivates the firm to raise lesser level of capital, corporation finance, and the theory of debt component in its capital structure which helps investment. American Economic Review, 48(3), to avail maximum amount of tax benefit and 261-297increase the amount available for the shareholders.
A positive statistical significant relation was also Modigliani, F., & Miller, M. (1963). Corporate found between financial leverage and tangibility. income taxes and the cost of capital, a correction, This supports the statistical significance of American Economic Review, 53(3), 433-443 variables determining the capital structure in the
automobile sector. The results support the Modigliani, F., & Miller, M. (1977). Debt and taxes. predications of pecking order theory. The study Journal of Finance, 32(2), 261-276helps companies in understanding the factors that
influence capital structure of a firm and design Myers, S. C., &Majluf, N. (1984). Corporate appropriate capital structure. financing and investment decisions when firms have information that investors do not have. Journal of Financial Economics, 13(2), 187-221 REFERENCES
Raj, Dhankar S, and Boora, S Ajit. (1996). Cost of Anshu, Handoo, and Sharma Kapil, (2014). "A Capital, Optimal Capital Structure, and Value of study on determinants of capital structure in India." Firm: An Empirical Study of Indian Companies." IIMB Management Review (Science Direct), 26, Vikalpa (IIM-A), 21 (3), 29-36 170-182
Saurabh, Chadha, and Sharma K Anil. (2015). Arindam, Banerjee, and De, Anupam (2015). Capital Structure and Firm Performance: Empirical Capital Structure Decisions and Its Impact on Evidence from India." Vision (Sage), 19 (4) 295-Dividend Payout Ratio during the Pre- and Post-302 period of Recession in Indian Scenario: An
Empirical Study. Vision (Sage), 19 (4), 366-377Venkatamuni, Reddy R, and Babu P Hemanth. (2008). Corporate Financial Structure in Indian
Chang, Chun, Xin Chen, and Guanmin Liao, Capital Market: A Case of Indian Pharmaceutical
(2014). What are the reliably important Industry. The ICFAI University Journal of
determinants of Capital structure in China?. Financial Economics (The ICFAI University
Pacific-Basin Finance Journal (Elsevier), 30, 87-Press), 6 (2), 70-85
113
Jensen, M., & Meckling, W. (1976). Theory of the firm: managerial behaviour, agency costs and
'One Belt, One Road' Initiative and China's Co-operation with South Asia: The Indian Perspective
"Someone is sitting in the shade today because someone planted a tree a long time ago."
Warren Buffett
Poornima BG and Y.V. Reddy
“One Belt, One Road” is China's ambitious project focussed on building networks of connectivity from China to Europe. The New Silk Road Economic Belt would run through the continents of Asia, Africa and Europe, connecting the vibrant East Asian economic circle, at one end, and the developed European economic circle at the other. As proposed, it would encompass countries with huge potential for economic development. The project, thus, aims at commercial growth through increased regional connectivity in terms of trade, investment, finance, and the flow of tourists and students.
Some of the initiatives agreed to during the China visit of Indian Prime Minister, Narendra Modi, in May 2015, indicated growing areas of cultural co-operation. Out of the 21 agreements signed by the two governments during the visit, many have the potential to promote people-to-people relationship and scholarly exchanges. These include: increasing the youth exchange from 100 to 200 people each year, joint research in areas like nuclear energy and space, and the granting of e-visas to Chinese tourists.
The OBOR initiative is intended to accelerate the trend towards a multi-polar world, economic globalisation, cultural diversity and greater IT application, in an attempt to promote global free trade and an open world economy. In one of its biggest economic initiatives, China is keen for India's co-operation. India's response to the OBOR, however, has been cautious, given the on-going issues between the two countries. These include a pending border issue, and China's ties with India's neighbours. The OBOR project will include the China-Pakistan Economic Corridor (CPEC) as its flagship project. The CPEC is expected to connect Kashgar in China with the Gwadar port in the unstable Baluchistan province of Pakistan. It will also pass through Pakistan-occupied Kashmir and Gilgit-Baltistan. These connections are likely to cause India some discomfort.
Security concerns notwithstanding, it makes good economic sense for India to become a part of the Chinese supply-chain of markets and resources, and to participate in the OBOR to develop its own capabilities, just as it has done in the case of the Asian Infrastructure Investment Bank and the BRICS New Development Bank.
Some measures for India's participation in OBOR can be suggested:
1. Develop and leverage the unique position of the Andaman and Nicobar Islands as a modern transport and regional shipping hub for the Bay of Bengal Basin.

GUIDELINES FOR WRITING BOOK REVIEW
We invite academicians and others to write reviews of books on business management allied subjects.
The book-reviewers are requested to follow the guidelines given below:
and
1. The reviewer should begin with a listing of the bibliographical details of the book, comprising the name(s) of the author(s), full title and sub-title of the book (as they appear on the cover), details of the place and name of the publisher, year of publication, number of pages in the book, whether hardbound or paperback, and the price, if mentioned.
2. The review can range from 1000 to 3000 words, depending on the topic and the importance of the book.
3. The review should engage with the theme of the book and the issues and problems raised, and should make a rigorous attempt to identify and assess the main arguments put forth by the author.
4. The review should be written in a manner and style that would qualify it as a short article in its own right.
5 The reviewer should provide a confrmation that this review has not been sent forpublication elsewhere and that the author will cede the copyright, if it is accepted for publication in NICE Journal of Business.
6 The book under review should have been published recently, preferably in the current or the previous year, and be preferably the new release.
7 The reviewer should also comment on the stylistic aspect and literary presentation of the book.
8 Bibliographical references should be avoided. If the references are considered
weaknesses, and an overall assessment by the reviewer.
essential, the citation style adopted by NICE Journal of Business should be used.
Thus, the review should be an objective assessment of the book, indicating its specifc strengths and
2. The next level would involve the development of the Chahbahar port to the west, with road and rail links to Central Asia; the Trincomalee port to the east, with shipping links to the Bay of Bengal littoral ports and beyond; the Mekong-Ganga corridor, linking India's east coast with Indo-China; and the Kaladan multi-modal transport corridor in Myanmar's Rakhine province, including the port of Sittwe. The proposed BCIM corridor could then become part of this broader network.
3. Once this primary circle has been secured, one could move on to progressively expanding circles as resources become available. What is important to note is that in this 21st century, strategy, security, and economics go together.
4. As of May 2015, there are over 13, 500 Indian students studying in China. On the other hand, the number of Chinese students studying in Indian universities has remained very low, at about 2,000, for the last few years. There is a large scope for increasing the number of Chinese students joining Indian universities, and vice a versa. In addition, interaction between the teaching faculty in the two countries should be enhanced through workshops and seminars.
5. Cultural exchange programmes should be increased.
6. Games and sporting competitions should be encouraged at the school and university levels. Such events will surely serve as effective avenues for strong personal ties. Friendship built through games and sports often lasts lifetimes and fosters mutual respect and admiration.
As major economies, the two neighbouring giants should cherish their 2,000-year-old relationship, join hands to deepen their friendship and strategic co-operation, and promote common development. This will be their contribution to peace and progress in the region and the world as a whole.
Prof. D.P.S. Verma

Azhar Kazmi & Adela Kazmi carried with persistence through the entire length of Strategic Management the book, chapter after chapter, with every one of
th4 ed. (2015) them beginning with a similar well-connected McGraw Hill Education (P) Ltd, Preview Case.
New DelhiPages: 676
Having built up a reputation for writing books Price: Not mentionedwhich are scientifically structured, logically laid out, and lucidly told, the Kazmis' appear to have no Romeo and Juliet, India and problem to continue in this vein. In using the Case the Taj Mahal, Shirin and Study as a pedagogical tool, they appear to have Farhad, we humans are fond of surpassed any ordinary author; it is difficult to pairs. So, here we once again have the long- calculate the number of real-life commercial standing pair Strategic Management and Prof. examples cited in support of the concept presented. Azhar Kazmi. This time, the famous two-some is
joined by yet another to make it a wholesome three-Every single case chosen by the authors is based on some: Dr. Adela Kazmi, an academician in her own the scenario obtaining in the Indian sub-continent. right. Prof. Kazmi's presence in this area is almost This has the dual benefit of the authors given. With each renewed edition, there is demonstrating insight into the overall economic increasingly ample demonstration of the depth of and non-economic macro and micro environment his research on the eco-commercial domestic and picture and ensuring that the reader is cajoled into global world, of the detailed comprehension he has concentrating on the larger framework that an of the genesis and evolution of this area spread over emerging economy, like ours, shows. the last three decades, of the talent he has in relating
the conceptual links to practical applications drawn As is typical of the well-known Kazmi thought liberally from the world of the body corporate and process, the book has clearly been laid out for both of the logical and structured mind he possesses, the serious student of management studies as well easily deciphered from the overall arrangement of as for the practising manager, irrespective of the the book. The credentials of the long-standing level of operation. There would certainly be a larger veteran author need no repetition, considering his number of business executives, keeping for ready contribution with exceptional focus to this area for reference, a copy of this latest offering in their more than three decades. He now receives the office.unflinching support of his co-author who brings
with her an outstanding academic track record. Add Although McGraw Hill has offices all over the to this, the cherry on the cake, as mentioned, the globe, the focus of the book clearly points to the book is co-authored by daughter Dr. Adela. They Indian audience. Once again, the subject coverage have brought together a covetable volume of great by the Kazmi's would more than adequately cover use to the students of management and related the assorted syllabi of almost all the leading disciplines.universities here.
The acknowledged best way to teach this subject is through the Case Study method. The book starts
Brief Critiquewith a bang: a short but relevant and timely business situation presented as a Preview Case, to
While a genuine and successful effort has been show the collateral damage caused if a firm does made to bring the book abreast with current not strategise. Part 5 of the Book on “Applying international changes, some areas warrant Strategic Management” has devoted an entire improvement. For example, the option of the Blue section for the novice, explaining the components Ocean strategy is now almost two decades old, yet and advantages of its methodology. This trend is one finds only a passing reference to it and even the
BOOK REVIEWS
NICE Journal of Business • Vol. 11 • Nos. 1 & 2 • January - December, 2016 117NICE Journal of Business • Vol. 11 • Nos. 1 & 2 • January - December, 2016 116
Sham Sharma Book Reviews
Subject Index at the end of the book has ignored it. Similarly, VRIO as an Internal Analysis standard Layout and Printing Qualitypractice has merely an 'honorable mention',
The design chosen for the cover page shows a whereas it certainly deserves better in-depth
mountaineer struggling to reach the top of a sheer treatment.
cliff; seemingly conveying the impression that success finally depends on grit, hard work and
Another seriously lacking zone is the area of determination. However, over the passing decades,
strategic formulation which forms Part 2 of the and with the current pressure that globalisation has
book. The coverage commences with the brought in, it has now been universally accepted
customary details of appraisals of the environment that success without teamwork is a pipedream.
and the firm, while ordinarily the author ought to have started with a description of the assorted
The quality of binding is high and the book can face approaches to this component of the strategic
the rigours of even an uncaring reader. management process. Thus, one does not find any coverage on the four imperatives, namely, economic, political, qualitative, and administrative
Overall Assessmentcoordination, nor has any reference been made to the four pre-dispositions: ethnocentric, This book leaves no doubt on the mastery of the polycentric, region-centric and geo-centric. authors has over their chosen subject. It is well laid Ignoring the imperatives and predispositions out and amply gilded with relevant examples and deprives the reader from any logic or justification citations. The book would constitute an excellent of arriving at the alternatives for entry strategies choice for the serious student.(either into a new industry or a new market/country). On a scale of 0 to 10, it would be unfair to award
anything lower than a 6.Again, it is puzzling why the concept of strategy formulation analytical framework (SFAF) consisting of its eight matrices, has been neglected. Ideally, given the author's penchant for making Prof. Sham Sharmaavailable appropriate real-time business situations, Ex-Memberone would have liked to see individual case studies Board of School of Business Studiesfor each of the individual matrix of SFAF as well as Shobhit University, Meerutnot forgetting to mention a word on the limitations email: [email protected] this useful tool being currently deployed in the Indian corporate world.
Harsh V Verma and Ekta Duggal elevates marketing to just not a function, rather seeing Marketing the whole business from the customer's point of view.
Oxford University Press, Delhi According to Theodore Levitt, the entire corporation 2015 ed. must be viewed as a customer-creating and customer-
Pages: 442 satisfying organism. In fact, marketing cannot be Price: Rs. 425
confined to a certain set of activities; rather it must be viewed as a business philosophy.
Marketing is primarily seen as a set of activities or a process aimed at
Any textbook on Marketing must aim at two aspects: to achieving certain objectives that
make the students understand marketing as a set of revolve around the customer satisfaction. However, the
activities and processes aimed at identifying and soul of marketing is touched when Peter Drucker
satisfying consumers; and to make them learn to see

marketing not just as a function, but a philosophy of book has a case study at the end of each chapter business to view the whole business from the which is likely to help the reader build a better customers' point of view. A marketing textbook's understanding of the subject and its implications in rating depends on its ability to achieve both the the real business world, enabling her to use this objectives. understanding in her profession later.
'There are plenty of textbooks on marketing', as put Another noticeable and appreciable aspect of the forth by the authors of the book under review, book is to put across an example of a brand and falling into the bipolar extremes, where one set of company, alongside the explanation of each books are big and bulky to the extent that they lose concept and principle. It helps to understand how the coherence and ease of reading, and the other set the particular concept is being used by the offers a 'quick fix', compromising on content, particular brand or company to better its marketing pedagogy, and presentation. On this parameter, the strategies, or how a particular brand or company book is surely a new addition to the book shelf and suffered for lack of properly applying the particular it seems to make a perfect balance between the two concept or principle. This is likely to better the extremes, 'too lengthy,' and 'too brief,' and seems to ability of the reader in linking the theory to the achieve its objective to help the student get well- practice and, to learn about various brands, versed with the subject of marketing. companies and their strategies thereby helping her
broaden her horizon of understanding of the The book under review is a good attempt on the part subject.of the authors to put all relevant concepts in a precise and concise manner, without compromising The difference between great and good lies in on the basic objective of a textbook-creating a clear simplifying the difficult, especially when it comes understanding in the mind of the reader. The book to writing a great textbook. And, it is more of a has 15 chapters and an equal number of case studies journey rather than the one-time endeavour. The at the end of each chapter, spread across 427 pages. book raises the expectations when it starts each
chapter with an example, and almost each concept The book adopts a nice methodology to build a is attached to a matching empirical example from rapport with the reader by initiating the dialogue in the business world, but such examples are missing the form of putting questions and then building the in the last few chapters (Chapters 11, 12, and 13). In discussions around it, somewhat like legendary a few chapters, the reader might notice the lack of McCarthy used in his classic text book, Basic linkage between the title, learning objectives, Marketing. The authors go on to strengthen this beginning of the chapter, and the concept rapport in creating a better understanding of the explained. For instance, Chapter 9, on Promotion is basic concepts by way of linking these concepts to likely to confuse the reader to find coherence well-known examples from the real business world between the title of the chapter, and the abrupt start and the print ads. of the subject, and learning objective with
communication model, instead of the discussion on The reader is likely to hold a very high view of the promotion as a concept and its relevance. Similarly, impressive use of various cases, social and business chapters on Consumer Buying Behaviour and facts, and empirical studies by putting them in a Pricing Decisions make it difficult for the readers to separately encased text box to enlarge the readers' make coherence between the introduction and understanding, viewpoint, and imagination as to further discussion on the concept. The chapter on how theory links with the empirical business world. Consumer Buying Behaviour abruptly jumps to Though, at places, it seems to have been overdone. consumer buying perspective and chapter on Each chapter in the book starts with a separately- Pricing Decisions starts with Market Structure, and –distinctively-placed, 'Introduction,' which not which might be confusing to the reader to only gives a brief, account of the chapter, but also comprehend. Instead, the authors could have begun its importance, and relevance vis-à-vis the with an introduction of the concept, its significance preceding and succeeding chapters. Similarly, the for marketing and the firm, and then move to
NICE Journal of Business • Vol. 11 • Nos. 1 & 2 • January - December, 2016 119NICE Journal of Business • Vol. 11 • Nos. 1 & 2 • January - December, 2016 118
Sanjeev Kumar Book Reviews
further discussion. Likewise, Chapter 7, on Product discussion on new developments in marketing Development and Life Cycle, starts with New appears incomplete without e-retailing and online Product Development and its process, instead of a marketing. A full chapter on the same would have discussion on Product Development and Life been a meaningful addition. Cycle. The very first chapter though proceeds well, but the introduction and the examples given therein As discussed earlier, a good marketing textbook, might confuse the reader taking marketing firstly must be able to make readers understand primarily as selling. Already, many people confuse 'marketing' as a concept consisting of certain marketing for selling; this might add a bit more. activities, and, secondly, but more importantly, to
further marketing as a business philosophy. On the It would have added to the ease of the reader if the first parameter, the book can surely stand on a chapters were to start with a brief discussion on the higher pedestal, but on the second parameter, the concept itself, including its definition, as has been book is yet to travel a long. On the whole, the book done in the chapter on Channels of Distribution. is a welcome addition to the existing set of good However, it is missing in most of the chapters. On marketing textbook. There are not many well-the same lines, a diagram or flow-chart would have written and compact textbooks on marketing in the eased it for the readers to fathom certain processes, Indian context. This book surely is the one to bridge models and concepts, like marketing management the gap. process, marketing environment, and new product development process. Prof. Sanjeev Kumar
Haryana School of Business,A few additions in the book, like a chapter on Guru Jambheshwar Universitymarketing strategies and planning and marketing of Science and Technology,mix, would have enhanced the readers' Hisarunderstanding, especially when these terms are email: [email protected] used in the book, like sustainable marketing mix, green marketing mix, social marketing mix and the like, (Chapter 14). A
Michael Armstrong and Stephen enhance the well-being of employees.Taylor
Armstrong's Handbook of Human The book under review is the revised version of a Resource Management Practicewell-known reference book for students and Kogan Page Publishers
th practitioners of HRM. It seeks to help students in 13 ed. (2014)Pages: 880 understanding the role and concept of human
Price: Not mentioned resource for achieving the objectives of employees as well as the organisation. It ensures a complete resource for understanding and implementing HR Human resource management in the business organisation. It includes the in-is a comprehensive approach to, and is concerned depth coverage of the key areas essential to the HR with, all aspects of how people are employed and function. It also provides an insight into the various managed in an organisation. It is regarded as a elements of HRM. The present treatise is an philosophy of how people should be managed, authentic presentation of contemporary concepts which is underpinned by a number of theories and practices of human resource management. This relating to the behaviour of people and edition enables the readers to have access to the organisations. The application of policies and subject combining with clear explanations, with practices in the fields of organisation design and support of illuminating case studies to assist the development, employee resourcing, training and learning process.development, performance appraisal, reward,
compensation and provision of services that

This reference book is organised into eleven parts. concerns in human resource management. Part 1 introduces the practices of HRM and covers However, the provisions of the Indian law the essence of human resource with strategic pertaining to employee-employer relations do not human resource management and 'human capital find place in this book. 'The ignorance of law is no management' and its various dimensions. Part 2 excuse'; this is particularly true about the law of the covers the human behaviour, organisation design land. and development. Part 3 discusses the factors that affect employee behaviour. Parts 4, 5, and 6 deal For the provisions of the Indian law pertaining to with the motivation, employee development, HRM and industrial relations, the reader would leadership and various reward management have to depend on a book written in the Indian practices which enhance the efficiency and efficacy context. This is the major limitation of book. of the employees. The book would help the students in highlighting
the overall context of HRM through relevant Parts 7 and 8 cover strategic employee- relations examples. Comprehensive online support material with industrial relations and practices of employee is provided for the instructor, student and the well-being, covering health, safety, and welfare practioner, providing a complete resource book for issues. Parts 9 and 10 of the book discuss the teaching and self-learning.international framework of human resource, procedures, policies and the skills that help in This handbook would very well cater to the needs building the human resource skills and practices. of post-graduate students and teachers of
commerce and business management.In addition, the book has two sections of 'Toolkits', with easily-applicable skills and knowledge for the Dr. Neha Yajurvedipractioners in HRM. The book has been updated Assistant Professorthroughout to reflect the latest thinking in HRM. It Shobhit University, Meerutincludes new information on employment law (of email: [email protected] USA) and a detailed look at international
T V Rao ways that help improve effectiveness of people. Effective People,
Random House, India, The book is a brief but excellent account of some of 2015 the high achievers in India. It is based primarily on
Pages 408, Rs 399 personal experience and interaction with the people the author had met on his commendable journey as
For their survival and an academic, motivator, researcher, institution-growth, organisations face builder and an author. Apart from the people who the challenge of managing have been associated with him, he has also picked people effectively. When some who have not directly affected him, but have Philip Kotler, the doyen of influenced his thinking on the factors which make a
marketing, visited India and was asked to add one person effective. The criterion for selecting more 'P' to McCarthy's 4 P's of marketing, his effective persons included in the book is his response was quick and focussed, 'It has to be personal definition of an effective person, which is:People'. Dale Carnegie had said that for excelling business results. 85% is people management and 'Any one who discovers inner talent, uses it to make the remaining 15% is management of all other a difference in the lives of other people in a way that resources. It is in this context that when I learnt benefits them can be considered an effective about this title, Effective People written by the person. We are all born talented and in different father of HRD in India, Professor TV Rao, there se t t ings . However, some master the ir was no second thought but to find his take on the circumstances and manage them through their
NICE Journal of Business • Vol. 11 • Nos. 1 & 2 • January - December, 2016 121NICE Journal of Business • Vol. 11 • Nos. 1 & 2 • January - December, 2016 120
Neha Yajurvedi Book Reviews
inner talent, These people may be teachers, social some prominent civil servants who displayed their workers, doctors, nurses, lawyers, entrepreneurs, commitment to the cause of educational well-being civil servants, development workers, businessmen, of the people. The names of Inderjit Khanna and managers, chartered accountants, scientists, Anil Bordia stand out as effective bureaucrats, who actors, or self-employed, etc.’ played their role in drafting key education policies
and spearheaded such initiatives. Moreover, the The selection of people has been his personal profiles and journeys of N Vittal (a civil servant choice, based on the above-mentioned criterion and known for his concern for transparency), Vinod Rai further through engagements on the social media (CAG who walked extra mile to unearth some apart from the literature that he went through, infamous scams, like the 2G, CWG, and the reading the works of authors who have written on Coalgate), D R Mehta (bureaucrat who had strong successful and effective people. I would like to concern for social causes), E Sreedharan divide the book into three sections (though the (bureaucrat-turned Metro Man), Kiran Bedi (first author has not done that). The first section as the lady IPS and social activist), K P C H Gandhi Background (Introduction – Chapter 1), the second, (known for his contribution on forensic sciences as Profiling Effective People (Chapters 2 to 8), and and zero-pendency), Arvind Kejriwal, Jaiprakash the third, as Takeaways or Lessons (Chapters 9 to Narayan are narrated with the lessons that a 16). The book profiles effective people in seven manager or any person who want to be effective can categories, viz., doctors, film actors, civil servants, learn. All these people are said to be restless, hard-educational entrepreneurs, professors, social working, having development goal in mind, workers, and other professions. strongly driven by their value system, innovative,
and creative. Out of the doctors that he profiles and brings out their propositions for being effective, Dr MC Modi The learning from effective people in the category ( O p h t h a l m o l o g i s t ) , D r P r a t a p R e d d y of educational entrepreneurs is that all of them (Cardiologist), Dr Devi Shetty (known for open- thought differently and had a strong desire to create heart surgeries), and Dr Naresh Trehan an institution which caters to the educational needs (Cardiovascular & Cardiothoracic surgeon) stand of society. The knowledge of the task, will power out and their common purpose to save lives along to face the challenge, and the ability to engage with with strong determination to leave behind a rich the stakeholders could make them effective as legacy make them effective. The lives of film educational leaders. Effectiveness lessons drawn actors, like AnupamKher, KanganaRanaut, from the experiences of professors are placed Amitabh Bachchan, Aamir Khan, and Shah Rukh succinctly as in-depth knowledge, commitment to Khan, have been narrated giving their contribution the cause, innovativeness in thinking and delivery, and achievements. Though they play the role as strong sense of institution-building, and proper assigned to them, as individuals, their work succession planning through creating and behaviour, commitment, style, and discipline make patronising the next-generation professors. them effective. The roles they have played have left the audiences with some strong messages to carry All the chapters profiling different professions and practical values to follow in order to remain ended with effectiveness lessons and an interesting effective. Managers can really learn lot from their exercise having Self-Assessment Tool, based on life journeys, their characters, and their profession- specific effectiveness requirement personalities. Learning from failures is a very which one could assess based on the five-point strong message that one draws from the story of Likert scale. This makes the book rich, valuable, Amitabh Bachchan. and practical. Personally, I really liked all the tools
given as they provide strong variables for judging The personal involvement of the author with some effectiveness of the profession vis a vis the civil servants for developing a better education individual. system in India, provided insights into the lives of

The third section (Chapters 9 to 16) deals with eight leading to organisation-building vis a vis nation-building. important takeaways (or lessons) which could be
used by a manager or any individual who aspires to These are necessary virtues for becoming effective achieve the target. This is where the author's people. All these chapters also have a series of contribution becomes highly important. These questions at the end guiding the reader for search eight lessons are found to be common in all the and resolution within order to be effective. The effective people discussed in the book and as the examples given by the author are exemplary and author believes if one concentrates on these are quite practical and many of them come from determinants, one could become effective in management institutes, Bollywood movies, cricket whatever he or she does. These eight key points are: world, bureaucracy, and the government system. Almost all the individuals profiled in this volume 1. Effective People Think Differently' (Chapter 9):
So one has to find out one's inner talent through have created great institutions. I was expecting a experimentation and concentrate on capitalising detailed profile of TN Sheshan who redefined the on that through thinking differently. role of Chief Election Commissioner in India and
ever since the whole process of elections in India 2. Effective People Stretch Their Talent' (Chapter has undergone transformation. The book is
10): Exploring new vistas and opportunities by autobiographical at many places which makes it stretching the limits in different situations. very selective yet interesting part of the book is its
first person narrative as a style of writing.3. Effective People Consider Values as Core
Driver's (Chapter 11): Being firm in matters of All the lessons are fully applicable for any manager principle and maintaining high value standards working in an organisation, be it profit-making or which are the result of bringing up (family and otherwise. And to that end, this project of the author environment) without succumbing to pressures is successful in guiding all its readers. The author and establishing superordinate goals. states that his aim is to write a book that can help
many more people to become effective (p.13). I am 4. Effective People are Compassionate' (Chapter
sure it really makes a lot of sense and would 12): Sense of togetherness and concern for
certainly be a practical guide for all its readers. others coming through empathy.
People are an important resource for any 5. Effective People Live with Purpose' (Chapter organisation. This book makes an effective effort to 13): Strong commitment to the purpose as per teach the nuances of leading and being effective. their vision, mission and goal helping in This excellent book deserves a place in the shelf of achieving the goal.all those who aspire to achieve greater heights in their professional career or entrepreneurial venture. 6. Effective People Reach out to Many' (Chapter ------------14): Looking outward and connecting with the
stakeholders through different modes by being perseverant and positive.
Prof. Vijay Kumar Shrotryia, Department of Commerce, 7. Effective People Take Initiative and Build
Delhi School of Economics, Institutions (Chapter 15): Displaying strong University of Delhi, sense of initiation and responsibility to build
great institutions to contribute for good and Delhi 110007 sustenance. e-mail: [email protected]
8. Effective People are Integrative, not Divisives' (Chapter 16): Inclusiveness and not exclusiveness to be practiced at all levels, by imbibing the virtue of integrating personality
NICE Journal of Business • Vol. 11 • Nos. 1 & 2 • January - December, 2016 122
Vijay Kumar Shrotryia
NICE Journal of Business
(Half-yearly Journal of School of Business Studies, Shobhit University, Meerut)
Subscription Rates
I/We wish to subscribe to the NICE Journal of Business. Please accept the enclosed cheque/demand draft No.
.................................................................................., dated ......................................................................., drawn
on....................................................................................................Bank, favouring 'Shobhit University' for ?/US$
............................................ towards subscription of NICE Journal of Business, payable at Meerut, for one
year/three years.
Mail to: The EditorNICE Journal of BusinessSchool of Business Studies Shobhit University, Modipuram, Meerut-250 110 (INDIA)email: [email protected]
SUBSCRIPTION ORDER FORM
Name : ...........................................................................................................................................................................
Organisation: ................................................................................................................................................................
Mailing Address: ..........................................................................................................................................................
......................................................................................................................................................................................
......................................................................................................................................................................................
City: .................................................. PIN/ZIP. -............................ Country -...............................................................
E-mail:.........................................................................................................................................................................
—————————————————————————————————————————————
1 Year 3 Years
Abroad India AbroadIndia
Individual
Institutions*
Subscriber
?800
?1000
US$ 80
US$ 100
?2000
?2500
US$ 200
US$ 250
*20% discount on direct subscription

Statement of Ownership and Other Particulars about the Journal
NICE Journal of Business(Half-yearly Journal of Shobhit University, set up by NICE Society, Meerut)
Form IV(See Rule 8 of the Newspapers (Central) Rules, 1956)
1. Place of Publication Meerut
2. Periodicity of Publication Half-yearly
3. Publisher's Name Kunwar Shekhar VijendraNationality IndianAddress NICE Society
ModipuramMeerut-250 110
4. Editor's Name Prof. D.P. S. VermaNationality IndianAddress Shobhit University
ModipuramMeerut-250 110
5. Name and address of individuals NICE Society who own the newspaper and partners Modipuramor shareholders holding more than Meerut-250 110one per cent of the total capital
6. Printed at Surya Design & DisplayA-32, Naraina Industrial AreaPhase –I, New Delhi-110028Ph.: 9810060367
I, Kunwar Shekhar Vijendra, do hereby declare that the particulars given above are true to the best of my knowledge and belief.
(Shobhit University)
(Shobhit University)
Sd/-Kunwar Shekhar Vijendra
Publisher

GUIDELINES FOR AUTHORS
NICE Journal of Business invites academicians and professionals to contribute research papers, articles, abstracts of doctoral dissertations, major research project reports, case studies, comprehensive bibliography, and book reviews.
The following are the guidelines for the authors:1. The contribution must be original, neither published nor under consideration for publication anywhere else.2. The cover page should contain the title of the paper, author's name, designation, official address, contact phone/ fax number,
and the e-mail address. The next page should contain an abstract of not more than 150 words, along with five key words. The main text should not contain the author's name.
3. References should be given at the end of the manuscript and should contain only those cited in the text of the manuscript. These should be given in an alphabetical order of the first author's surname.
4. References should be given on the following pattern:(i) For books written by two or more authors:
Kotler, Philip, and Gary Armstrong (2016), Principles of Marketing,15th ed. (New Delhi: Pearson Education) (ii) For journal articles:
Tanmay Chattopadhyay, Shivani Shraddha, and Mahesh Krishnan (2010), “Marketing Mix Elements Influencing Brand Equity and Brand Choice”, Vikapla, Vol. 35, No. 3 (July-September), pp. 67-84
(iii) For unpublished Ph.D. theses and M. Phil. dissertations:Deepa Sharma (2008), Corporate and Public Redressal Systems for Consumer Grievances, unpublished Ph.D. thesis, Delhi University, Department of Commerce, Delhi, pp. 42-49.
5. Notes (Footnotes) should normally be avoided. If necessary, it should be indicated by serial number in the text (1, 2…) as also at the end of the research paper just before references. Notes should not be mixed with references.
6. Figures and tables should be numbered consecutively, in international numerals, and should appear soon after the text where they are cited first. The figures should be accommodated within two-thirds of the A-4 size paper. All the figures and tables must be suitably captioned.
7. Please check your manuscript for clarity, grammar, spelling, punctuation, and consistency of references to minimize editorial changes.
8. Please follow British spellings throughout: 'programme', 'not program'; 'organisation', 'not organization'; 'behaviour', 'not behavior'.
9. The use of capitalisation should be kept to the minimum, except in case of proper nouns, and should be followed consistently.10. The ideal size of the manuscript is 5,000 to 7,500 words (20 to 30 pages).11. The manuscript should be in double space; in 12-points font size, on A-4 size paper, leaving 4 cms. margin on all sides, so as
to facilitate editing and styling. All texts, including abstract, quotations, notes and references should be typed in double-space.
12. Authors using a questionnaire for collection of data for preparing the paper should send a copy of the questionnaire, along with the manuscript.
13. The contribution should be sent as an e-mail attachment to: with a copy to The contributions received for publication shall be referred to two experts on the subject,
for review and evaluation, after a preliminary review in the editorial office.14. Correspondence and proofs for correction, if required, will be sent to the first-named author, unless otherwise indicated.
Corrected proofs should be returned within a week.15. The forwarding letter must include a certificate by the authors to the effect that the article is original and an exclusive
contribution to NJB and shall not be released for publication elsewhere unless the Editor's decision not to publish it has been communicated to the author.
16. The final decision on the acceptance or otherwise of the paper rests with the Editor/Editorial Board, and it depends entirely on the standard and relevance of the paper.
17. The final draft may be subjected to editorial amendments to suit the Journal's requirements.18. The author will be supplied one copy of the Journal free of charge, soon after its publication.19. The copyright of the articles and other material, published in the Journal, shall lie with the publisher.20. While sending the manuscript, please state that the 'Guidelines for Authors' (for authors of NICE Journal of Business),
have been followed. A manuscript which does not conform to the guidelines may not be considered for publication.21. The references to websites should be kept to the minimum. The date of accession of the website should invariably be
mentioned within brackets.

All correspondence pertaining to editorial and circulation matters may be addressed to:
The Editor, NICE Journal BusinessSchool of Business Studies, Shobhit University, Modipuram, Meerut - 250 110
email: [email protected] | Phone: 0121-2578600, 8267018005
Any opinion expressed in any article, published in NICE Journal of Business, does not necessarily represent the view of the Shobhit University/NICE Society, Meerut, or the Editor. Any material published in the Journal may not be reproduced or reprinted, in any form, without prior permission from the Editor/Publisher