
Next Generation Debugging
50
Next Generation Debugging
Transcript of Next Generation Debugging

NextGenerationDebugging
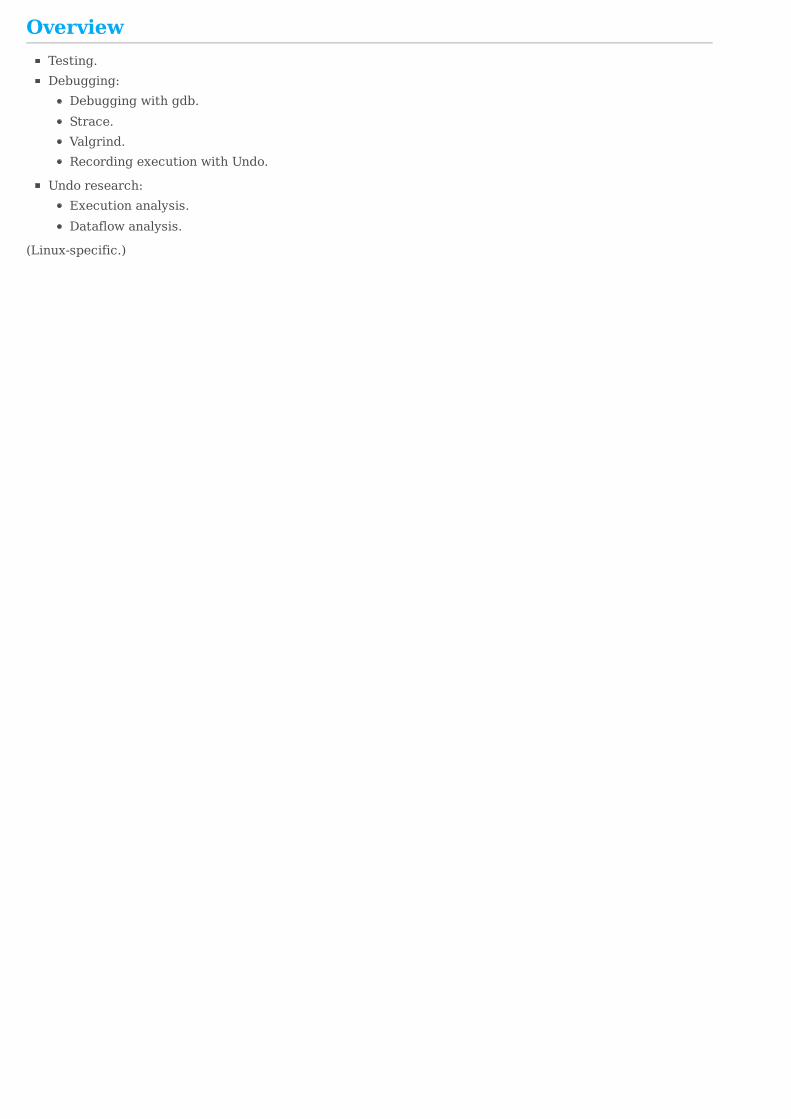
OverviewTesting.Debugging:
Debuggingwithgdb.Strace.Valgrind.RecordingexecutionwithUndo.
Undoresearch:Executionanalysis.Dataflowanalysis.
(Linux-specific.)

Testinghaschanged:
Resultingin:
Testing.
Continuousintegration.Test-drivendevelopment.Cloudtesting.
1,000softestsperhour.Manyintermittenttestfailures.Verydifficulttofixthemall.

Testing.Securitybreaches.Productionoutages.Unhappyusers.

Fixingtestfailuresishard.
Testing.
Recreatecomplexsetups:Multi-application.Networking.Multi-machine.
Re-runflakeytestsmanytimestoreproducefailureRecompile/linkwithchangeswheninvestigating.
Changesbehaviour.Slow.Requiresadevelopermachine.

Fixingtestfailuresisslow.
Testing
Reproducingslowfailuresis…slow.Reproducingintermittentfailuresisalsoslow.
Requiresrepeatedlyrunningatestmanytimesinordertocatchthefailure.
Criticalbugs:
Canoccuroneinathousandruns.Eachruncantakehours.

Toolstofixtestfailures
Testing.
Debuggers.Logging.Systemlogging.Memorycheckers.Recordingexecution+reversibledebugging.

GDB
Debugging.
Betterthanyoumayremember:TUImodeshowssourcecodewithinterminalwindow:
gdb--tui
OrtogglewithCtrl-XCtrl-A.
GDB-7usespythonasextensionlanguage.Scripteddebugging,e.g.toreproduceintermittentfailures.
Compilerscangeneratedebugsymbolsevenforoptimisedcode:gcc-O2-g...
Optimisationmaygivenon-linearresultswhensteppingthroughcode.
Miscellaneous:Showbacktraceofallthreads:threadapplyallbt.Showstackpointeroffirstfourthreads:threadapply1-4print$sp.Conveniencevariables:print$ax,print$pc,print$_exitcode.Showsourceforanaddress:infoline*0x12345678.Showaddressboundsofcurrentline:infoline*$pc.Showaddressofsourcecodeline:infolinefoo.c:42.

Pythonscriptinginundodb-gdbandgdb.GDBsupportspythonasanextensionlanguage.Usedbyundodb-gdb.
Capturinganintermittentfailure.Createpythonscriptandrunwith:
(gdb)sourcefoo.py
(undodb-gdb)sourcefoo.py
Examples:
repeat_until_non_zero_exit.py
repeat_until_breakpoint.py
repeat_until_signal.py

Pythonscriptinginundodb-gdbandgdb.repeat_until_non_zero_exit.py'''Repeatedlyrundebuggeeuntilitfails.'''importgdb
while1:print'-'*40gdb.execute('run')e=gdb.parse_and_eval('$_exitcode')print('$_exitcodeis:%s'%e)ife!=0:break

Pythonscriptinginundodb-gdbandgdb.repeat_until_breakpoint.py'''Repeatedlyrundebuggeeuntilithitsabreakpoint.'''importgdb
events=[]defevent_handler(event):events.append(event)gdb.events.exited.connect(event_handler)gdb.events.stop.connect(event_handler)
while1:print'-'*40events=[]gdb.execute('run')breakpoint=Noneforeventinevents:ifisinstance(event,gdb.BreakpointEvent):breakpoint=eventbreakifbreakpoint:print('havehitbreakpoint:%s'%breakpoint)break

Pythonscriptinginundodb-gdbandgdb.repeat_until_signal.py'''RepeatedlyrundebuggeeuntilitreceivesSIGSEGV.'''importgdbimportsignal
events=[]defevent_handler(event):events.append(event)gdb.events.exited.connect(event_handler)gdb.events.stop.connect(event_handler)
while1:print'-'*40events=[]gdb.execute('run')breakpoint=Noneforeventinevents:if(isinstance(event,gdb.SignalEvent)andevent.stop_signal=='SIGSEGV'):breakpoint=eventbreakifbreakpoint:print('havehitbreakpoint:%s'%breakpoint.stop_signal)break

Examples.
Pythonscriptinginundodb-gdbandgdb.

GUIsforgdbaregettingbetter:
Debugging.
CLion.Eclipse.QtCreator.KDbg.Emacs.

Logging.Cansometimesworkwell.Needtocontrolwhattolog.
Defineareasoffunctionalityandassigndifferentdebuglevels.E.g.parser,lexer,network.Moredetailed:memoryallocator,socket,serialiser.
Wecandefinedebuglevelsfordifferentcategoriestomatchthebugweareinvestigating.
Thiscangetcomplicated.
logcategory_t*io_category=...;logcategory_t*serialisation_category=...;...logf(io_category,"haveread%zibytesfromsocketfd=%i",n,fd);...logf(serialisation_category,"serialised%pto%zibytes",foo,actualsize);...

Problemswithloggingcategories.
Logging.
Howmanycategories-howdetailedshouldwego?
Dependsonthebugweareinvestigating.Mayneedtorecompilewithnewcategories.
Whatcategorydoweuseforcodethatwritesserialiseddatatoafile-io_categoryorserialisation_category?
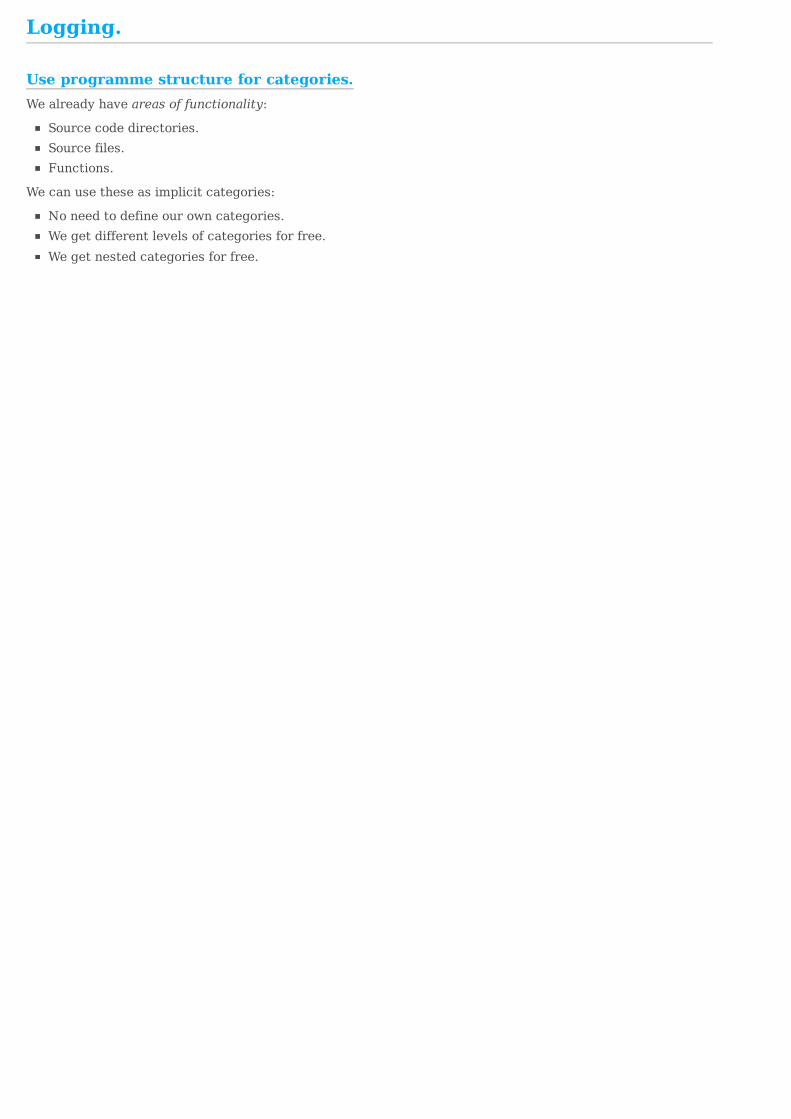
Useprogrammestructureforcategories.
Logging.
Wealreadyhaveareasoffunctionality:
Sourcecodedirectories.Sourcefiles.Functions.
Wecanusetheseasimplicitcategories:
Noneedtodefineourowncategories.Wegetdifferentlevelsofcategoriesforfree.Wegetnestedcategoriesforfree.

Controllingverbosityprogrammatically:
Logging.
debug_add("network/socket",NULL,1);//Extraverboseforalldiagnosicsinnetwork/socket*.*.
debug_add("network/",NULL,1);debug_add("network/socket",NULL,1);//Extraverboseforalldiagnosticsinnetwork/*.*.//Evenmoreverboseinnetwork/socket*.*.
debug_add("heap/alloc.c","",1);debug_add("network/socket.c",Send,2);debug_add("parser/","",-1);//Verboseforheapoperations.//Veryverboseforalldiagnosticsinnetwork/socket.c:Send().//Lessverboseinparser/.

Controlverbositywithenvironmentalvariables:
Example:
Logging.
QA-friendly.Noneedtorecompile/link/build.Activateloggingindifferentpartsoftheprogrammedependingonthebugwhichisbeinginvestigated.
DEBUG_LEVELS="heap/alloc.c=1parser/=-1network/socket.c:Send=2"myprog...

Strace.Linux/unix-specific.
Getadetailedlogofallsyscalls.
>stracedateexecve("/bin/date",["date"],[/*34vars*/])=0brk(0)=0xd50000access("/etc/ld.so.nohwcap",F_OK)=-1ENOENT(Nosuchfileordirectory)mmap(NULL,8192,PROT_READ|PROT_WRITE,MAP_PRIVATE|MAP_ANONYMOUS,-1,0)=0x7f7602059000access("/etc/ld.so.preload",R_OK)=-1ENOENT(Nosuchfileordirectory)open("/etc/ld.so.cache",O_RDONLY|O_CLOEXEC)=3</etc/ld.so.cache>fstat(3</etc/ld.so.cache>,{st_mode=S_IFREG|0644,st_size=144491,...})=0mmap(NULL,144491,PROT_READ,MAP_PRIVATE,3</etc/ld.so.cache>,0)=0x7f7602035000close(3</etc/ld.so.cache>)=0access("/etc/ld.so.nohwcap",F_OK)=-1ENOENT(Nosuchfileordirectory)open("/lib/x86_64-linux-gnu/libc.so.6",O_RDONLY|O_CLOEXEC)=3</lib/x86_64-linux-gnu/libc-2.19.so>read(3</lib/x86_64-linux-gnu/libc-2.19.so>,"\177ELF\2\1\1\3\0\0\0\0\0\0\0\0\3\0>\0\1\0\0\0P\34\2\0\0\0\0\0"...,832)=832fstat(3</lib/x86_64-linux-gnu/libc-2.19.so>,{st_mode=S_IFREG|0755,st_size=1738176,...})=0mmap(NULL,3844640,PROT_READ|PROT_EXEC,MAP_PRIVATE|MAP_DENYWRITE,3</lib/x86_64-linux-gnu/libc-2.19.so>,0)=0x7f7601a90000mprotect(0x7f7601c32000,2093056,PROT_NONE)=0mmap(0x7f7601e31000,24576,PROT_READ|PROT_WRITE,MAP_PRIVATE|MAP_FIXED|MAP_DENYWRITE,3</lib/x86_64-linux-gnu/libc-2.19.so>,0x1a1000)=0x7f7601e31000mmap(0x7f7601e37000,14880,PROT_READ|PROT_WRITE,MAP_PRIVATE|MAP_FIXED|MAP_ANONYMOUS,-1,0)=0x7f7601e37000close(3</lib/x86_64-linux-gnu/libc-2.19.so>)=0mmap(NULL,4096,PROT_READ|PROT_WRITE,MAP_PRIVATE|MAP_ANONYMOUS,-1,0)=0x7f7602034000mmap(NULL,4096,PROT_READ|PROT_WRITE,MAP_PRIVATE|MAP_ANONYMOUS,-1,0)=0x7f7602033000mmap(NULL,4096,PROT_READ|PROT_WRITE,MAP_PRIVATE|MAP_ANONYMOUS,-1,0)=0x7f7602032000arch_prctl(ARCH_SET_FS,0x7f7602033700)=0mprotect(0x7f7601e31000,16384,PROT_READ)=0mprotect(0x60e000,4096,PROT_READ)=0mprotect(0x7f760205b000,4096,PROT_READ)=0munmap(0x7f7602035000,144491)=0brk(0)=0xd50000brk(0xd71000)=0xd71000open("/usr/lib/locale/locale-archive",O_RDONLY|O_CLOEXEC)=3</usr/lib/locale/locale-archive>fstat(3</usr/lib/locale/locale-archive>,{st_mode=S_IFREG|0644,st_size=1607760,...})=0mmap(NULL,1607760,PROT_READ,MAP_PRIVATE,3</usr/lib/locale/locale-archive>,0)=0x7f7601ea9000close(3</usr/lib/locale/locale-archive>)=0open("/etc/localtime",O_RDONLY|O_CLOEXEC)=3</etc/localtime>fstat(3</etc/localtime>,{st_mode=S_IFREG|0644,st_size=3661,...})=0fstat(3</etc/localtime>,{st_mode=S_IFREG|0644,st_size=3661,...})=0mmap(NULL,4096,PROT_READ|PROT_WRITE,MAP_PRIVATE|MAP_ANONYMOUS,-1,0)=0x7f7602058000read(3</etc/localtime>,"TZif2\0\0\0\0\0\0\0\0\0\0\0\0\0\0\0\0\0\0\7\0\0\0\7\0\0\0\0"...,4096)=3661lseek(3</etc/localtime>,-2338,SEEK_CUR)=1323read(3</etc/localtime>,"TZif2\0\0\0\0\0\0\0\0\0\0\0\0\0\0\0\0\0\0\10\0\0\0\10\0\0\0\0"...,4096)=2338close(3</etc/localtime>)=0munmap(0x7f7602058000,4096)=0fstat(1</dev/pts/50>,{st_mode=S_IFCHR|0620,st_rdev=makedev(136,50),...})=0mmap(NULL,4096,PROT_READ|PROT_WRITE,MAP_PRIVATE|MAP_ANONYMOUS,-1,0)=0x7f7602058000write(1</dev/pts/50>,"Mon26Sep12:27:50BST2016\n",29Mon26Sep12:27:50BST2016)=29close(1</dev/pts/50>)=0munmap(0x7f7602058000,4096)=0close(2</dev/pts/50>)=0exit_group(0)=?+++exitedwith0+++
Subsetofsyscalls-fileoperations:
>strace-y-etrace=filedateexecve("/bin/date",["date"],[/*34vars*/])=0access("/etc/ld.so.nohwcap",F_OK)=-1ENOENT(Nosuchfileordirectory)access("/etc/ld.so.preload",R_OK)=-1ENOENT(Nosuchfileordirectory)open("/etc/ld.so.cache",O_RDONLY|O_CLOEXEC)=3</etc/ld.so.cache>access("/etc/ld.so.nohwcap",F_OK)=-1ENOENT(Nosuchfileordirectory)open("/lib/x86_64-linux-gnu/libc.so.6",O_RDONLY|O_CLOEXEC)=3</lib/x86_64-linux-gnu/libc-2.19.so>open("/usr/lib/locale/locale-archive",O_RDONLY|O_CLOEXEC)=3</usr/lib/locale/locale-archive>open("/etc/localtime",O_RDONLY|O_CLOEXEC)=3</etc/localtime>Mon26Sep12:29:01BST2016+++exitedwith0+++
Subsetofsyscalls-memoryoperations:
>strace-y-etrace=memorydatebrk(0)=0x25b8000mmap(NULL,8192,PROT_READ|PROT_WRITE,MAP_PRIVATE|MAP_ANONYMOUS,-1,0)=0x7f14cc871000mmap(NULL,144491,PROT_READ,MAP_PRIVATE,3</etc/ld.so.cache>,0)=0x7f14cc84d000mmap(NULL,3844640,PROT_READ|PROT_EXEC,MAP_PRIVATE|MAP_DENYWRITE,3</lib/x86_64-linux-gnu/libc-2.19.so>,0)=0x7f14cc2a8000mprotect(0x7f14cc44a000,2093056,PROT_NONE)=0mmap(0x7f14cc649000,24576,PROT_READ|PROT_WRITE,MAP_PRIVATE|MAP_FIXED|MAP_DENYWRITE,3</lib/x86_64-linux-gnu/libc-2.19.so>,0x1a1000)=0x7f14cc649000mmap(0x7f14cc64f000,14880,PROT_READ|PROT_WRITE,MAP_PRIVATE|MAP_FIXED|MAP_ANONYMOUS,-1,0)=0x7f14cc64f000mmap(NULL,4096,PROT_READ|PROT_WRITE,MAP_PRIVATE|MAP_ANONYMOUS,-1,0)=0x7f14cc84c000mmap(NULL,4096,PROT_READ|PROT_WRITE,MAP_PRIVATE|MAP_ANONYMOUS,-1,0)=0x7f14cc84b000mmap(NULL,4096,PROT_READ|PROT_WRITE,MAP_PRIVATE|MAP_ANONYMOUS,-1,0)=0x7f14cc84a000mprotect(0x7f14cc649000,16384,PROT_READ)=0mprotect(0x60e000,4096,PROT_READ)=0mprotect(0x7f14cc873000,4096,PROT_READ)=0munmap(0x7f14cc84d000,144491)=0brk(0)=0x25b8000brk(0x25d9000)=0x25d9000mmap(NULL,1607760,PROT_READ,MAP_PRIVATE,3</usr/lib/locale/locale-archive>,0)=0x7f14cc6c1000mmap(NULL,4096,PROT_READ|PROT_WRITE,MAP_PRIVATE|MAP_ANONYMOUS,-1,0)=0x7f14cc870000munmap(0x7f14cc870000,4096)=0mmap(NULL,4096,PROT_READ|PROT_WRITE,MAP_PRIVATE|MAP_ANONYMOUS,-1,0)=0x7f14cc870000Mon26Sep12:29:40BST2016munmap(0x7f14cc870000,4096)=0+++exitedwith0+++

Summary:
Strace.
Notperfect-onlyworksonsyscalllevel.Butstillusefulforlow-levelinvestigations.Norecompilationrequired.

Overview:
Valgrind.
Linux,OSX,Solaris,Android.Verydetailedcheckingofexecution.Free.SimilartoPurifyetc.

Memorychecking:
Threadchecking.
Other:
Valgrind.
Illegalmemoryaccesses:Overrun/underrunheapblocks.Overrunstack.Use-after-free.
Doublefree.Memoryleaks.
Inconsistentlockorderings.Dataraces(e.g.missingmutex).
CPUcachebehaviour.Heapprofiler.

Highlyrecommended!
Valgrind.

Newdebuggingtechnologyinrecentyears.
Recordingexecution.
Linux:UndoLiveRecorder.RR.
Windows:Intellitrace(partialrecordingonly).TimeMachineFor.Net(partialrecordingonly).
Java:Chronon.Undo(soon).

LiveRecorder.Alibrary,forlinkingintoanapplication.Allowstheapplicationtocontroltherecordingofitsownexecution.ProvidesasimpleCAPItostart/save/stoprecording.APIisdefinedinundolr.hheaderfileandimplementedinlibundolrlibrary.
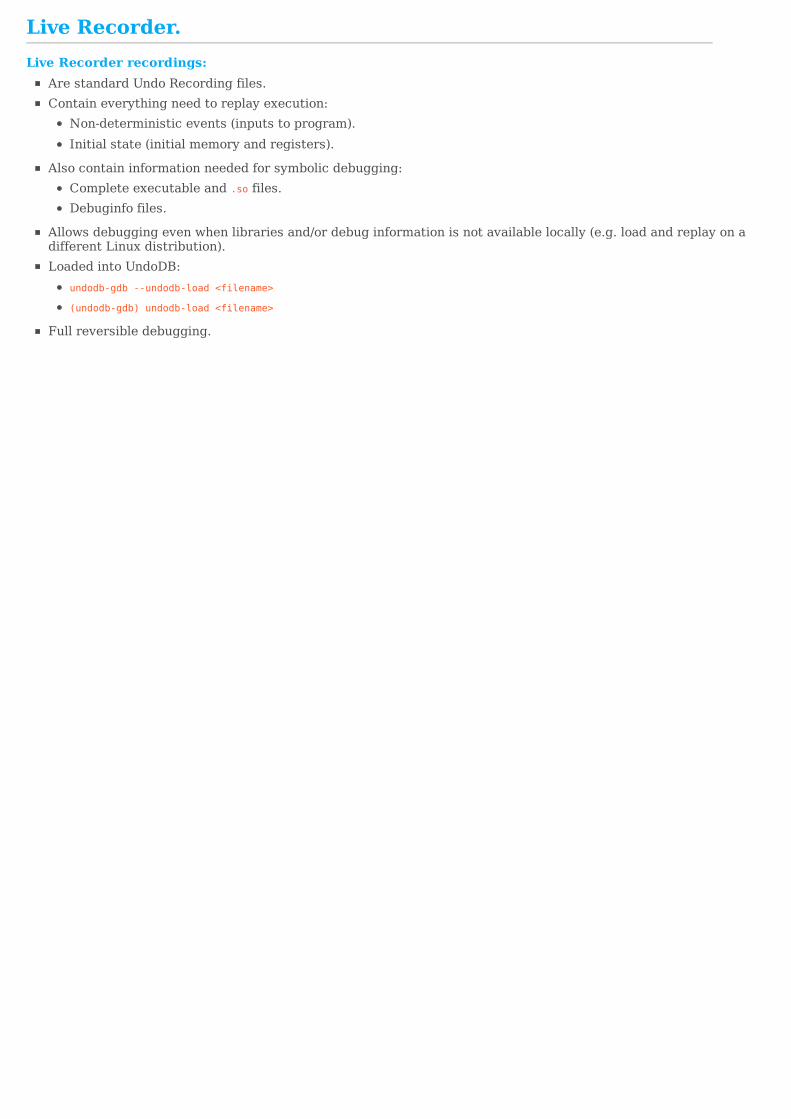
LiveRecorder.LiveRecorderrecordings:
ArestandardUndoRecordingfiles.Containeverythingneedtoreplayexecution:
Non-deterministicevents(inputstoprogram).Initialstate(initialmemoryandregisters).
Alsocontaininformationneededforsymbolicdebugging:Completeexecutableand.sofiles.Debuginfofiles.
Allowsdebuggingevenwhenlibrariesand/ordebuginformationisnotavailablelocally(e.g.loadandreplayonadifferentLinuxdistribution).LoadedintoUndoDB:
undodb-gdb--undodb-load<filename>
(undodb-gdb)undodb-load<filename>
Fullreversibledebugging.

LiveRecorder.LibraryAPI(undolr.h):intundolr_recording_start(undolr_error_t*o_error);
intundolr_recording_stop(void);
intundolr_recording_save(constchar*filename);
intundolr_recording_stop_and_save(constchar*filename);
intundolr_save_on_termination(constchar*filename);
intundolr_save_on_termination_cancel(void);
intundolr_event_log_size_get(long*o_bytes);
intundolr_event_log_size_set(longbytes);
intundolr_include_symbol_files(intinclude);

LiveRecorder.UseLiveRecorder:
Ininternaltesting.Atcustomersite.
Advantages:
Investigatebugseasilyusingreversibledebugging.Youoryourcustomercontrolwhen/ifrecordingisenabled.Avoidproblemswithdifferingenvironments.Noneedtoreproducecomplexmulti-machinesetups.Havemultipledevelopersworkonthesametestfailure.
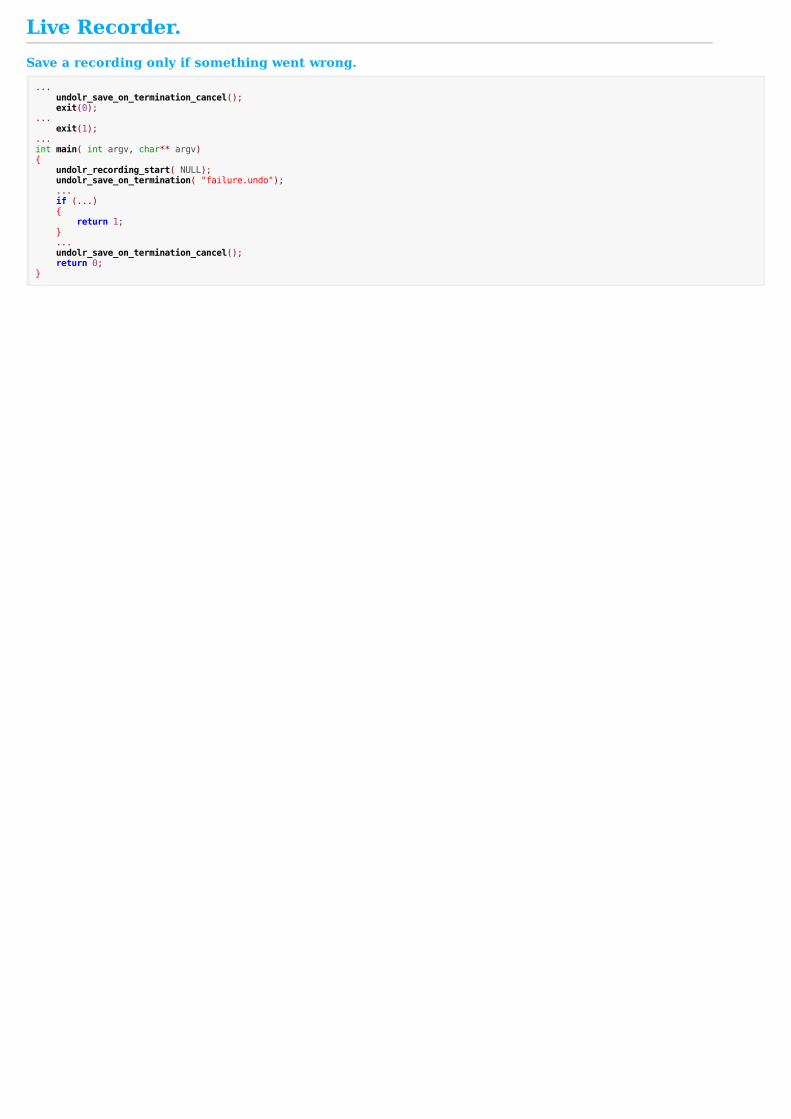
LiveRecorder.Savearecordingonlyifsomethingwentwrong....undolr_save_on_termination_cancel();exit(0);...exit(1);...intmain(intargv,char**argv){undolr_recording_start(NULL);undolr_save_on_termination("failure.undo");...if(...){return1;}...undolr_save_on_termination_cancel();return0;}

LiveRecorder:Demo.

Questions?
LiveRecorder.
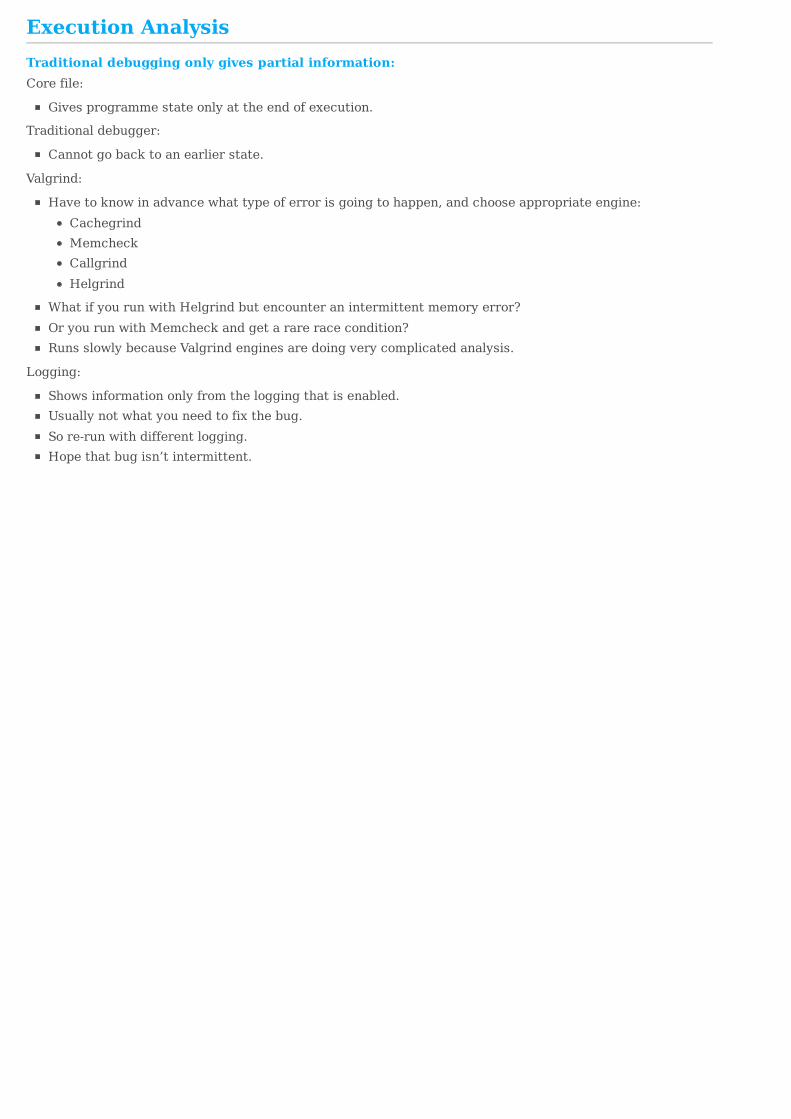
ExecutionAnalysisTraditionaldebuggingonlygivespartialinformation:Corefile:
Givesprogrammestateonlyattheendofexecution.
Traditionaldebugger:
Cannotgobacktoanearlierstate.
Valgrind:
Havetoknowinadvancewhattypeoferrorisgoingtohappen,andchooseappropriateengine:CachegrindMemcheckCallgrindHelgrind
WhatifyourunwithHelgrindbutencounteranintermittentmemoryerror?OryourunwithMemcheckandgetarareracecondition?RunsslowlybecauseValgrindenginesaredoingverycomplicatedanalysis.
Logging:
Showsinformationonlyfromtheloggingthatisenabled.Usuallynotwhatyouneedtofixthebug.Sore-runwithdifferentlogging.Hopethatbugisn’tintermittent.
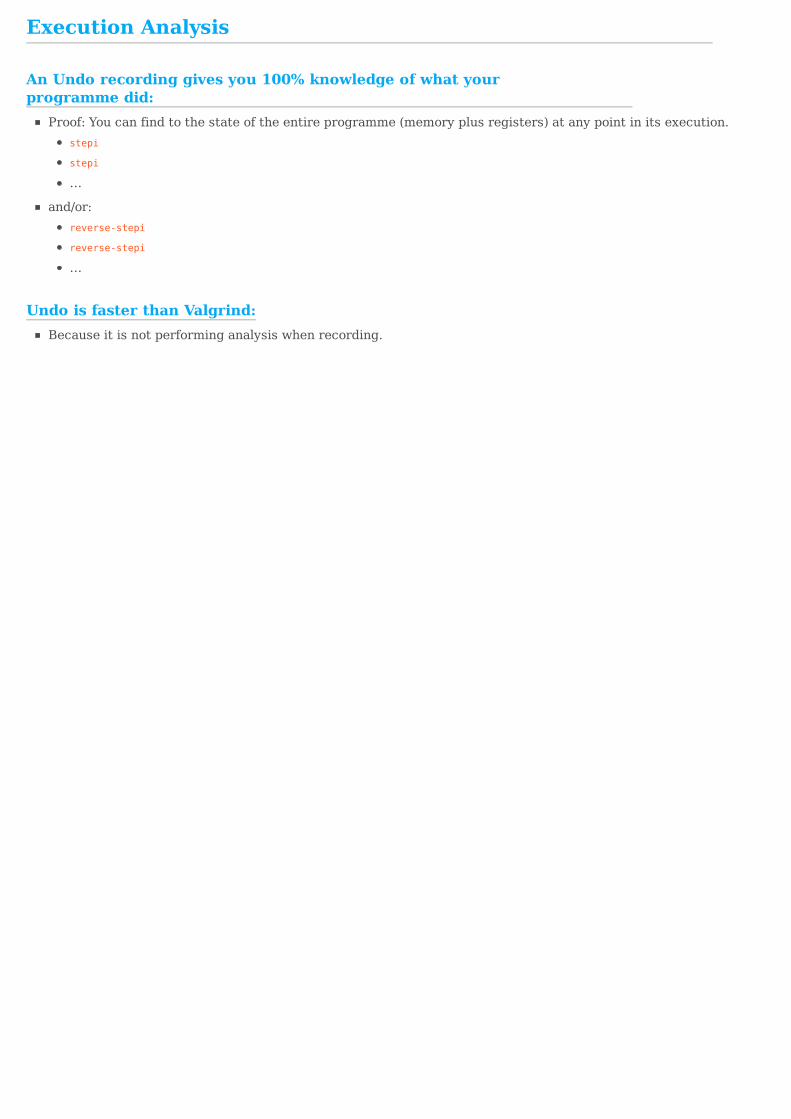
AnUndorecordinggivesyou100%knowledgeofwhatyourprogrammedid:
UndoisfasterthanValgrind:
ExecutionAnalysis
Proof:Youcanfindtothestateoftheentireprogramme(memoryplusregisters)atanypointinitsexecution.stepi
stepi
…
and/or:reverse-stepi
reverse-stepi
…
Becauseitisnotperforminganalysiswhenrecording.

Butthisisn’talwaysenoughtotrackdownreallydifficultbugs.
ExecutionAnalysisMoreusefulnavigationofprogrammeexecution:Normalandreversedebugging:
undodb-goto-time...
next,finish,reverse-next,reverse-finish,…BreakpointsWatchpoints.
Also:
Movetonext/previouseventmatchingacriteria:ugoeventprevname=='read'orname=='mmap'
ugoeventprevname=='read'andresult<0
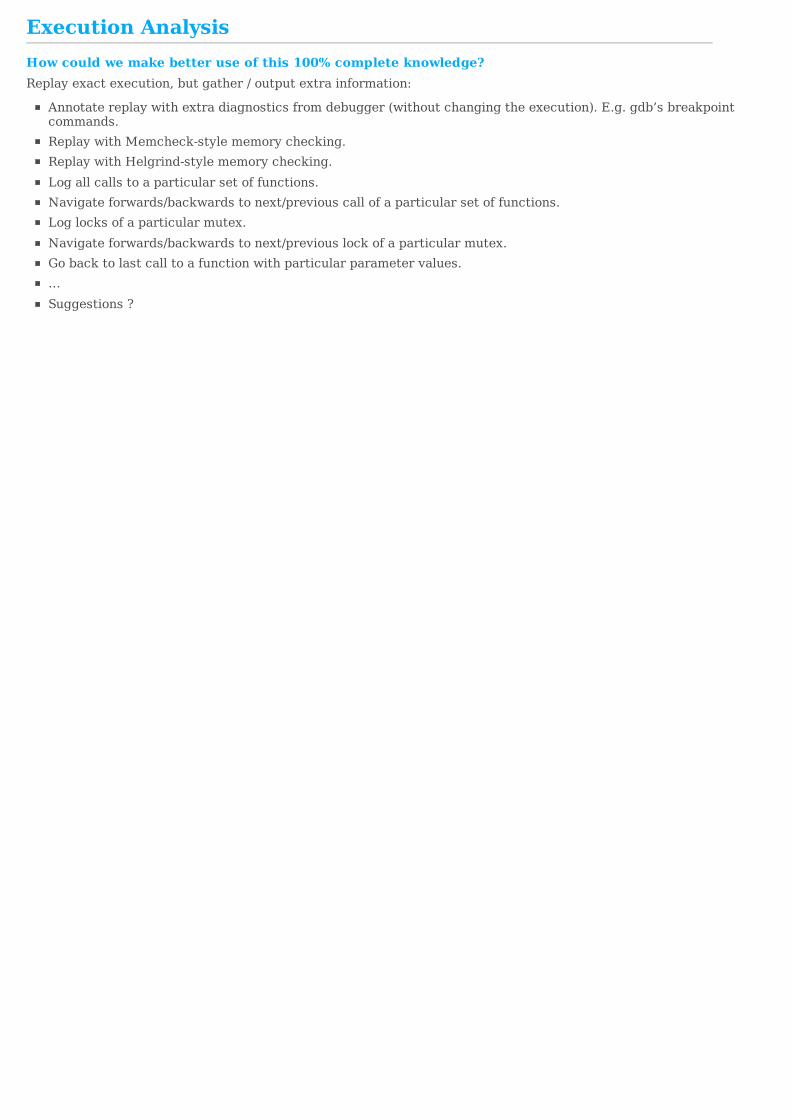
ExecutionAnalysisHowcouldwemakebetteruseofthis100%completeknowledge?Replayexactexecution,butgather/outputextrainformation:
Annotatereplaywithextradiagnosticsfromdebugger(withoutchangingtheexecution).E.g.gdb’sbreakpointcommands.ReplaywithMemcheck-stylememorychecking.ReplaywithHelgrind-stylememorychecking.Logallcallstoaparticularsetoffunctions.Navigateforwards/backwardstonext/previouscallofaparticularsetoffunctions.Loglocksofaparticularmutex.Navigateforwards/backwardstonext/previouslockofaparticularmutex.Gobacktolastcalltoafunctionwithparticularparametervalues.…Suggestions?

Witharecording,itmustbepossibletofigureoutthebug.
ExecutionAnalysisHowtofindandfixabug:
Replayrecording,useforward/reversecommands,watchpoints,breakpointstoinvestigate.Ifnotabletofigureitout:
Replaywithappropriateannotationsorvalgrind-stylecheckingtofindmoreinformation.
Repeatuntilbugisfound.
Becauserecordingcontains100%informationabouttheprogramme’sexecution.

ExecutionAnalysisSummaryofUndoadvantages:Constantmodestspeedoverhead:
UndorecordingisfasterthanValgrinddoingmemory/thread/cacheanalysis.Incurlargeanalysisoverheadonlywhenrequired.
Retrospectiveanalysis:
Runprogrammetoday.Saverecording.Analyseagainstnewregulationsin6monthstime.
Indevelopment:DataflowAnalysis.Thisisinternalresearchanddevelopment.
Aparticulartypeofexecutionanalysis.Notavailableyet.Subjecttochangebeforerelease.
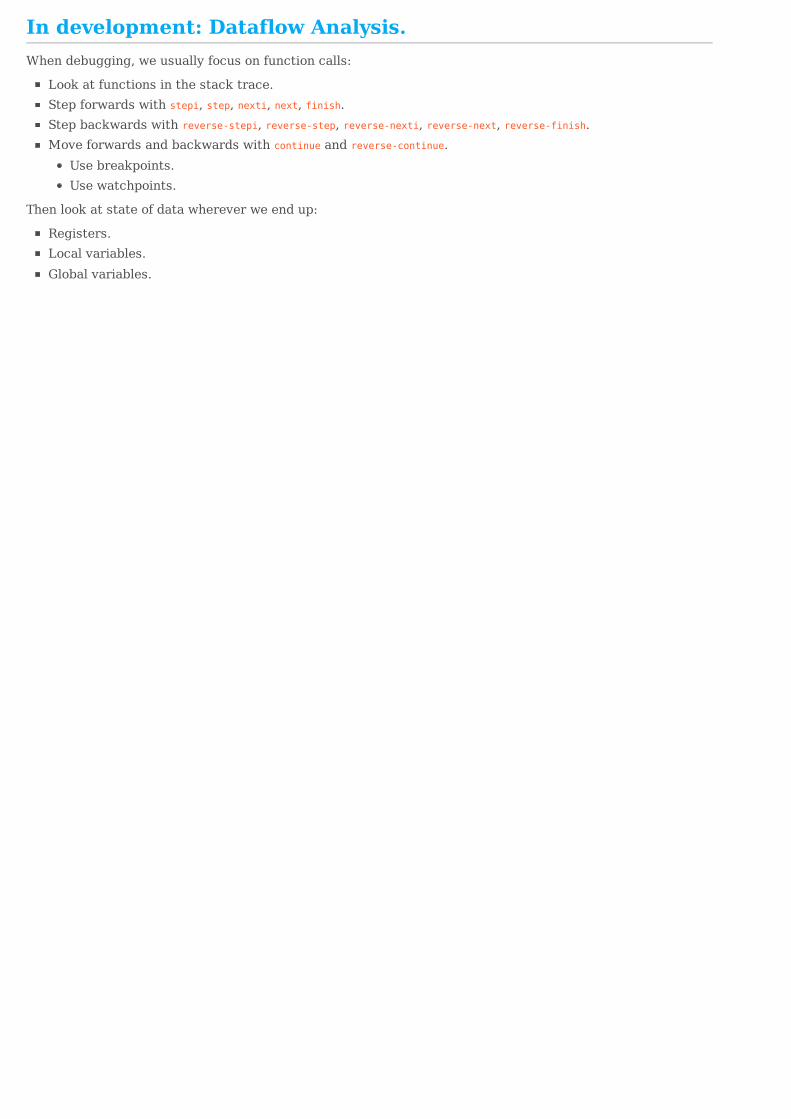
Indevelopment:DataflowAnalysis.Whendebugging,weusuallyfocusonfunctioncalls:
Lookatfunctionsinthestacktrace.Stepforwardswithstepi,step,nexti,next,finish.Stepbackwardswithreverse-stepi,reverse-step,reverse-nexti,reverse-next,reverse-finish.Moveforwardsandbackwardswithcontinueandreverse-continue.
Usebreakpoints.Usewatchpoints.
Thenlookatstateofdatawhereverweendup:
Registers.Localvariables.Globalvariables.

Indevelopment:DataflowAnalysis.Canweinsteadlookmoregenerallyatdata?WhatinputsdoescurrentCPUinstructionuse,andwheredidtheseinputscomefrom?
Newundodb-gdbcommand:undodb-current-instruction-infoShowinputs/outputsofcurrentinstruction.Example,instructionsub-0x8(%rbp),%eax:
(undodb-gdb)undodb-current-instruction-infoundodb-gdb:currentinstructionisat0x4005df:undodb-gdb:reads:undodb-gdb:memory0x7ffc8d6ed6d8..+4undodb-gdb:register0(ax)undodb-gdb:writes:undodb-gdb:register0(ax)(undodb-gdb)
Tofollowthedata:
Wecanseta4-bytewatchpointonaddress0x7ffc8d6ed6d8.Weneedtobeabletoseta"watchpoint"onregister%ax.
NotsupportedbyCPUhardware.

Indevelopment:DataflowAnalysis.ButUndoknowseverythingaboutexecution.Sowecanmakeitspeciallyinstrumentcodetodoregisterwatchpoints.
Newundodb-gdbcommand:undodb-search-registersSearchbackwardsforreads/writestoregisters.Example:
(undodb-gdb)undodb-search-registersax,bpds
Goesbacktomostrecentlyexecutedinstructionthatdidanyof:Readregister%ax.Readregister%bp.Wrotetoregister%ds.
Notes:
Thisisonlypossiblebecausewehavearecord/replyengine.Withoutrecord/replayengine,combinatoricsmakethingsimpossible.Onlypossibleifwemodifyreplaytoalsotrackchangestoregisters.

Indevelopment:DataflowAnalysis.Puttingittogether:
Wecanlookatwhatregister/memoryisusedbycurrentinstruction.Wecangobacktomostrecenttimeregister/memorywaschanged.
Reversedataflowanalysis:Ifcurrentinstructionreadsonememorylocation:
Setwatchpoint.Reversecontinue.
Ifcurrentinstructionreadsoneregister:Useundodb-search-registers.
Dataflowisatree.
Indevelopment:DataflowAnalysis.Butwhatifcurrentinstruction…
…readsmorethanoneregister?…readsregisterandmemory?…readsmorethanonelocationinmemory?

Indevelopment:DataflowAnalysis.Semi-automaticdataflowanalysis:
Exploredataflowtreeonestepatatime.Ateachstep:
Usememory-watchpoint+reverse-continue,orundob-search-registers.Rememberresultsofeachstep.Breadth-firstsearch.
(undodb-gdb)undodb-dataflow-backwards-explore-start(undodb-gdb)undodb-dataflow-backwards-explore-next(undodb-gdb)undodb-dataflow-backwards-explore-next...undodb-gdb:Havefinisheddataflowexploration(undodb-gdb)undodb-dataflow-backwards-explore-show

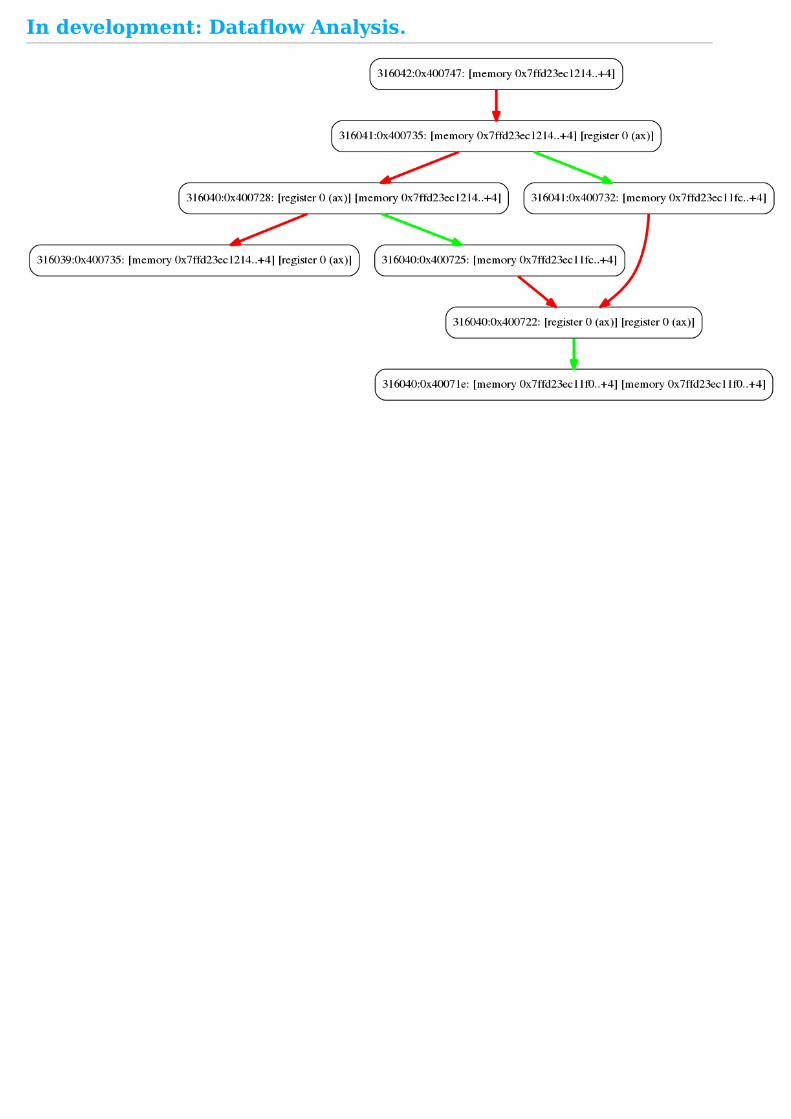
Indevelopment:DataflowAnalysis.Exampleoutput:
(undodb-gdb)undodb-dataflow-backwards-explore-showundodb-gdb:Dataflowis(13):undodb-gdb:316038:0x400728=>316039:0x400735:memory0x7ffd23ec1214..+4undodb-gdb:316039:0x400732=>316039:0x400735:register0(ax)undodb-gdb:316029:0x4006f6=>316040:0x40071e:memory0x7ffd23ec11f0..+4undodb-gdb:316029:0x4006f6=>316040:0x40071e:memory0x7ffd23ec11f0..+4undodb-gdb:316040:0x40071e=>316040:0x400722:register0(ax)undodb-gdb:316040:0x40071e=>316040:0x400722:register0(ax)undodb-gdb:316040:0x400722=>316040:0x400725:memory0x7ffd23ec11fc..+4undodb-gdb:316040:0x400725=>316040:0x400728:register0(ax)undodb-gdb:316039:0x400735=>316040:0x400728:memory0x7ffd23ec1214..+4undodb-gdb:316040:0x400722=>316041:0x400732:memory0x7ffd23ec11fc..+4undodb-gdb:316040:0x400728=>316041:0x400735:memory0x7ffd23ec1214..+4undodb-gdb:316041:0x400732=>316041:0x400735:register0(ax)undodb-gdb:316041:0x400735=>316042:0x400747:memory0x7ffd23ec1214..+4(undodb-gdb)
Indevelopment:DataflowAnalysis.

Questions?
Indevelopment:DataflowAnalysis.Whatcouldwedowithreversedataflow?
Easiertracingoftheultimatecauseofincorrectdata.Test-casesynthesis-findwhatinputswouldberequiredtomakeprogrammetakeaparticularpath.
Issues:Currentlyonlydetectreads/writestogeneralpurposeregisters.Consider:add%eax,-0xc(%rbp)
Readsmemoryat%bp-0xc.Doesthisalsoreadregister%bp?(Currentlywesay:No.)
Currentlyslow.

EOF.
http://undo.io/