Solar Cell Development - Solmetric - Home of SunEye, PV Analyzer

New Tools for PV Array
Commissioning and Troubleshooting
Megger®
MIT430
Solmetric
PVA-600
Paul HerndayApplications [email protected] 707-217-3094
April 5, 2012
Audio is available by
telephone or your computer

Solmetric Solutions
www.solmetric.com

Sales CallPreliminary Site survey
Preliminary design
Proposal Contract
StartupPerformance Verification
Performance Monitoring Service
Solar PV Installation Life Cycle
Detailed Site Survey
Final Design
Installation Checkout
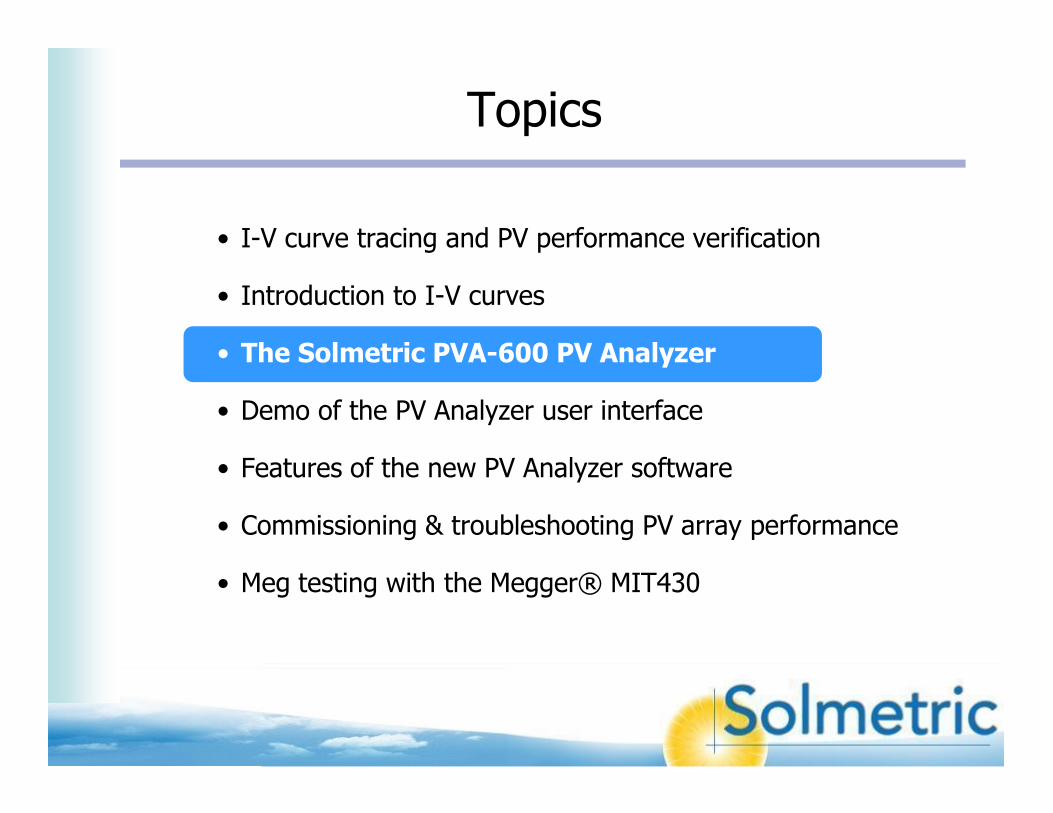
Topics
• I-V curve tracing and PV performance verification
• Introduction to I-V curves
• The Solmetric PVA-600 PV Analyzer
• Demo of the PV Analyzer user interface
• Features of the new PV Analyzer software
• Commissioning & troubleshooting PV array performance
• Meg testing with the Megger® MIT430
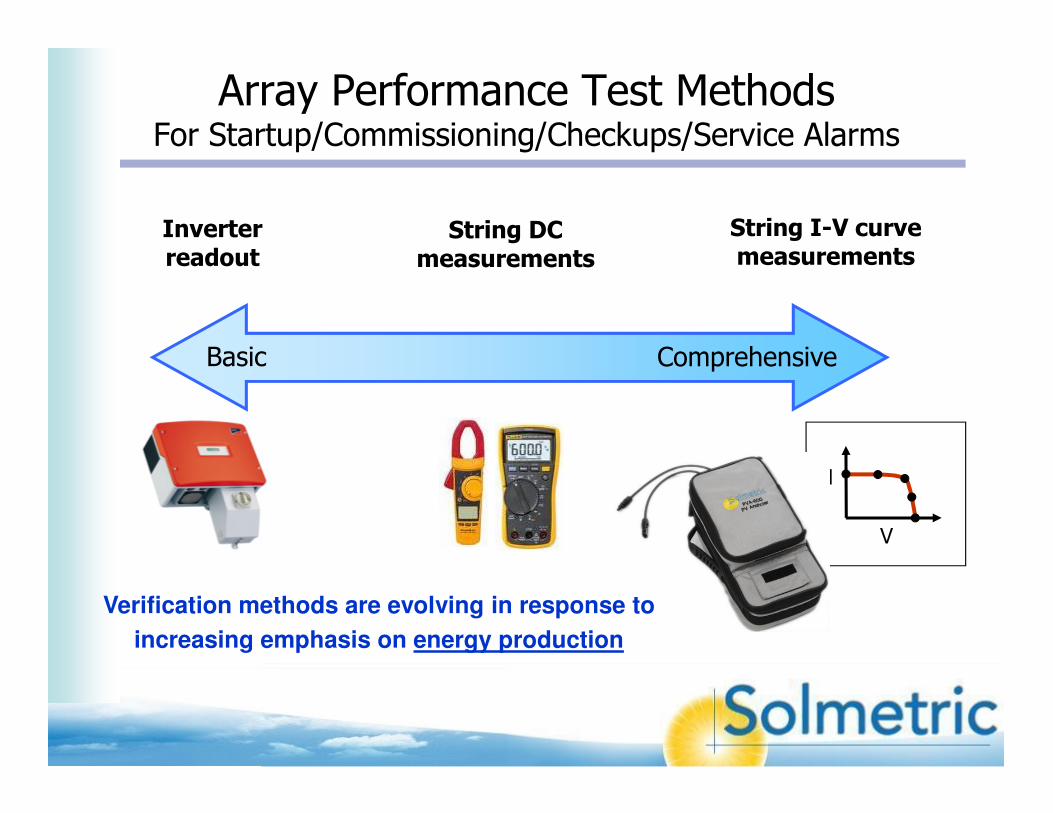
Array Performance Test MethodsFor Startup/Commissioning/Checkups/Service Alarms
Inverter readout
String I-V curve measurements
String DC measurements
Basic Comprehensive
I
V
Verification methods are evolving in response to
increasing emphasis on energy production

“I often tell students in my classes to learn to think like a PV array.
Thinking like a PV array requires understanding the I-V curve and how it
changes based on ambient conditions and array problems. An I-V curve
tracer is the best way to gain an understanding of these changes, since it provides a graphical representation of the array operating characteristics.”
“I-V curve tracing is the most informative measurement that can be performed
on a PV module or array.”
I-V Curve Tracing is a PV Best Practice
David KingDK Solar Works
Developer of the Sandia PV Array Model at Sandia National Labs
SolarPro, Aug/Sep 2011
Bill BrooksBrooks Engineering
SolarPro, Aug/Sep 2011

� Fast – a single electrical connection & a single measurement
� Most complete test method
� No need to bring the inverter on-line to fully test the array
� Close out projects earlier ($$$ flow earlier)
� Detailed baseline for comparison as arrays age & degrade
Benefits of I-V Curve Performance Testing
Commissioning New PV Systems
� Troubleshoot more efficiently
� Sort out module versus inverter issues
� Provide convincing data for module warranty claims
� Keep arrays producing maximum energy
Maintaining PV Systems (O&M, Asset Management)

Solmetric PV Analyzer Users
EPC organizations
System Integrators
Consulting Engineers
Training OrganizationsTechnical colleges
IBEW
Training Centers
O&M Companies
Electrical contractors
I
V
Module Manufacturers
Inverter Manufacturers

Topics
• I-V curve tracing and PV performance verification
• Introduction to I-V curves
• The Solmetric PVA-600 PV Analyzer
• Demo of the PV Analyzer user interface
• Features of the new PV Analyzer software
• Commissioning & troubleshooting PV array performance
• Meg testing with the Megger® MIT430

Solar Cell
1
2
3
3
Ideally, the same current flows through series cells.
In practice, any cell can be a bottleneck.
A 12-module string may have
12 x 72 = 864 cells in series.
Charge generation
Charge separation
Charge collection
1
2
3
Incoming Photon
Top layer
Bottom layer
Fingers
Backside

What is an I-V curve……and how is it measured?
AdjustableLoad
Load can be•Resistive•Capacitive•Electronic
MeasurecurrentMeasure
voltage
Current
Voltage
Built-in PV models mean
user can instantly check
performance against
expectations for the
existing irradiance and
temperature.

I-V and P-V* CurvesExpect this shape for healthy cells, modules, strings, arrays
Current
Voltage
Isc
Voc
I-V curve
Vmp
Imp
Power
P-V curve
Pmax
*P-V curve is calculated from the measured I-V curve
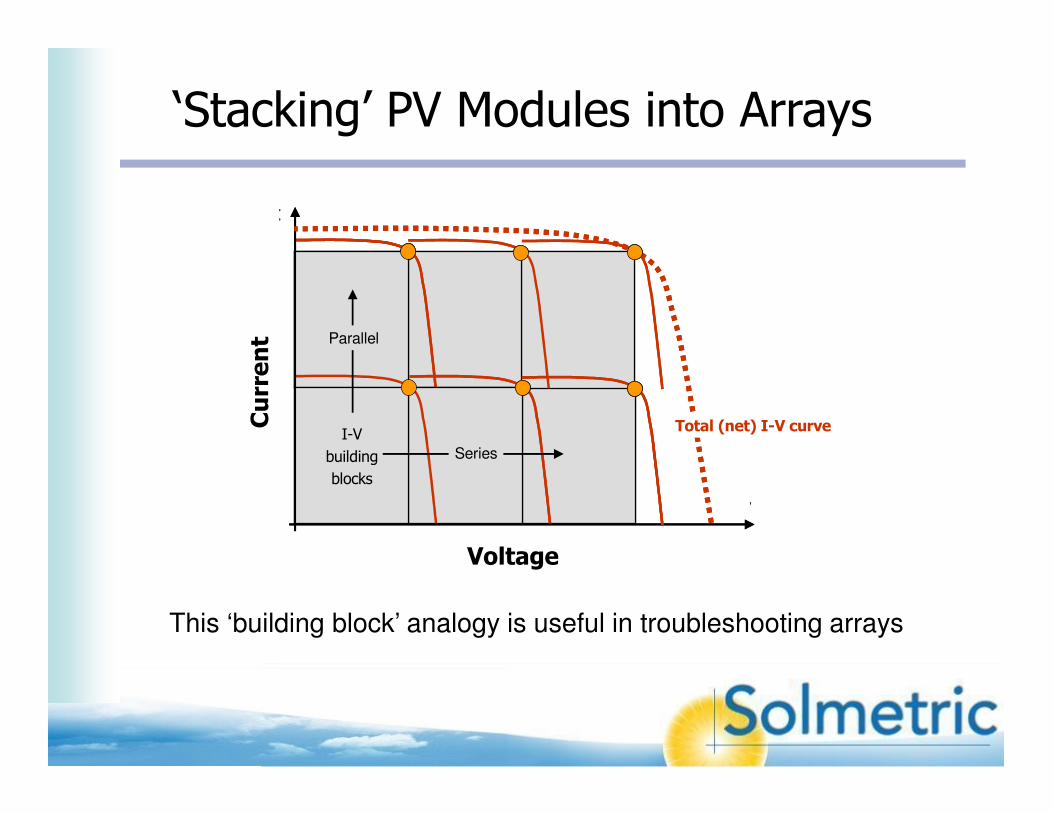
‘Stacking’ PV Modules into Arrays
This ‘building block’ analogy is useful in troubleshooting arrays
I
V
I-V
building
blocks
Series
Parallel
Total (net) I-V curve
I
V
I-V
building
blocks
Series
Parallel
Total (net) I-V curveCurrent
Voltage
Max power point
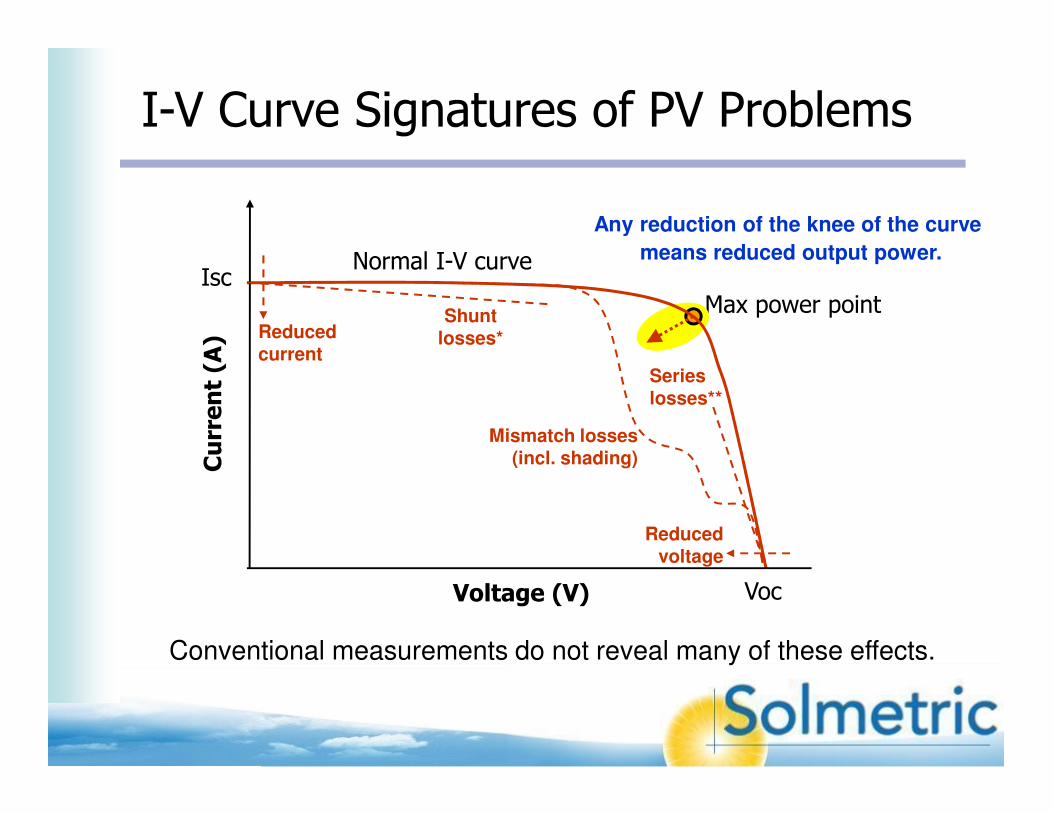
I-V Curve Signatures of PV Problems
Any reduction of the knee of the curve
means reduced output power.
Current (A)
Voltage (V)
Isc
Voc
Shunt losses*
Series losses**
Mismatch losses (incl. shading)
Normal I-V curve
Reducedcurrent
Reducedvoltage
Conventional measurements do not reveal many of these effects.
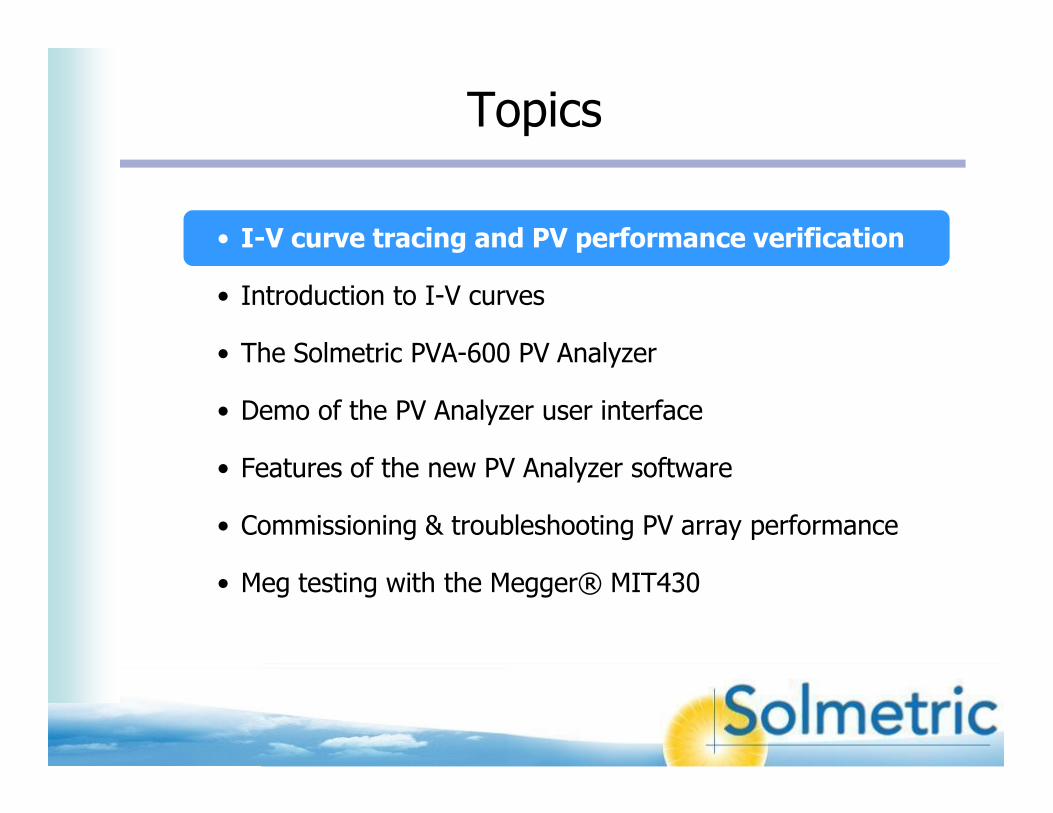
Topics
• I-V curve tracing and PV performance verification
• Introduction to I-V curves
• The Solmetric PVA-600 PV Analyzer
• Demo of the PV Analyzer user interface
• Features of the new PV Analyzer software
• Commissioning & troubleshooting PV array performance
• Meg testing with the Megger® MIT430

• Complete performance measurement up to 600V, 20A
• Comparison to built-in models
• Wireless interface to your PC
String measurement showing I-V and P-V curves,
and comparison of I-V curve with model (5 dots).
Solmetric PVA-600 PV Analyzer

Courtesy of:Integrated Energy SystemsPittsburg Unified School DistrictSage RenewablesStellar Energy Solutions
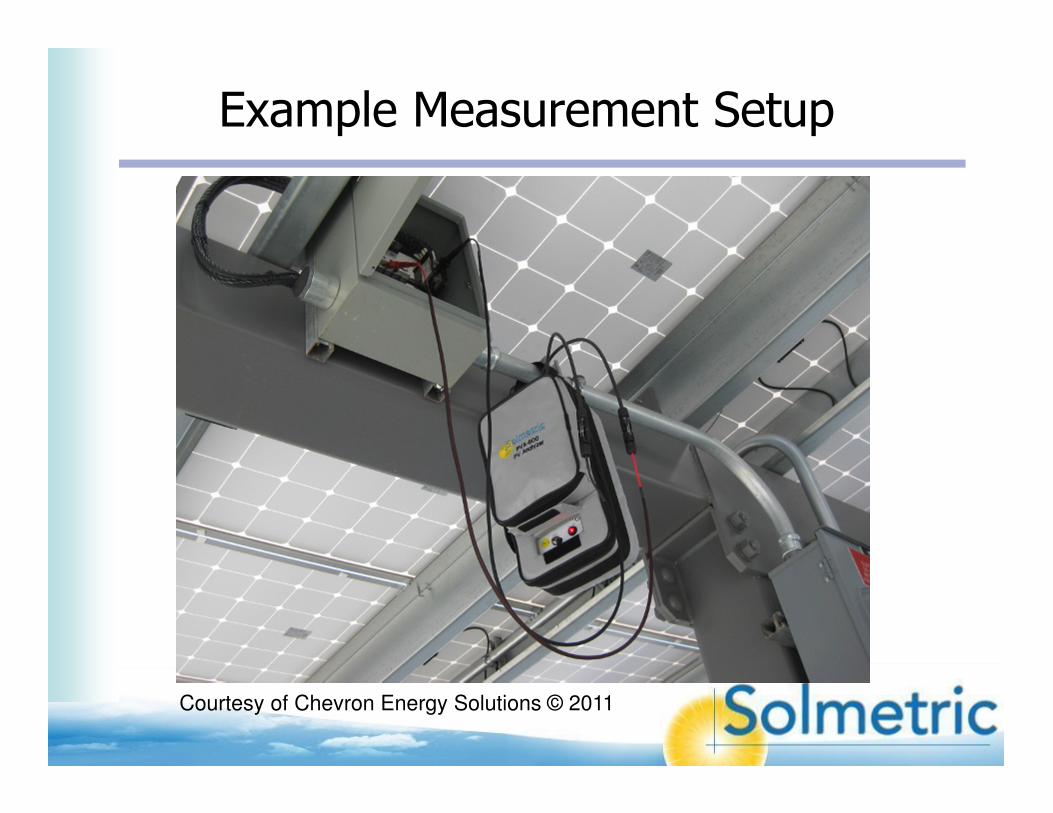
Example Measurement Setup
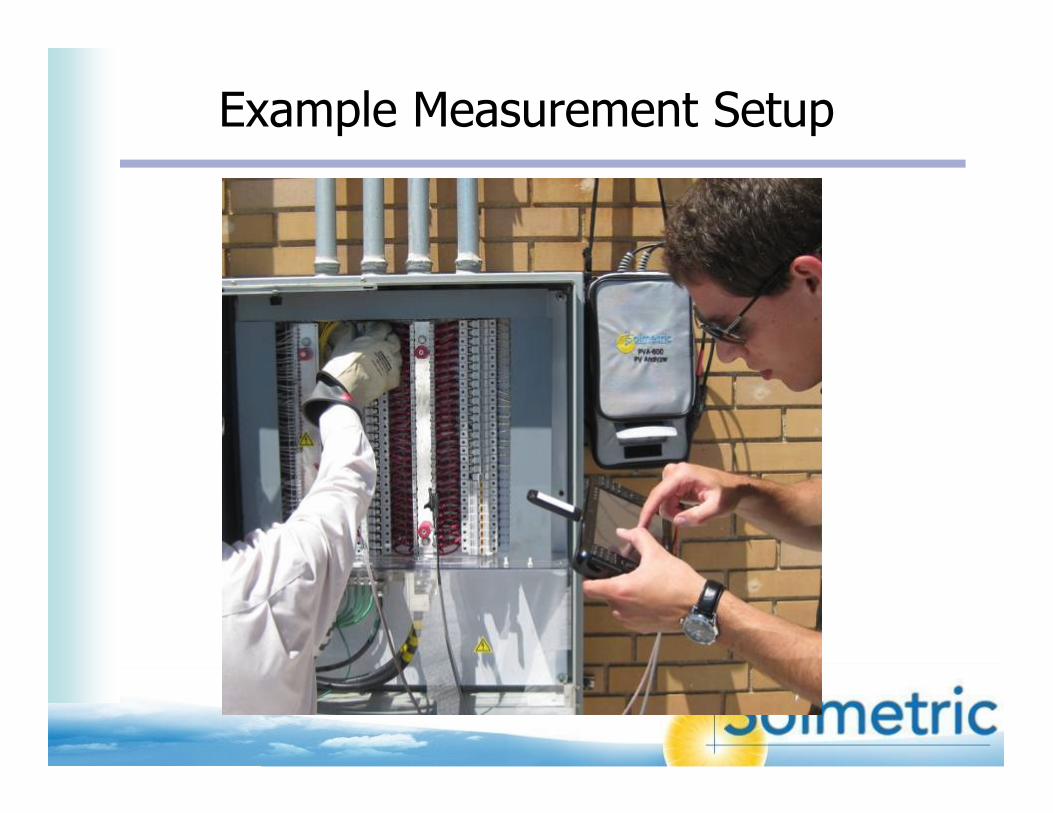
Example Measurement Setup
Courtesy of Chevron Energy Solutions © 2011

PVA-600 Block Diagram(simplified)
Controller&
Wireless
I sense
V senseC
Control button withLED indicator
Battery charging connector
(1 of 3)
• Capacitive load method (3 capacitor values, auto-selected)
• Electrically isolated. Ground lead is not required
• Protection for over-voltage, -current, -temperature, & reverse polarity
PV TestLeads
NEMA 4X FG Enclosure

Wireless Sensor KitIrradiance & temperature sensors
Irradiance
transmitter
Receiver (USB)
Temperature
transmitter
K-type
thermocouple
Omega Part #
5SRTC-GG-K-
30-72
.

Comparing PVA measurement with
resistive load method Resistive
load
Resistive
load
Switch

Data points from the
resistive load method
Method:•Clear sky, solar noon.
•Quickly alternate the two methods.
•New resistance at each load point.

PV Models in the PV AnalyzerPredict PV array performance for immediate comparison
• Sandia National Labs PV Array Model
– Most comprehensive (30+ parameters)
– ~500 PV modules
• 5-Parameter Model
– Developed at U. Wisconsin, used by CEC for NSHP program
– ~5000 PV modules
– Less reliable results for amorphous silicon technologies
• Simple Datasheet Model (predicts Pmax)
– User enters data sheet parameters (Isc, Voc, Pmax & temp co’s)
– Translates datasheet Pmax (STC) to actual irradiance & temperature
These 3 methods are available in the Solar Advisor Model (SAM) from NREL and are embedded in the Solmetric PV Analyzer.

Topics
• I-V curve tracing and PV performance verification
• Introduction to I-V curves
• The Solmetric PVA-600 PV Analyzer
• Demo of the PV Analyzer user interface
• Features of the new PV Analyzer software
• Commissioning & troubleshooting PV array performance
• Meg testing with the Megger® MIT430

Easy model setup
-New Project Wizard-Site information from the web
Easy data management
-Database replaces existing folder tree-Array Navigator™ graphical interface (touch to save or recall data)-Outputs data in the traditional csv format (compatible with Data Analysis Tool)
Translation to STC (built in)
History tab
-Shows tabular values for the last 20 measurements
Archiving of Meg Test data
-Saves manually entered meg test data to the new database(NEW - Solmetric now offers the Megger MIT-430 Insulation Tester)
Features of the new PVA software

Traces tab

System name & path screen

Performance model screen

Site info screen

Roof Measurement Tool

Latitude – manual entry

Longitude – manual entry

Array Navigator™ screen

Add inverter screen

Array Navigator screen

Saving a meg test result

Meg Test tab

Topics
• I-V curve tracing and PV performance verification
• Introduction to I-V curves
• The Solmetric PVA-600 PV Analyzer
• Demo of the PV Analyzer user interface
• Features of the new PV Analyzer software
• Commissioning & troubleshooting PV arrays
• Meg testing with the Megger® MIT430
Example Measurement Setup

I-V Measurement SetupExample: Measuring strings at a combiner box
Attach the thermocouple well away from module edges, using polyimide (Kapton) tape for best mechanical properties at high temperatures.

Test ProcessExample: Measuring strings at a combiner box
Hardware setup (do once at each combiner box):
1. Move the sensors (if necessary to get wireless range)
2. Isolate the combiner box (open the DC disconnect)
3. De-energize the buss bars (lift the string fuses)
4. Clip test leads to the buss bars
1. Insert a string fuse
2. Press “Measure”
3. View and save results
4. Lift the fuse
Electrical measurement (repeat for each string):
10-15 seconds, typically

Example Measurement Setup860kW 7-inverter system
Courtesy of Portland Habilitation Center and Dynalectric Oregon
• Open the DC disconnect
for the sub-array you
want to test.

Example Measurement SetupCombiner boxes for one inverter
Courtesy of Portland Habilitation Center and Dynalectric Oregon
• Locate the
combiner box

Example Measurement SetupCombiner box wiring
Courtesy of Portland Habilitation Center and Dynalectric Oregon
• With a clamp-meter,
verify that the load has
been disconnected.
• Then lift all of the
fuses.

Example Measurement SetupInsert a single fuse to test the corresponding string
Courtesy of Portland Habilitation Center and Dynalectric Oregon
• Clip the PV Analyzer to
the buss bars.
• Push down one fuse at
a time and make I-V
curve measurements.
• View and save results.

How data is exported
This format makes it easy to locate
particular data.
It also allows automating the
analysis of large amounts of data. Created
when you
install the
PVA PC
software
• Identify non-conforming strings
• Generate convincing charts for
your commissioning report

Demo of I-V Data Analysis Tool

Displays Generated by theI-V Data Analysis Tool*
1950
2000
2050
2100
7
6
5
4
3
2
1
0
Fre
qu
en
cy
Pmax (Watts)
7
6
5
4
3
2
1
0
Cu
rren
t (A
mp
s)
0 100 200 300 400 500
Voltage (Volts)
7
6
5
4
3
2
1
0
Cu
rren
t (A
mp
s)
0 100 200 300 400 500
Voltage (Volts)
*Optional, MS Excel-based tool, $95
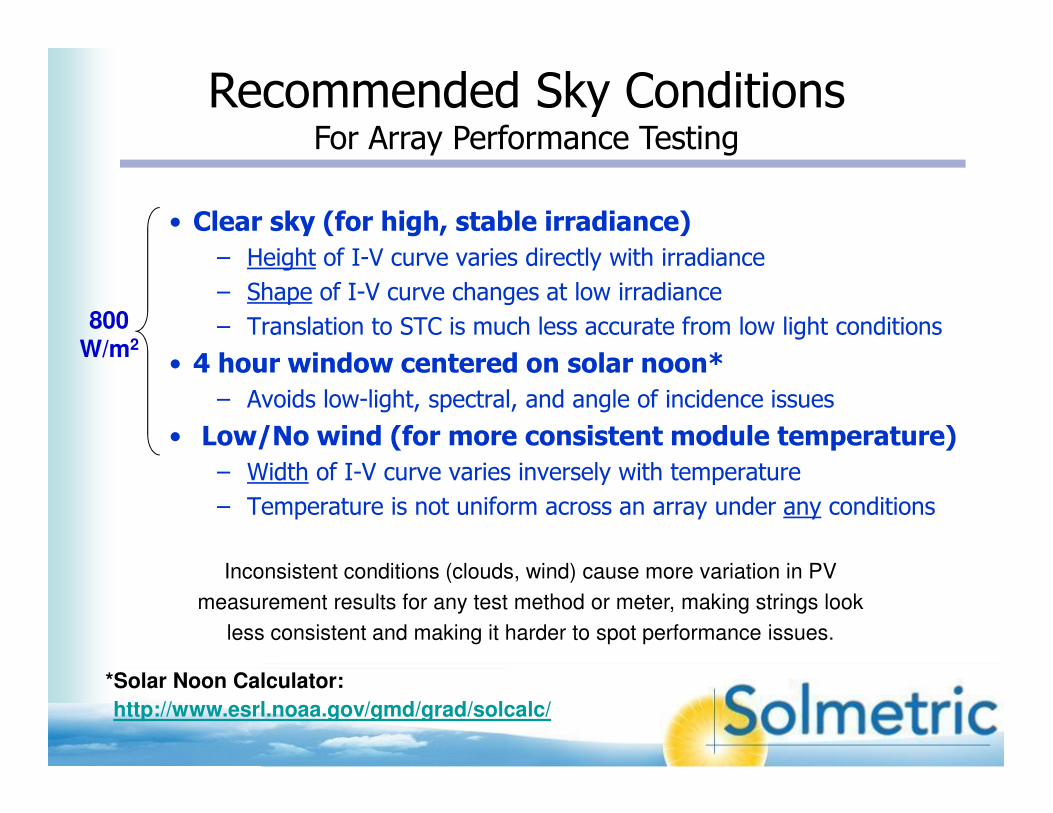
• Clear sky (for high, stable irradiance)
– Height of I-V curve varies directly with irradiance
– Shape of I-V curve changes at low irradiance
– Translation to STC is much less accurate from low light conditions
• 4 hour window centered on solar noon*
– Avoids low-light, spectral, and angle of incidence issues
• Low/No wind (for more consistent module temperature)
– Width of I-V curve varies inversely with temperature
– Temperature is not uniform across an array under any conditions
Recommended Sky ConditionsFor Array Performance Testing
http://www.esrl.noaa.gov/gmd/grad/solcalc/
*Solar Noon Calculator:
Inconsistent conditions (clouds, wind) cause more variation in PV
measurement results for any test method or meter, making strings look
less consistent and making it harder to spot performance issues.
800W/m2

Problem Sky Conditions

Max power point
I-V Curve Signatures of PV Problems
Any reduction of the knee of the curve
means reduced output power.
Current (A)
Voltage (V)
Isc
Voc
Shunt losses*
Series losses**
Mismatch losses (incl. shading)
Normal I-V curve
Reducedcurrent
Reducedvoltage
Conventional measurements do not reveal many of these effects.
Isc
Voc
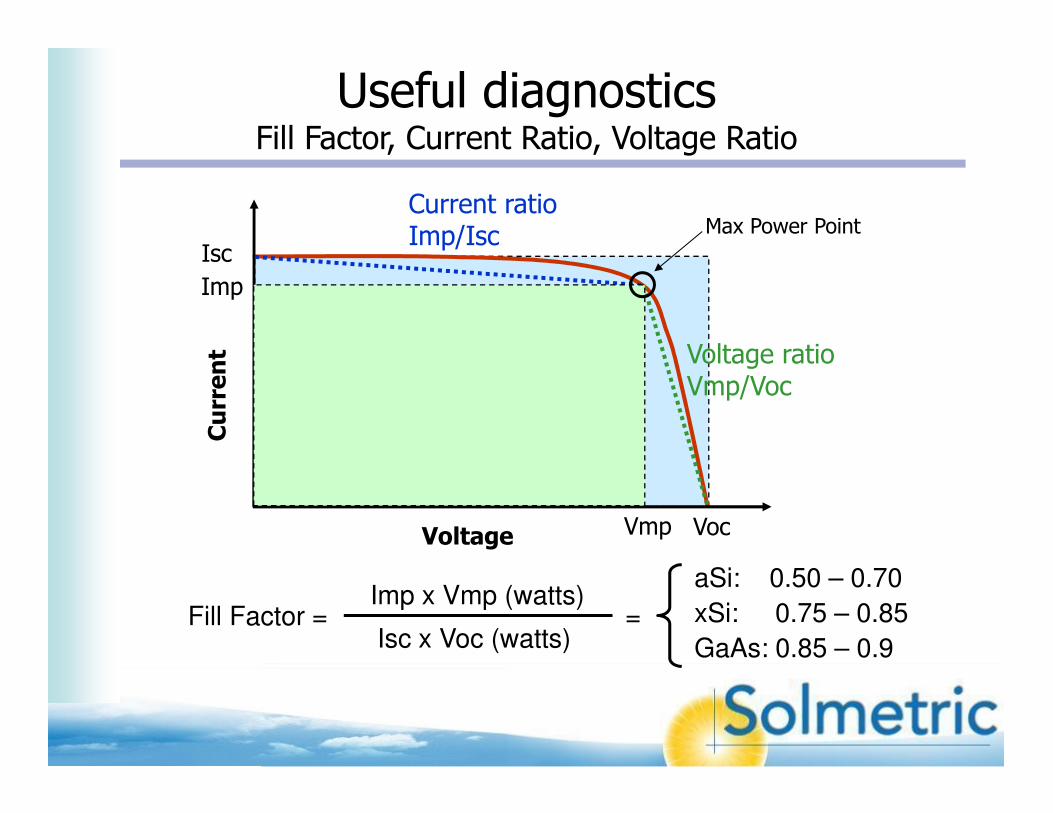
Useful diagnosticsFill Factor, Current Ratio, Voltage Ratio
Current
Voltage
Fill Factor =Imp x Vmp (watts)
Isc x Voc (watts)
aSi: 0.50 – 0.70
xSi: 0.75 – 0.85
GaAs: 0.85 – 0.9=
Current ratioImp/Isc
Voltage ratioVmp/Voc
Imp
Vmp
Max Power Point

String of Field-aged, Early TF ModulesDegraded fill factor, lower output power
Array-as-sensor mode for viewing relative changes in curve shape

0
1
2
3
4
5
6
7
8
0 50 100 150 200 250 300 350 400
Voltage - V
Cu
rren
t -
A
String 4B14
String 4B15
Troubleshooting exampleAnomalous slope in string I-V caused by single high-resistance module

Example of a series resistance failureinside a module J-box
Probably failure mode:
Heat cycling � bond degradation � resistive heating

Dropped Cell String
• Shorted bypass diode, or
• Mismatch causing diode to turn on
when current starts flowing
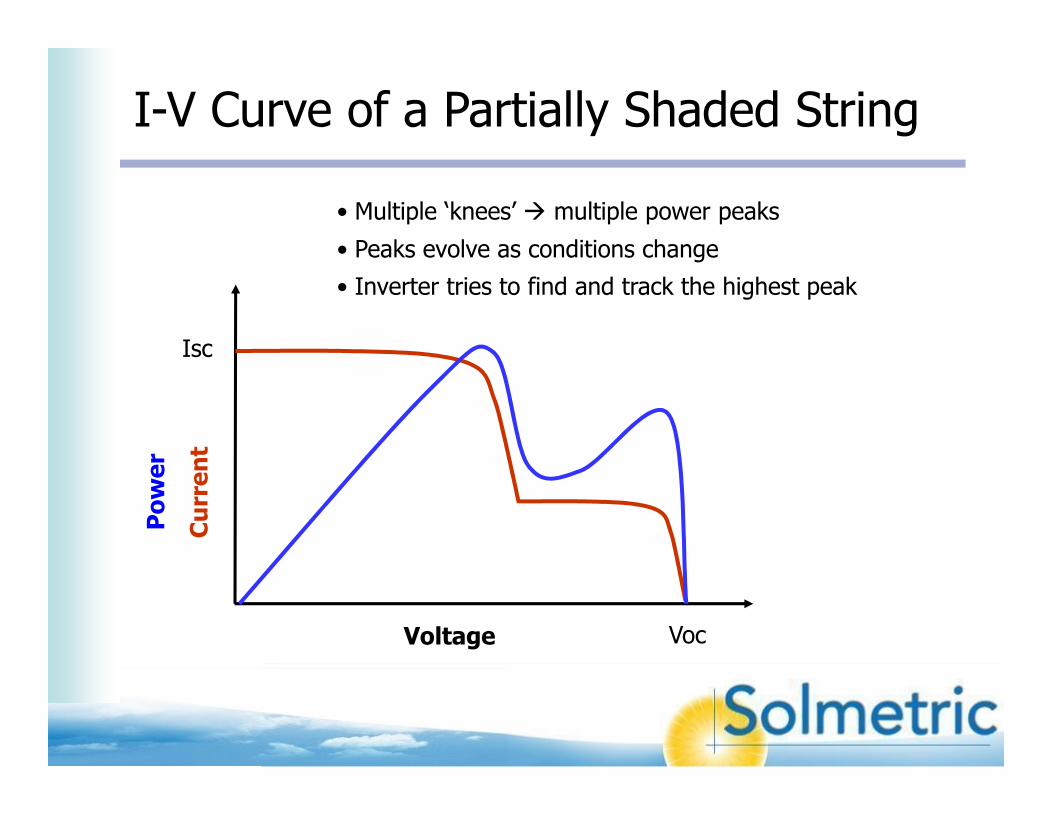
I-V Curve of a Partially Shaded String
• Multiple ‘knees’ � multiple power peaks
• Peaks evolve as conditions change
• Inverter tries to find and track the highest peak
Current
Voltage
Isc
Voc
Power

Partially shaded residential arrayMeasure the single string mounted along lower edge of roof

I-V Curve of the partially shaded stringSingle string mounted along lower edge of roof
Approximately 40% reduction in string’s output power

Shade 2 cells in the same cell-stringSingle module with 72 cells and 3 bypass diodes
Shading one
cell string
drops 1/3 of
PV module
voltage and
power

Shade 2 cells in adjacent cell-stringsSingle module with 72 cells and 3 bypass diodes
The same
amount of
shade,
oriented
differently,
drops 2/3 of
PV module
voltage and
power.

IR signature of bypassed cell string
Image 383
22 C 45 C
Cardboard shading a cell
Measured usingthe FLIR i7
infrared camera

What is the PV Analyzer all about?
•Single measurement for each string
•Most complete performance measurement possible
• Independent max power measurement for each string
•Built-in PV models give instant performance check
•Don’t need to bring inverter online
•Automated data analysis
•Teaches us to “think like a PV array”
I
V
Testing PV array performance faster and better
Next topic: Insulation resistance testing

Topics
• I-V curve tracing and PV performance verification
• Introduction to I-V curves
• The Solmetric PVA-600 PV Analyzer
• Demo of the PV Analyzer user interface
• Features of the new PV Analyzer software
• Commissioning & troubleshooting PV arraysrays
• Meg testing with the Megger® MIT430

Insulation Resistance Testing of PV ArraysWhere are we?
• Best practice is to test all systems during commissioning and maintenance
• Today, meg testing is not done on all commercial systems, and it is less common in residential systems.
• Source circuits are often tested in aggregate
– Individual strings are tested only if aggregate resistance is low
• Methods for subarray test are not standardized or widely understood
– Best reference is the “re-wrenches” blog (Home Power Magazine)
• Trend is toward specifying meg testing for commercial systems
• Insulation problems will be much more common as PV systems age

Preparation: Open the DC Disconnect � Lift string fuses � Lift negative feeder cable(s)
Lift
Meg Testing at the Subarray Level
Lift
Example assumes a
negative-grounded array
Lift
Combiner box
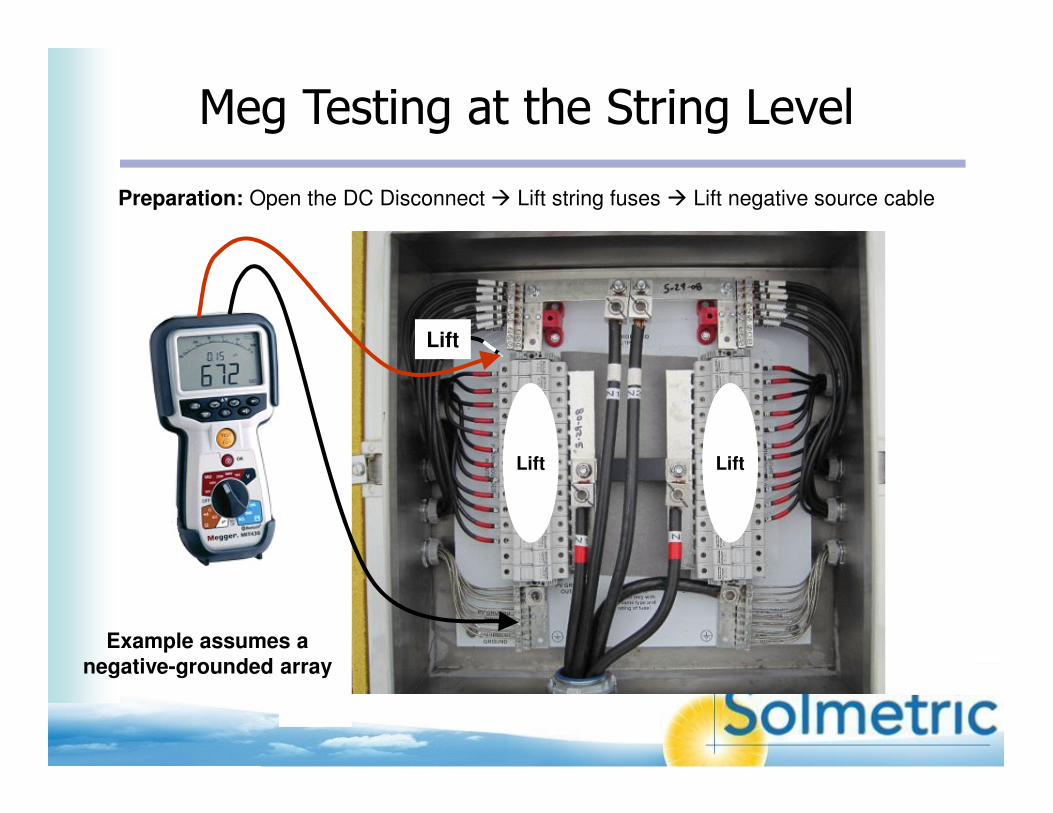
Preparation: Open the DC Disconnect � Lift string fuses � Lift negative source cable
Lift Lift
Meg Testing at the String Level
Example assumes a
negative-grounded array
Lift

5-Minute PV Analyzer Training Videoshttp://www.solmetric.com/videos1.html

Free I-V Curve Posterhttp://www.solmetric.com/specialoffers.html

SolarPro Magazine, Aug/Sep 2011

New Tools for PV Array
Commissioning and Troubleshooting
Paul Hernday
Applications Engineer
cell 707-217-3094
April 5, 2012