New tools and new tests in comparative political economy: The Database … · · 2003-08-13New...
44
New tools and new tests in comparative political economy: The Database of Political Institutions Thorsten Beck, George Clarke, Alberto Groff, Philip Keefer, and Patrick Walsh Beck, Clarke, Keefer and Walsh: Development Research Group, The World Bank. Groff: Federal Department of Foreign Affairs (Switzerland). This paper’s findings, interpretations, and conclusions are entirely those of the authors and do not necessarily represent the views of the Federal Department of Foreign Affairs, or the World Bank, its Executive Directors, or the countries they represent. Abstract : This paper introduces a large new cross-country database of political institutions, the Database on Political Institutions (DPI). It covers 177 countries over 21 years, 1975 – 1995. The paper explores the range of issues for which this data should prove invaluable, summarizes key variables, many of them new, and compares this data set to others. Among the novel variables we introduce are several measures of checks and balances, tenure, and stability; identification of party affiliation with government or opposition; and fragmentation of opposition and government parties in legislatures. We illustrate the application of DPI variables to several problems in political economy. Stepan and Skach find that democracy is more likely to survive under parliamentary governments; we find this result is not robust to the use of different variables from DPI, raising puzzles for future research. Similarly, Roubini and Sachs find that divided governments in the OECD run higher budget deficits following fiscal shocks. Replication of their work using indicators of divided government from the DPI indicates otherwise, again suggesting issues for future research.
Transcript of New tools and new tests in comparative political economy: The Database … · · 2003-08-13New...

New tools and new tests in comparative political economy:The Database of Political Institutions
Thorsten Beck, George Clarke, Alberto Groff, Philip Keefer,
and Patrick Walsh
Beck, Clarke, Keefer and Walsh: Development Research Group, The World Bank. Groff: FederalDepartment of Foreign Affairs (Switzerland).
This paper’s findings, interpretations, and conclusions are entirely those of the authors and do notnecessarily represent the views of the Federal Department of Foreign Affairs, or the World Bank,its Executive Directors, or the countries they represent.
Abstract: This paper introduces a large new cross-country database of political institutions, theDatabase on Political Institutions (DPI). It covers 177 countries over 21 years, 1975 – 1995. Thepaper explores the range of issues for which this data should prove invaluable, summarizes keyvariables, many of them new, and compares this data set to others. Among the novel variables weintroduce are several measures of checks and balances, tenure, and stability; identification of partyaffiliation with government or opposition; and fragmentation of opposition and government partiesin legislatures. We illustrate the application of DPI variables to several problems in politicaleconomy. Stepan and Skach find that democracy is more likely to survive under parliamentarygovernments; we find this result is not robust to the use of different variables from DPI, raisingpuzzles for future research. Similarly, Roubini and Sachs find that divided governments in theOECD run higher budget deficits following fiscal shocks. Replication of their work usingindicators of divided government from the DPI indicates otherwise, again suggesting issues forfuture research.
2
Introduction
The investigation of the institutional and political roots of government decisions has
accelerated rapidly in the last twenty or more years. However, cross-country empirical work has
been handicapped by a lack of detailed data on the political and institutional characteristics of
countries, and their change over time. Comparative political economy, therefore, has been
restricted to small-sample case studies, important in their own right, but imposing unavoidable
limits on researchers seeking to generalize their results beyond the case study sample.
The lack of data has been a serious obstacle to better understanding of numerous areas in
political economy, including the political conditions under which governments promote rather than
retard economic development. Despite evidence that institutions underpin economic
development, we are still far away from the answers to two fundamental questions: Which
political institutions are most conducive to development and reform? And under what conditions
do such institutions emerge? Unfortunately, cross-country data that could help to answer these
questions, data that provided a disaggregated picture of a country’s political institutions and
operations, have been scarce. In this article we introduce a new data set that fills many of these
data gaps, the Database on Political Institutions (DPI). It has been compiled in the Development
Research Group of the World Bank, but it rests on an intellectual foundation laid by a large body
of political economy research.
The DPI contains 113 variables (detailed in Annex 1) for 177 countries over the years
1975-95. The variables provide details about elections, electoral rules, type of political system,
party composition of the opposition and government coalitions, and the extent of military
influence on government. The DPI also contains a number of new variables, compiled from the
raw data, including original measures of checks and balances and political stability.
In contrast to other databases, these variables are nearly all objective and their
3
construction is entirely transparent. They are also disaggregated, allowing researchers to get away
from such useful but broad indicators of countries as whether they allow elections or not, whether
elections are “free”, or whether the executive is “constrained.” Instead, the DPI allows researchers
to use precise and concrete institutional features of countries, and to combine them in ways
appropriate to theories they are examining.
In this paper, we identify numerous and policy-relevant research directions where this data
will be helpful. We also describe the different variables and demonstrate their utility in several
applications. For example, we find that earlier results concerning the impact of divided
government on public debt (Roubini and Sachs, 1989), and the impact of presidentialism vs.
parliamentarism on democratic consolidation (Stepan and Skach, 1993), change considerably when
their methodologies are replicated using the DPI’s variables on divided government,
presidentialism and parliamentarism. The remainder of the paper, and the annexes, provide details
on sources and collection methodology.
The need for cross-country institutional data
A large and diverse array of inquiries into the political economy of economic development
and the determinants of institutional change have been hindered by the absence of detailed cross-
national objective data on the institutional and political characteristics of countries. A few of the
areas of investigation to which the DPI can contribute are outlined here.
Political Business Cycles. Research on the existence and importance of a political business cycle
has largely focused on a select group of developed countries. One reason for the narrow focus has
been the absence of election data in a larger sample of countries. The Database on Political
Institutions has election dates (month and year) and election winners and losers for more than 150
countries since 1975. Both legislative and executive elections are included, as is the composition
of governments both before and after elections.
4
Checks and balances: stability versus decisiveness. The contribution of political institutions
to economic policy outcomes is another important area of research. For example, divided
governments or checks and balances are thought to have conflicting influences on economic
development. One line of research suggests that they encourage budget deficits and delay
reactions to crisis. Another line of work finds that they increase the predictability and restraint
with which governments regulate firms and citizens. Research on the first topic (e.g., by Roubini
and Sachs) focuses on a selected group of OECD countries. Research on the second issue has
relied on case studies (for example, North and Weingast, 1989, study the introduction of
institutional checks following the Glorious Revolution in England), or on subjective data, such as
the extent of “executive constraints” in a country (e.g., Keefer and Knack, 1997). The DPI
includes several objective measure of checks and balances that permit the impact of this
institutional feature of countries to be systematically analyzed, and the tradeoffs between stability
and decisiveness to be investigated.
Electoral rules, policy maker incentives, and corruption and fiscal policy. Another set of
theories in political economy predict that pork barrel spending and corruption will vary
systematically both with the number of decision makers (Rasmusen and Ramseyer, 1994) and with
the electoral rules by which decision makers are selected (Cox and McCubbins, forthcoming).
Tests of these theories are made difficult by the absence of cross country data on both of these
institutional dimensions. This data set goes some distance in remedying this problem. First, it
provides a better approximation of the number of key decision makers in a country through two
variables on the number of checks and balances. Second, it presents information on voting rules in
countries, including the use of plurality and/or proportional systems, closed or open list systems,
threshold or D’Hondt systems, and the relative dominance of these systems if more than one is
used.

5
Political stability, political tenure, and government policy. Government officials may also
make decisions that retard development because their policy horizons are limited to their time in
office. The shorter the horizon of officials, the more likely it is that they will take actions with
significant long-run costs to obtain modest short-run benefits. All existing analyses of the impact
of leader horizons (for example, Alesina, et al., 1996,and Clague, et al., 1996) rely on executive
turnover measures. However, in systems in which the prime minister or president is not the only
veto player, these turnover measures present a biased picture of the horizons of all veto players. In
particular, in countries with multiple veto players, the replacement of a president, prime minister,
or even a cabinet, does not always mean that all veto players from the previous government have
changed. Often, some of the parties that exercised a veto role in earlier governments reappear in
successor coalitions. This database allows more nuanced turnover indicators to be constructed,
and presents two such indicators.
Civil war, ethnic conflict and political institutions. The conditions under which ethnic groups
are in conflict and that this conflict leads to violence are a continuing and important focus of
research (see, e.g., Collier and Hoeffler, 1999). However, political institutions are likely to have
both a significant influence on whether ethnic groups encounter conflicts of interest and on
whether those conflicts precipitate violence. Institutions affect whether different groups have a
voice in the allocation of state resources; they also affect the credibility of assurances provided by
one ethnic or other interest group to another (Weingast, 1998). The DPI has information bearing
on both of these issues.
Electoral rules, such as voting thresholds and other choices regarding the aggregation of
votes, influence whether minority interests are more or less likely to be influential in the formation
and dissolution of governments – and hence, more or less likely to abandon formal, institutional
channels for the resolution of their grievances. Similarly, the existence of multiple veto players –

6
checks and balances – should make it more likely that any given ethnic or other interest group has
the ability to block state actions that are to its detriment. This is the essence of institutional
arrangements that enhance credibility.
Electoral competitiveness and policy outcomes. To the extent that the “losers” from
economic reform are politically influential – are key constituents of political decision makers –
reform is less likely. This is a truism of political economy, but it leads to a still unanswered
question: are politicians most likely to favor constituents who were supporters in past elections but
deserted them recently; those whose support is up for grabs and could swing the next election one
way or the other; or core supporters who never abandon them under any circumstances? All of
these possibilities receive some theoretical and empirical support (see Dixit and Londregan, 1996,
and Schady, 1998).
A simpler question, which is similarly unanswered, is whether greater competition in
contests for political office increases or reduces the willingness to reform. Faced with the prospect
of more competitive elections, politicians might be more sensitive to redistributive concerns and
less likely to reform. However, politicians who feel few competitive pressures to reform may be
more likely to engage in policies that benefit them and their core supporters at the expense of the
rest of society. In the latter case, greater electoral competitiveness might lead to greater
willingness to pursue policies that are less disproportionately beneficial to them and their core
supporters. Several variables in this database, ranging from indices of electoral competitiveness, to
the vote shares of parties and directly elected executives, permit cross-country investigation into
questions such as these.
Poverty alleviation and voice. The construction of a safety net for the poor, or of programs that
allow the poor to build human and financial capital to rise out of poverty, is often distorted by
political imperatives. Pritchett and Gelbach (1997), for example, have provided evidence and

7
theory indicating that targeting assistance to the poorest is unsustainable over time. In a simple
majority-rule setting, they show that the less poor majority eventually demand more expansive
coverage of targeted programs as a condition for their continued support of them. However, the
structure of political institutions can mitigate – or exacerbate – this outcome. The rules governing
election to the US Congress, for example, give an incentive to legislators representing the inner city
and to those representing farming districts to agree on the continued provision of narrowly targeted
food stamps. Such incentives are less strong in countries where legislators represent broader
segments of society, most of whom gain little or lose from targeted assistance. The DPI contains
variables that help to capture some of the institutional features that would affect the sustainability
of targeting, including the presence of legislatures and rules governing election to legislative
chambers.
Economic tradeoffs in constitution drafting. When tremendous institutional transformations
occur, from totalitarianism to democracy, or even from one constitution to another, they entail
numerous detailed decisions from among a broad array of institutional choices. Here, again, the
empirical evidence that should inform these choices – e.g., which electoral rules? how should the
executive be selected? – has been largely unavailable. As a consequence, decisions about large
issues – should a system be presidential or parliamentary? – and smaller but still important issues –
how high should voting thresholds be, which rules of proportional representation should be
adopted – tend to rest on intuition and political self-interest, uninformed by empirical evidence
about the later consequences of these choices for growth, development, or social conflict.
Variables in the DPI should contribute to accelerated empirical research on such questions.
The Variables
The variables in this dataset provide considerable scope for improving our ability to answer
these questions. The more than one hundred different variables can be divided into seven general

8
categories. Each category, if not each variable, is described in this section.
1. Political system and electoral competitiveness
Two fundamental characteristics of a political system are the relationship of the executive
and legislative branches, and the competitiveness of elections of the political actors who occupy
them. The DPI has information on both. With regard to the first, the variable SYSTEM was
created to capture whether countries are presidential, assembly-elected presidential, or
parliamentary. Determining whether political systems are presidential or not depends on answers
to a number of questions. Our judgements are similar to those of others, but were modified to
take into account our particular sources.
The first question is straightforward: is there a single executive elected by popular vote? If
both are true, the system is coded as “presidential.” However, there are countries in which both a
prime minister and a president are in place, or where the executive is elected by the legislature but
is called a president and enjoys the same degree of independence from the legislature, after
election, as the typical popularly-elected president. Countries with these characteristics were coded
in the following way.
For chief executives who were called presidents and who were elected by the assembly, as
in Bolivia, we ask whether the assembly can easily recall him or her. If they need a two-thirds vote
to impeach, or are required to dissolve themselves in order to force out the executive, then the
country is characterized as having an “assembly-elected president.” Otherwise, the country is
characterized as “parliamentary.”
Where there are both a president and a prime minister, we ask, how likely would it be for
the president’s view on legislation to prevail over that of the prime minister? This led us to place
greater weight on legislative powers of the president. We distinguish whether the system was
presidential or parliamentary with a three-part test. First, can the president veto legislation that

9
the parliament can override only with a supermajority? If so, the country is coded as presidential
despite the presence of a prime minister. Second, in the event that presidents lack this veto
power, we ask whether they can appoint and dismiss cabinet ministers (including the prime
minister) and dissolve the assembly. If they can do both, the system is again characterized as
presidential. Finally, in those few cases where these details are not revealed in the source material,
if the source material refers consistently to the president rather than the prime minister as the
important decision maker, the system is again classified as presidential (as in Romania and
Kyrgyzstan). The data is thoroughly annotated to identify these rare cases.
These decision rules led us to code Portugal and France as parliamentary rather than
presidential systems. Others (Shugart and Carey (1992), Shugart (1995)) place greater weight on
non-legislative presidential powers, such as the right to appoint cabinet members, and therefore
label these countries as presidential. Although policy making in France under divided executive
control seems to support our interpretation, legitimate reasons exist to use other categorization
criteria. One advantage of the DPI lies in its explicit statement of the rules we employ, allowing
researchers to determine more easily the adequacy of variables to their conceptual requirements.
The database also contains variables that characterize the competitiveness of elections in
countries. The earlier discussion outlined the potential importance of electoral competitiveness to
political economy investigations: the policy choices of politicians are likely to be influenced by the
likelihood that those choices will lead to their replacement. In addition, in the creation of checks
and balances variables, it matters a great deal whether the legislative and executive branches of
government are independent of each other. If legislative elections as a whole are non-competitive,
it is usually the case that the executive -- or whoever chooses the executive – also exercises
decisive influence over the legislature. Consequently, the legislature is less of a check on
executive behavior. Finally, investigations of institutional change, particularly of change to more
10
democratic decision making, need to accurately characterize the institutional environment.
Knowing the formal, constitutional rules governing countries is one way to characterize
democracy; an important supplement is to know whether these rules are applied in practice. The
Indices of Electoral Competitiveness address both of these issues.
There are two such indices in the data set, one for executive and one for legislative
elections. The core of the two indices is the number of parties that could and did compete in the
last election. Ferree and Singh (1999) present the first effort to code such variables, and our
indices are based on theirs. They classify 46 African countries on a six point scale (one to six).
The highest score (six) on their scale goes to countries in which multiple parties compete in
elections, even if they do not win seats. For the DPI, we collected sufficient information to
replicate this type of indicator for more than 100 additional countries. However, for wider
application of their indices we added a seventh point to the scale, in order to identify variation
among the large number of countries that exhibit elections where multiple parties run but only one
party enjoys great success. Countries receive a seven that have elections in which multiple parties
compete and the largest party receives less than 75 percent of the vote. Conceptually, this
distinction captures institutional or informal biases against political competitors that are not
revealed in our sources; empirically, this seventh category generates much more variability among
countries outside of Africa. The scale, then, is:
1 no executive/legislature2 unelected executive/legislature3 elected, one candidate4 one party, multiple candidates5 multiple parties are legal, but only one won seats (because other parties did not
exist, compete, or win seats).6 multiple parties competes and won seats (but one party one 75 percent or more of
the seats)7 the largest party received less than 75 percent of the seats.
As with distinctions between presidential and parliamentary systems of government,
11
numerous subtleties arise in assessing scores for these indices. They are thoroughly detailed in the
documentation accompanying the database. For example, many countries have executives who are
indirectly elected. In our rating scheme, they receive the same competitiveness score as the body
that elects them. Therefore, in a parliamentary system, executive elections are as competitive as
legislative elections. When there is an electoral college, elections are as competitive as
membership in the electoral college. If the executives themselves appoint the electoral college, the
systems are scored as two, on a scale of one to seven. Competitively elected prime ministers get
six or seven. The chief executives of Communist nations (the chairman of the Communist Party)
are assigned a three, because they are elected by the Party Congress, an electing body which they
do not appoint. Executives elected by small, appointed juntas or by appointed electoral colleges
receive a two. Countries that allow referenda on unelected executives are scored as three.
Three other variables supplement these indices. First, elections may be competitive, but
the military may nevertheless wield significant power behind the scenes. To get at this, we have
two variables indicating whether the chief executive and the minister of defense, respectively, are
military officers. Second, our sources often mention voting irregularities or candidate intimidation
that are serious enough to affect electoral outcomes, though coverage is far from complete. We
record such references irrespective of whether claims that fraudulent elections have occurred are
based only on the allegations of the opposition or are supported by independent international
observers. Non-constitutional irregularities are also recorded as present when important parties
boycott elections or the election results.
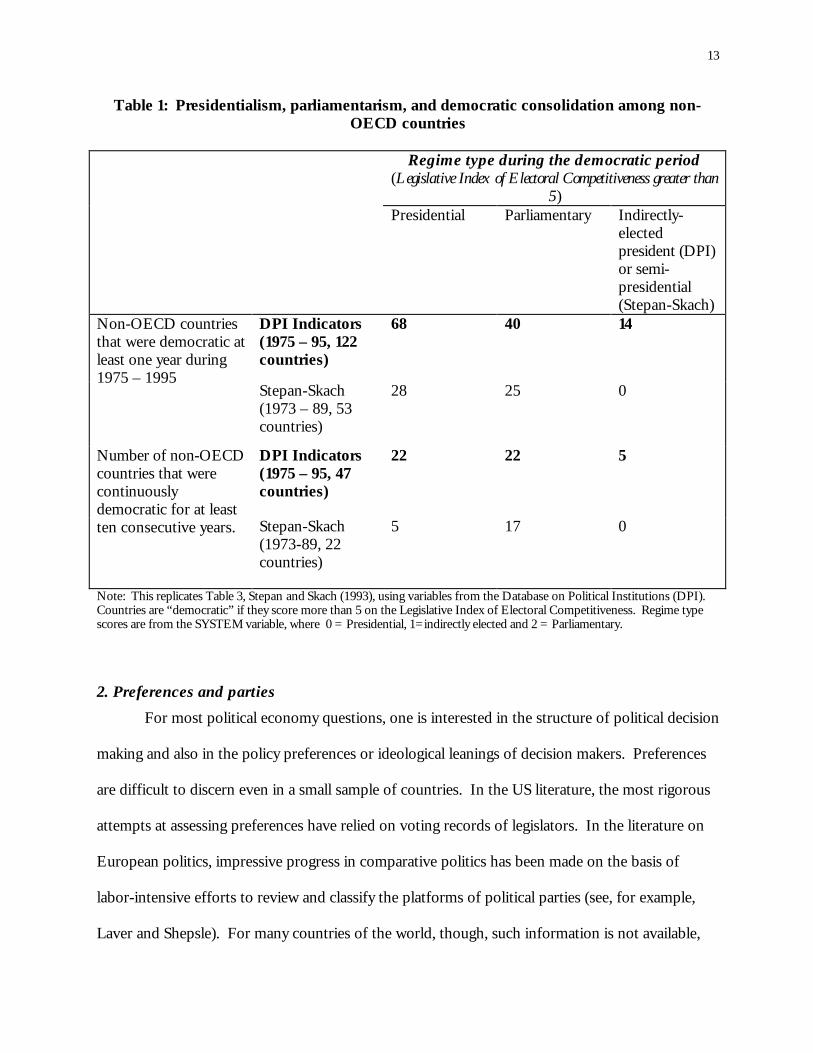
One application of these variables is to the debate over whether presidential or
parliamentary systems are more likely to lead to democratic consolidation. Stepan and Skach
(1993), for example, argue that parliamentary systems are more likely to be associated with long-
running democracy than are presidential systems. They offer as evidence the fact that of 53 non-
12
OECD countries, 22 were democratic for at least 10 consecutive years, and of these, 17 were
parliamentary. Variables from the DPI suggest a different picture, however. Table 1 indicates a
breakdown parallel to theirs using a different indicator of democracy (countries that score at least
six on the Legislative Index of Electoral Competitiveness), and the SYSTEM variable, and
applying these two variables to a large group of non-OECD countries from 1975 – 1995. In
contrast to their findings, the sample of countries that have experienced at least ten continuous
years of democracy is evenly split between presidential and parliamentary systems (22 countries in
each), rather than weighted in favor of parliamentary systems. Table 1 does not necessarily refute
the argument in Stepan and Skach (1993). It does suggest that with more extensive institutional
databases, research can begin to accommodate new levels of hypothesis-building in institutional
analysis, especially hypotheses that can explain such different findings as those in Table 1.
13
Table 1: Presidentialism, parliamentarism, and democratic consolidation among non-OECD countries
Regime type during the democratic period(Legislative Index of Electoral Competitiveness greater than
5)Presidential Parliamentary Indirectly-
electedpresident (DPI)or semi-presidential(Stepan-Skach)
DPI Indicators(1975 – 95, 122countries)
68 40 14Non-OECD countriesthat were democratic atleast one year during1975 – 1995
Stepan-Skach(1973 – 89, 53countries)
28 25 0
DPI Indicators(1975 – 95, 47countries)
22 22 5Number of non-OECDcountries that werecontinuouslydemocratic for at leastten consecutive years. Stepan-Skach
(1973-89, 22countries)
5 17 0
Note: This replicates Table 3, Stepan and Skach (1993), using variables from the Database on Political Institutions (DPI).Countries are “democratic” if they score more than 5 on the Legislative Index of Electoral Competitiveness. Regime typescores are from the SYSTEM variable, where 0 = Presidential, 1=indirectly elected and 2 = Parliamentary.
2. Preferences and parties
For most political economy questions, one is interested in the structure of political decision
making and also in the policy preferences or ideological leanings of decision makers. Preferences
are difficult to discern even in a small sample of countries. In the US literature, the most rigorous
attempts at assessing preferences have relied on voting records of legislators. In the literature on
European politics, impressive progress in comparative politics has been made on the basis of
labor-intensive efforts to review and classify the platforms of political parties (see, for example,
Laver and Shepsle). For many countries of the world, though, such information is not available,

14
not germane, or not a reliable indicator of decision maker preferences.
A starting point for any analysis that requires preferences of policy makers is the party
identification of decision makers. Our data set identifies the party of the prime minister and/or
president, the three largest parties in the government coalition, and the largest party in the
opposition. In addition, our sources provide useful information for some countries about the
policy preferences of key decision makers on five different dimensions: economic, nationalistic,
regional, rural, religious. These dimensions were chosen because they do not necessarily correlate
with each other: religious or nationalistic parties adopt both left and right wing economic policies;
some religious parties are not nationalistic and some are; etc. That is, we intended, where possible,
to allow for a multi-dimensional policy space. Coverage is far from exhaustive, unfortunately, but
constitutes the most comprehensive characterization of parties and decision makers that can be
extracted from the sources upon which we relied.
Detailed information on party platforms (even on the existence of written party platforms)
is unavailable for most countries from our primary sources (Political Handbook of the World and the
Europa Year Book). We therefore first asked whether the orientation of a party was immediately
obvious from its name. If it was not, or if our primary sources disagreed about orientation, we
consulted a European website mantained by Agora Telematica
(http://www.agora.stm.it/elections/parties.htm) edited by Wilfried Derksen. Its coverage is non-
historical, however. Party orientation was also cross-checked against with information in Political
Parties of Africa and the Middle East and Political Parties of Eastern Europe, Russia, and the Successor
States, both published by Longman Current Affairs series. In the rare cases where conflict emerged
among these sources, we used the web site and noted the conflict in the Excel spreadsheet.
The first categorization refers to preferences regarding greater or less state control of the
economy – the standard left-right scale. Parties on the right are therefore those with the terms

15
“conservative” or “Christian democratic” in their names, or that are labeled right-wing in our
sources. Similarly, we classify parties as left if their names reveal them to be communist, socialist,
or social democratic or if the sources label them as left-wing. We classify parties as centrist that are
called centrist by our sources or if their position can best be described as centrist (e.g., because the
party advocates the strengthening of private enterprise but also supports a redistributive role for
government, for example in the form of a tightly knit safety net). Any party that cannot be
classified in any of the three categories is categorized as “other”. These are frequently parties in
non-competitive electoral systems.
The second dimension we consider is “nationalism”. A party or the chief executive is
coded as nationalist if (i) a party is listed or described as nationalist in our sources, or (ii) a primary
component of the party’s platform is the creation or defense of a national or ethnic identity. With
respect to the latter, parties that fought for independence from a colonial power, such as the Indian
National Congress, or advocate the restriction of rights of minorities, such as the French National
Front Party, are notable examples.
A third dimension coded in the DPI is whether a party is rural or not. A party is classified
as rural if either the platform or the constituency is mainly rural. Finland’s and Sweden’s Center
Parties are prominent examples of rural parties. Similarly, a party is classified as regional if either
the platform or the constituency pertains mainly to a specific region of the country. Examples
include most of the Belgian parties, since separate parties exist in the Wallonian and the Flemish
part of the country.
Finally, we classify a party as religious if government policy towards religion or the
members of a particular religion are among the party’s core issues. We distinguish such parties
using, once again, the source characterizations of either the party’s platform or constituency. In
predominantly Islamic countries, parties are defined as religious if the chief executive or party
16
leader is also a religious leader, as is the case in Iran. The database also captures, among others,
religious parties in Israel, the Buddhist Komeito party in Japan and the Hindu-based Bharatiya
Janata Party (BJP) in India. With respect to Christian-Democratic parties, if any one of our sources
indicated that religious issues were a central part of their party platform, they are indicated as
Christian. Both the Italian and German Christian Democratic parties are therefore coded as having
religion as an important element of party orientation. Since religious issues are arguably not the
most central or salient concern of party members, this suggests that this variable is somewhat
biased towards identifying a religious orientation where none exists. On the other hand, for social
policy issues, or on questions such as immigration, the coding is likely to distinguish these parties
from others in the respective political systems in ways that are both relevant and useful.
3. Tenure, turnover and popular vote share of the Chief Executive and the ChiefExecutive’s Party
A key hindrance to development is the tendency of many political leaders to make
opportunistic decisions that entail long run costs to society that far outweigh short-run benefits.
The expropriation, directly or via taxation or regulatory policy, of private assets is the most
obvious example of such decision making. Leaders with shorter horizons in office are more likely
to find such choices to be worthwhile, and there is evidence suggesting that this effect is
significant, at least in less democratic countries (Clague, et al., 1996; see also Alesina, et al., 1996).
All research that has documented this effect has relied on data on the tenure and turnover of
governments (cabinets or prime ministers in parliamentary systems) or presidents. This
information is available in this data set, as well, for larger number of countries than previously
available. However, the DPI also provides opportunities to circumvent several ambiguities that
arise from reliance on existing data.
First, executives whose terms are shortened by constitutional limits on tenure might react
17
differently to limits on their time in office compared to other executives, with similar horizons that
are limited in other, perhaps non-constitutional ways. This data set therefore includes variables
indicating whether there are constitutional restrictions on executive terms and whether sitting
executives can be re-elected.
Second, executives with a stronger hold on power should, all else equal, have a longer
horizon than other executives. In particular, one would expect leaders with more popular support,
or weak opposition, to have a longer horizon. The strength of the political position of leaders can
be taken into account, at least partially, using variables that record the share of votes that
presidents received in their last election, and the share of votes of the prime minister’s or
president’s party.
Third, one would expect that stronger parties would rein in party members who happen to
have shorter horizons. Again, the DPI provides information that allows this to be taken into
account: the number of years that the party of the executive has been in office (independent of the
particular executive who has represented the party), and how long the party has existed under its
current name. Where the party of the executive has been in power longer than the executive, it is
more likely that the party restrains executives with short horizons. Similarly, parties that have
been in existence for a long period of time should have a longer time horizon than parties that have
not. We count the party’s existence from the date it adopted its name. Parties incur losses when
they change their name, not least of which is a loss of brand name. Frequent name changes
indicate either that parties have no brand name or are not well-established institutionally (to the
extent that these two things are different).
Finally, existing investigations of the effects of expected tenure or government turnover
track only one decision maker in a country, the head of government (president, prime minister or
cabinet). Most democratic countries, however, have multiple decision makers. A parliamentary

18
government can fall and be replaced by government with an entirely new set of coalition parties, or
by a new government with substantially the same set of coalition partners. A president can be
replaced with, or without, the corresponding replacement of the majority parties in the legislature.
Theory would suggest that dramatic changes in government policy, or in the potential for
expropriatory behavior by governments, are likely only when all decision makers are replaced.
Empirical measures of tenure and turnover have not matched this, however.
The DPI records whether parties are in the government coalition or not, and whether the
party of the executive controls the lower house (there is no data on upper houses in this data set).
With this information, one can calculate which of the main veto gates (legislature, executive) in a
system have changed hands in any year. Based on this information, the data set contains two new
variables, STABS and STABNS, on government stability that capture the extent of turnover in any
one year of a government’s key decision makers. They are calculated by dividing the number of
exits between year t and t+1 by the total number of veto players in year t. The variables are
therefore on a 0-1 scale, with zero representing no exits and one representing the exit and
replacement of all veto players. Veto players are defined as the president, largest party in the
legislature, for a presidential system; and as the prime minister and the parties in the government
coalition in a parliamentary system. These variables, are correlated at approximately .87 with
simple measures of executive turnover. While not dramatically different, they are different enough
to suggest that hypothesis tests invoking instability should be robust to both types of measures.
Along the same lines, measures of tenure length used in current research often refer only to
the executive. The DPI has several variables that provide different perspectives on tenure, include
the tenure of the veto player who has been in office the longest and the shortest period of time,
assuming multiple veto players, as well as the tenure of the political system – how long have
executive elections been competitive (at least six on the Executive Index of Electoral
19
Competitiveness) or, if they have not been competitive, how long the executive has been in office.
4. The Legislature
The role of the legislature in the political process is influenced not only by constitutional
restrictions on the scope of its initiative and veto authority, but also by its composition and the
relative strength of government and opposition coalitions. Currently, in order to characterize the
internal structure of legislators, researchers have had to rely on measures of fractionalization of the
legislature: the probability that any two legislators drawn at random would belong to the same
party. Greater fragmentation is taken to imply a larger number of actors willing to act
independently in the consideration of any given policy change. This variable has proven useful, but
it treats as identical highly dissimilar cases. For example, the variable would record the same value
for two legislatures: the first, in which a single opposition party controls 49 percent of the seats,
10 government parties share 49 percent of the seats, and a remaining government party controls 2
percent of the seats and a second, in which a single government party controls 49 percent of the
seats with a coalition partner that controls 2 percent, while 10 opposition parties share 49 percent
of the seats.
The data set introduced here allows for the calculation of the traditional measure of
legislative fragmentation. However, our sources also allowed us to identify which parties were
inside and outside of the governing coalition. For coalition governments, the sources generally list
the party affiliations of cabinet ministers. Otherwise, the country descriptions provided this
information. Where the information was not available, for a small number of parties and countries,
this is indicated in the DPI. With this information, variables were created to record separately the
fragmentation of the government coalition and the opposition. The correlation of the government
and opposition fragmentation measures is only 0.267, suggesting that average fragmentation for
the entire legislature is likely to be misleading for many purposes. For example, the number of

20
checks (parties in a government coalition) in parliamentary systems cannot be reliably inferred
from fragmentation of the whole legislature. Similarly, in investigations of the relative influence of
executives and legislatures when legislatures become more fragmented, the relevant issue is the
fragmentation of government-allied parties, on which the DPI has information.
5. Electoral Rules
The incentives of political decision makers, and their ability to act independently of each
other, depends in large measure on the electoral rules under which they operate. Among other
effects, electoral rules influence whether candidates have an incentive to pursue individual or party
interests; whether small and single-interest parties have an incentive to coalesce or to remain
independent; and whether party leaders exercise significant or weak influence on party candidates.
Each of these and other, similar electoral characteristics have a bearing on whether legislators are
more or less permeable to special interests.
One electoral rule that affects responsiveness to narrow interests is the Mean District
Magnitude (MDM). The MDM is defined in the database as the average number of representatives
(rounded to the nearest whole number) elected by each electoral district in a country.1 Higher
values of MDM (combined with proportional voting rules) reduce the incentives of parties to
coalesce and allow parties representing exclusively narrow interests the chance to gain a voice in a
government coalition. MDM is coded for up to two legislative chambers (House and Senate), if
they have elected members. The MDM varies from one in the United States or the United
Kingdom to as many as 153 for the Congo.
A second electoral characteristic that the data set captures is whether the districts of the
upper house are states or provinces. This is particularly useful in studies of federalism: the more
1 Cox (1997, p. 208), argues that the median district magnitude is superior, conceptually, but data on distribution of seatsacross constituencies is not available from our sources and Cox also acknowledges that empirically, the distinction has notproven important.
21
closely that the constituencies of national legislators match those of sub-national governmental
jurisdictions, the more likely that those sub-national interests will be reinforced in national-level
decision making.
Voting rules are a third aspect of electoral rules. The DPI records whether legislators are
elected using majority (first past the post) or proportional representation systems. These rules
affect candidate incentives to adhere to party positions (as in proportional representation) and to
build up personal constituencies at the expense of party positions. If at least some members of the
legislature are elected by simple majority vote, the electoral system is coded as “pluralistic.” If at
least some candidates are elected based on the percentage of votes received by their party, the
system is coded as proportional representation (PR). Countries are allowed to (and do) exhibit
both systems; in this case, the system that governs the majority of candidates is indicated for each
legislative chamber.
Proportional representation systems differ widely according to whether they favor large or
small parties or privilege party leaders or individual candidates (see Cox 1997 for a thorough
discussion). The data set therefore records if there is a threshold that parties have to overcome in
order to gain any seats in the legislature and whether the D’Hondt system, which is less favorable
to small parties, is used to calculate the number of seats that each party receives. There is also a
variable that records whether the electoral system is closed or open list. A system is classified as
closed if voters cannot express preferences within a list – that is, if the position on a party’s
candidate list combined with the number of votes received by the party is the sole determinant of
whether a candidate is elected or not.
Some, albeit scanty information is available on the candidate selection process. Especially
in majoritarian settings, this is a crucial dimension along which countries vary in the extent of party
control of candidates. Systems that use “smoke-filled back rooms” to identify a party’s candidates

22
offer party leaders greater influence than those that use party primaries. Where possible, the data
set therefore includes a variable that reflects whether selection is of one of the following three
types:
1 on a national level, i.e. by national executive, party leader, interest groups or party factions;2 on a sub-national level, i.e. by subset of constituency party members e.g. on conventions;3 by primary election, including party primary and primaries using all the votes of a
constituency.
The DPI, finally, records the month when presidential/parliamentary elections were held.
6. Checks and Balances
A key element in the description of any political system is the number of decision makers
whose agreement is necessary before policies can be changed. Numerous decision makers with
different policy preferences are likely to respond differently (more incrementally, for example) to
reform opportunities than single decision makers. On the other hand, countries with multiple
decision makers may offer greater protection from arbitrary government action to individuals and
minorities. Interests that are unrepresented by government decision makers when there are few
key decision makers may gain representation when the number of decision makers rises.
The DPI significantly extends one existing measure of checks and balances, and introduces
new measures and the possibility of constructing others. One existing measure is the Index of
Political Cohesion, originally devised and coded by Roubini and Sachs (1989) for a set of 14
OECD countries to study the political and economic origins of high-debt countries. They record
whether the same or different parties control the executive and legislature in presidential systems,
and, in parliamentary systems, whether there is a one, two, or three or more party coalition
controlling government, or a minority government. The DPI has information on governing and
opposition parties for over 150 countries, allowing the Index of Political Cohesion to be compiled
for a much larger sample of countries.

23
There are significant coding differences for the 14 overlapping countries, however, so that
for these common observations there is a correlation of only .53 between the two. For example,
we differ from the original coding by Roubini and Sachs of the Index in calling Japan a minority
government for particular years, in labeling Finland a parliamentary system, and in coding the CDU
and CSU in Germany as two parties rather than one (XXsee annex xx for a complete identification
of differences). This has a significant impact on their empirical findings, at least over the ten years
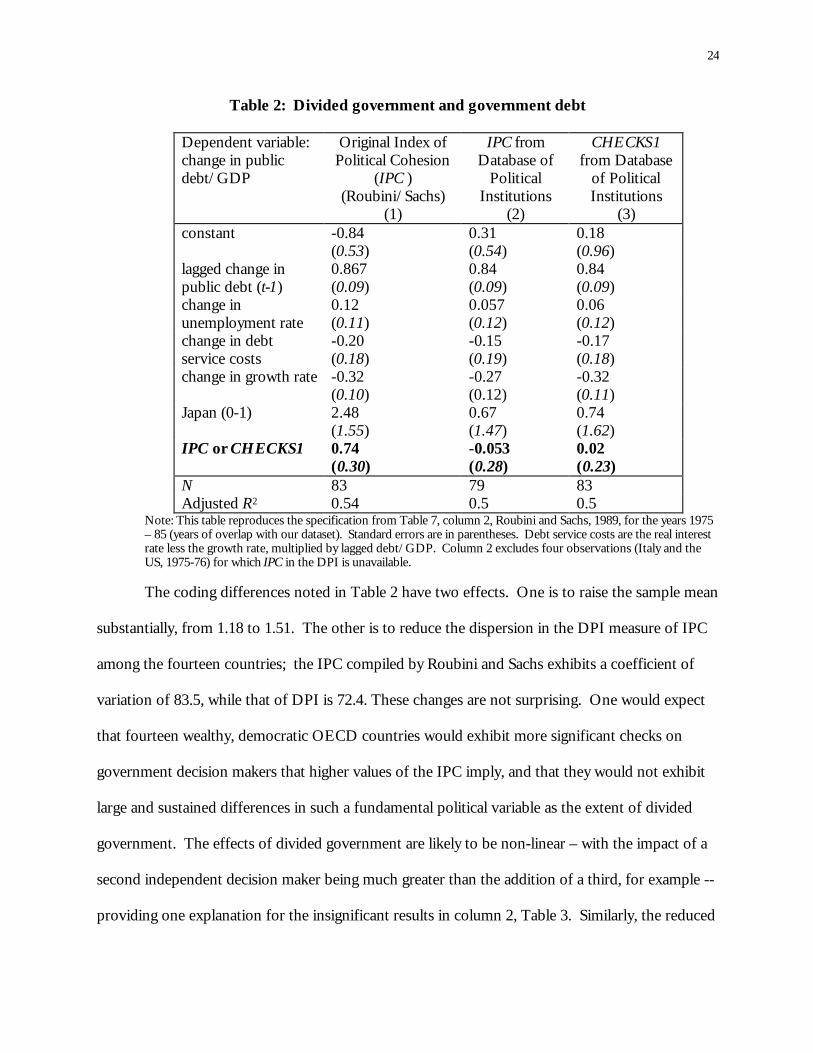
that the two versions overlap. Table 2 reports results from Roubini and Sachs, replicated for the
years 1975 – 1985, using their original coding of the Index and the coding in the database.2 They
argue, reasonably, that coalition governments should have greater difficulty responding to the
sudden emergence of crisis-driven budget deficits, a common occurrence in this decade.
They confirm this conjecture in their empirical work, replicated in Column 1, Table 2 for
the eleven year period for which the two databases overlap. The IPC coefficient is large, positive
and statistically significant. However, using the coding of the Index of Political Cohesion from
DPI, we find no such relationship (see Column 2, Table 2). What explains these divergent results?
As Table 3 demonstrates, there are several reasons for the differences in their Index of Political
Cohesion and the one coded for the DPI.
2 Our data on unemployment and inflation differ slightly from theirs, but despite this, in our replication using their owncoding of IPC we find as they do that IPC has a large and positive association with public debt.
24
Table 2: Divided government and government debt
Dependent variable:change in publicdebt/GDP
Original Index ofPolitical Cohesion
(IPC )(Roubini/Sachs)
(1)
IPC fromDatabase of
PoliticalInstitutions
(2)
CHECKS1from Database
of PoliticalInstitutions
(3)constant -0.84
(0.53)0.31(0.54)
0.18(0.96)
lagged change inpublic debt (t-1)
0.867(0.09)
0.84(0.09)
0.84(0.09)
change inunemployment rate
0.12(0.11)
0.057(0.12)
0.06(0.12)
change in debtservice costs
-0.20(0.18)
-0.15(0.19)
-0.17(0.18)
change in growth rate -0.32(0.10)
-0.27(0.12)
-0.32(0.11)
Japan (0-1) 2.48(1.55)
0.67(1.47)
0.74(1.62)
IPC or CHECKS1 0.74(0.30)
-0.053(0.28)
0.02(0.23)
N 83 79 83Adjusted R2 0.54 0.5 0.5
Note: This table reproduces the specification from Table 7, column 2, Roubini and Sachs, 1989, for the years 1975– 85 (years of overlap with our dataset). Standard errors are in parentheses. Debt service costs are the real interestrate less the growth rate, multiplied by lagged debt/GDP. Column 2 excludes four observations (Italy and theUS, 1975-76) for which IPC in the DPI is unavailable.
The coding differences noted in Table 2 have two effects. One is to raise the sample mean
substantially, from 1.18 to 1.51. The other is to reduce the dispersion in the DPI measure of IPC
among the fourteen countries; the IPC compiled by Roubini and Sachs exhibits a coefficient of
variation of 83.5, while that of DPI is 72.4. These changes are not surprising. One would expect
that fourteen wealthy, democratic OECD countries would exhibit more significant checks on
government decision makers that higher values of the IPC imply, and that they would not exhibit
large and sustained differences in such a fundamental political variable as the extent of divided
government. The effects of divided government are likely to be non-linear – with the impact of a
second independent decision maker being much greater than the addition of a third, for example --
providing one explanation for the insignificant results in column 2, Table 3. Similarly, the reduced

25
dispersion of the IPC in the DPI would also explain the differences in the results across columns 1
and 2 of Table 2.
Table 3: Differences in Coding the Index of Political Cohesiveness:Database of Political Institutions and Roubini and Sachs (1989)
(OECD nations, 1975-1985)
Source of Difference Observations Affected
DPI counts CDU and CSU as 2 parties; RS89counts them as 1.
Federal Republic of Germany,1983-1985
DPI indicates 2-party government; RS89 indicatesa 1-party government.
United Kingdom, 1978Norway, 1975-1980Sweden, 1975
DPI indicates a minority government; RS89indicates a majority government of one party or amajority coalition.
Belgium 1982-1985Denmark 1978, 1984-1985Japan 1977-1980, 1984-1985Norway 1985Sweden 1983-1985UK 1977, 1979
DPI indicates a minority government, RS89indicates a majority government of one party or amajority coalition. It is also possible thatlanguage- based “wings” of parties are treateddifferently – DPI often counts them as separateparties.
Belgium, 1976-1977
For each year, DPI records the situation as ofJanuary 1; RS89 seem to use a differentconvention.
Denmark, 1981Ireland, 1981Norway, 1981-1982Sweden, 1976, 1978-1979, 1981
Possible that language-based “wings” of partiesare treated differently – DPI often counts them asmultiple parties.
Netherlands, 1978-1985Belgium, 1981
DPI classifies them as parliamentary; RS89classifies as presidential.
Finland, 1975-1985France, 1975-1985
One can examine the robustness of the results in column 2 by substituting for IPC a
measure of the number of independent decision makers in a government. The underlying logic of
the Roubini and Sachs argument suggests that such a measure, too, should be correlated with the
26
difficulty of responding to fiscal crisis. One such measure in the DPI is the variable CHECKS1, a
measure of checks and balances that is explained below. Results using CHECKS1 in place of IPC
are displayed in Column 3, Table 2, and again demonstrate no significant relationship between the
number of decision makers and response to fiscal crisis in this small and relatively homogeneous
sample of countries.
Because of the small and relatively homogeneous number of countries considered, the
results in columns 2 and 3 of course do not reject the Roubini/Sachs conjecture – divided
governments have greater difficulties in agreeing to a response to crisis. They only suggest that as
we advance in our attempts to make cross-country institutional characterizations of polities,
legitimate distinctions will arise among superficially similar concepts. On the one hand, these
distinctions need to be subjected to scrutiny; on the other hand, if they are reasonable, they need
to be used to test the robustness of empirical claims in political economy. Where robustness is
weak, this likely implies new opportunities for research: why do some measures of checks and
balances, following one set of criteria, lead to results that are not replicable using other reasonable
measures of checks and balances, capturing different institutional dimensions?
The Index of Political Cohesion does not distinguish countries according to the
effectiveness of electoral checks on government decision makers. This is a particularly relevant
concern when expanding the index to a set of countries outside of the OECD. When electoral
checks are few, perhaps because of laws limiting political competition, executive control of the
legislative apparatus is usually strong. Legislative seats depend on party nomination, which in turn
is usually vested in the executive in such countries. The Index also does not take into account
electoral rules that influence party control over members, an issue even in OECD countries.
Where party control is weak and the same party controls both the legislative and executive
branches of a presidential government, this index would understate the level of checks and

27
balances by coding the country as not having a divided government.
To adjust for these circumstances, the DPI includes two new variables, CHECKS1 and
CHECKS2. These variables count the number of veto players in a political system, adjusting for
whether these veto players are independent of each other, as determined by the level of electoral
competitiveness in a system, their respective party affiliations, and the electoral rules. Both
variables take into account the Legislative Index of Electoral Competitiveness. If the index is less
than four, the two measures are set equal to one since, regardless of the formal constitutional
arrangements in a system, where legislative elections are uncompetitive, constitutional checks on
officials are unlikely to be binding.
For values of the electoral competitiveness index of four or more, the variable CHECKS1
is increased by the number of veto players in the system.3 In presidential systems, it is increased
by one for the president and one for each legislative chamber. However, if elections are conducted
under closed list rules (closed list equals one) and the president’s party is the largest government
party in a particular chamber, then it is assumed that the president exercises substantial control
over the chamber and it is not counted as a check. For parliamentary systems, CHECKS1 is
increased by one for the prime minister and the number of parties in the government coalition,
including the prime minister’s own party. If the system is closed list, however, and the prime
minister’s party is the largest in the government coalition, then this sum is reduced by one.
Relative to the Index of Political Cohesion, then, CHECKS1 allows a legislative chamber to
exercise veto power even if the same party controls both the chamber and the executive branch.
Keefer and Stasavage (1999) use CHECKS1 to demonstrate that the delegation of
monetary policy to a central bank has a significant dampening effect on inflation only in the
presence of checks and balances. Keefer (1999) finds that the determinants of banking crises are

28
substantially different in countries that exhibit high values of CHECKS1 compared to those
countries that exhibit lower values.
The variable CHECKS1 can also be used to fuel the debate about whether presidential or
parliamentary forms of government are likely to result in “decisive” decision making. Some (see
Stepan and Skach, 1993) argue that presidential governments are more likely to give rise to
gridlock, since neither the legislature nor the executive has an incentive to give way in policy
debates because they are independently selected. It is not clear, however, which is more likely:
that an independent legislature would veto the proposals of an executive, or that members of a
government coalition in a parliamentary system would veto the same proposal emanating from
another member of the coalition. The average CHECKS1 variable for all countries that score
either six or seven on the Legislative Index of Electoral Competitiveness is actually much higher
for parliamentary systems (3.57) than for presidential systems (approximately 1.96). While
legislative and executive interests are rarely unified in presidential systems, governments in
parliamentary systems are even less so. However, it remains unclear whether bargaining among
multiple coalition partners in parliamentary systems regarding particular proposals is less costly
than bargaining between only two veto players in presidential systems. The DPI data set, however,
provides one tool for advancing research on this question.
The extent to which one political decision maker might act as a check on another depends
in part on the similarity of their policy preferences. Government decision makers are more likely
to exercise strong veto power if their policy preferences are closer to those of the opposition and
more distant from the preferences of other government decision makers. Such a decision maker
would be more willing to leave the government and join the opposition than decision makers
whose views were far from the opposition. To take into account the policy orientation of parties,
3 The values of CHECKS1 and CHECKS2 are nearly invariant to the use of the Executive or Legislative Index of Electoral

29
a second checks and balances variable, CHECKS2, was therefore compiled and introduced into
the data set. CHECKS2 is therefore the same as CHECKS1, but is augmented by one for every
veto player (defined as the largest government party in the legislative chamber in presidential
systems, and all coalition members in parliamentary systems) whose orientation (left, right or
center) is closer to the opposition’s orientation than to the average of the rest of the government.
The opposition’s orientation is given by the orientation of the largest opposition party.
These new measures of checks and balances offer considerable additional information
about polities. Their correlation with the coding of Index of Political Cohesion in the database is
less than 0.60. This suggests that theoretical priors about the number of veto players in
government can make a significant difference for empirical work, reinforcing the need for diverse
data sets and variables.
7. Federalism
Sub-national political structure affects national level policy making in numerous ways.
First, sub-national units may have veto power over national level policy decisions. Second, they
may exert pressure for greater, or at least different levels of redistribution than would otherwise be
the case. Third, their existence may affect the cohesiveness of national parties, which struggle for
positions in both sub-national and national jurisdictions, although the distribution of voter
preferences in the two could be quite distinct.
There are several variables in the DPI to capture the extent of federalism in a country’s
political structure. The first is whether there are contiguous autonomous regions in a country. An
autonomous region is recorded if a source explicitly mentions a region, area or district that is
autonomous or self-governing. We required that autonomous regions be constitutionally
designated as “autonomous”, “independent” or “special”.
Competitiveness.

30
A second dimension of information on sub-national governments is whether
state/provincial governments are locally elected. This is zero if neither the local executive nor the
local legislature are directly elected by the local population that they govern; one if either is
directly elected and the other is indirectly elected (e.g., by councils at subsidiary levels of
government) or appointed; and two if they are both directly and locally elected. If there are
multiple levels of sub-national government, we consider the highest level as the “state/province”
level. We also investigated, with limited success, whether municipal governments were locally
elected. This was coded the same as the state/provincial government. If there were multiple levels
of sub-national government, we considered the lowest level as the “municipal” level.
The third dimension on which we attempted to collect information is the jurisdiction of
local governments. We asked whether the states or provinces had authority over taxing, spending,
or legislating. The variable is coded as one if our sources report authority over any of these areas.
Sources and Data Collection
There were two main sources of data for this project, each used for a different time period.
For the period 1975-1984, Europa Year Book was consulted For the period 1985-1995, the Political
Handbook of the World, edited by Arthur Banks, was used. However, Europa was also used in this
second time period to plug topical gaps in coverage, mostly for electoral rule and constitutional
framework variables.
There were several reasons for dividing our study between two sources. First, prior to
1985, the Political Handbook of the World was published every 2-4 years and lacked detailed, year-
by-year observations. This factor recommended Europa for the first time period. In the period
1985-1995, the two books provided complementary information. Europa has better data on the
number of seats held by parties, the constitutional framework and electoral rules over this period,
while the Handbook offers more detailed information on the ideological orientation of the parties

31
and recent political history. Therefore, both sources were used, with an emphasis on the
Handbook.
The consistency of data between these two time periods was extensively checked. The
collection system helped ensure that discrepancies would be identified and discussed, since
different people were responsible for coding different time periods. In the event of discontinuities
in the 1984 – 85 period, the coders’ approaches were discussed among a wider group, including
most of the authors of this paper, to determine which was more appropriate, and the country-
variable was re-coded accordingly. Most of these discontinuities involved time-sensitive variables
(how long in office, in majority, etc.); electoral rule variables (closed list, plurality/PR); and the
ideological orientation of parties. They were resolved largely by establishing and refining the
conventions of data collection, such as when a ruler was credited with taking office (in former
colonies, upon internal self-government rather than independence) or what exactly constituted an
electoral rule (whatever rule governs the majority of seats). There were, besides, extensive
consultations on resolution of ambiguities. The results of these discussions are all reflected either
in the documentation sheet, in the form of rules that were followed for coding, or in the notes
embedded in the corresponding cells in the Excel spreadsheet.
Electoral rules were more difficult to capture than other institutional variables, and were
often not available in the handbooks. For the later period (1985-1995) we took most of our data
from the website of the International Parliamentary Union, which reports rules for 1998. When
this data matched the institutions described in 1975-1984, we assumed that no changes had been
made and filled in the intervening years. In the event that a system changed and then switched
back, this introduces errors. Since this assumption was made only when institutions from 1984
matched those in 1998, these cases are limited to very stable democracies. In the case where IPU-
1998 did not match earlier data, the IPU data was only inputted for 1995, and blanks were left for

32
remaining years.
There were a number of alternative sources of data that could have been used. Prominent
among these is the Statesman’s Year Book edited currently by Brian Hunter. This is a valuable
source, but we rejected it in favor of the above sources for several reasons (recalling that the
addition of a single source to the compilation process implied at least four person-months of
additional work). First, although Statesman’s level of detail is excellent in Europe and developed
nations, its coverage of developing nations is less detailed than in our preferred sources. The
number of seats won by parties is more often omitted, as is the identification of parties as affiliated
with or opposed to the government. Details on the electoral systems are also more often absent,
as are vote percentages for presidential systems. Our sources provided information on seats,
parties, and election results more consistently in developing nations. The reporting in Statesman’s
also lagged events by a few years, especially in developing nations or nations emerging from
Communism. For example, election results in countries such as Kazakhstan or Kyrgisztan are not
covered until 1995, compared to 1992 in our preferred sources. Finally, Statesman’s rarely
provided lists or descriptions of active parties.
Another possible source for this database is Keesing’s Record Of World Events. This source
was rejected because it was primarily focused on news rather than permanent institutions; and
because it is organized by month, creating significant compilation costs – since relevant data
would have to be scoured from every month’s report. Various other sources (CIA Handbook of the
Nations, OECD Political Data Handbook edited by Lane, et al., the Year Book of World Affairs,
produced by the London Institute of World Affairs) were rejected for reasons of coverage and
focus.
Despite the use of comprehensive sources and detailed cross-checking procedures, there
are several variables which need to be treated with some caution because of the fundamental

33
limitations of cross-country sources such as those upon which we relied. Party orientation is one
of these, since we were unable to rely on systematic listings of party platforms or legislative
positions. However, since our first-cut source (the party name/description in the handbooks) and
our default source (the Agora website) disagreed infrequently, we believe these variables can be
used with confidence.
Information scarcity hindered the coding of all of the federalism variables. Thirty-eight
percent of the observations are coded for the sub-national authority variable, and 42 percent of the
municipal election variables. The remainder are blank.
The indices of electoral competitiveness were coded according to a carefully established
set of conventions, all of which are described in the documentation. Nevertheless, there are many
cases that defied simple categorization (all noted either with notes in the Excel spreadsheet, or in
the documentation). When executives were elected by a body other than the overall populace, we
apply the categorization to that electing body (often the legislature, but sometimes an electoral
college) and impute its score to the executive. This results in military governments of Brazil,
Thailand, and South Korea receiving unusually high scores (5-7), since they did not “take” power,
but instead followed formal institutional procedures that involved selection by an elected
legislature. Similarly, even if a powerful executive rigged the elections (which is recorded
elsewhere), the country could still be scored a six or seven. While the formal procedures are likely
to understate the level of military control of the process, and overstate the level of electoral
competitiveness, we preferred to preserve the conventions in these cases.
Special rules were devised to handle deviations from constitutional procedures. If an
executive or legislature illegally suspends or ignores elections, the suspending entity is scored with
a two starting in the year after the event. If unelected dictators subsequently hold a plebiscite to
confirm their claim to office, their score is raised from two to three, but only if the plebiscite is

34
binding. Dynastic rulers in Arab countries, who inherit power, or otherwise obtain it through
obscure intra-family negotiations, are given the same “two” earned by military officers who seize
power in a coup.
The DPI compared to other databases
The DPI seeks to add to existing knowledge on political institutions, and to gather into one
source information that had previously been scattered. Therefore, it is reasonable to ask how this
database compares to other political databases, in terms of detail, coverage, and focus.
Comparisons to two illustrate the potential contribution of the DPI to future empirical research in
cross-country political economy. One of these is the Polity III database compiled by Gurr, et al.
(1998), and the other are the objective assessments of government checks and balances created by
Henisz (1997).
Polity III. Gurr, Jaggers, and Moore (1998) have compiled Polity III, covering a time
period stretching from 1800 to 1994. Polity III covers 156 nations - all those with populations
above 500,000 - and 20 areas that were later amalgamated into a single nation-state (Saxony,
Hesse, etc. into Germany; Lombardy, Tuscany, etc. into Italy). By comparison, our database
covers all sovereign nations with populations above 100,000 - in all, 177 countries, for the years
1975 - 1995.
Polity III includes numerous subjective indicators of the political and institutional
environment in countries. However, these tend to be highly aggregated. For example, subjective
measures of regulation, competition, and openness in executive recruitment incorporate
information about the elections or their absence; fraud; coups; scope of participation in the
selection of the executive; military involvement; the number of competing parties; and other
relevant factors. The weights assigned to these different characteristics, all of which are
appropriate to consider, are not clear, however. The Polity III variables “regulation” and

35
“competitiveness” of participation, like most of the Polity III variables, exhibit similar highly
aggregated characteristics. Implicit in their codings are evaluations of political violence and fraud;
constituencies of parties; legality of parties; and the endurance of parties over time. Using this
aggregate level of data organization, many qualities of the political system can be captured by a
very few variables, and the net effect of formal and informal (harder to observe and codify)
influences can be summarized. The disadvantage of this information is that those seeking specific
details on the electoral system will find this information inextricably entangled with the other
measures comprising the variable.
By comparison, the DPI uses variables that reflect only one dimension. For example, many
variables are dummies, focusing on questions such as “is the closed list system used?”, “is the chief
executive in the military?”, or “was there electoral fraud?”. Examples of non-dummy variables
include the seats, ideological orientation, and government/opposition affiliation of political
parties; details on the level of federalism; the elapsed time in office of the chief executive; and the
timing of elections. This database thus presents data at a disaggregated level. With some
exceptions, the DPI generally avoids the use of variables that wrap several different measures into
one number. The creation of such variables is left to the user. The exceptions to this are the
Indices of Electoral Competitiveness and the CHECKS variables. The electoral competitiveness
variables take into account rules governing whether parties can run and actual outcomes – whether
parties do run and win seats. The CHECKS variables draw on several variables within the
database to construct an index of checks and balances in the political system. While our variables
therefore do not necessarily reflect the informal constraints on electoral competition or executive
authority, they allow researchers to identify the extent of formal constitutional control on political
decision makers.
In addition to methdological differences in the two databases (subjective and aggregated,

36
but evaluating both formal and informal conditions in a country, compared to objective and
disaggregated), there also differences in the types of variables included. Our database has no
information on “collective executives”, such as military juntas; nor information on the scope of
government action or regulation in the polity; nor on the creation, destruction or nature of regime
change in polities. On the other hand, the DPI permits users to track more frequent and micro-
level changes in regimes, such as the composition of the legislature, changes in executive, or
changes in the electoral competitiveness indices. It also features several dummy variables
representing details of the electoral system and much more detail on parties in the system.
Political constraints. Henisz (1997) presents another valuable source of information on
political institutions, in particular the data necessary to create a measure of checks and balances.
His series addresses some key issues, such as the number of chambers in a legislature, the degree
of federalism, Supreme Court turnover, factionalization of the legislature, and the relative
influence of different parties among the executive, legislature, and judicial branches. From this
information, he formulates a measure of political constraints that is analagous to, but different in
construction from, the CHECKS variables reported here. The Henisz data has a longer time-series,
but substantially fewer variables (e.g., with regard to government or opposition parties, party
orientation, electoral rules, the different federalism indicators, etc.).
Keefer and Stasavage (1999) report empirical results using CHECKS1, from the DPI,
political constraints from Henisz, and Executive Constraints, a subjective variable from Polity III.
The key conclusions are generally robust to which variable is used (central bank independence
matters more in the presence of checks and balances). However, these variables are not so closely
correlated that one can assume robustness.
Conclusion
This database is the product of an effort to bring systematic, cross-country information on

37
political institutions within easy reach of researchers investigating comparative political economy.
We have found no other source of information that provides as much objective data on these
issues. Others, including some of the authors of this paper, have previously used in other work the
data sources relied upon to construct this data these variables (see Clague, et al., 1996, or Durham,
1999). However, we have found no case where all of the information has been compiled, and we
have identified many variables that have never been collected. Examples of these are the variables
identifying party orientation, party affiliation with the government or opposition, the military
affiliation of the executive or minister of defense.
The early part of the paper outlined a subset of the questions that the Database of Political
Institutions can potentially illuminate. They stretch across political science and economics,
ranging from the determinants of democratic consolidation, the political conditions for economic
reform, and the political and institutional roots of corruption, to the appropriate and
institutionally-sensitive design of economic policy recommendations. To enhance the availability
of the DPI for these purposes, it will be placed on several websites, particularly the political
economy website of Harvard University and the website of the World Bank’s Development
Economics Data Group [XXNOTE TO EDITOR: THESE WILL BE KNOWN WITHIN TWO
MONTHS].

38
Annex 1: List of Variables
The Database on Political Institutions (DPI) is a large new cross-country database of politicalinstitutions that covers 177 countries over 21 years, 1975 – 1995. This database was prepared byThorsten Beck, George Clarke, Robert Cull, Alberto Groff, Philip Keefer, and Patrick Walsh of theDevelopment Research Group of the World Bank. When using this database, please cite thecurrent paper.
General VariablesCountry Code COUNTRYC
International Financial Statistics code IFS
Year YEAR
Chief Executive VariablesDirect Presidential (0); strong president elected by assembly (1); Parliamentary (2) SYSTEM
How many years in office YRSOFFC
Is there a finite term in office? (1 if yes, O if no) FINITTRM
Years left in curent term YRCURNT
If there are formal restraints on his term (NA if not), can he serve multiple terms? MULTPL?
Is Chief Executive a military officer? MILITARY
Is defense minister a military officer? DEFMIN
President got what % of votes in the 1st/only round? PERCENT1
President got what % of votes in the final round? PERCENTL
Party of chief executive has been how long in office PRTYIN
Chief Executive’s PartyName of party, if any EXECME
Right (R); Left (L); Center (C); Not applicable (0) EXECRLC
Nationalist (1 if yes) EXECNAT
Rural (1 if yes) EXECRURL
Regional (1 if yes) EXECREG
Religious (1 not specified, CH:Christian, CA: Catholic, IS: Islamic, HD: Hindu, BD: Buddhist, JW: Jewish, O:otherwise) EXECREL
Time since formation under this name EXECAGE
Does party of executive control all relevant houses? ALLHOUSE
In systems with both non-ceremonial PM and President, what is the party affiliation of the one not called Chief Executive?NONCHIEF
Party Variables in the LegislatureHerfndahl Index for Govt. HERFGOV
Government fractionalization (chance that two random draws will produce legislators from different parties). GOVFRAC
# of Govt. Seats NUMGOV

39
Largest Government PartyName 1GOVME
Seats 1GOVSEAT
Right (R); Left (L); Center (C); Not applicable (0) 1GOVRLC
Nationalist (1 if yes) 1GOVNAT
Rural (1 if yes) 1GOVRURL
Regional (1 if yes) 1GOVREG
Religious (1 not specified, CH:Christian, CA: Catholic, IS: Islamic, HD: Hindu, BD: Buddhist, JW: Jewish, O:otherwise) 1GOVREL
Time since formation under this name 1GOVAGE
2nd Largest Government PartyName 2GOVME
Seats 2GOVSEAT
Right (R); Left (L); Center (C); Not applicable (0) 2GOVRLC
Nationalist (1 if yes) 2GOVNAT
Rural (1 if yes) 2GOVRURL
Regional (1 if yes) 2GOVREG
Religious (1 not specified, CH:Christian, CA: Catholic, IS: Islamic, HD: Hindu, BD: Buddhist, JW: Jewish, O:otherwise) 2GOVREL
Time since formation under this name 2GOVAGE
3rd Largest Government PartyName 3GOVME
Seats 3GOVSEAT
Right (R); Left (L); Center (C); Not applicable (0) 3GOVRLC
Nationalist (1 if yes) 3GOVNAT
Rural (1 if yes) 3GOVRURL
Regional (1 if yes) 3GOVREG
Religious (1 not specified, CH:Christian, CA: Catholic, IS: Islamic, HD: Hindu, BD: Buddhist, JW: Jewish, O:otherwise) 3GOVREL
Time since formation under this name 3GOVAGE
Number of other government parties GOVOTH
Number of other government party Seats GOVOTHST
Herfindahl Index for Opposition HERFOPP
Opposition fractionalization (chance that two random draws will produce legislators from different parties). OPPFRAC
# of Opp. Seats NUMOPP
Largest Opposition PartyName Largest Opposition Party 1OPPME
Seats Largest Opposition Party 1OPPSEAT
Right (R); Left (L); Center (C); Not applicable (0) Largest Opposition Party 1OPPRLC
Nationalist (1 if yes) 1OPPNAT

40
Rural (1 if yes) 1OPPRURL
Regional (1 if yes) 1OPPREG
Religious (1 not specified, CH:Christian, CA: Catholic, IS: Islamic, HD: Hindu, BD: Buddhist, JW: Jewish, O:otherwise) 1OPPREL
Time since formation under this name 1OPPAGE
2nd Largest Opposition PartyName 2nd 2OPPME
Seats 2nd 2OPPSEAT
3rd Largest Opposition PartyName 3rd 3OPPME
Seats 3rd 3OPPSEAT
Number of other opposition parties OPPOTH
Number of other opposition party seats OPPOTHST
Number of Parties non-aligned/allegiance unknown ULPRTY
Seats non-aligned/allegiance unknown NUMUL
Herfindahl Index Total HERFTOT
Total fractionalization (chance that two random draws will produce legislators from different parties) FRAC
Does one opp. party have majority in House OPPMAJH
Does one opp. party have majority in Senate OPPMAJS
Details on LegislatureWhen were legislative elections held (number records month, 13 indicates unknown month) DATELEG
When were executive elections held (number records month, 13 indicates unknown month) DATEEXEC
Majority (number of government seats divided by total seats) MAJ
Average Age of Parties PARTYAGE
Is there a legislative election? (“1” if yes) LEGELEC
Is there an executive election? (“1” if yes) EXELEC
Is executive party special interest? EXECSPEC
Is 1st gov. party special interest? GOVSPEC
Are any coalition parties special interest? COALSPEC
Electoral RulesLegislative Index of Political Competitiveness LIEC
Executive Index of Political Competitiveness EIEC
mean district magnitude (House) MDMH
mean district magnitude (Senate) MDMS
Number of senate/ (number of house + number of senate) S/S+H
Plurality? (1 if yes, O if no) PLURALTY
Proportional Representation? (1 if yes, 0 if no) PR
If Plurality and Proportional Representation which governs the majority/all of the House seats? (1 if Plurality, O if
Proportional) HOUSESYS
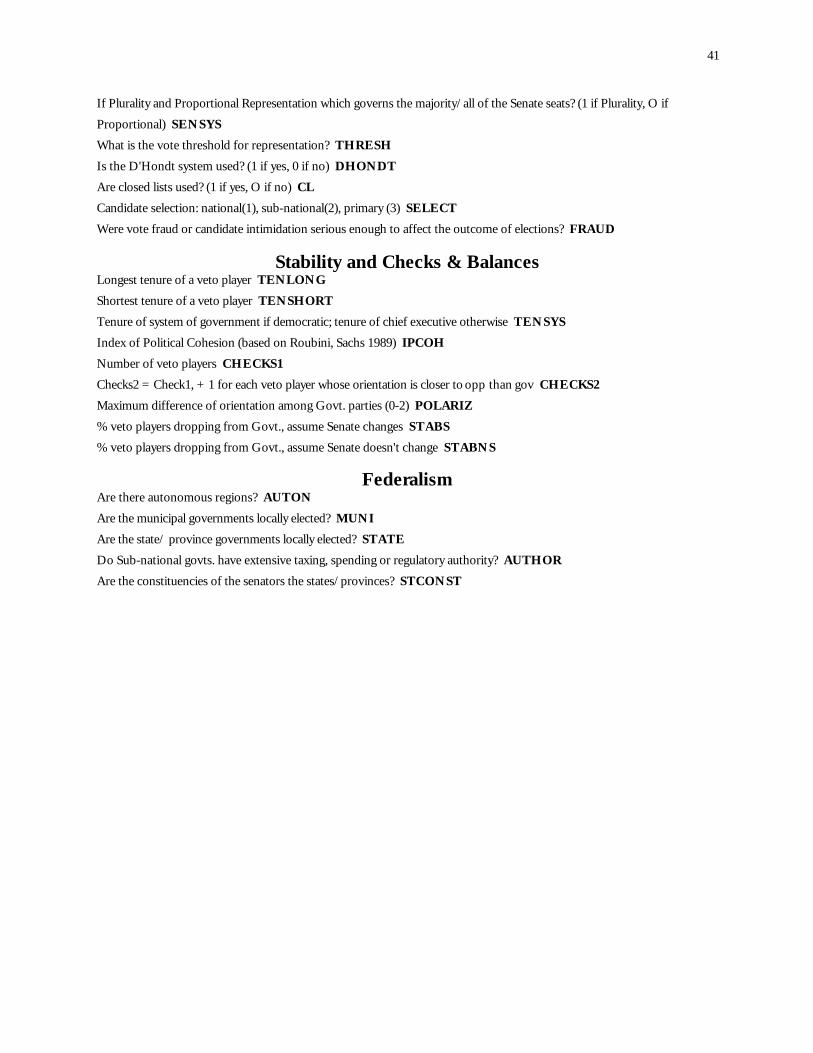
41
If Plurality and Proportional Representation which governs the majority/all of the Senate seats? (1 if Plurality, O if
Proportional) SENSYS
What is the vote threshold for representation? THRESH
Is the D'Hondt system used? (1 if yes, 0 if no) DHONDT
Are closed lists used? (1 if yes, O if no) CL
Candidate selection: national(1), sub-national(2), primary (3) SELECT
Were vote fraud or candidate intimidation serious enough to affect the outcome of elections? FRAUD
Stability and Checks & BalancesLongest tenure of a veto player TENLONG
Shortest tenure of a veto player TENSHORT
Tenure of system of government if democratic; tenure of chief executive otherwise TENSYS
Index of Political Cohesion (based on Roubini, Sachs 1989) IPCOH
Number of veto players CHECKS1
Checks2 = Check1, + 1 for each veto player whose orientation is closer to opp than gov CHECKS2
Maximum difference of orientation among Govt. parties (0-2) POLARIZ
% veto players dropping from Govt., assume Senate changes STABS
% veto players dropping from Govt., assume Senate doesn't change STABNS
FederalismAre there autonomous regions? AUTON
Are the municipal governments locally elected? MUNI
Are the state/ province governments locally elected? STATE
Do Sub-national govts. have extensive taxing, spending or regulatory authority? AUTHOR
Are the constituencies of the senators the states/provinces? STCONST

42
References
Agora Telematica website of political parties. Wilfried Dierksen, editor.(www.agora.stm.it/elections/parties.htm.)
Alesina, Alberto, Sule Ozler, Nouriel Roubini, and Philip Swagel (1996). “Political Instability andEconomic Growth.” Journal of Economic Growth 1 (June).
Banks, Arthur S. The Political Handbook of the World, 1986-1996. CSA Publications.Binghampton, 1986-1996.
Clague, Christopher, Philip Keefer, Stephen Knack and Mancur Olson (1996). “Property andContract Rights under Democracy and Dictatorship.” The Journal of Economic Growth 1:2,243-276 (June).
Collier, Paul and Anke Hoeffler (1999). “Justice-seeking and loot-seeking in civil war.” Workingpaper, Development Research Group, The World Bank.
Cox, Gary W. (1997). Making Votes Count: Strategic Coordination in the World’s Electoral Systems. NewYork: Cambridge.
______ and Mathew D. McCubbins (forthcoming). “The Institutional Determinants of EconomicPolicy Outcomes,” in Structure and Policy in Presidential Democracies, Stephan Haggard andMathew D. McCubbins, eds.
Dixit, Avinash and John Londregan (1996). “The Determinants of Success of Special Interests inRedistributive Politics.” The Journal of Politics 58:4, 1132-55.
Durham, J. Benson (1999). “Economic Growth and Political Regimes.” Journal of Economic Growth4, 81 – 111 (March).
The Europa Year Book, Vols. 1 & 2, 1977-1984, 1990-1994. Europa Publications Ltd. London,1977-1984, 1990-1994.
Ferree, Karen E. and Smita Singh (1999). "Institutional Change and Economic Performance inAfrica, 1970-1995." Paper presented at the 1999 meetings of the American PoliticalScience Association, Atlanta, Georgia.
Gurr, Ted Robert, Keith Jaggers and Will H. Moore (1998). Polity III Codebook. Center forComparative Politics, Department of Political Science, University of Colorado, Boulder.Polity III available through the Inter-University Consortium for Political and SocialResearch.
Heinisz, Witold (1997). "The Institutional Environment for Growth." Mimeo, The WhartonSchool.
Hunter, Brian, current editor (issues back to 1864). The Statesman's year-book [ Statistical and historicalannual of the states of the world for the year. ]. New York : St. Martin's Press,

43
International Parliamentary Union, PARLINE database website.(www.ipu.org/parline-e/parlinesearch.asp)
Keefer, Philip (1999). “Political institutions and crisis: The effects of political checks andbalances on the dynamics of financial sector distress.” Paper prepared for the meetings ofthe Western Economics Association, July 1999.
_____ and Stephen Knack (1997). “Why don’t poor countries catch up? A cross-national test ofan institutional explanation.” Economic Inquiry 35:3, 590-602 (July).
_____ and David Stasavage (1999). “Bureaucratic Delegation and Political Institutions: Whenare Independent Central Banks Irrelevant?” Mimeo, The World Bank (November).
Keesing's record of world events (various years). London : Longman, (weekly).
Lane, Jan-Erik, David H. McKay and Kenneth Newton (various issues). Political data handbook :OECD countries. New York : Oxford University Press.
Laver, Michael and Kenneth Shepsle (1996). Making and Breaking Governments. New York:Cambridge University Press.
London Institute of World Affairs (1947 – 84). The year book of world affairs. London : Stevens.
North, Douglass and Barry Weingast (1989). “Constitutions and Commitment: The Evolution ofInstitutions Governing Public Choice in Seventeenth Century England.” Journal of EconomicHistory 49:4, 808-32 (December)
Political Parties of Africa and the Middle East: a Reference Guide. Longman Current Affairs Series.Detroit, 1993.
Political Parties of Eastern Europe, Russia, and the Successor States: a Reference Guide. Longman CurrentAffairs Series. Harlow, UK, 1994.
Pritchett, Lant and Jonah Gelbach (1997). “More for the Poor is Less for the Poor: The Politicsof Targeting.” The World Bank, Policy Research Working Paper, No. 1799.
Rasmusen, Eric and Mark J. Ramseyer (1994). “Cheap bribes and the corruption ban: acoordination game among rational legislators.” Public Choice 78:305-27 (March).
Roubini, Nouriel and Jeffrey Sachs (1989). “Political and Economic Determinants of BudgetDeficits in the Industrial Democracies.” European Economic Review 33, 903-938.
Schady, Norbert (1998). “Seeking Votes: The Political Economy of Expenditures by the PeruvianSocial Fund: (FONCODES), 1991-95.” Policy Research Working Paper 2166, The WorldBank.
Shugart, Mathew Soberg (1995). “The Electoral Cycle and Institutional Sources of DividedPresidential Government.” American Political Science Review 89:2, 327 – 343 (June).

44
_____ and John Carey (1992). Presidents and Assemblies: Constitutional Design and Electoral Dynamics .New York: Cambridge University Press.
Stepan, Alfred and Cindy Skach (1993). “Constitutional Frameworks and DemocraticConsolidation: Parliamentarism versus Presidentialism.” World Politics 46, 1-22 (October).
United States Central Intelligence Agency, Directorate of Intelligence (various issues). Handbook ofthe nations : a brief guide to the economy, government, land, demographics, communications, and nationaldefense establishment of each of 223 nations and other political entities. Detroit : Gale, 1987.
Weingast, Barry (1998). "Political Stability and Civil War: Institutions, Commitment, andAmerican Democracy." In Analytic Narratives, Robert Bates, Avner Greif, Margaret Levi,Jean-Laurent Rosenthal, and Barry R. Weingast, eds. (Princeton: Princeton UniversityPress).