NEW TESTING PROCEDURE OF RESIN...
48
ACARP PROJECT NUMBER C21011 In trim draft report on DEVELOPMENT OF NEW TESTING PROCEDURE FOR THE ASSESSMENT OF RESIN PERFORMANCE FOR IMPROVED ENCAPSULATED ROOF BOLT INSTALLATION IN COAL MINES INVESITGATORS Principal Investigator: Professor Naj Aziz Research team: 1. Naj Aziz, Jan Nemcik, Ting Ren, Colin Devenish, Arash Moslemi, Stephen Foldi, Shuqi Ma and Hooman Ghojavand - School of Civil, Mining and Environmental Engineering, University of Wollongong 2. Peter Craig, Mark Bedford and Tim Caudry - Jennmar Australia Pty Ltd 3. Rob Hawker and David Joyce - Orica Pty Ltd September 2013 Participating organisations:
-
Upload
nguyenhuong -
Category
Documents
-
view
222 -
download
0
Transcript of NEW TESTING PROCEDURE OF RESIN...

ACARP PROJECT
NUMBER C21011
In trim draft report on
DEVELOPMENT OF NEW TESTING PROCEDURE FOR THE
ASSESSMENT OF RESIN PERFORMANCE FOR IMPROVED
ENCAPSULATED ROOF BOLT INSTALLATION IN COAL MINES
INVESITGATORS
Principal Investigator:
Professor Naj Aziz
Research team:
1. Naj Aziz, Jan Nemcik, Ting Ren, Colin Devenish, Arash Moslemi, Stephen Foldi, Shuqi Ma
and Hooman Ghojavand - School of Civil, Mining and Environmental Engineering, University of
Wollongong
2. Peter Craig, Mark Bedford and Tim Caudry - Jennmar Australia Pty Ltd
3. Rob Hawker and David Joyce - Orica Pty Ltd
September 2013
Participating organisations:
1
Enquiries should be addressed to: Professor Naj Aziz School of Civil, Mining and Environmental Engineering Faculty of Engineering and Information Sciences University of Wollongong (UOW) NSW 2522 Australia Ph: +61 2 42 213 449 Email: [email protected]
Important disclaimer UOW advises that the information contained in this publication comprises general statements based on
scientific research. The reader is advised and needs to be aware that such information may be
incomplete or unable to be used in any specific situation. No reliance or actions must therefore be made
on that information without seeking prior expert professional, scientific and technical advice. To the extent
permitted by law, UOW (including its employees and consultants) excludes all liability to any person for
any consequences, including but not limited to all losses, damages, costs, expenses and any other
compensation, arising directly or indirectly from using this publication (in part or in whole) and any
information or material contained in it.

2
Table of Contents
ABSTRACT .............................................................................................................................................. 3
1. INTRODUCTION ................................................................................................................................ 4
2. PAST STUDIES .................................................................................................................................. 5
3. STUDY PROGRAMME ........................................................................................................................ 5
3.1. FIELD STUDY ........................................................................................................................... 6
3.1.1. Baal Bone Colliery ................................................................................................................... 6
3.1.2. Tahmoor Colliery ................................................................................................................... 11
3.1.3. Gujarat NRE No.1 Colliery ...................................................................................................... 16
3.2. SUMMARY OF FIELD STUDY ................................................................................................. 20
4. LABORATORY STUDIES ................................................................................................................... 20
Push testing of the sectionalised fully-encapsulated threaded tubes .............................................. 20
Bolt pull testing in an overhead sandstone/concrete block ............................................................. 22
Resin Strength Properties ................................................................................................................ 25
4.3.1 Uni-axial Compressive Strength ................................................................................................ 27
4.3.2 Elastic Modulus of Elasticity ..................................................................................................... 28
4.3.3 Punch shear test ..................................................................................................................... 28
4.3.4 Rheological Properties (Creep) ................................................................................................. 29
Experimental Study .......................................................................................................................... 29
4.4.1. Sample Preparation ............................................................................................................... 29
4.4.2. Uni-axial Compression Strength and E-values test results ......................................................... 30
4.4.3. Punch Shear Test Results: ..................................................................................................... 31
4.4.4. Creep tests ........................................................................................................................... 31
5. CONCLUSIONS AND RECOMMENDATIONS ...................................................................................... 33
ACKNOWLEDGEMENTS ........................................................................................................................ 34
REFERENCES ....................................................................................................................................... 34
APPENDICES ........................................................................................................................................ 42

3
ABSTRACT
In underground coal mining, the resin bond between the rock bolt and the strata is one of the critical
elements of a roof bolting system and strata reinforcement, yet the Australian coal industry does not have
an agreed standard test procedure. A program of field and laboratory study was undertaken to examine
various factors influencing effective load transfer mechanism between the bolt/resin and rock. As per
ACARP project requirement, the entire study used 21.7 mm diameter X-grade Jennmar JBX bolt
(APPENDIX B1 and the common Minova / Orica fast setting resin. A series of pull tests were carried out
in three mines with different geological conditions. These mines were Baal Bone, Tahmoor and Gujarat
NRE No.1 mines. Additional studies included evaluations of the anchorage performance along sections of
the bolt installed in steel tubes and variations in strength properties of the resin used with respect to
tested sample dimensions. Furthermore, laboratory pull tests were carried out on bolts installed in an
overhead sandstone block mounted on a drill rig under environmentally controlled conditions. Factors of
importance considered for affect bolt installation in strata include; borehole diameter, resin annulus
thickness, installation time (including bolt spin to the back and spin at back), the effect of gloving and its
impact on installation quality of the bolt and load transfer variation along the length of the installed bolt. A
number of 24 bolts were installed at each of Baal Bone and Tahmoor, and 16 bolts installed at Gujarat
NRE No.1 mines. Installation of bolts in tubes was carried out at Springvale Colliery. It was found that:
bolts installed in 50 mm over-drilled holes resulted in relatively higher load transfer capacity for the
given installation time,
bolts installed in small 27 mm diameter holes performed relatively better than those installed in
larger than 28 mm holes,
in some cases over spinning was detrimental to the load transfer capacity of the bolt installation,
the influence of shredding was reduced with over-drilling,
the strength properties of resin tested at different length to diameter ratios did not vary considerably.
In general, the length to diameter ratio of one was found to be a convenient dimension, and
the consistency of the strength values obtained from testing resin samples was dependent on the
methodology of resin mixing and casting.
Various laboratory testing procedures were evaluated as suggested by British and South African
standards. The results from this evaluation revealed that these standards have short comings in either
sample preparation or testing or presentation of the results. Therefore, a new sampling and testing
procedure has been developed as part of this study. Laboratory and underground tests indicated that this
proposed testing method is reliable, repeatable, easy to conduct and produces meaningful results if
compared to underground tests. This testing procedure is considered to be acceptable for testing resins
used in Australia.
It is therefore recommended that:
further tests to be undertaken to verify the significance of the hole over-drilling and increased
installation spin time, particularly with regard to spin to stall at back,
completion of the resin strength properties testing programme in order to bring this project to a
successful conclusion, leading to establishment of an Australian standard for strata reinforcement in
underground coal mines.

4
1. INTRODUCTION Over the past couple of decades, there has been significant interest in the performance of bolting system
for strata stabilisation around openings in Australian underground coal mines. The resin bond between
the rock bolt and the strata is one of the critical elements of a roof bolting system. The in situ installation
effectiveness of roof bolting would be varied with varying ground conditions, yet the Australian coal
industry does not have an agreed standard for bolting system competency evaluation and continues to
rely on other country’s’ standards, notably British, South African, and American to evaluate its bolting
systems.
With increases in longwall geometry and need for continuity through difficult geology, ground support
must withstand higher loads than ever before. Little work has been carried out on the assessment of
the effectiveness of the encapsulation medium (resin) for effective bolt installation. The limited number of
underground pull tests undertaken, which are available through various publications are insufficient and
are hard to control and standardise. Therefore, the confidence of drawing definite conclusions about the
performance of bolting system that may contribute to improved strata reinforcement is becoming hard to
build up. A study focusing on providing a meaningful and consistent way of assessing resin/bolt
interaction with high degree of confidence will offer significant benefits to both resin manufacturers and
mine operators.
The initial objectives of the project were aimed at developing a standard test methodology for testing or
assessing of different resins, based on the correlation of laboratory derived results with the actual
performance of a roof bolt in the field (underground pull-out tests), and development of a correlation index
between the test results, which can be used by industry to select an appropriate resin for specific site
conditions. Soon the project commenced, it was realised that the task of achieving the above objectives
was enormous in the given timeframe. Also, there was a concern that a product to product comparative
study may not be in the best interest of the resin manufacturers, which was not conducive to cooperative
research in a healthy competitive marketing environment. Accordingly, new objectives were established
during the first monitors meeting on February 15th 2012. These were;
1. Developing standard underground test procedures for the Short Encapsulation Pull Testing (SEPT)
for Australian standard roof bolts in 27-28 mm drill holes.
2. Determining the optimum drilling installation a) rotation speed and b) thrust rates for Standard
Australian roof bolts in a 27-28 mm drill holes.
3. Developing standard laboratory test procedures for determining resin mechanical properties from the
contents of a finished goods capsule. The four important properties include:
a) UCS,
b) Shear Strength,
c) Creep, and
d) Modulus of Elasticity (E value).
The procedures or methods used should enable resin manufacturers to use them for routine Quality
Control (QC) batch testing, and to allow mines to engage independent laboratories to verify results. On
the basis of the above monitors’ directive a programme of research study it was decided to undertake:
a) SEPT conducted at three underground mines of different geological conditions. Selection of the
mines were based on the availability of the appropriate test sites as well as positive management
response,

5
b) Laboratory short encapsulation pull testing of bolts in an overhead sandstone block, paying
particular attention to various parameters pertinent to bolt installation competency, such as drill
motor rpm, drill thrust, over-drill and bolt spin time.
c) Incremental evaluation of the load transfer capacity of the full length of encapsulated bolt by push
testing of the equal length sections of the bolt, and
d) Laboratory methods of testing resin properties from the contents of the finished goods (resin
sausage) capsule, with the aim of defining clearly the changes in the mechanical properties of the
resins, thus permitting the establishment of a standard method that can be used by industry for
effective specification of resins.
e) Preparation of the procedures for SEPT and resin strength testing.
With Australian coal mines being fully dependent on the use of bolting technology for strata reinforcement
in the vicinity of the mine workings and heading development, it is logical that the mine operators and
engineers become fully aware of the importance of the competency of the selected bolting system (i.e.,
bolt and resin) and not just rely on the supplier’s directives and advice. The acquisition of such knowledge
is relatively simple in comparison with other countries, notably USA, which uses a variety of bolting
systems (bolts and resins). The Australian usage of bolting systems is much more homogeneous with
similar diameter bolts and with little diversity in the use of resin application until now. Thus there is a need
for setting up a practical method for testing by the end users of various resin properties with easily
available testing facilities and in light of the recent increases in various resin types application
diversifications in Australian coal mines. Accordingly, this project is aimed to focus on finding easy ways
of evaluating acceptable and simple way of evaluating performance of bolts both in the field and in the
laboratory. These newly devised methods should provide the operators an easy way to examine the
quality of the resins used in bolt installations in different ground formations and conditions.
2. PAST STUDIES
A number of papers pertinent to the aims and objectives of the project objectives are worth reporting.
Notable papers include; Altounyan et al., (2003) on developments in improving the standard of installation
and bond strength of full column resin roof bolts; Wilkinson and Canbulat (2005) on the performance of
bolt installations; Crompton, and Oyler (2005) on investigation of fully grouted roof bolts installed under in
situ conditions; Giraldo, et al., (2005) on improved pull out strength of fully grouted roof bolts through Hole
Geometry Modification; Campbell et al., (2004 and 2007) highlighted the importance of better
understanding the bolt installation methods and the build-up of the anchorage load along the installed bolt
in a variety of ground conditions; Aziz N, et al., (2013, 2006, 2008); Jalalifar and Aziz (2005) Jalalifar,
Aziz and Hadi (2006), on the laboratory study of the influence of bolt profile configuration on bolt load
transfer capacity, under both push and pull testing; Zingano et al., (2008), on in-situ tests and numerical
simulation about the effect of annulus thickness on the resin mixture for fully grouted resin bolt; and most
recently, Aziz, et al., (2013) reporting on the bolt load transfer capability by push testing and Aziz, et al.,
(2013) on the simplified method of casting resin samples for strength property evaluation.
3. STUDY PROGRAMME
The revised project programme was aimed to maximise a possible outcome to the project’s aims and
objectives, notwithstanding of the initial objective, consisting of;
1) Field SEPT in underground coal mines,
2) Load transfer capacity study of the bolt sections encapsulated in a steel tube
3) Laboratory SEPT in an overhead sandstone block, and

6
4) Study the strength properties of the resin used for bolt encapsulation.
3.1. FIELD STUDY
Three mines with different geological conditions were selected to examine the load transfer capacity of
the bolt by short encapsulation tests. The selected mines were Baal Bone, Tahmoor and Gujarat NRE
No1.
3.1.1. Baal Bone Colliery
The first SEPT field investigation was carried out at Baal Bone Mine. The mine is located in the Western
coalfields of NSW, 32 km north of Lithgow and roughly 130 km from Sydney. The mine owned and
operated by Xstrata Coal Pty Ltd, ceased production recently but has been kept open for care and
maintenance and training purposes, therefore was readily available for the study. The mine has a
competent roof as demonstrated from the geological plan shown in Figure 1.
Figure 1-Geology of the Baal Bone immediate roof of heading test site

7
A
A total of 24 short encapsulation bolts were installed at Baal Bone. All bolts were installed in the Triassic
mudstone/shale immediate formation above the Lithgow seam. All holes were drilled in a competent roof
and the borescope survey showed no signs of fractures or discontinuities. Holes for bolt installation were
drilled to a height of 1100 mm, which ensured that all holes stayed in the immediate mudstone formation
below claystone bands. The drilling of the holes and subsequent installation of the bolts were carried out
using a hand-held and compressed air-driven Alminco Gopher drill machine. The 23.7 mm (21.7 mm
core) diameter X-grade bolts were used in the area as shown in Figure 2A. Figure 2b shows a typical pull
testing setup. Each drilled hole was checked for diameter consistency within the top 300 mm of the hole
using a three prong borehole calliper. The resin capsules of appropriate lengths were cut and resealed
into smaller pieces to suit each installed bolt length. Figure 3 shows the schematic drawing of the
encapsulated bolt and a photo of an in-line reamer.
Figure 3-The schematic drawing of SEPT System; A) 300 mm bolt top encapsulation, B) with over-
drilling and (C) an in-line reamer
The first 16 holes were reamed to a standard length of 900 mm of the 1100 long borehole length. Holes
17-20 were not reamed and holes 21-24 were reamed and 50 mm over-drilled above the bolt top end to
allow for the possibility of forcing the shredded plastic film to accumulate along this length (Figure 3B).
Figure 4 shows a photograph of the encapsulation gloving accumulated in the over-drilled section of the
Figure 2A-Roof bolts installed at Baal Bone
Mine
Figure 2B-Pull test setup on site
B C

8
borehole as captured from over-drilled pull testing in the laboratory overhead sandstone block. Generally,
reaming was carried out using a 45 mm diameter inline reamer as shown in Figure 3C.The first four bolts
were installed in 28 mm diameter holes, while the remaining 20 bolts were installed in 27 mm diameter
holes. Minova RA33025F fast setting resin capsules were used to install the bolts in the drill holes. Bolts
17-20, with longer encapsulation length, were pull tested after three hours of their installations and the
rest of the bolts were pull tested after one day of installation.
Figure 4-Accumulation of the shredded sausage skin at the back of the over-drilled hole in the
laboratory overhead sandstone block
Results and Analyses
Table 1 shows the summary of retrieved data of the bolt pull testing with subsequent analysis. The bond
strength (kN/mm) was determined as the peak (maximum) pull load divided by the encapsulation length.
The first eight bolts were installed in accordance with the standard installation time of ten seconds;
however there were some variations in time at the “spin to back” and “spin at back” as indicated in Table
1. Bolts 9-12 were installed at 5 s total time and bolts 13 to 16 took a much longer time period of
installation, varying between 25 s to 42 s, particularly at the “spin at back” for “spin to install” operation.
Bolts 17 to 20, had encapsulation lengths greater than 300 mm, with hole diameter in the order of 28 mm
(Figures 3A). Figure 5 shows the pull test load-displacement profiles of the first 16 bolts and Figure 6
shows load-displacement profiles of the remaining eight bolts.
Bolts 5, 6, 7 and 8 installed in smaller diameter holes of 27 mm achieved better load transfer capacity
than the bolts installed in 28 mm diameter boreholes (1, 2, 3 and 4). Contrary to other findings by
Wilkinson and Canbulat (2005) on extra spin time did not produce good results. However, over-drilled
holes performed better than the rest of the bolt installations. It is envisaged that the top 200 mm bond
strength of most bolts, was significantly reduced, because of the accumulation of the capsule plastic film
remnants in the over-drilled length. Thus the 50 mm over-drilling space allows resin skin shredding to
accumulate in the over-drill space above the bolt end and away from the area between the bolt and the
reamed section of the borehole. Consequently, the results showed an extremely significant improvement.

9
Thus, it is reasonable to conclude that the current short encapsulation pull test method used to study
bond strength appears to demonstrate the effectiveness of over-drilling in Australian mines (Figure 6).
Longer length encapsulations pull test results were nearly comparable to over-drilled bolt installation as
demonstrated in Table 1 and Figures 3 and 4. All spin times were kept constant at 10 seconds.
In summary it can be inferred from the pull testing at Baal Bone that:
1. Bolt installation time of around 10 s constitutes an acceptable time for effective bolt installation as is
normally recommended for use with Minova/Orica fast setting resin of 14 s,
2. The results of the over spinning at back was inconclusive, because the limited bolt encapsulation
length,
3. The use of 300 mm long encapsulation length may be the maximum acceptable length for pull
testing, but this depends on the type of the rock formation, which has some bearing on load transfer
capability of the installation. This finding is in agreement with the study carried out by Willkinson and
Canbulat (2005).
4. In-line reamer drill rod saved time for drilling reamed holes
5. Over-drilling contributed to increased load transfer capacity of the installed bolt and thus became the
accumulation zone for the gloving material.
Table 1-Analysed data from the short encapsulation pull tests-Baal Bone Mine
Bolt: JBX, Core diameter: 21.7 mm, Length: 1200 mm, Installed horizon: 1100 mm; Resin: fast-setting
resin, MN RA33025F.
Un-reamed holes encapsulation length was achieved by wrapping tape around the end of the first 300
mm length of the bolt.
Bond strength is defined as the maximum pull load/encapsulation length.
Bo
lt N
o.
Peak
Load (kN)Bond Strength (kN/mm)
Displacement
at Peak (mm)
Spin to
Back
(sec)
Spin at
Back
(sec)
Total Spin
Time
(sec)
Bond
Length
(mm)
Average
Hole Dia.
(mm)
Borehole Type
1 117.7 0.39 4.7 3 7 10 300 28 reamed
2 98.1 0.33 5.9 3 7 10 300 28 reamed
3 117.7 0.39 10.0 3 7 10 300 28 reamed
4 107.9 0.36 1.3 3 7 10 300 28 reamed
5 137.3 0.46 3.5 5 5 10 300 27 reamed
6 176.6 0.59 1.6 5 5 10 300 27 reamed
7 166.8 0.56 2.2 5 5 10 300 27 reamed
8 147.2 0.49 2.6 5 5 10 300 27 reamed
9 147.2 0.49 1.8 3 2 5 300 27 reamed
10 137.3 0.46 1.8 3 2 5 300 27 reamed
11 157.0 0.52 2.0 3 2 5 300 27 reamed
12 137.3 0.46 4.0 3 2 5 300 27 reamed
13 94.2 0.31 3.3 3 22 25 (NB) 300 27 reamed
14 95.2 0.32 3.2 3 31 34 (NB) 300 27 reamed
15 73.6 0.25 5.5 3 47 50 (NB) 300 27 reamed
16 29.4 0.10 3.5 3 39 42 (NB) 300 27 reamed
17 215.8 0.59 2.4 5 5 10 368 28 NOT reamed
18 215.8 0.56 4.4 5 5 10 385 28 NOT reamed
19 215.8 0.54 2.7 5 5 10 402 28 NOT reamed
20 215.8 0.52 1.7 5 5 10 419 28 NOT reamed
21 215.8 0.72 4.6 5 5 10 300 27 reamed + 50 mm OD
22 206.0 0.69 2.8 5 5 10 300 27 reamed + 50 mm OD
23 157.0 0.52 2.5 5 5 10 300 27 reamed + 50 mm OD
24 215.8 0.72 2.3 5 5 10 300 27 reamed + 50 mm OD

10
Figure 5-Variation in load bearing capacity at Baal Bone Mine, due to methods of rock bolt
anchorage characteristics (hole diameter, bolt overspinning, borehole reaming)

11
Figure 6-Variation in bond load bearing capacity using different methods for rock bolt anchorage
(various encapsulation lengths, borehole reaming and 50 mm over-drilling)-Baal Bone Mine
3.1.2. Tahmoor Colliery
The next round of pull testing was carried out at Tahmoor Colliery in late November 2012. The mine is
situated in the southern highlands region of NSW, approximately 75 km south west of Sydney and in the
vicinity of the Tahmoor Township. The mine is owned and operated by Xstrata Coal. Figure 7 shows the
location of the test site at 5/1 intersection near the pit bottom.
Tahmoor mine produces coal from the Bulli Seam at a depth of 400-450 m. The coal seam roof is
relatively stronger than the Lithgow measures of Baal Bone mine and comprises mudstone, shale and
sandstone (Appendix A1). Therefore, the mine roof at the test site can be described as moderately
competent.
Similar to Baal Bone, a total of 24 bolts were installed in the intersection 5/1 near the pit bottom. The
process of drilling and installation of 24 rock bolts as well as the equipment used was similar to the bolt
installtion operation at Baal Bone mine. Figures 8A and 8B show typical installation and measuring
equipment used in the mine.

12
Figure 7-Tahmoor mine pit bottom plan and test site at intersection 5/1
During the drilling operation, holes 1-4, 8-12 and 16-20 were reamed as standard holes. Holes 5-8, 13-16
and 21-24 were not reamed but were over-drilled up to 50 mm. Drilling and reaming was carried out using
a combined 27 mm drill with an inline reamer of 45 mm diameter as shown in Figure 3C. As in previous
practice at Baal Bone, resin sausages (type: RA33025F) were used for bolt installation. The bolts used at
Tahmoor were the same type as that used at Baal Bone mine. The interval between bolt encapsulation
and pull test times was two hours.
Two encapsulation lengths of 200 mm and 300 mm lengths were trialled at Tahmoor, with and without the
additional 50 mm of over-drilling. The installation time of the bolts was mostly in accordance with the
normal standard time of 10 s, however, there were some variations, mostly at lower installation times as
shown in Table 2.
Results and analysis
Table 2 highlights the summary of test results and analysis. The 200 mm long short encapsulation pull
tests for the first eight bolts showed a variation in bond strength between the standard hole length and the
50 mm over-drilled holes. The over-drilled holes pull test values were, in most cases, higher than the
standard installations. The influence of over-drilling is also evident with bolts installed at short installation
time as is evident in bolts 21 and 24. Similar to the Baal Bone Mine study, the over-drilled holes generally
showed a significant improvement in the load bearing capacity of the bolts.
Within the over-drilled bolts with 200 encapsulation length, bolt 5 had the highest bond strength at around
167 kN, with mixing time of 5 s “ spin to back” plus 5 s “ spin at back” (Figure 6). All holes were 27 mm in
diameter.
As expected, the pull test results for 300 mm long encapsulation length yielded significantly stronger bond
strength, which exceeding the yield strength of the bolt.

13
Table 2-Processed data from the short encapsulation pull tests-Tahmoor Mine
All drilled holes diameter: 27mm.
All holes reamed
The bond strength (kN/mm) is the peak (maximum) pull load divided by the encapsulation length
It is not possible to draw any realistic and comparative conclusion between the standard 300 mm long encapsulation with and without over-drilling (bolts 9 to 16) as pull out test loads were close to bolt yield strength loads. However, the narrow and higher margins in pull loads were evident in over-drill bolt installation, hence it is reasonable to assume that the over-drill installation pull load values performed
Bolt No. Peak Load (kN) Bond Strength (kN/mm)Displacement
at Peak (mm)
Spin to
Back
(sec)
Spin at
Back
(sec)
Total Spin
Time
(sec)
Measured
Encapsulation
(mm)
Hole Reaming
Method
1 98.1 0.49 2.6 2 8 10 200 standard
2 127.53 0.64 4.3 5 5 10 200 standard
3 127.53 0.64 2.3 5 6 11 200 standard
4 127.53 0.64 3.9 5 6 11 200 standard
5 166.77 0.83 2.6 5 5 10 200 50 mm overdrill
6 137.34 0.69 2.4 4.5 5.5 10 200 50 mm overdrill
7 147.15 0.74 3.4 4.5 5.5 10 200 50 mm overdrill
8 107.91 0.54 1.8 5 5 10 200 50 mm overdrill
9 235.44 Long encapsulation 4.6 5.5 5.5 11 300 standard
10 201.105 0.67 6.3 5 5 10 300 standard
11 235.44 Long encapsulation 3.2 5 5 10 300 standard
12 235.44 Long encapsulation 4.4 4.5 5.5 10 300 standard
13 186.39 0.62 3.2 4.5 5.5 10 300 50 mm overdrill
14 225.63 Long encapsulation 4.0 4.5 5.5 10 300 50 mm overdrill
15 225.63 0.75 6.5 5 5 10 300 50 mm overdrill
16 215.82 0.72 3.3 5 5 10 300 50 mm overdrill
17 78.48 0.39 1.3 3 3 6 200 standard
18 63.765 0.32 5.3 3 2 5 200 standard
19 98.1 0.49 2.0 3 2 5 200 standard
20 34.335 0.17 2.2 3 2 5 200 standard
21 107.91 0.54 11.7 4.5 2.5 7 200 50 mm overdrill
22 137.34 0.69 2.4 3.5 1.5 5 200 50 mm overdrill
23 98.1 0.49 1.5 3 2 5 200 50 mm overdrill
24 147.15 0.74 1.9 3 2 5 200 50 mm overdrill
Figure 8B-Pull test in progress ►
▲Figure 8A-Roof bolts installed in a
moderately competent roof-Tahmoor

14
better than the standard bolt installations. The profiles of the load displacement graphs are shown in Figures 9 and 10.
Figure 9-Variation in load bearing capacity of the first eight bolts (1-8) using different methods for
rock bolt anchorage (borehole reaming and 50 mm over-drilling)-Tahmoor Mine
Figure 10-Variation in load bearing capacity of the bolts 9-16 using different methods for roof bolt
anchorage (borehole reaming and 50 mm over-drilling-Tahmoor Colliery
With regard to short installation times, it is clear that shorter installation spin times less than 10 seconds
are inadequate for proper resin mixing to allow effective anchorage and hence a relatively lower peak pull
load strength. Again over-drilling appears to yield relatively superior bond strength.

15
Table 2 shows that the 300 mm short encapsulation pulls test for the second 8 bolts were similar to the
results of the first 8 bolts.
Bolts 13, 14, 15 and 16 had higher bond strength up to 225 kN due to correct mixing and over-drilling.
The test was stopped for bolts 9, 11, 12 and 14 due to stretching of bolts (Figure 11).
As can be seen from Table 2, the 200 mm short encapsulation pull tests have had the same results as
bolts 16-24, with the exception of bolts with total spin time that decreased from 10 seconds to
approximately five (5) seconds.
Out of the over-drilled 200 mm encapsulated bolts, the best result was obtained for bolt 24 with the mix
time breakdown of 3 s for spin to back and 2 s for spin at back. The bond strength reached the peak
strength of 140 kN (Figure 11).
The benefit of the over-drill also translates positively to the bond strength at 20 kN/mm gradient as shown
in Table 2.
Figure 11-Variation in load bearing capacity of rock bolts 17-24 anchorage using different
methods (boreholes reaming and 50 mm over-drilling)-Tahmoor Mine
Thus, it can be inferred from the tests carried out at Tahmoor Colliery that:
bolts installed in over-drilled holes had superior load transfer capacity irrespective of the anchorage
length of either 200 or 250 mm,
as expected, the 300 mm encapsulation length yielded greater load transfer capacity (higher pull
force values) leading to yield strength, and
shorter installation time of less than the standard 10 seconds was counter-productive for effective
load transfer mechanism; and prolonged spin at back and shorter spin time to back is also counter-
productive.

16
3.1.3. Gujarat NRE No.1 Colliery
The third and final round of field tests was carried out in mid-December at NRE No.1 Colliery situated in
the Southern Coalfields of NSW, approximately 60 km south of Sydney, 10 km north of Wollongong and
in the vicinity of Russell Vale Township.
Gujarat NRE No.1 Colliery currently mines both the Bulli Seam and the Wongawilli Seam. The test site
was located in C heading, between CT20 and 21 of the Wongawilli Seam East main headings as shown
in the mine plan (Figure 12). The selected stratification above the working headings is as shown in the
mine plan. The selected stratification above the working part of the Wongawilli Seam was a soft formation
of mainly coal layers and clay bands as shown in Appendix A 2-4.
Figure 12-Gujarat NRE No.1 mine plan showing the study area in the vicinity of the mine pit
bottom
Installation and Monitoring
Similar to the previous field studies, an even and flat roof area was selected at the CT20 intersection for
bolt installation as shown in Figure 13. A total of 16 bolts, 1200 mm long, were installed in 1100 mm long
holes using a handheld and compressed air operated Alminco Gopher drill. All bolts were installed using
Minova fast setting resin type RA33025F. Typical installation of rock bolts and measuring equipment used
are shown below (Figures 13A and 13B).
Table 3 shows the details of pull testing results. The drilling and reaming of holes were accomplished
using an in-line reamer shown in Figure 3C.
All holes were drilled using 27 mm wing bits. Reamed sections were 45 mm in diameter.
Encapsulation length of the first 12 holes were constant at 300mm and the encapsulation lengths of
holes 13 to 16 holes were variable as indicated in Table 3.
Bolts 1 to 4 were installed in 50 mm long over-drilled holes with a reamed 200 mm bottom section.
The installation time was consistent at standard time of ten seconds (5 seconds to back and 5
seconds at back).

17
Bolts in holes 9 to 12 were installed at the total spin time of 5 seconds (2 seconds to back and 3
seconds at back).
Some holes were unreamed; instead the anchorage lengths of 300 mm or the desired anchorage
lengths of holes 13 to 16 were accomplished by wrapping an insulation tape of sufficient thickness
around the bolt in the desired length of anchorage; thus, preventing the resin from spreading down
the length of the bolt.
mm, using twin-wing bit
Holes 1-12 were reamed with an in-
The time between bolt installation and pull test was set to nearly three (3) hours for all bolts. With regard
to the average diameter of holes, the length of resin sausages were calculated and resin capsules were
cut and retightened accordingly. The length of the resin sausage was 250 mm for bolt installation in 300
mm anchorage.
Bo
lt N
o.
Peak Load (kN) Bond Strength (kN/mm)Displacement
at Peak (mm)
Spin
to
Back
(sec)
Spin
at
Back
(sec)
Total
Spin
Time
(sec)
Bond
Length
(mm)
Average
Hole Dia.
(mm)
Borehole Type
1 215.8 0.72 2.8 5 5 10 300 27 reamed + 50 mm OD
2 137.3 0.46 2.1 5 5 10 300 27 reamed + 50 mm OD
3 147.2 0.49 3.4 5 5 10 300 27 reamed + 50 mm OD
4 137.3 0.46 2.9 5 5 10 300 27 reamed + 50 mm OD
5 73.6 0.25 2.7 5 5 10 300 27 reamed
6 127.5 0.43 3.9 5 5 10 300 27 reamed
7 107.9 0.36 1.5 5 5 10 300 27 reamed
8 78.5 0.26 1.0 5 5 10 300 27 reamed
9 117.7 0.39 2.6 2 3 5 300 27 reamed
10 157.0 0.52 7.0 2 3 5 300 27 reamed
11 127.5 0.43 5.0 2 3 5 300 27 reamed
12 103.0 0.34 6.0 2 3 5 300 27 reamed
13 196.2 0.61 3.6 3 7 10 320 28 NOT reamed
14 157.0 0.56 2.7 3 7 10 280 28 NOT reamed
15 98.1 0.34 2.5 3 7 10 290 28 NOT reamed
16 157.0 0.68 1.4 3 7 10 230 28 NOT reamed
Figure 13A-Rock bolts installed in a
laminated roof-NRE No.1
Figure 13B-Pull test measuring equipment
Table 3-Analysed data from the short encapsulation pull test-NRE No.1

18
Table 3 shows the current 300 mm short encapsulation pull test for the first 12 rock bolts. As can be seen
from Figure 14, the unreamed holes with 300 mm encapsulation length had a better load bearing capacity
of up to around 190 kN and in comparison to the performance of reamed holes with different
encapsulation lengths.
Figure 15 shows the load displacement graphs of the first eight bolts. It is clear that the performance of
the first four 50 mm over-drilled bolts is better than the bolts installed with the standard methods without
over-drilling.
Figure 14-Variation in load bearing capacity using different methods for roof bolt anchorage
(borehole reaming, various bond lengths and spin to back and at back timing)-NRE No.1
As can be seen from Figure 16, the drilling method used reamed holes as the standard practice, but with
various spin times resulted in different load bearing capacity of the bonded bolts up to around 160 kN
Generally bolts with the total spin time composition of 2+3 seconds performed better than those with 10
seconds spin time (5+5 seconds).
In the final analysis, it can also be seen that over-drilling improves the performance of bolts and
encapsulation load bearing capacity in comparison to the standard reamed boreholes. In addition, over
mixing at back resulted in lower bond strength for resin encapsulation (Figure 15).
The following were inferred from the pull tests at Gujarat NRE No.1 in the Wongawilli formation
installation:
1. Bolts installed in the 50 mm over-drilled holes (bolts 1-4) had relatively higher than the ones installed
in holes 5 and 8 and without over-drilling
2. The pull load of bolts installed at shorter installation spin time was, in general greater that the
standard 10 seconds time.
3. As expected the bolt installed with anchorage length of 320 mm in length was greater than the 300
mm anchorage length. This additional length of 20 mm encapsulation length appears to give readings

19
near the value of the bolts installed in50 mm over-drilled holes, in other words the load generated
was near the bolt yield point.
Figure 15-Variation in load bearing capacity using different methods for roof bolt anchorage
(borehole 50 mm over-drilling)-NRE No.1
Figure 16-Variation in load bearing capacity applying different methods to bolt anchorage (various
spin to back and at back timings)-NRE No.1

20
3.2. SUMMARY OF FIELD STUDY
Given the limited number of bolts installed at three sites of varying geological formations, it is clear that
over-drilling of the bolts by 50 mm has led to load transfer capacity improvement. This increase in bolt
resin rock bonding can be attributed to the resin sausage skin being shifted upwards and accumulating in
the over-drill space above the bolt end. The removal of the shredding from the main body of the resin
mixture has permitted increases in bonding strength between the bolt, resin and rock. This aspect of the
finding will be further discussed from the bolt in tube installation analysis. The procedure used for SEPT
underground will be contained in the final competed report.
4. LABORATORY STUDIES
As a part of the ACARP project, a series of laboratory pull tests were carried out in a favourable and
convenient environment to supplement the findings from the field studies. The laboratory study was a
three pronged experimental work consisting of:
a) push testing of the sectionalised 100 mm fully-encapsulated bolts in steel tubes brought back from
Springvale Colliery,
b) pull testing of installed bolts in an overhead sandstone/concrete block, and
c) strength properties of resin used for bolt installation.
Push testing of the sectionalised fully-encapsulated threaded tubes
In this test four bolts were installed and encapsulated in steel pipes at Springvale Colliery. The 1.7 m long
tubes, 28.5 mm thread, bolt encapsulated pipes were then retrieved from the mine and brought back to
the University of Wollongong Rock Mechanics Laboratory for load transfer capacity push testing. Bolt
encapsulation times (spin to back and spin at back) were varied as per the requirements for testing in
different conditions. A hydraulic drill with 400-500 rpm motor spin was used to install the bolts in the
hollow tubes inserted in holes drilled into the heading roof. The bolt (X-grade JBX bolts) and
Minova/Orica fast-setting resin type RA33025F, used in the previously test sites, were also used in this
study. During the installation process the resin came to the collar of the tubes on every installation. The
breakdown of mixing time was set as follows:
Bolt 1: spin to back= 10 s, spin at back= 4 s, total= 14 s
Bolt 2: spin to back= 10 s, spin at back= 4 s, total= 14 s
Bolt 3: spin to back= 6 s, spin at back= 2 s, total= 8 s
Bolt 4: spin to back= 12 s, spin at back= 18 s, total= 30 s
After retrieving tubes from the mine, the samples were cut into 100 mm sections and push tested using
an Instron fifty (50) tonnes capacity universal testing machine. The methodology of push testing was
similar to the test procedure reported by Hillyer, et al., (2013).Figure 17 shows a typical sectionalised
encapsulated bolt used in the study.
Figure 17-Sectionalised 100 mm encapsulated bolt tubes

21
Having tested all the sections of tubes, the summary of all test results is shown Figure 18. As can be
seen from Figures 18 A-D, for bolts 1, 2 and 3, there were few sections in which the resin was not mixed
properly and accordingly no bonding was generated. Figure 19 shows typical load-displacement profiles
of sectionalised bolts and post push encapsulation annulus view. Closer observation of push testing
results of the various 100 mm long sections of the sectionalised pieces revealed that:
Poor mixing of the resin resulted complete loss of resin bonding in the vicinity of the collar and up to
a third the way up in the tubes. This loss of bonding was clearly evident in a number of the
sectionalised bolted tube sections in each of Figures 18, A, B and C.
The bonding strength reduced to almost zero, which at times had the encapsulated bolt sections
falling freely out of the outer tube section, with unmixed resin. Only encapsulated tube D had
relatively good encapsulation.
Higher bonding was achieved in various bolt sections at around mid-length of the bolt. A possible
reason for failure in effective encapsulation along the entire length of the bolt in tube was unclear as
the procedure used for installing the bolts in the tubes was similar to past practices.
The team installing these bolts was the same team that installed previous similar studies as reported
by Hillyer, et al., (2013). One possible explanation given may be due to slow drill motor spin at 400
rpm and the relatively larger size of the tube hole diameter of 28 mm. obviously this encapsulated
program of study requires additional field work, which is currently being undertaken with new set of
four encapsulation bolts at Spring Vale Mine. Thus no reaslistic conclusions can be drawn from this
set of results, and further field installtions arecurrently been undertaken and results will reported
accordinglt.
Figure 18-Analysis of sectionalised fully-encapsulated bolts

22
Figure 19-Typical Load-Displacement profiles of the 100 mm long sectionalised encapsulated bolt
sections, and general view of the sections surface
Bolt pull testing in an overhead sandstone/concrete block
This laboratory study was aimed to test bolting system installed in an overhead sandstone block cast in
concrete. The 0.7 m³ sandstone block was cast in Portland cement was allowed to cure for around two
months. During the initial testing stage a total of 49 holes were successfully drilled in the lower half of the
sandstone block. As seen in Figure 19 the bolts ware installed at 100 mm spacing. Drilling was carried
out using a hydraulic drill rig a 27 mm diameter drill bit with 45 mm inline reamer (Figure 19). Figure 20
shows the schematic drawing of the borehole arrangement in the lower half in the overhead
sandstone/concrete block.
Most holes drilled were 400 mm long with some being over-drilled by 50 mm. Minova/Orica Lokset fast-
set resin capsules were used to encapsulate bolts in 200/250 mm holes. The resin capsule, were cut into
200 mm pieces and resealed for the desired encapsulation length. The 50 mm over-drilling was used to
evaluate the influence of over-drill on bolt anchorage performance and to confirm the results of over-
drilling from field studies. The accumulation of the gloving in the 50 mm over-drilled hole is shown in
Figure 4.
It is worth mentioning that a correct bolt encapsulation length was necessary as each extra centimetre of
the encapsulation length above the desired length would influence its bond strength up to one tonne.
Therefore the drill steel rod was marked at the appropriate length to ensure correct depth was drilled. The
1200 mm long JBX bolts were cut to a length of 800 mm to accommodate both the bolting length in the
sandstone block and testing equipment monitoring. Table 4 lists the details of the various initial pull tests.

23
The holes were appropriately designated for specific purpose of pull testing with different bolt installation
times to mimic the tests in underground, including 50 mm over-drilling. The strength of the sandstone was
80 MPa, which was cast in 40 MPa sand/cement mortar. A total of 49 holes were drilled in the lower part
of the sandstone block. Each installed bolt length was 900 mm long with additional extruding length to
accommodate pull pulling ram and monitoring gear as is clearly shown in Figure 19.
Figure 20-Drilling holes in an overhead sandstone/concrete block and pull test assembly
Figure 21-Schematic drawings of boreholes arrangement
(A): bottom plan view, (B): side view
Table 4 shows the details of the first 12 bolts installed and pull tested in sand stone block. Bolt E3 was
not possible to install as the process of installing the bolt with spin to stall was impossible to achieve with
short encapsulation length of 200 mm. This is because the resin was overspinned and lost strength as
the drill speed was also high. This spin and stall study will be the focus for further study once the drill

24
motor speed is modified to permit drilling at variable speeds. The current completed pull out test results of
the rest of installtions are as listed in the table and also shown in Figures 22-24.
No definate conclusions can be drawn from this limited laboartory study at this stage and the testing
programme is continuing.
Table 4-Details of the first 14 bolts
No Bolt /Hole Pull load (KN)
1 E3 Spin/stall unsuccessful
2 D4 over-drilled 50 mm,
encapsulation 250 mm. good installation 10 t
3 C6 over-drilled by 50 mm, 10 s spin
time
Bolt out section is
slightly bent now due to
be pushed aside by the
drill rig
11
4 D2 over-drilled 50 mm 100.20
5 D3 over-drilled 50 mm 83.75
6 D6 250 mm encapsulation and no
over-drill, 10 sec spin 231.24
7 C2 250 mm encapsulation and no
over-drill, 10 sec spin Reamed, 180.22
8 C3 250 mm encapsulation and no
over-drill, 10 sec spin reamed 259.74
9 C4 250 mm encapsulation and no
drill, 10 sec spin Reamed 203.37
10 B3 3 sec to back, 7 sec at back problems with
installation 119.96
11 B5 3 sec to back, 7 sec at back good installation 152.81
12 A5 3 sec to back, 7 sec at back good installation 197.29
13 A4 3 sec to back, 7 sec at back good installation 72.73
14 A3 3 sec to back, 7 sec at back good installation 173.13

25
Figure 22-Variation in load bearing capacity of bolts using same spin time during installation in
the overhead block (3 s to back+7 s at back)
Figure 22 – Variation in bolt pull load with 10 sec (3/7) spin time
Figure 23-Pull loads of various bolts
Resin Strength Properties
There is no Australian standard for the evaluation of the mechanical properties of resins or cementitious
grouts used for bolt or cable encapsulations; therefore there is no uniform method for testing resins for
strength. Depending on the country of origin, resin manufacturers invariably use different specimen
shapes and sizes to determine the strength properties of the resin or grout. Currently three standards are
available and are likely to be used in Australia for strata reinforcement system components used in
mines. They are:
0
50
100
150
200
250
300
Bolt A3 Bolt A4 Bolt A5 Bolt B2 Bolt B3 Bolt B4 Bolt B5 Bolt B6 Bolt D4 Bolt D5
Load
(kN
)

26
Figure24-Pull test peak loads values of different bolts installed in sand stone
100.20
83.78
89.07
97.91
Over-Drill Peak Loads (kN)
Bolt D2 Bolt D3 Bolt D4 Bolt C6
180.22
259.74
203.37 231.24
Reamed Hole Test Peak Loads (kN)
Bolt C2 Bolt C3 Bolt C4 Bolt D6
173.13
72.73
197.29
119.96
152.81
3/7 s Peak Loads) (kN)
Bolt A3 Bolt A4 Bolt A5 Bolt B3 Bolt B5

27
1) The British Standard BS 7861: Strata Reinforcement support system components used in Coal Mines-
Part 1. Specification for rock bolting (1996) and Part 2: Specification for Flexible systems for roof
reinforcement;
2) American Standard for Testing Materials (ASTM) F 432- 10: Standard Specification for Roof and Rock
Bolts and Accessories; and
3) South African Standard SANS1534.
There appears to exist a divided loyalty and preferred practices in testing or determining the strength of
resin with regard to sample shape and size. Irrespective of the resin setting time (fast, medium and slow
set), the Uni-axial Compressive Strength (UCS) property is determined either by using 40 mm cubes, or
cylindrically shaped samples, with varying sizes of 20, 30, 42 and 54 mm diameters. In general, 40 mm
cubes and 20 mm diameter cylindrical size appears to be the most desirable sizes for testing resins. The
40 mm cube is used for both fast and slow-setting resins, however, the 20 mm diameter cylindrical
shapes of length to diameter ratio of 2 was used for fast-set resin testing. This ratio is generally used for
testing composite material such as concrete, although at much higher diameters. Normally the length to
diameter ratio of between 5.0-3.0 is recommended for testing rocks in compliance with the suggested
method for determining the UCS and deformability of rock material of International Society of Rock
Mechanics (1979). While this is true for rock sample preparation by coring, nevertheless, this may not be
a desirable shape for the preparation of samples for composite materials. Examination of the prepared
sample shape and size for the determination of the various strength properties of the resin in bolt
installation is currently under close examination.
The shape of the sample is not a major issue for samples preparation using slow setting resins. Both
cube/prism and cylindrical shapes can be prepared and tested individually by mixing resin and mastic at a
leisurely pace. The situation becomes more difficult, when preparing samples from fast setting resins,
which typically have a setting time of 15-20 s. accordingly, new approach as proposed in this report
should allow several samples to be cast simultaneously from one resin mix batch, thus reducing sample
property variability.
Generally the most common guidelines for determining the properties of the resin required for
competency are based mostly to the determination of the following:
Uni-axial Compressive Strength,
Modulus of Elasticity in compression
Shear Strength,
Creep or Rheological Properties
4.3.1 Uni-axial Compressive Strength
Traditionally resins are tested for compressive strength, using cube prism samples. The British standard
BS 7861- part 1 Annex (M) and part 2 Annex (G) for testing resin grout uses prisms 12.5x12.5x25 mm in
different sizes with respect to the resin set time. Table 4 shows the recommended samples size with
respect to setting time. Opinions vary with respect to the shape and size of the samples tested. According
to BS 1881: part 4: 1970, the strength of a cylinder is equal to four fifths of the strength of a cube,
however experiments have shown that there is no simple relation between the strengths of the specimens
of the two shapes. Generally resin manufacturers tend to determine the UCS vales of the resin by testing
40 mm cubes, similar to the recommended methods for testing composite materials. It is a well-known
fact that the strength values obtained by testing cube samples tend to be on the higher values than the
cylindrical samples. Also, the strength values tend to vary significantly, irrespective of the sample shape
and size as the samples are generally cast individually.

28
The recent approach in sample preparation makes as reported by Aziz, et al., (2013) has demonstrated
that the consistency of the UCS values can be improved if prepared samples are obtained from one mix
of resins, as discussed later. Therefore, it is easier to test resins of different setting speeds in a unified
selected manner.
4.3.2 Elastic Modulus of Elasticity
The modulus of elasticity determination of the resin as prescribed in BS 7861: part 1: 1996, recommends
that a prism of L/D of 4 be subjected to a controlled compressive load. The axial and lateral strain to be
monitored by four strain gauges mounted on the samples, or by using other means of monitoring the axial
and later deformation of the tested sample, such as linear variable differential transformers LVDTs,
compressometers, optical devices or other suitable measuring devices. The tested sample is subjected
to cyclic loading and the elastic modulus is the mean of the three-secant moduli measure between two
levels of the applied load. This method of determining the E value of resin, though a recommended, can
also be determined simply from the straight line extrapolation of the 20-60 kN or 40-80 kN range of the
load-displacement profile range (Figure 25). This will be the subject of intense future study.
Figure 25-Determination of E Value from load–displacement (compression) testing
4.3.3 Punch shear test
Various methods of determining the shearing strength of resin are available and these methods are
shown in Table 5.
The method of current interest in testing for shear strength is by punch shear test. The punch shear box
apparatus is shown in Figure 26. This methodology of shear strength determination is currently
advocated by the South African Standard for testing of resins and grouts (SANS 1534:2004), and is
currently been used by various resin manufacturers in Australia.
Experience has shown that punch shear test is most suited for testing of resin particularly the fast setting
resins. The test is carried out using a thin (3mm) disc-shaped specimen which is slotted in the middle of
the punch shear box (40 mm in diameter and 30 mm high) fitted with a hollow slot of the same diameter
as the 12 .5 mm diameter punch as shown in Figure 26. Full circle discs or a quarter circle segments can
be used with this punch test apparatus. The shearing strength is determined using:
FD
: the shear strength of the tested sample
F: failure load
T: disc thickness
D: Punched disc diameter
0
20
40
60
80
100
120
140
0 0.5 1 1.5 2
Loa
d (
kN)
Compression (mm)
E vale of resin from load /compression data
sample sahpe: 40 mm cube E = Stress /Strain = (40/40 x 40) / (0.35/40) = 1/0.35 = 2.86

29
Based on experiences, the punch shear box test appears to be superior to other tests because of:
1. The ability to prepare a number of samples in very short period of time and produce a number of
samples form one resin mix, thus allowing repetition of the test results for confirmation.
2. It requires a small amount of resin preparation for testing, hence mixing time is not a problem.
3. It gives consistent results for different period of times.
Comparing the resin shear strength between the specifically prepared samples with the results of the
sections cut from both the cylindrical or cube samples. This comparative study has been found to be
good indicators of the quality of the resin cast for various testings
Figure 26-Punch shear apparatus for testing 3 mm thick discs with casting mould in the inset
4.3.4 Rheological Properties (Creep)
The recommended approach to determine Resin Creep properties is similar to that used for determining
the E values. During testing the sample is loaded at a rate of 0.75+0.25 N/Mm2/s to a load of 5 kN and
the load maintained constant for a duration of 15 min, and resin strain is monitored between 0.5 min and
15 min. The resin creep must not be more than 0.12 %, when the sample is tested after 24 hours of
casting.
Experimental Study
4.4.1. Sample Preparation
Preparation of competent samples is an important aspect of testing resin samples. The consistency of the
testing results is dependent on the quality of the cast resin. Resin setting time is the deciding factor in
preparing competent and uniform textured resin.
The methodology of sample casting in current general practice is by preparing resin samples by manually
mixing and casting of samples individually, particularly for fast setting resins. This method is invariably
leads to less uniform sample composition and wider scatter results. Additional drawback of casting
sample by manual mixing and pouring includes:
The difficulty of removing the air bubbles from the sample, unless the sample is mechanically
vibrated,
Non uniform composition of the sample mixtures as each sample has to be mixed and poured
separately.
One side of the cube sample remaining rough, which could eventually influence the test results, and
Mould for casting discs

30
Mixing of the resin in the mould may not be uniform, unless the mixer is skilled:
A new approach currently being trialled is to produce several samples from a single resin/mastic mix. This
is based on mixing a relatively large quantity of resin/mastic resin in one container mechanically using a
paint mixer mounted on to a hand held drill. Two ways are possible to cast resin in a number of readily
prepared moulds by either;
1) By pouring mixed resin into moulds as shown in Figure 27, or
2) Forcing a prepared mould bundle into the resin mix Figure 28.
Once all the moulds are filled or submerged in the resin mix, it was left to harden. The hardened cast
samples were each removed from the mould by gently tapping. Alternatively, the whole resin block is
split or broken, separating the plastic moulds apart. This is then followed by the extraction of the samples
out of their plastic moulds. Figure 28 (A-F) shows a sequence of resin mixing and sample casting by
forcing moulds into the mixed resin. The size or dimension of sample cast can be varied as required. It is
worth noting that by forcing moulds as a bunch into readily mixed resin will require applying some force
as quickly as possible, because of the limited time available before the resin hardens. All plastic moulds
and mixing containers were lubricated with appropriate grease or lubricant spray to allow the cast sample
to be easily freed from the mould.
The quality of the cast samples can be improved with proper vibration to remove trapped air bubbles and
seal any remaining voids. Typical samples prepared from multi sample casting are shown in Figure 27 J.
It should be also be possible to cast cube samples in similar manner as cylinders as shown in Figure
27K. Further modifications to samples casting were subsequently made to prevent unmixed resin, which
is normally accumulated in the periphery mixing container, enter in the sample cast moulds. The details of
the new mixing and casting assembly are shown in Figure 29. Figure 30 shows a closer view of the new
casting mould in a dismantled view. Figure 31 shows photos of poorly cast samples from mixed resin
prepared by pouring process (Figure 31 A). Figure 31 B shows good quality samples cast using the
modified casting mould (Figure 31 B). Green spots in poorly cast samples indicate unmixed resin.
Once the samples were extracted from the moulds, their ends were cut perpendicular to the sample axis
and then subsequently lapped prior to testing, in compliance with the established standard requirements
for sample end smoothness.
4.4.2. Uni-axial Compression Strength and E-values test results
Table 5 shows the results of one batch of seven cylindrically shaped samples tested for UCS values. It is
clear that the quality of the samples and the results of the test have demonstrated the credibility of the
new method of preparing resin samples. The average UCS value of the seven samples tested was 53.16
MPa, with a standard deviation of 0.47 and a coefficient of variation of 0.88%. This kind of sample casting
should also be suitable for cube/prism shapes. Figure 33A shows the UCS values of four days old
specimens and Figure 33B shows failed samples after test.
Figure 34shows the comparative study of the sample UCS values with age. Figure 35 shows the relative
variation of the sample strength with size for both old and freshly made resins. As expected the UCS
strength values are for 20 mm diameter samples are relatively low in comparison with other larger
diameter samples. Note the close values between 40 mm and 54 mm diameter samples strength.
The variation in UCS strength values between the freshly prepared and two month old resin is shown in
Figure 36. The results, though close were found to deteriorate further over longer periods. Further studies
currently undertaken will include:

31
1) a comparative study in strength between 40 mm size cubes and cylinders, to include both freshly
prepared and factory supplied resins as well as scraped resins from the supplied sheathed,
2) sausage resins. Figure 37 shows typical results on the variation in UCS vales between 40 mm cube
and cylindrical samples. The effect of sheathing resin on the resin quality will be examined by
scraping resin mastic and catalyst form the prepared resin sausages collected from a designated
mine.
3) The comparative strength study will include both slow (20 min) and fast (20 and 90 sec) setting
resins.
4) Determination of the E values from Load-Displacement profiles of the failed samples. The E values
will be compared with the E values determined by the established method of cyclic loading
monitoring (hysteresis) methods.
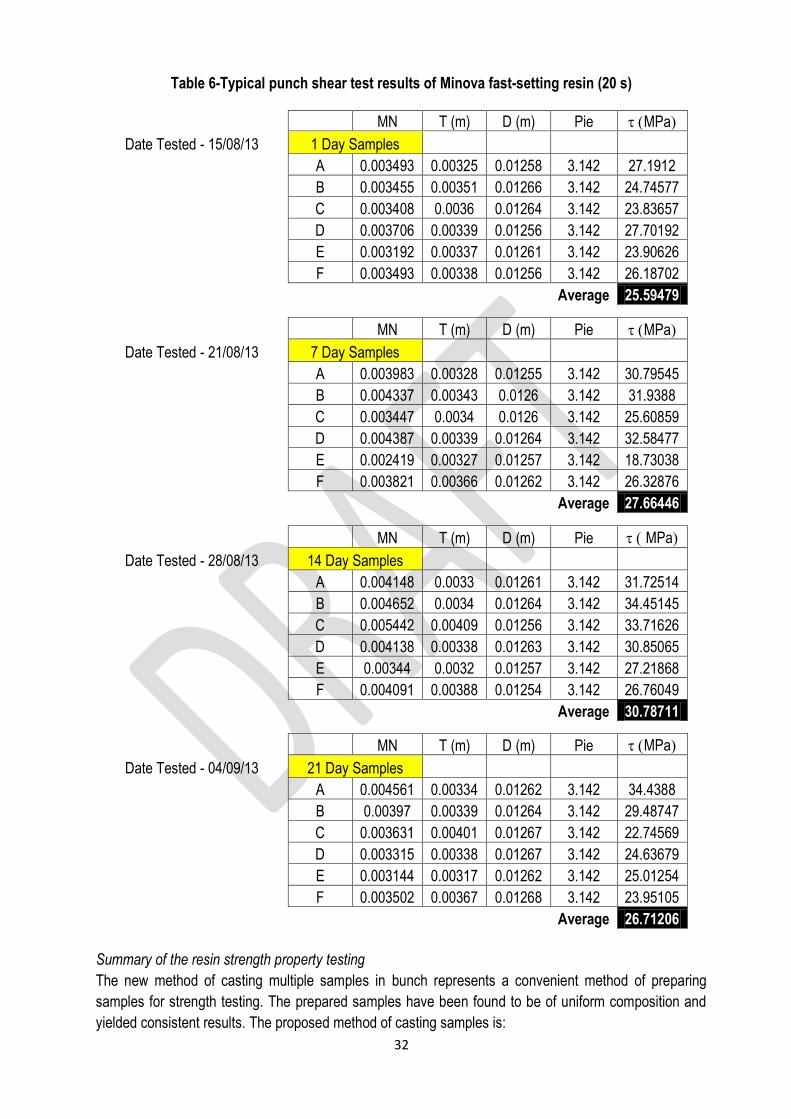
4.4.3. Punch Shear Test Results:
Using the punch shear box a series of punch shear tests were undertaken to study the shear strength of
a particular resin. Table 6 shows typical results of punch test carried out on Minova/Orica fast setting
resin, which is scraped from the resin sausages supplied to a designated mine. The value of shear punch
test was determined by using the following equation;
The next task is to expand this programme of shear testing to include a comparative testing of the resin
with different test methods which will result into a universal acceptance of the chosen technique by the
mining Industry. This programme of study will include various resin types
4.4.4. Creep tests
No creep tests have been carried out at this stage and will be the subject of study later as part of the
resin mechanical strength properties study programme.
Table 5-The UCS test of fast-setting resin cast 30 mm diameter samples
Sample Sample Age (days) Sample Length (mm) Failure Load (kN) UCS (MPa)
1 4 78.52 36.8 53.88
2 4 78.56 36.1 53.08
3 4 78.29 35.6 52.41
4 4 78.48 36.7 53.38
5 4 78.55 36.3 52.99
6 4 78.12 36.2 53.45
7 4 78.29 36.0 52.91
Average: 53.16, SD: 0.43 and CV: 0.88
32
Table 6-Typical punch shear test results of Minova fast-setting resin (20 s)
MN T (m) D (m) Pie MPa
Date Tested - 15/08/13 1 Day Samples
A 0.003493 0.00325 0.01258 3.142 27.1912
B 0.003455 0.00351 0.01266 3.142 24.74577
C 0.003408 0.0036 0.01264 3.142 23.83657
D 0.003706 0.00339 0.01256 3.142 27.70192
E 0.003192 0.00337 0.01261 3.142 23.90626
F 0.003493 0.00338 0.01256 3.142 26.18702
Average 25.59479
MN T (m) D (m) Pie MPa
Date Tested - 21/08/13 7 Day Samples
A 0.003983 0.00328 0.01255 3.142 30.79545
B 0.004337 0.00343 0.0126 3.142 31.9388
C 0.003447 0.0034 0.0126 3.142 25.60859
D 0.004387 0.00339 0.01264 3.142 32.58477
E 0.002419 0.00327 0.01257 3.142 18.73038
F 0.003821 0.00366 0.01262 3.142 26.32876
Average 27.66446
MN T (m) D (m) Pie MPa
Date Tested - 28/08/13 14 Day Samples
A 0.004148 0.0033 0.01261 3.142 31.72514
B 0.004652 0.0034 0.01264 3.142 34.45145
C 0.005442 0.00409 0.01256 3.142 33.71626
D 0.004138 0.00338 0.01263 3.142 30.85065
E 0.00344 0.0032 0.01257 3.142 27.21868
F 0.004091 0.00388 0.01254 3.142 26.76049
Average 30.78711
MN T (m) D (m) Pie MPa
Date Tested - 04/09/13 21 Day Samples
A 0.004561 0.00334 0.01262 3.142 34.4388
B 0.00397 0.00339 0.01264 3.142 29.48747
C 0.003631 0.00401 0.01267 3.142 22.74569
D 0.003315 0.00338 0.01267 3.142 24.63679
E 0.003144 0.00317 0.01262 3.142 25.01254
F 0.003502 0.00367 0.01268 3.142 23.95105
Average 26.71206
Summary of the resin strength property testing
The new method of casting multiple samples in bunch represents a convenient method of preparing
samples for strength testing. The prepared samples have been found to be of uniform composition and
yielded consistent results. The proposed method of casting samples is:

33
fast as no additional time is required for repeated casting;
sample sides are uniform as the moulds are not split axially;
can be applied to cylinder as well as cube sample preparation;
reduces the formation of voids and the composition of the cast sample.
the strength values determined for various resins are consistent and repeatable, thus the proposed
methodology of resin casting and samples preparation represent a suitable approach in testing
different types of resins, thus allowing the establishment of a creditable testing procedures and
establishment of a credible Australian Standard.
5. CONCLUSIONS AND RECOMMENDATIONS
Field study and short encapsulation pull testing
The following conclusions were inferred from the pull testing:
Bolt installation time of around 10 s constitutes and acceptable time for effective bolt installation as is
normally recommended for use with Minova/Orica fast setting resin of 14 s,
The results of the over spinning at back was inconclusive, because the limited bolt encapsulation
length,
The use of 300 mm long encapsulation length may be the maximum acceptable length for pull
testing, but this depends on the type of the rock formation, which has some bearing on load transfer
capability of the installation. This finding is in agreement with the study carried out by Willkinson and
Canbulat (2005).
Over-drilling contributed to increased load transfer capacity of the installed bolt and thus became the
accumulation zone of the gloving material.
Similar to the Baal Bone the Tahmoor test analyses indicated that over-drilling shows a significant
improvement in load transfer.
As with regard to Gujarat NRE No.1 at Wongawilli formation installation it was inferred that;
Bolts installed in the 50 mm over-drilled holes (bolts 1-4) had relatively higher than the ones installed
without over-drilling (5-8).
As expected the bolt installed with anchorage length of 320 mm in length was greater than 300 mm
anchorage length. This additional length of 20 mm encapsulation length appears to near the value of
the bolt installed with 50 mm over-drilled holes, in other words the load generated was near bolt yield
point.
Bolt encapsulation pull testing in steel tube:
No conclusions were drawn from the study of the encapsulated bolt in steel tubes because of poor pull
loads. Further study is currently underway with new set of installations at the Springvale mine.
Laboratory overhead pull testing in sandstone:
No conclusions were drawn at this stage from pull testing in overhead laboratory sandstone. Issues
related to drill machine interfered with the study programme. The performance of the drill machine is
currently been addressed for new programme of pull testing.

34
Resin strength properties testing:
The new method of casting multiple samples in bunch represents a convenient method of preparing
samples for strength testing. The prepared samples have been found to be of uniform composition and
yielded consistent results. The proposed method of casting samples is:
fast as no additional time is required for repeated casting;
sample sides are uniform as the moulds are not split axially;
can be applied to cylinder as well as cube sample preparation;
reduces the formation of voids and the composition of the cast sample.
the strength values determined for various resins are consistent and repeatable, thus the proposed
methodology of resin casting and samples preparation represent a suitable approach in testing
different types of resins, thus allowing the establishment of a creditable testing procedures and
establishment of a credible Australian Standard.
Recommendations
It is recommended that further work be carried out to bring this programme of study into successful
conclusions and leading to the establishment of Australian standard for bolt installations in mines. The
said recommendations should include:
i) Assessment of optimum hole size for optimum load transfer capacity in both hard and soft rock
ii) Examination of the bolt installation spin time
iii) Further tests of bolt/tube encapsulation pull test,
iv) Continuation of the laboratory tests in overheard sandstone blocks to determine various installation
spin time and other pertinent parameters such drill motor rpm and applied thrust.
v) Preparation of procedures for underground SEPT
vi) Completion of resins and grouts properties evaluation, leading to the establishment of common
procedures for testing of resins and grouts by manufacturers, consulting organisations, the
Australian coal mining industry and beyond.
vii) It should be emphasised that the testing method utilised in this report is the recommended testing
method for resin in the laboratory and underground, and has provided reliable and repeatable results
for the establishment of an Australian standard, which is an ultimate objective of this study.
ACKNOWLEDGEMENTS
The research project has been funded by the Australian Coal Association Research Program (ACARP),
project no. C21011. We are also grateful for the cooperation of the personnel of Baal Bone, Tahmoor,
Gujarat NRE No.1 and Springvale. Also many thanks to Jennmar Australia for providing bolts and
assistance in the field trials, and Minova/Orica Australia in providing resins and expertise on resin usage
and preparation of the cast samples.
REFERENCES
The British Standard BS 7861: Strata Reinforcement support system components used in Coal Mines-
Part 1. Specification for rock bolting (1996) and Part 2: Specification for Flexible systems for roof
reinforcement,
American Standard for Testing Materials (ASTM) F 432-10: Standard Specification for Roof and rock
Bolts and Accessories.
South African Standard SANS1534-2004, Resin capsules for use with tendon based support systems,
published by Standards South Africa.
International Society of Rock Mechanics, 1979. Suggested methods for determining the uniaxial

35
compressive strength and deformability of rock materials, Int. J. Rock Mech.Min. Sci. and
Geomechanics Abstract, 16:135-40.
Wilkinson, A and Canbulat, I, (2005). Investigations into support systems in South African Collieries, in
Proceedings, 24rt International Conference on Ground control in Mining, August 2-5, Morgantown,
WV, USA, pp 263-269.
Altounyan, P, Bugden, A, O’Connor, D and Berry, R, (2003). Developments in improving the standard of installation and bond strength of full column resin roof bolts, in Proceedings, 22nd International Conference on Ground Control in Mining, Morgantown, WV, pp 263 -269 http://icgcm.conferenceacademy.com/papers/detail.aspx?subdomain=ICGCM&iid=632
Campbell R. N., and Mould, R. J. (2001). Investigation into the Extent and Mechanisms of Gloving and Unmixed Resin in Fully Encapsulated Roof Bolts, 22nd International Conference on Ground Control in Mining, Morgantown, WV, pp 263 -269 http://icgcm.conferenceacademy.com/papers/detail.aspx?subdomain=ICGCM&iid=6321
Campbell R. N., and Mould, R. J., and MacGregor, S (2004). Investigation into the extent and mechanisms of gloving un-mixed resin in fully encapsulated roof bolts, in Proceedings, 4th Underground Coal Operators Conference, Coal 2003, February 4-6, Wollongong, (eds: N. Aziz and Kininmonth), pp203-214. http://ro.uow.edu.au/coal/145/
Hillyer, J (2012). Influence of installation method and resin properties on rock bolt performance in underground coal mines. Undergraduate thesis, UOW, 110p.
Aziz, N, Hillyer, J, Joyce, D, Shuqi Ma, Nemcik, J and Moslemi, A (2013). New approach to resin sample preparation for strength testing, on Proceedings, 4th Underground Coal Operators Conference, Coal 2013, February 14-15,Wollongong, (eds: N. Aziz and Kininmonth),pp152-155. http://ro.uow.edu.au/coal/449/
Aziz, N, Hillyer, J, Craig, P, Shuqi Ma, , Nemcik, J and Ren, T, (2013). Variation in load transfer along the length of fully encapsulated rock bolts, based on the installation mixing parameters, in proceedings, 4th Underground Coal Operators Conference, Coal 2013, February 14-15,Wollongong, (eds: N. Aziz and Kininmonth), pp137-143. http://ro.uow.edu.au/coal/447/
Jalalifar, J and Aziz, N, 2010. Experimental and 3D Numerical Simulation of Reinforced Shear Joints,
Rock Mechanics and Rock Engineering, Vol 43, Number 1/February, pp 95-103
Aziz, N.I. and Jalalifar, H. (2005). Investigation into the transfer mechanism of loads on grouted bolts,
Journal and news of the Australian Geomechanics Society, Vol 40, No 2, pp 99-112.
Aziz, N, Nemcik, J and Jalalifar, H, 2011. Double shearing of rebar and cable bolts for effective strata
reinforcement, in Proceedings 12h ISRM International Congress of Rock Mechanics, Beijing, China,
18-21, October. Pp 1457-1460. Published in Harmonising Rock Engineering and the Environment –
Qian and Zhou (eds), 2012 Taylor and Francis Group, London, ISBN, 978-0-415-80444-8, pp 1457-
1460.
Aziz, N. Jalalifar, H. Remennikov A, Sinclair S and Green, A, 2008. Optimisation of the Bolt Profile
Configuration of Load Transfer Enhancement, in proceedings 8th Australasian Coal Operators’
Conference, 14th/15th February, Wollongong, NSW, pp 125-131. http://ro.uow.edu.au/coal/11/
Aziz, N. I., Jalalifar H. and Concalves, J. (2006). Bolt surface configurations and load transfer
mechanism, Proc.7th Underground Coal Operators Conference, Coal 2006, Wollongong, 5-7 July,
(Eds, Aziz and Keilich), pp. 236-244.
Jalalifar, H., Aziz, N. I. and Hadi. M. (2006). An Assessment of Load Transfer Mechanism Using the
Instrumented Bolts, , Proc. 7th Underground Coal Operators Conference, Coal 2006, Wollongong, 5-
7 July , (Eds, Aziz and Keilich), pp 255-265.
Jalalifar, H. and Aziz N.I. (2005). Load transfer in bending of bolt, Proc. 20th World Mining Congress and
Exp, 7-10 Nov. Tehran, Iran, pp 285-293,

36
Giraldo, L, Cotten, S, Farrand, J, Pile, J and Bessinger,S (2005), Improved Pull out Strength of Fully-
Grouted Roof Bolts through Hole Geometry Modification, In proceedings, 24rt International Conference
on Ground control in Mining, August 2-5, Morgantown, WV, USA, pp 279-284.
Zingano, A, Koppe,J, Felipe Costa, J and Peng, S,(2008). In-Situ Tests and Numerical Simulation
about the Effect of Annulus Thickness on the Resin Mixture for Fully Grouted Resin Bolt ,in
Proceedings, 27th International Conference on Ground control in Mining, August 2-5, Morgantown,
WV, USA, pp 284-290.
Figure 27-Resin samples preparation in a single mix of resin mastic and catalyst. The process of
resin component mixing and sample casting is clearly shown. Note both Cylindrical and
cast cubes.
A B C
D E F
G
K
H
J
I
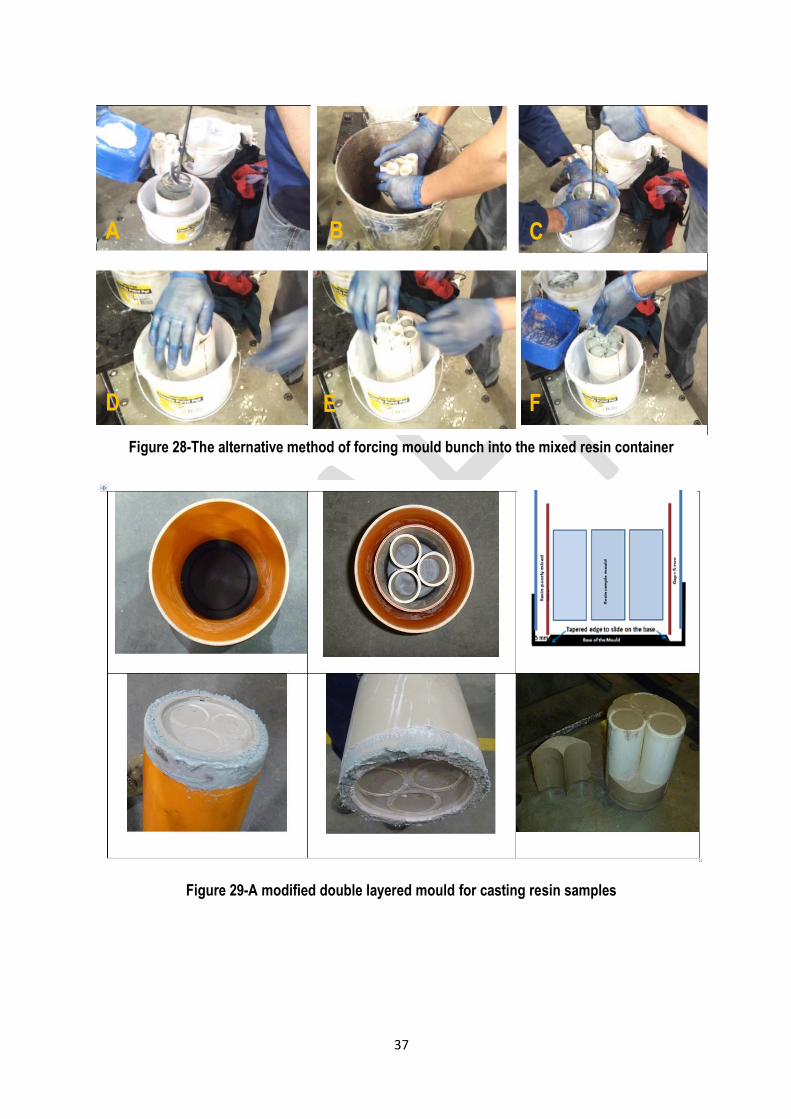
37
Figure 28-The alternative method of forcing mould bunch into the mixed resin container
Figure 29-A modified double layered mould for casting resin samples
A B C
E D F

38
Figure 30-A close view of the cast resin in the dismantled modified mould
Figure 31A-Green spots due to improper mixing of resin mastic and catalyst
Separation of the unmixed and
properly mixed resin
A

39
Figure 31B-Two 40 mm diameter cast resin samples extruded from the latest modified mould.
Note the consistency of the samples and without air bubbles as compared with poorly sample
cast in A.
1 2 3 4 5 6 7
53.88
53.08 52.41
53.38 52.99
53.45 52.91
Figure 32A-UCS of the 4-day old samples
Figure 32B-A view of the angle of
failure for a specimen after UCS test
B

40
Figure 33-Variation of Minova/Orica resin UCS properties with age
Figure 34-Variation of resin UCS changes with sample diameter
Figure 35-Variation in resin UCS properties between 20 mm and 30 mm diameter resin sample size
58.8 59.8 60.5
67.8 73.5
0
10
20
30
40
50
60
70
80
UC
S (M
Pa)
4 Day7 Day14 Day28 Day46 Day
69.9 73.5 75.4 75.0
0
10
20
30
40
50
60
70
80
UC
S (M
Pa)
20mm Diameter
30mm Diameter
40mm Diameter
54mm Diameter
67.4 66.6 69.9
73.5
0
20
40
60
80
20 mm 30mm
UC
S (M
Pa)
2 Month OldResin
Fresh Resin

41
Figure 36-Variations in UCS values between cubes and cylinders of Minova /Orica resin
71.79 73.35 71.20 71.20 71.60 69.64
56.80 55.88 55.91 55.63 55.27 55.43
14 Day old UCS (MPa) Comparison Date of testing: 14/08/2013
Cube 1 Cube 2 Cube 3 Cube 4 Cube 5 Cube 6Cylinder 1 Cylinder 2 Cylinder 3 Cylinder 4 Cylinder 5 Cylinder 6

42
APPENDICES
Figure A1-Stratigraphy of Tahmoor Mine test site

43
Figure A2-Wongawilli test site stratigraphic formation

44
Figure A3-Test site stratigraphic formation in the vicinity of Wongawilli seam

45
Figure A4-Wongawilli seam at NRE No.1 test site

46
Figure B-Specification of JXB Bolt
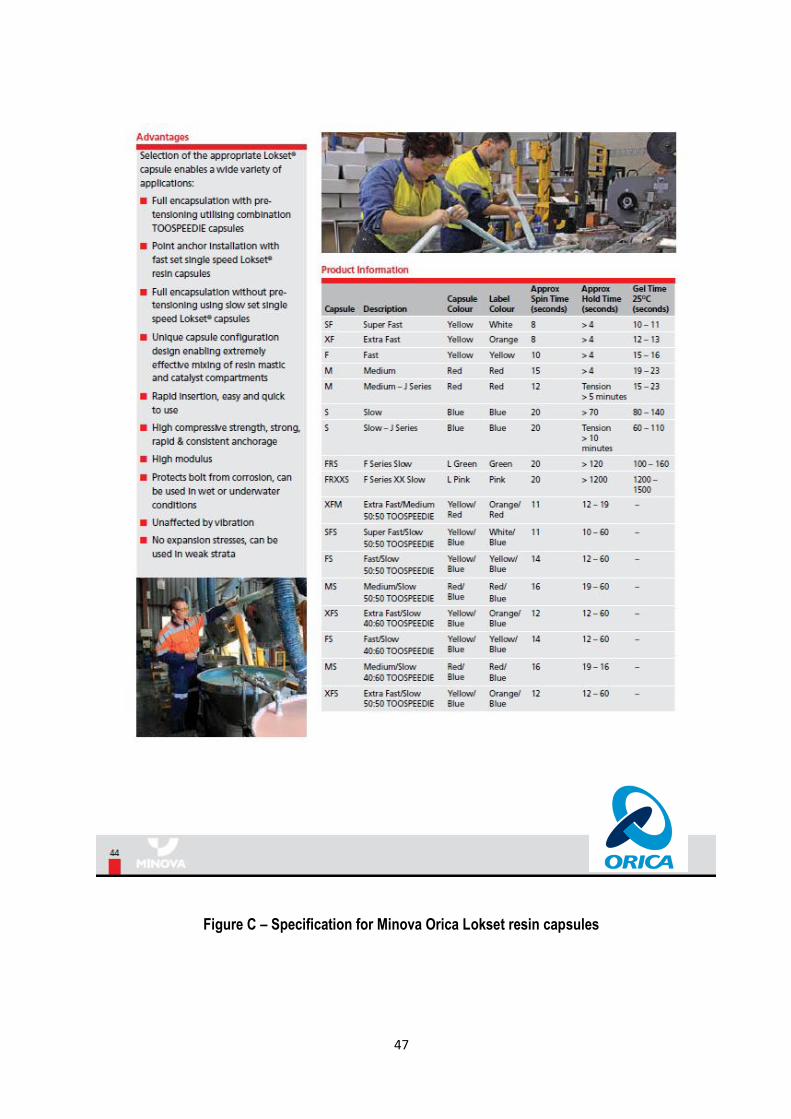
47
Figure C – Specification for Minova Orica Lokset resin capsules