New Model Introductions, Cannibalization and Market ...eprints.whiterose.ac.uk/95237/1/PW1.pdf ·...
32
This is a repository copy of New Model Introductions, Cannibalization and Market Stealing: Evidence from Shopbot Data. White Rose Research Online URL for this paper: http://eprints.whiterose.ac.uk/95237/ Version: Accepted Version Article: Haynes, M., Thompson, S. and Wright, P.W. (2014) New Model Introductions, Cannibalization and Market Stealing: Evidence from Shopbot Data. Manchester School, 82 (4). pp. 385-408. ISSN 1463-6786 https://doi.org/10.1111/manc.12024 This is the peer reviewed version of the following article: Haynes, M., Thompson, S. and Wright, P. W. (2014), New Model Introductions, Cannibalization and Market Stealing: Evidence from Shopbot Data. The Manchester School, 82: 385–408, which has been published in final form at http://dx.doi.org/10.1111/manc.12024. This article may be used for non-commercial purposes in accordance with Wiley Terms and Conditions for Self-Archiving (http://olabout.wiley.com/WileyCDA/Section/id-820227.html). [email protected] https://eprints.whiterose.ac.uk/ Reuse Unless indicated otherwise, fulltext items are protected by copyright with all rights reserved. The copyright exception in section 29 of the Copyright, Designs and Patents Act 1988 allows the making of a single copy solely for the purpose of non-commercial research or private study within the limits of fair dealing. The publisher or other rights-holder may allow further reproduction and re-use of this version - refer to the White Rose Research Online record for this item. Where records identify the publisher as the copyright holder, users can verify any specific terms of use on the publisher’s website. Takedown If you consider content in White Rose Research Online to be in breach of UK law, please notify us by emailing [email protected] including the URL of the record and the reason for the withdrawal request.
Transcript of New Model Introductions, Cannibalization and Market ...eprints.whiterose.ac.uk/95237/1/PW1.pdf ·...

This is a repository copy of New Model Introductions, Cannibalization and Market Stealing:Evidence from Shopbot Data.
White Rose Research Online URL for this paper:http://eprints.whiterose.ac.uk/95237/
Version: Accepted Version
Article:
Haynes, M., Thompson, S. and Wright, P.W. (2014) New Model Introductions, Cannibalization and Market Stealing: Evidence from Shopbot Data. Manchester School, 82(4). pp. 385-408. ISSN 1463-6786
https://doi.org/10.1111/manc.12024
This is the peer reviewed version of the following article: Haynes, M., Thompson, S. and Wright, P. W. (2014), New Model Introductions, Cannibalization and Market Stealing: Evidence from Shopbot Data. The Manchester School, 82: 385–408, which has been published in final form at http://dx.doi.org/10.1111/manc.12024. This article may be used for non-commercial purposes in accordance with Wiley Terms and Conditions for Self-Archiving (http://olabout.wiley.com/WileyCDA/Section/id-820227.html).
[email protected]://eprints.whiterose.ac.uk/
Reuse
Unless indicated otherwise, fulltext items are protected by copyright with all rights reserved. The copyright exception in section 29 of the Copyright, Designs and Patents Act 1988 allows the making of a single copy solely for the purpose of non-commercial research or private study within the limits of fair dealing. The publisher or other rights-holder may allow further reproduction and re-use of this version - refer to the White Rose Research Online record for this item. Where records identify the publisher as the copyright holder, users can verify any specific terms of use on the publisher’s website.
Takedown
If you consider content in White Rose Research Online to be in breach of UK law, please notify us by emailing [email protected] including the URL of the record and the reason for the withdrawal request.

New Model Introductions, Cannibalization andMarket Stealing: Evidence from Shopbot Data
Michelle Haynes†, Steve Thompson‡ and Peter W. Wright§
†Nottingham University Business School, Nottingham, NG8 1BB, UK(e-mail: [email protected])‡Nottingham University Business School, Nottingham, NG8 1BB, UK(e-mail: [email protected])§Department of Economics, University of Sheffield, Sheffield, S1 4DT, UK(e-mail [email protected])
Abstract
Incremental innovation plays an important role in competitive conduct in high-techindustries. This paper explores the impact of new model introduction by employinga nested logit specification to investigate the determination of market shares acrossand within sub-markets for a panel of 336 digital cameras. Our results confirm theexistence of pronounced life cycle effects and the existence of statistically significantmarket stealing and cannibalization effects, particularly associated with the intro-duction of a technologically superior entrant into the model’s market segment. Thepaper reveals significant differences in market outcomes, in both elasticity and re-sponse to entry, across sub-markets.JEL codes: L11, C23.Keywords: Differentiated products; Panel data; Internet; Digital cameras
I. Introduction
In high-tech markets, such as those for personal computers and consumer electronics
goods, competitive conduct involves continuing incremental innovation embodied in
a succession of model changes. New models, some incorporating ‘frontier’ technology,
displace ageing predecessors. However, models are not simply collections of additive
characteristics in a pure Lancastrian world. As Chumpitaz et al. (2010) point out;
only certain combinations are feasible and sensible such that models form clusters in
characteristics space. Thus the competitive impact of improvements in performance
and/or functionality should be felt in the first instance by neighbouring models and
1
only secondarily by more distant versions of the product. For example, a reduction in
keyboard size may be an attractive innovation in hand-held computers, but irrelevant
for desktop machines. Similarly, consumer preference intensity will vary, even over
characteristics which are broadly ‘vertical’, in the sense that they convey measurable
improvements in performance or functionality. This variation is most apparent in
relation to ‘frontier models’, that is versions of the product conveying the highest
technical specifications of those in their cluster, for which some consumers (‘gadget
geeks’) appear willing to pay a premium price, notwithstanding their likely rapid
post-introduction price fall.1
It may appear counter-intuitive that innovation is so routine in industries such as
computers and consumer electronics, where imitation appears both easy and rapid.
Economists since Arrow (1962) have modelled the incentive to innovate as a function
of expected monopoly rents. However, following Bresnahan et al. (1997) the process
of rivalry via product development in high tech markets has been characterised as
one in which innovation creates a new market segment in which competition is tem-
porarily dampened until imitative entry by rivals erodes any advantage. Thus the
successful launch of an innovative model will steal market share from existing and
now inferior models and/or give the seller at least a temporary opportunity to en-
joy higher prices. However, determining the frequency and timing of new model
release involves difficult trade-offs for the manufacturer. There are obvious costs
associated with frequent model changes: these include the costs of model devel-
opment and those associated with manufacturing re-tooling and short production
runs. Bresnahan et al. (1997) concede that the gains from innovation - including
1Gowrisankaran and Rysman (2007) explicitly address the issue of potential consumers whohold out for an improved price-performance combination from high-tech goods undergoing rapidinnovation. In their model consumers compare the utility flow from holding out with no good (orwith an older, inferior model) to that of purchase of a later model. (In essence they model therenewal of the consuming public’s stock of a durable good, in this case camcorders.) This allowsthe authors to estimate the dynamic elasticity and to compute the welfare benefit of new modelintroductions. However, our purpose is rather different: namely to evaluate the market impact ofa stream of innovative and imitative new models. Our nested logit design implicitly addresses thehold out issue, in that consumers are assumed to choose between entering the product market orremaining outside and purchasing the numeraire good.
2

any premium attaching to novelty and the dampening of price competition follow-
ing innovative entry - may be sufficiently short-lived to deny a positive return to the
innovator. Moreover consumer preferences extend to brand-names, which appear to
proxy poorly observable attributes such as reliability and subjective characteristics
including styling, such that at least some of the gains from new model introduction
are likely to be cannibalized from the manufacturer’s existing model range.
Work by Hausman and Leonard (2002) [entry by toilet tissue brand], Van Heerde et al.
(2004) [rising crust pizza] Van Heerde et al. (2010) [SUV/saloon crossover vehicle]
and Davis (2006) [cinema openings] report significant stealing, cannibalization and
pricing effects associated with entry. However, this literature has been concerned
with evaluating the consequences of a discrete - and generally a posteriori success-
ful - innovation. None of these markets exhibits new model-embodied performance
improvements with the frequency that occurs on a routine basis in high-tech goods.
The present paper explores the demand-side effects of new model introductions in
digital cameras, a typical consumer electronics product displaying rapid improve-
ments in performance and functionality. We circumvent the usual data problems by
the use of price and quantity information from a price comparison site or ‘shopbot’.2
Research on the market stealing and cannibalization effects of product innovation is
generally limited by an absence of quantity (and sometimes price) data. Our data
and empirical approach allow us to explore the effect of incremental innovation by
model introduction in the context of competition across a large sample of models
of different vintages. We give explicit recognition to the clustering of models in
characteristics space by a nested logit design in which consumers choosing to buy
the product initially select one of four product formats. However, the nested de-
sign also allows the evaluation of cross format effects which, as Van Heerde et al.
(2010) note, may be a consequence of new improved combinations of performance
2Shopbots are of two kinds: the first is a programme that searches the Web on the buyer’sbehalf and locates the best price for a product being sought. The second, which is used in ourresearch, is a two-sided e-market at which sellers post details of their offerings which are hosted bythe shopbot in exchange for a levy on clicks through to final sale.
3

attributes. The distinctive effects of imitative and innovative entry, by both rival
brands and improved models from the manufacturer’s own brand are then captured
by augmenting the basic nested logit model.
Using data for a 16 month period, we observe prices and quantities relating to 336
digital camera models, covering the four main broad formats of cameras. We then
employ a nested logit model to investigate the determination of market shares across
and within these market segments. The richness of the data set allows us to explore
price, time and innovation influences. Price effects are largely as conjectured for
a high-tech product without apparent network effects. The within-subgroup price
elasticities are higher than the across-subgroup elasticities, supporting our nested
design. Moreover, as the model ages – and thus loses any distinctive characteristics
advantages it initially enjoyed over its rivals – the price elasticity rises in reflection of
the increase in substitutes. Having controlled for (and suitably instrumented) price,
market share follows a quadratic time path reflecting model life cycle considerations.
However, introducing product count variables to capture the release of newer models
confirms the existence of statistically significant market stealing and cannibalization
effects, particularly where a technologically superior entrant joins the model’s market
segment.
The paper is organised as follows: Section II discusses the role of routine innovation
in market rivalry. The sample and data are described in Section III. Section IV
outlines the use of the nested logit in this context, with the results following in
Section V. A brief conclusion follows.
II. Innovation and New Model Introductions
Producers of differentiated products typically seek to establish an advantage over
rivals, or alternatively negate any advantage established by such rivals, by incor-
porating new or improved features over existing models. During periods of rapid
technological advance, as experienced in computers and consumer electronics, suc-
4

cessive models may display considerable improvements in performance and function-
ality over their predecessors. As Bresnahan et al. (1997) point out; such innovation
effectively creates a new product market segment within which the innovator enjoys
some shelter from competitive rivalry: First, because of the existence of some con-
sumers (‘gadget geeks’ (Geroski, 2003)) with a strong preference for novelty who are
prepared to pay a premium for the early acquisition of a frontier model. Second, be-
cause market segmentation via vertical differentiation is itself a means of dampening
price competition.
Since key components in computing and electronic products, especially but not
exclusively those based on semiconductors, have continued to display performance
improvements.3 Model changes continue to deliver vertical differentiation rather
than the mere styling changes – or horizontal differentiation – typical of some more
mature technologies. However, any competitive advantage secured by innovation
is generally eroded as rivals imitate novel features and incorporate them into their
own new models. This is particularly rapid in industries such as electronics and
computers, where product improvements tend to be embodied in components that
are available to many manufacturers. Research on high-tech markets, including
computers (Stavins, 1995) and disk drives (Lerner, 1995), confirms that quality-
adjusted prices do indeed fall as the density of sellers in proximate product space
increases.
While new model launches are aimed at capturing sales from existing rivals, multi-
product firms also risk the cannibalization of sales from their existing stock of mod-
els. Brands function as subjective quality indicators and may embody more intan-
gible attributes such as styling and image. Therefore new model releases involve
intra-brand as well as inter-brand competition. Theory suggests that producers will
therefore space out their model launches according to the proximity of competitors
in the market segment that each serves (e.g. Moorthy and Png, 1992; Desai, 2001).
3Semiconductors have broadly continued to double in capacity every 18 months, in accordancewith the predictions of Moore’s Law.
5
Ohashi (2005) provides a test of this hypothesis for the US video game market and
demonstrates that the gap between release dates for pairs of games for the same plat-
form is significantly greater for directly competing games and those with a common
developer, especially if the latter also owns the platform. Corts (2001) demonstrates
similar behaviour in the US motion picture industry, where joint ownership in pro-
duction and/or distribution assists in timing release dates.
This research explores competition in the digital camera market. Unlike most high-
tech goods that have been the subject of recent research in the area (including PCs,
DVDs, spreadsheets and video games), the digital camera has no obvious direct or
indirect network effects (Shapiro and Varian, 1999). In other respects however, it
appears typical of other high-tech products. Models possess a very short product life
cycle, such that it is not uncommon for some manufacturers to replace them within
nine months. Table 1 summarises the announcements of leading manufacturers’ new
models, excluding minor variants and re-bundling of existing models, as recorded
by a prominent industry web site over the years 2004-2007. The digital camera
also shares with other electronics products the experience of very rapid aggregate
sales growth after the product’s initial launch: for example, sales in the US market
increased from a few thousand units in 1996 to over 30 million by 2003. This was
accompanied by very substantial improvements in performance and functionality
and a substantial sustained fall in the quality-adjusted camera price, consequent
upon a continued fall in the cost of semi-conductor-based sensor which digitalizes
light images.
It might appear counter-intuitive that the market for a new product embodying
proprietary technology, such as the digital camera market, should experience many
entrants in its emergent stage. It is, however, consistent with the contention of
Geroski (2003) that effective barriers to entry are generally low in new markets
before economies of scale considerations dominate. Entrants to the digital camera
market came from traditional photography, photocopying and consumer electronics
6

industries. They were able to utilize common components - especially the key semi-
conductor-based sensor - across standardized interfaces as elsewhere in consumer
electronics.4 Ironically, Kodak, the firm whose lavish R and D expenditures did
most to develop digital camera technology, was unable to prosper in the new market
and has since failed.5
Table 1
New Digital Camera ModelAnnouncements by Leading
Manufacturers 2004-7
2004 2005 2006 2007Kodak 13 15 11 12Nikon 11 16 15 18Sony 12 14 12 18Pentax 12 14 14 11HP 5 8 5 7Casio 11 9 8 8Olympus 13 19 20 20Canon 19 17 17 19Fuji 15 9 13 13Samsung 13 7 7 18Panasonic 8 9 12 14
Source:dpreview.com
In high-tech product markets it might be expected that the short model life, cur-
tailed as imitative rivals erode any distinctive advantage and innovative rivals es-
tablish superiority, leads manufacturers to seek to recoup development costs early in
the life cycle. This is reinforced by the observation (e.g. by Ohashi, 2005) that such
products frequently demonstrate ‘L-shaped’ sales profiles, with very rapid declines
after a limited period. However, where network effects predominate, manufactur-
ers tend to adopt penetration pricing strategies to boost the installed base. Thus,
Clements and Ohashi (2005) find that the absolute price elasticity for games con-
soles falls consistently over a product’s life as manufacturers increase the price-cost
4Sturgeon (2002) has described the global re-organisation of the electronics industry on thebasis of outsourcing manufacturing to contractors who, in turn, source components from majorsubcontractors who maximize economies of scale by consolidating demands and supplying similarcomponents for inclusion in competing brands.
5Many patent disputes notwithstanding, the technology developed by Kodak (with Apple) waswidely adopted by rivals such that the company’s patent portfolio became its principal asset. See:http://www.appleinsider.com/articles/12/01/20/apple_claims_ownership_of_digital_photography_patents_asserted_by_kodak_.html
Accessed on 25/2/2012.
7

margin in response to the increasing number of game applications available. By
contrast, the digital camera, with no apparent network effects, might be expected
to display increasing price elasticity as each model loses any distinctive advantage
and undergoes commoditisation. This implies higher price-cost margins in the early
part of the life cycle.
When investigating the model life cycle using e-retailer data it should be noted that
there is an asymmetry between model entry and exit. New entry is a discrete event
occurring when supplies reach at least one seller; although there may be some lag
before non-authorized dealers, who make up a significant part of e-markets, receive
shipment. By contrast, exit is an extended process since some sellers typically
retain inventory long after production has ceased. Furthermore, freed from the
costs and constraints of shelf space provision some e-sellers may offer apparently
obsolete models for the benefit of enthusiasts.6
It was noted above that aggregate sales of many high-tech product models tend to
follow an ‘L-shaped’ pattern, with a rapid decline setting in after some relatively
short interval. Since our data extend back to a maximum of 16 monthly observations
prior to end-March 2005, we do not necessarily observe each model’s launch and its
initial aftermath. Furthermore, as shopbot markets contain many sellers who are not
manufacturers’ authorised agents and who therefore obtain supplies with some lag,
it might be expected that observed aggregate shopbot sales (i.e. leads) increase more
gradually than those of authorised retailers alone. These observations suggested the
need for a quadratic time trend to capture sluggish behaviour at either end of the
life cycle.
While manufacturers clearly influence retail prices, not least via their own recom-
mended prices, transaction prices reflect micro market structure: e.g. recent price
comparison site research suggests that model price is negatively related to the num-
ber of sellers (Baye et al., 2004; Haynes and Thompson, 2008). Since digital cameras
6This is the so-called ‘long tail’ phenomenon observed in e-tail markets: see Anderson (2006).
8

vary hugely in price and sophistication, we followed the industry’s classification used
over this period by, for example, dpreview.com, and distinguish four product formats:
namely compact, subcompact, SLR and SLR-type, with the expectation that rivalry
would be keener within each group than between them and that measured cross price
elasticities would reflect this. The compact and subcompact are each ‘point-and-
shoot’ cameras for the general user, distinguished by the latter’s diminutive size.
SLR models, offering high quality performance, allow the user to observe the optical
image directly through the shutter; while SLR-type look similar but use a digital
viewfinder and generally exhibit somewhat lower quality components. In each case,
however, the quality of resolution depends critically on sensor size.
Our data allow us to model the effects of increased competition on models in each
segment as more and better rival models are introduced. To achieve this, we aug-
ment the basic estimating equation with a series of count-based variables reflecting
cumulative entry to the segment from all comers, superior rival offerings and supe-
rior own offerings, respectively. This allows the separate evaluation of the market
stealing and market cannibalization effects of new model introductions.
III. Sample and Data
The data used in this paper relate to monthly price listings for digital cameras sold
on the price comparison site NexTag.com, from December 2003 to March 2005,
a period during which manufacturers continued to introduce new models which
demonstrated vertical superiority over their predecessors. NexTag.com is one of
the largest shopbots, or price (and product) comparison engines, on the internet,
with claimed visits running at 11 million a month over the period in question and
coverage extending to a wide range of electronic, household and other goods and
services. Potential consumers select a product type and can then sort by various
characteristics, including specifications, price range, or brand. They next select a
model and then receive a list of participating suppliers’ offers, including item prices
9

and terms. Listing is free to suppliers, who merely pay for ‘leads’ or ‘clicks’ through
to the seller’s web site. The price paid for these varies according to a supplier’s
position on the page, with a higher payment necessary to secure a top-of-the-page
position.7 Some sellers also pay for positional adverts.
The NexTag.com site provides historical data on price and number of sellers, typ-
ically dating back to a model’s introduction, and a histogram of leads dating back 16
months for cameras listed.8 NexTag.com also provides current data on price/suppliers
and limited information on model characteristics, which we supplemented with ma-
terial from other on-line camera listings. An advantage of this site for our research
is that the NexTag.com’s listing of digital camera models over the period appeared
exhaustive of those on general sale in the USA, even including many discontinued
models which were largely untraded. Missing or incomplete price and lead data9
reduced the sample size from approximately 465 to 336.
We follow previous research (e.g. Baye et al., 2004, 2009) on price comparison sites in
using clicks through - or ‘leads’- as a proxy for quantity. Of course, a lead is not a final
sale and some transactions will not be completed. Baye et al. (2009) point out that
using leads as a proxy for quantity in demand estimation hinges on the conversion
rate (i.e. sales/leads) being independent of own price. In support of this assumption
they note that the whole logic of the price comparison site is that the prospective
buyer uses it to search out price (xi) and all other relevant information, including
delivery terms, (X1) prior to clicking on the seller’s site. Provided that (xi,X1) is
sufficiently attractive to merit purchase, the consumer will proceed to the seller’s
site. Therefore the conversion rate should be independent of xi. Support for this
reasoning comes from both theory and empirical evidence. Clearing house models
7NexTag.com warns that the minimum payment may be insufficient to secure any listing if thenumber of sellers is particularly high.
8 This data was extracted from the screen display using xyExtractTM , a proprietary digitizationprogramme.
9In a small minority of cases suppliers had purchased exclusive positions and clicking on themodel took the searcher directly to the supplier’s site with no historical data available. Somemodels also displayed gaps in their histories. Normally these appeared to be very thinly tradedmodels.
10

deployed in PCS research - discussed in Baye et al. (2004), Haynes and Thompson
(2008) - suggest price-sensitive consumers use a PCS to locate and click on the
cheapest seller, supporting the separation of search and purchase. Baye et al. (2009)
provide evidence of a substantial clicks discontinuity between the cheapest and next-
cheapest seller, again indicating that relevant search is completed before generating
the lead such that the conversion rate should be independent of price.
There are two further advantages of clicks data in the present context: First, since
leads payments are the principal revenue source for NexTag.com and a non-trivial
outgoing for sellers, both sides of the platform have an incentive to maintain the
integrity of the data.10 Second, our work computes model-level elasticities with leads
totals that are aggregated across all sellers in the period. This avoids the problem
with seller-level data where differences in the attractiveness or usability of sellers
sites could generate inter-seller variation in the conversion rate.
Monthly data were collected on prices and number of leads. Cameras were then
classified into the four formats using industry sources.11 This allowed us to confirm
that our sample was entirely representative of the population of new camera models
entering the US market over our period.12
Data on camera resolution (measured in megapixels) was collected to proxy camera
quality. We also obtained information on the month and year in which the camera
was introduced to the market. Summary statistics by camera format are provided in
10Since sellers must pay for all leads, including those not resulting in a sale, the PCS formatshould reduce the incentive for sellers to engage in ‘bait-and-switch’ tactics (Ellison and Ellison,2009) in which prospective buyers find attractive offers are unattainable and are encouraged toupgrade.
11Principally, the digital camera archive site dpreview.com which assigns every new model to oneof the formats.
12Table 2 gives the composition of the sample by camera type. We compared thiswith the types of the 150 new models announced on dpreview.com for the calendar year2004. (Almost all the new models announced will have entered the US market, althougha small number of cheaper compact models are specific to Europe or Asia.) The propor-tions of sample (and 2004 announcements) were as follows: compact 53.3% (60.3%), ultra-compact 25.9% (22.0%), SLR 9.8% (9.7%) and SLR-type 11.0% (8.0%). Innovation in dig-ital camera performance has led dpreview.com to introduce a new classification since ourdata were initially collected, but the timeline of new model introductions is accessible at:http://www.dpreview.com/products/timeline?year=2004&brand=&category=cameras
11

Table 2. This shows that SLR cameras are the most expensive, have the longest life-
cycle and have the highest average sales and resolution; compacts have the highest
number of brands, total sales and market share.
Table 2
Summary Statistics by Camera Format
Compact Ultra-Compact SLR SLR-typeNumber of Brands 179 87 37 33Average Number of Sellers 18 16 20 28Average age of camera (months) 14 13 16 13Average Resolution (megapixels) 3.7 3.6 7.8 5.2Average Minimum Price ($) 242 261 1558 398Average Median Price ($) 286 300 2013 504Average Total Sales per year 56,777 21,523 34,421 21,229Average Sales per model 574 493 1,794 1,196Market Share (%) 42 16 26 16
Note: Averages taken over brands and time periods.
Figure 1 shows the evolution of mean market share, by camera format, over the
lifetime of a camera. The figure shows that, for all camera formats, a camera’s
market share initially increases following its launch and then declines over time,
despite the fact that the minimum price of a camera declines sharply over its lifetime.
Figure 1. The evolution of market share by camera format
0.0
02
.004
.006
Mea
n m
arket
shar
e
0 20 40 60Age of Camera (months)
Compact
0.0
02
.004
.006
Mea
n m
arket
shar
e
0 20 40 60Age of Camera (months)
Ultra Compact
0.0
05
.01
.015
Mea
n m
arket
shar
e
0 20 40 60Age of Camera (months)
SLR
0.0
05
.01
.015
Mea
n m
arket
shar
e
0 20 40 60Age of Camera (months)
SLR−type
As posited above, one factor which might explain the evolution of market share is
12
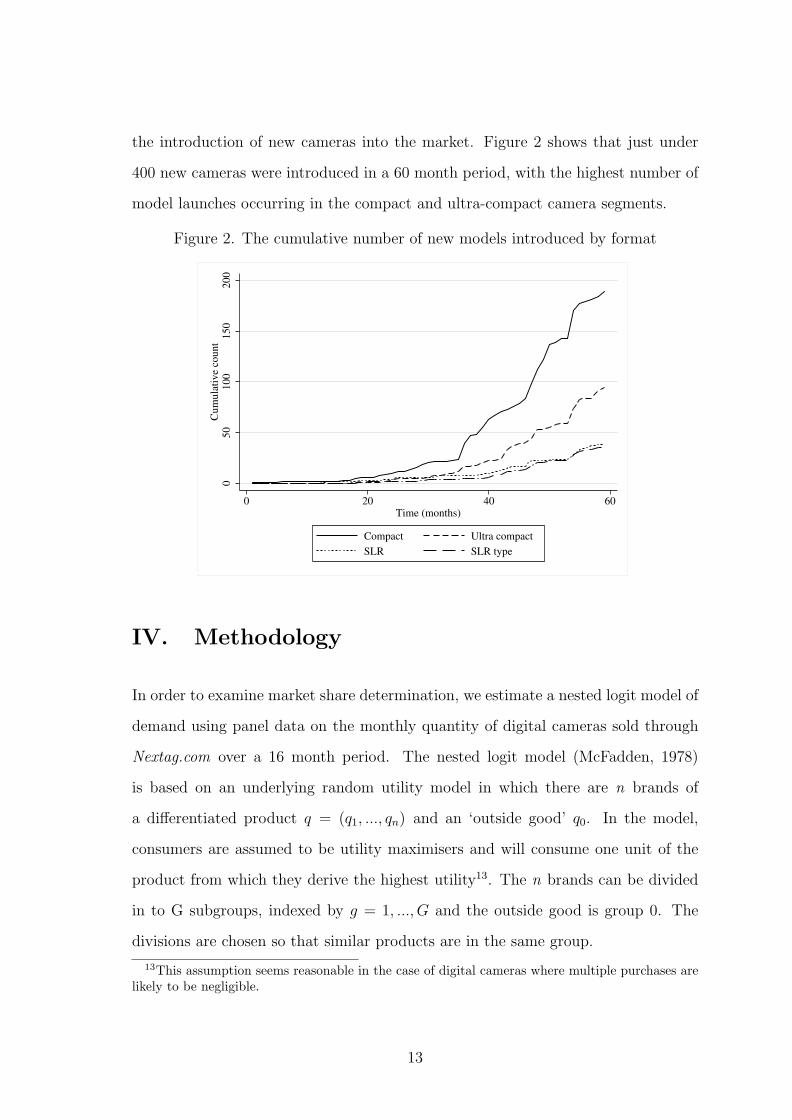
the introduction of new cameras into the market. Figure 2 shows that just under
400 new cameras were introduced in a 60 month period, with the highest number of
model launches occurring in the compact and ultra-compact camera segments.
Figure 2. The cumulative number of new models introduced by format0
50
100
150
200
Cum
ula
tive
count
0 20 40 60Time (months)
Compact Ultra compact
SLR SLR type
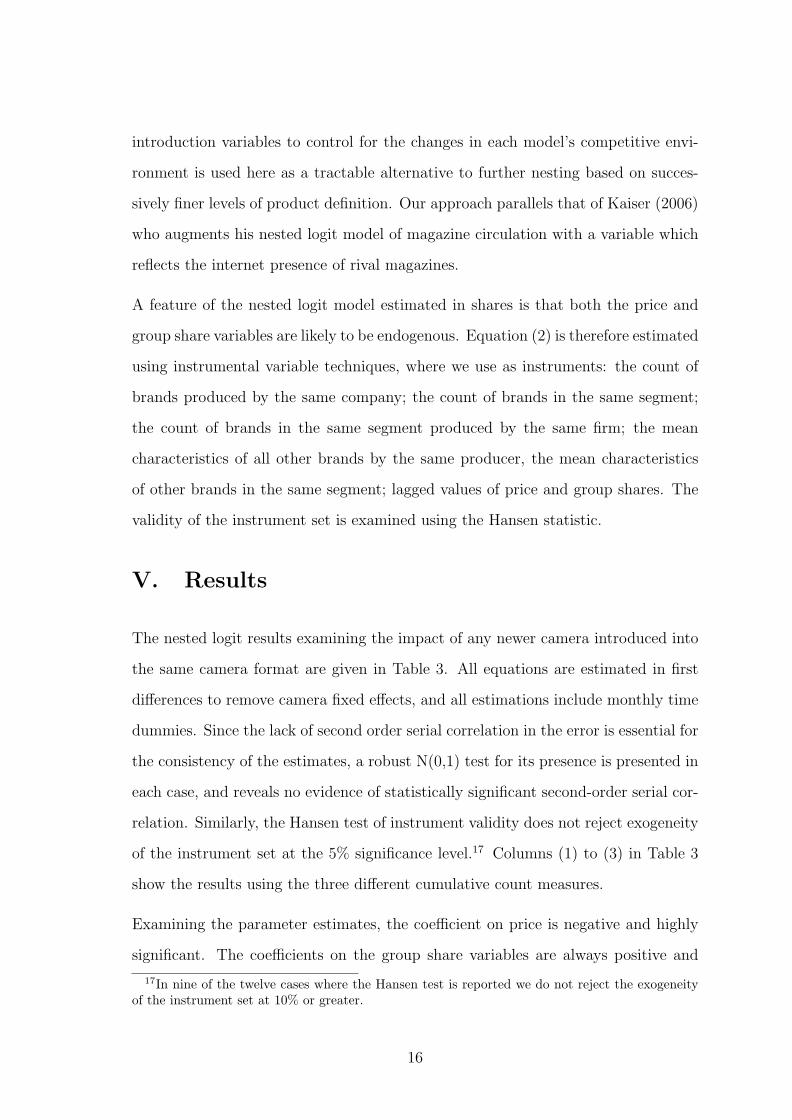
IV. Methodology
In order to examine market share determination, we estimate a nested logit model of
demand using panel data on the monthly quantity of digital cameras sold through
Nextag.com over a 16 month period. The nested logit model (McFadden, 1978)
is based on an underlying random utility model in which there are n brands of
a differentiated product q = (q1, ..., qn) and an ‘outside good’ q0. In the model,
consumers are assumed to be utility maximisers and will consume one unit of the
product from which they derive the highest utility13. The n brands can be divided
in to G subgroups, indexed by g = 1, ..., G and the outside good is group 0. The
divisions are chosen so that similar products are in the same group.
13This assumption seems reasonable in the case of digital cameras where multiple purchases arelikely to be negligible.
13

In the context of modelling digital cameras, the first stage is a choice over the camera
format (compact, ultra-compact, SLR and SLR-type). The second stage is a specific
choice of brand within their chosen subgroup. This implies that, for given market
shares, consumers substitute more towards other cameras in the same than in other
formats. That consumers will typically buy merely a single unit of the good (rather
than, say, a selection as with books or CDs ) is supportive of our choice of the nested
logit model.
Expressed in market shares, the nested logit framework gives us the following esti-
mating equation:
ln(sit)− ln(s0t) = βxit − αipit + σg ln(s̄it|g) + ξit (1)
Where, sit is product i’s share of the market at time t, s0t = 1−∑
sit is the share
of the outside good, xit is a vector of observable characteristics of that product,
pit is the product price, s̄it|g is the product’s share of the format group g to which
it belongs and ξit is an unobserved random component. Expressions for own-price
(ηii) and cross-price (ηij) elasticities within and between groups can be derived from
equation (1):
ηii = αipi
[
si −1
1− σg
+σg
1− σg
s̄i|g
]
(2)
ηij =
{
αjpj
[
sj +σg
1−σgs̄j|g
]
if j ̸= i and j ∈ g
αjpjsj if j ̸= i and j /∈ g(3)
To the basic regression we add time since model i’s initial launch, Tit, included as a
quadratic, to capture life cycle effects.14 By taking time since the launch we allow
for any sluggish behaviour in the post-entry and pre-exit period which, as indicated
above, may be particularly pronounced in shopbot-generated data.
14This time trend possibly conflates a number of effects such as saturation (consumers buy andleave the market for a while, instead of making a sequence of repeat purchases) and learning effectsspreading through the pool of potential consumers.
14

We make the assumption that the numeraire good is the same for all cameras,
but varies by time period. Since the logarithm of the share of the outside good is
subtracted from product i’s share of the market in each time period, we can control
for the share of the outside good by the inclusion of monthly time dummies.15
In order to examine the impact of the introduction of new cameras into the mar-
ket, we ranked all cameras in terms of their resolution. This is then used as an
approximate measure of product quality16. A number of different cumulative count
measures were then constructed: Firstly, the cumulative number of newer cameras
introduced into the same camera format as the model itself. This is a measure of
crowding (and therefore a likely proxy for rivalry) within each format clustering in
characteristics space. Secondly, the cumulative number of newer cameras introduced
into the same format group that have an equal or higher ranking, in terms of reso-
lution, than the model itself. This is a measure of the extent of competition from
superior rivals within each segment. A final measure that we experiment with is
the cumulative number of newer cameras introduced into the same format group
as the model itself, that are better than or equal to the median camera quality.
Each measure is introduced separately into equation (1) and also as an interaction
with price. In addition, each of these measures is split into rival-brand (to examine
market stealing effects) and own-brand cameras (to examine cannibalization effects).
Unlike most products whose demand has been investigated using the nested logit
model, high tech goods such as digital cameras offer consumers a continuously chang-
ing quality ranking. Moreover new entrants vary in their competitive position with
respect to each incumbent such that a uniform market share response to segment
entry would be highly unlikely. Augmenting the nested logit with the cumulative
15This is the identical procedure followed by Slade (2004, p.147), and yields the same coefficientestimates as would be obtained by using fundamental demographics to define the outside good.For instance, previous studies such as Kaiser (2006) use the target population. Note also that suchvariables are also typically only available on an annual basis.
16In hedonic price regressions (e.g. Manninen, 2005) resolution dominated other quality indica-tors. Moreover, over this period it was a principal determinant of picture quality and one on whichmanufacturers actively competed to outdo their rivals.
15
introduction variables to control for the changes in each model’s competitive envi-
ronment is used here as a tractable alternative to further nesting based on succes-
sively finer levels of product definition. Our approach parallels that of Kaiser (2006)
who augments his nested logit model of magazine circulation with a variable which
reflects the internet presence of rival magazines.
A feature of the nested logit model estimated in shares is that both the price and
group share variables are likely to be endogenous. Equation (2) is therefore estimated
using instrumental variable techniques, where we use as instruments: the count of
brands produced by the same company; the count of brands in the same segment;
the count of brands in the same segment produced by the same firm; the mean
characteristics of all other brands by the same producer, the mean characteristics
of other brands in the same segment; lagged values of price and group shares. The
validity of the instrument set is examined using the Hansen statistic.
V. Results
The nested logit results examining the impact of any newer camera introduced into
the same camera format are given in Table 3. All equations are estimated in first
differences to remove camera fixed effects, and all estimations include monthly time
dummies. Since the lack of second order serial correlation in the error is essential for
the consistency of the estimates, a robust N(0,1) test for its presence is presented in
each case, and reveals no evidence of statistically significant second-order serial cor-
relation. Similarly, the Hansen test of instrument validity does not reject exogeneity
of the instrument set at the 5% significance level.17 Columns (1) to (3) in Table 3
show the results using the three different cumulative count measures.
Examining the parameter estimates, the coefficient on price is negative and highly
significant. The coefficients on the group share variables are always positive and
17In nine of the twelve cases where the Hansen test is reported we do not reject the exogeneityof the instrument set at 10% or greater.
16
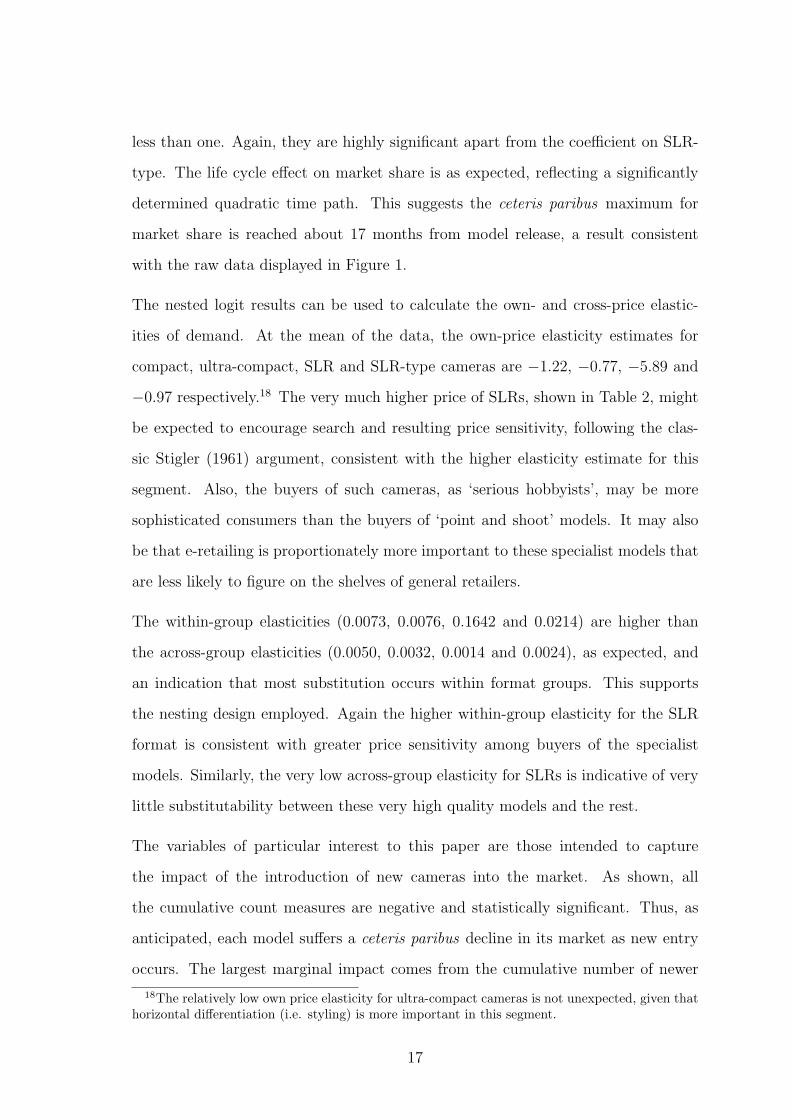
less than one. Again, they are highly significant apart from the coefficient on SLR-
type. The life cycle effect on market share is as expected, reflecting a significantly
determined quadratic time path. This suggests the ceteris paribus maximum for
market share is reached about 17 months from model release, a result consistent
with the raw data displayed in Figure 1.
The nested logit results can be used to calculate the own- and cross-price elastic-
ities of demand. At the mean of the data, the own-price elasticity estimates for
compact, ultra-compact, SLR and SLR-type cameras are −1.22, −0.77, −5.89 and
−0.97 respectively.18 The very much higher price of SLRs, shown in Table 2, might
be expected to encourage search and resulting price sensitivity, following the clas-
sic Stigler (1961) argument, consistent with the higher elasticity estimate for this
segment. Also, the buyers of such cameras, as ‘serious hobbyists’, may be more
sophisticated consumers than the buyers of ‘point and shoot’ models. It may also
be that e-retailing is proportionately more important to these specialist models that
are less likely to figure on the shelves of general retailers.
The within-group elasticities (0.0073, 0.0076, 0.1642 and 0.0214) are higher than
the across-group elasticities (0.0050, 0.0032, 0.0014 and 0.0024), as expected, and
an indication that most substitution occurs within format groups. This supports
the nesting design employed. Again the higher within-group elasticity for the SLR
format is consistent with greater price sensitivity among buyers of the specialist
models. Similarly, the very low across-group elasticity for SLRs is indicative of very
little substitutability between these very high quality models and the rest.
The variables of particular interest to this paper are those intended to capture
the impact of the introduction of new cameras into the market. As shown, all
the cumulative count measures are negative and statistically significant. Thus, as
anticipated, each model suffers a ceteris paribus decline in its market as new entry
occurs. The largest marginal impact comes from the cumulative number of newer
18The relatively low own price elasticity for ultra-compact cameras is not unexpected, given thathorizontal differentiation (i.e. styling) is more important in this segment.
17
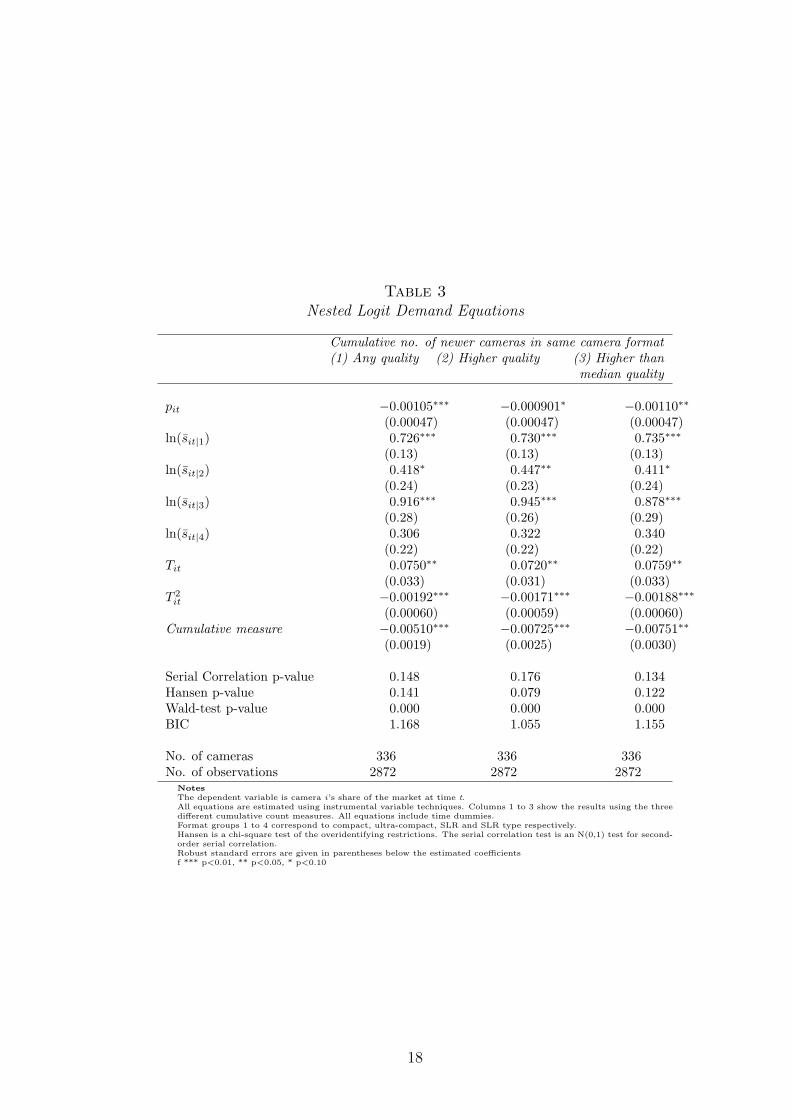
Table 3
Nested Logit Demand Equations
Cumulative no. of newer cameras in same camera format(1) Any quality (2) Higher quality (3) Higher than
median quality
pit −0.00105∗∗∗ −0.000901∗ −0.00110∗∗
(0.00047) (0.00047) (0.00047)ln(s̄it|1) 0.726∗∗∗ 0.730∗∗∗ 0.735∗∗∗
(0.13) (0.13) (0.13)ln(s̄it|2) 0.418∗ 0.447∗∗ 0.411∗
(0.24) (0.23) (0.24)ln(s̄it|3) 0.916∗∗∗ 0.945∗∗∗ 0.878∗∗∗
(0.28) (0.26) (0.29)ln(s̄it|4) 0.306 0.322 0.340
(0.22) (0.22) (0.22)Tit 0.0750∗∗ 0.0720∗∗ 0.0759∗∗
(0.033) (0.031) (0.033)T 2
it−0.00192∗∗∗ −0.00171∗∗∗ −0.00188∗∗∗
(0.00060) (0.00059) (0.00060)Cumulative measure −0.00510∗∗∗ −0.00725∗∗∗ −0.00751∗∗
(0.0019) (0.0025) (0.0030)
Serial Correlation p-value 0.148 0.176 0.134Hansen p-value 0.141 0.079 0.122Wald-test p-value 0.000 0.000 0.000BIC 1.168 1.055 1.155
No. of cameras 336 336 336No. of observations 2872 2872 2872
Notes
The dependent variable is camera i’s share of the market at time t.All equations are estimated using instrumental variable techniques. Columns 1 to 3 show the results using the threedifferent cumulative count measures. All equations include time dummies.Format groups 1 to 4 correspond to compact, ultra-compact, SLR and SLR type respectively.Hansen is a chi-square test of the overidentifying restrictions. The serial correlation test is an N(0,1) test for second-order serial correlation.Robust standard errors are given in parentheses below the estimated coefficientsf *** p<0.01, ** p<0.05, * p<0.10
18

cameras in the same camera format that are better than the camera itself, or better
than the median camera in that format. The best fit, as measured by the Bayesian
Information Criteria (BIC), is where the cumulative number of cameras is better
than the camera itself. These results are consistent with the existence of market
stealing effects associated with the introduction of technologically superior cameras
into a format group.
In order to examine the cannibalization and market stealing effects further, the cu-
mulative count measures are split in to the cumulative number of newer rival brand
cameras introduced into the same format group as the camera itself and the cumula-
tive number of newer own-brand cameras introduced into the same format group as
the camera itself. These results are presented in Table 4. As can be seen, all of the
cumulative measures relating to rival producers are negative and significant. These
results are consistent with the existence of market stealing effects associated with
the introduction of new rival cameras into a format group. The largest marginal
impact is for those newer rival brand cameras introduced into a format group that
are better than or equal to the median camera quality. The coefficients on the cu-
mulative measures relating to own brand introductions are negative and larger than
the market stealing effects (although statistically insignificant for better than the
median measure). These results are consistent with the importance of cannibaliza-
tion effects on a camera’s market share when a new own-brand camera is introduced
into the same format group.
It was noted above that manufacturers in high-tech product markets, including con-
sumer electronics, compete via the introduction of new models with greater perfor-
mance and/or functionality. While some care needs to be exercised in generalising
from the average consequence of new model introduction, not least because the sales
distribution across the set of new models is highly skewed, the innovating manufac-
turer faces a number of crucial trade-offs. Our results confirm that introducing a new
model would be expected to capture market share, particularly where the newcomer
19

Table 4
Market Stealing versus Cannibalization Effects
Cumulative no. of newer cameras in same camera format(1) Any quality (2) Higher quality (3) Higher than
median qualitypit −0.00123∗∗ −0.00110∗∗ −0.00114∗∗
(0.00052) (0.00052) (0.00052)ln(s̄it|1) 0.729∗∗∗ 0.740∗∗∗ 0.709∗∗∗
(0.14) (0.13) (0.14)ln(s̄it|2) 0.386 0.400 0.406
(0.26) (0.25) (0.26)ln(s̄it|3) 0.897∗∗∗ 0.932∗∗∗ 0.950∗∗∗
(0.32) (0.30) (0.30)ln(s̄it|4) 0.302 0.309 0.249
(0.23) (0.22) (0.24)Tit 0.0741∗∗ 0.0714∗∗ 0.0725∗∗
(0.034) (0.032) (0.034)T 2
it−0.00193∗∗∗ −0.00170∗∗∗ −0.00201∗∗∗
(0.00063) (0.00062) (0.00064)
Cumulative measure:-rival brand −0.00437∗∗ −0.00617∗∗ −0.0132∗∗∗
(0.0020) (0.0026) (0.0051)-own brand −0.0153∗ −0.0275∗∗ −0.0117
(0.0090) (0.013) (0.013)
Serial Correlation p-value 0.149 0.161 0.167Hansen p-value 0.228 0.199 0.261Wald test p-value 0.000 0.000 0.000BIC 1.298 1.254 1.278
No. of cameras 336 336 336No. of observations 2872 2872 2872
Notes
a The dependent variable is camera i’s share of the market at time t.b All equations are estimated using instrumental variable techniques. Columns 1 to 3 show the results using thethree different cumulative count measures. All equations include time dummies.c Format groups 1 to 4 correspond to compact, ultra-compact, SLR and SLR type respectively.d Hansen is a chi-square test of the overidentifying restrictions. The serial correlation test is an N(0,1) test forsecond-order serial correlation.e Robust standard errors are given in parentheses below the estimated coefficientsf *** p<0.01, ** p<0.05, * p<0.10
20
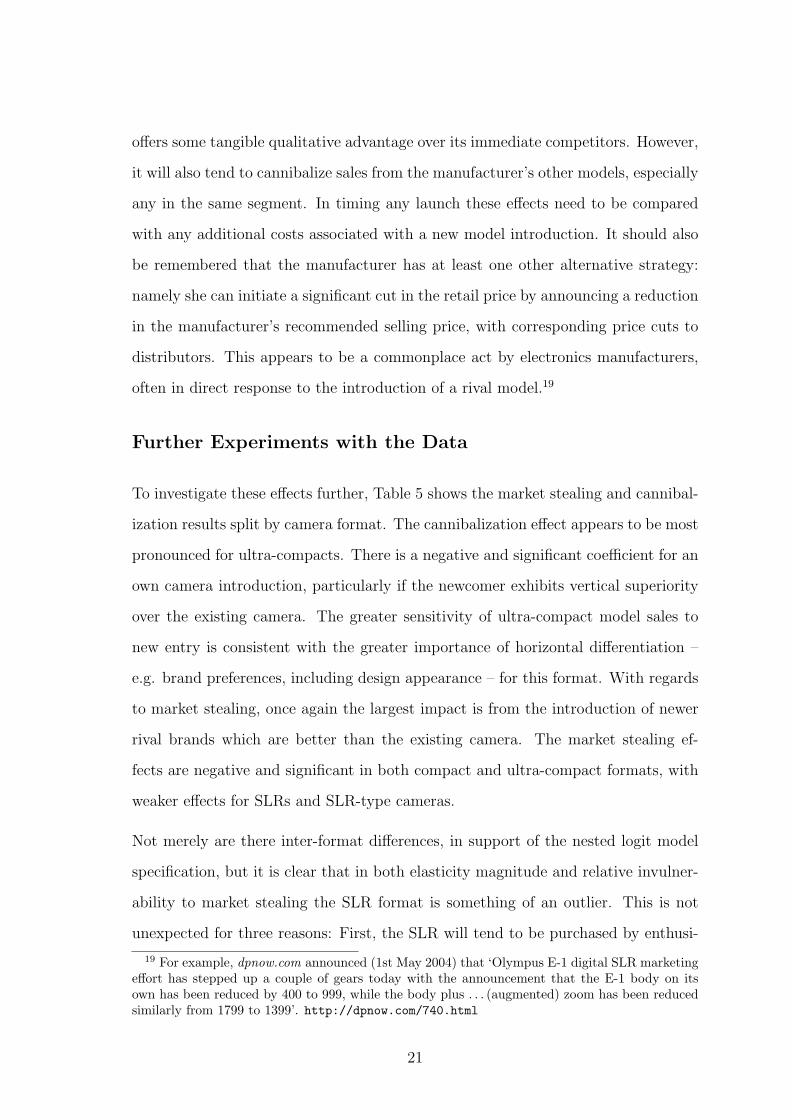
offers some tangible qualitative advantage over its immediate competitors. However,
it will also tend to cannibalize sales from the manufacturer’s other models, especially
any in the same segment. In timing any launch these effects need to be compared
with any additional costs associated with a new model introduction. It should also
be remembered that the manufacturer has at least one other alternative strategy:
namely she can initiate a significant cut in the retail price by announcing a reduction
in the manufacturer’s recommended selling price, with corresponding price cuts to
distributors. This appears to be a commonplace act by electronics manufacturers,
often in direct response to the introduction of a rival model.19
Further Experiments with the Data
To investigate these effects further, Table 5 shows the market stealing and cannibal-
ization results split by camera format. The cannibalization effect appears to be most
pronounced for ultra-compacts. There is a negative and significant coefficient for an
own camera introduction, particularly if the newcomer exhibits vertical superiority
over the existing camera. The greater sensitivity of ultra-compact model sales to
new entry is consistent with the greater importance of horizontal differentiation –
e.g. brand preferences, including design appearance – for this format. With regards
to market stealing, once again the largest impact is from the introduction of newer
rival brands which are better than the existing camera. The market stealing ef-
fects are negative and significant in both compact and ultra-compact formats, with
weaker effects for SLRs and SLR-type cameras.
Not merely are there inter-format differences, in support of the nested logit model
specification, but it is clear that in both elasticity magnitude and relative invulner-
ability to market stealing the SLR format is something of an outlier. This is not
unexpected for three reasons: First, the SLR will tend to be purchased by enthusi-
19 For example, dpnow.com announced (1st May 2004) that ‘Olympus E-1 digital SLR marketingeffort has stepped up a couple of gears today with the announcement that the E-1 body on itsown has been reduced by 400 to 999, while the body plus . . . (augmented) zoom has been reducedsimilarly from 1799 to 1399’. http://dpnow.com/740.html
21

asts who might be expected to make better informed price comparisons than buyers
of cheaper, point-and-shoot models20; Second, our quality measure is probably less
reliable for SLR cameras21; Third, SLR cameras are used with a stock of transfer-
able ancillary equipment, including lenses, which is usually forwardly compatible
within–and sometimes across–brands, but whose existence will influence replace-
ment/upgrade decisions.
Table 6 presents the results for equation (1) when the cumulative measures are in-
teracted with price. For all three cumulative count measures the interaction term
is statistically significant at the 1% level. The negative coefficient indicates that
the impact of new camera introduction is to increase the price elasticity of camera
demand. This supports the argument of Bresnahan et al. (1997) that innovation-
generated market segmentation functions to dampen competition in high-tech in-
dustries, allowing innovators to enjoy rents which are subsequently eroded by entry
elsewhere. Innovative entry again delivers the greatest blow as consumers are at-
tracted to a new frontier model. However, that entry in general should also raise
the elasticity is consistent with Stavins (1995) and Lerner (1995) who find that price
competition intensifies as imitative entry populates market segments. Our results
make an interesting comparison with those of Clements and Ohashi (2005) on video
games consoles. The latter product is associated with strong network effects as its
attraction increases with the availability of games to run on it. Accordingly, a pene-
tration pricing strategy is optimal such that the price-cost margin increases over the
console’s economic life, implying a falling price elasticity. By contrast, here there
are no network effects and the consequences of the inevitable rival entry are unam-
biguously harmful. Therefore it is unsurprising that our results are suggestive of a
20Unsurprisingly, given their lower sales volumes, SLR models have a longer economic life thantheir inferior quality alternatives. Since most enthusiasts’ purchases will be upgrades or replace-ments some might be expected, in the spirit of Gowrisankaran and Rysman (2007), to hold outagainst purchase, except at times of very low prices. This would increase the measured elasticity.If greater search activity, consequent upon higher absolute prices, produces more clicks through tothe sites of potential sellers it will raise measured quantity and so reinforce this effect.
21The resolution of the SLR sensor, a component typically based around a CMOS semi-conductor,is more sensitive to configuration than that of the point-and-shoot model, which is generally basedaround a CCD chip.
22

Table 5
Market Stealing versus Cannibalization Effects: By Camera Format
Cumulative no. of newer cameras in same camera format(1) Any quality (2) Higher quality (3) Higher than
median qualitypit −0.00141 −0.000479 −0.00168
(0.00116) (0.000754) (0.00145)ln(s̄it|1) 0.656∗∗∗ 0.715∗∗∗ 0.583∗∗
(0.229) (0.151) (0.266)ln(s̄it|2) 0.575∗∗∗ 0.761∗∗∗ 0.642∗∗∗
(0.149) (0.199) (0.176)ln(s̄it|3) 0.998∗∗∗ 1.026∗∗∗ 1.070∗∗∗
(0.26) (0.308) (0.278)ln(s̄it|4) 0.368∗ 0.246 0.245
(0.222) (0.241) (0.263)Tit 0.0813 0.109∗∗∗ 0.0685
(0.0522) (0.0361) (0.0619)T 2
it−0.00184∗∗ −0.00131∗ −0.00201∗(0.000923) (0.000737) (0.00109)
Cumulative measure:-rival brand, compact −0.00694∗∗∗ −0.0215∗∗ −0.0131∗∗
(0.00229) (0.00859) (0.00616)-rival brand, ultra-compact −0.0131∗∗∗ −0.0307∗∗ −0.0254∗∗
(0.00463) (0.0146) (0.0104)-rival brand, SLR −0.0139 0.0135 −0.0852
(0.0195) (0.0526) (0.0554)-rival brand, SLR-type −0.0268∗ −0.0366 −0.00806
(0.0138) (0.0804) (0.0323)-own brand, compact −0.0046 −0.0412∗∗ −0.00197
(0.00638) (0.019) (0.0103)-own brand, ultra-compact −0.0317∗∗ −0.0674∗∗∗ −0.02
(0.013) (0.0257) (0.0188)-own brand, SLR −0.0934∗ −0.134 −0.0704
(0.055) (0.138) (0.0967)-own brand, SLR-type 0.0473 0.108 −0.0737
(0.055) (0.111) (0.068)
Serial Correlation p-value 0.116 0.161 0.200Hansen p-value 0.14 0.06 0.07Wald test p-value 0.000 0.000 0.000BIC 1.033 0.583 1.427
No. of cameras 336 336 336No. of observations 2872 2872 2872
Notes
a The dependent variable is camera i’s share of the market at time t.b All equations are estimated using instrumental variable techniques. Columns 1 to 3 show the results using the threedifferent cumulative count measures. All equations include time dummies.c Format groups 1 to 4 correspond to compact, ultra-compact, SLR and SLR type respectively.d Hansen is a chi-square test of the overidentifying restrictions. The serial correlation test is an N(0,1) test for second-orderserial correlation.e Robust standard errors are given in parentheses below the estimated coefficientsf *** p<0.01, ** p<0.05, * p<0.10
23

Table 6
Nested Logit Demand Equations: Interaction of Price with the CumulativeCount Measures
Cumulative no. of newer cameras in same camera format(1) Any quality (2) Higher quality (3) Higher than
median qualitypit −0.000749∗∗∗ −0.000680∗∗∗ −0.000771∗∗∗
(0.00025) (0.00025) (0.00027)ln(s̄it|1) 0.781∗∗∗ 0.837∗∗∗ 0.789∗∗∗
(0.1) (0.084) (0.12)ln(s̄it|2) 0.508∗∗ 0.512∗∗ 0.516∗∗
(0.23) (0.23) (0.23)ln(s̄it|3) 1.206∗∗∗ 1.229∗∗∗ 1.110∗∗∗
(0.31) (0.26) (0.28)ln(s̄it|4) 0.138 0.169 0.157
(0.17) (0.17) (0.17)Tit 0.0335 0.0196 0.0154
(0.052) (0.057) (0.053)T 2
it−0.000843∗ −0.000454 −0.000879∗∗
(0.00044) (0.00052) (0.00040)Tit ∗ pit 0.0000715∗∗∗ 0.0000611∗∗∗ 0.0000683∗∗∗
(0.000018) (0.000013) (0.000019)Cumulative measure*price −0.0000143 −0.0000242∗∗ −0.0000135
(0.0000091) (0.000012) (0.000014)
Serial Correlation 0.412 0.227 0.225Hansen p-value 0.481 0.481 0.515Wald test p-value 0.000 0.000 0.000BIC 1.087 1.172 0.96
Number of cameras 326 326 326No. of Observations 2696 2696 2696
Notes
a The dependent variable is camera i’s share of the market at time t.b All equations are estimated using instrumental variable techniques. Columns 1 to 3 show the results using the threedifferent cumulative count measures. All equations include time dummies.c Format groups 1 to 4 correspond to compact, ultra-compact, SLR and SLR type respectively.d Hansen is a chi-square test of the overidentifying restrictions. The serial correlation test is an N(0,1) test forsecond-order serial correlation.e Robust standard errors are given in parentheses below the estimated coefficientsf *** p<0.01, ** p<0.05, * p<0.10
24

‘cream skimming’ strategy, in which innovative products enter with higher price-cost
margins that are subsequently eroded.
In common with most applications of the nested logit model, the sample of products
included - although very substantial at 336 cases - fall short of the entire population
of the camera market due to the unavailability of data for certain less widely avail-
able camera models. As a check on the robustness of our approach we separately
estimated a series of ad hoc regressions in which the dependent variable is the log
of camera i’s sales at time t. These results are available in Appendix A and are
qualitatively similar to those obtained using the nested logit framework.
VI. Conclusions
This paper has explored a curious property of high tech markets: namely that rou-
tine innovation is a central component of competitive rivalry despite rapid imitation
and short product model lives, features that might appear to reduce the incentive
to innovate by lowering expected monopoly rents. The paper has explored the rela-
tionship between market share and incremental product innovation using a specially
constructed unbalanced panel of 336 digital cameras belonging to four distinct prod-
uct formats. It employs a nested logit design, in which consumers choosing to buy
a camera are assumed to first select a format and then one model from within that
format’s competing model set. Working at the model-level, with price and (proxy)
quantity data available, has allowed a much more detailed evaluation of the conse-
quences of new model introduction than would ordinarily be possible. The results
confirm the importance of product life cycle effects in markets for technologically
evolving consumer electronics products, such as digital cameras. They also confirm
and quantify the existence of market stealing and, in some segments, cannibalization
effects associated with new entry. They further suggest, as would be expected in a
strongly vertically differentiated product, that one of the key drivers of market share
over the life cycle of a product is the introduction of more technologically advanced
25

models. They also confirm the existence of significant and plausible inter-format
differences, in support of our nested design.
The market stealing effects uncovered, taken together with the implied elasticity
estimates, are strongly supportive of the Bresnahan et al. (1997) view of innovative
entry as a strategy of market segmentation. The introduction of a vertically su-
perior model secures a temporary advantage which is subsequently undermined by
imitation and innovation elsewhere. As the model ages its increasing price elasticity
indicates a falling price-cost margin in reflection of its declining competitiveness.
While the results reflect retail market competition, they illustrate the trade-off man-
ufacturers face when considering new model introductions. The clear market stealing
benefits must be considered net of any losses via cannibalization when set against
the costs of creating and launching a new model. Inevitably, given data limitations,
we are estimating a reduced form for market share. A fully specified supply side
would necessitate access to production and product development costs for alterna-
tive new products. Of course, the outside researcher cannot get access to such cost
data, particularly at a sufficiently disaggregated level.
Furthermore, our results necessarily relate to effects evaluated at the mean. The
outcome for any particular new model introduction is difficult to predict and a
strongly skewed sales distribution suggests that many models probably fail to recoup
their development costs.
26

References
Anderson, C. (2006). The Long Tail: Why the Future of Business is Selling Less
of More. Hyperion.
Arrow, K. (1962). Economic welfare and the allocation of resources for invention.
In The Rate and Direction of Inventive Activity: Economic and Social Factors,
NBER Chapters, National Bureau of Economic Research, Inc, pp. 609–626.
Baye, M. R., Gatti, J. R. J., Kattuman, P. and Morgan, J. (2009). Clicks,
discontinuities, and firm demand online. Journal of Economics & Management
Strategy, 18 (4), 935–975.
—, Morgan, J. and Scholten, P. (2004). Price dispersion in the small and in
the large: Evidence from an internet price comparison site. Journal of Industrial
Economics, 52 (4), 463–496.
Bresnahan, T. F., Stern, S. and Trajtenberg, M. (1997). Market segmen-
tation and the sources of rents from innovation: Personal computers in the late
1980s. Rand Journal of Economics, 28 (0), S17–S44.
Chumpitaz, R., Kerstens, K., Paparoidamis, N. and Staat, M. (2010). He-
donic price function estimation in economics and marketing: revisiting Lancaster’s
issue of “non-combinable” goods. Annals of Operations Research, 173, 145–161.
Clements, M. T. and Ohashi, H. (2005). Indirect network effects and the prod-
uct cycle: Video games in the U.S., 1994-2002. Journal of Industrial Economics,
53 (4), 515–542.
Corts, K. S. (2001). The strategic effects of vertical market structure: Common
agency and divisionalization in the US motion picture industry. Journal of Eco-
nomics & Management Strategy, 10 (4), 509–528.
27

Davis, P. (2006). Measuring the business stealing, cannibalization and market ex-
pansion effects of entry in the US motion picture exhibition market. Journal of
Industrial Economics, 54 (3), 293–321.
Desai, P. S. (2001). Quality Segmentation in Spatial Markets: When Does Canni-
balization Affect Product Line Design? Marketing Science, 20 (3), 265–283.
Ellison, G. and Ellison, S. F. (2009). Search, obfuscation, and price elasticities
on the internet. Econometrica, 77 (2), 427–452.
Geroski, P. A. (2003). The Evolution of Markets. Oxford: Oxford University
Press.
Gowrisankaran, G. and Rysman, M. (2007). Dynamics of Consumer De-
mand for New Durable Goods. Department of Economics - Working Papers Series
WP2007-024, Boston University.
Hausman, J. A. and Leonard, G. K. (2002). The competitive effects of a new
product introduction: A case study. Journal of Industrial Economics, 50 (3),
237–63.
Haynes, M. and Thompson, S. (2008). Price, price dispersion and number of sell-
ers at a low entry cost shopbot. International Journal of Industrial Organization,
26 (2), 459–472.
Kaiser, U. (2006). Magazines and their companion websites: Competing outlet
channels? Review of Marketing Science, 4 (3), 1–24.
Lerner, J. (1995). Pricing and financial resources: An analysis of the disk drive
industry, 1980-88. The Review of Economics and Statistics, 77 (4), 585–98.
Manninen, K. (2005). Hedonic price indexes for digital cameras. Survey of Current
Business, US Government Printing Office, pp. 22–27.
28

McFadden, D. (1978). Modelling the choice of residential location. In F. S. An-
ders Karlqvist, Lars Lundqvist and J. W. Weibull (eds.), Spatial Interaction The-
ory and Planning Models, Amsterdam, North Holland.
Moorthy, K. S. and Png, I. P. L. (1992). Market segmentation, cannibalization,
and the timing of product introductions. Management Science, 38 (3), 345–359.
Ohashi, H. (2005). How does cannibalization affect the timing of new product intro-
ductions? Evidence from US video games. Paper presented at EARIE Conference,
Porto, August.
Shapiro, C. and Varian, H. R. (1999). Information Rules: A strategic guide to
the network economy. Harvard Business School Press: Cambridge MA.
Slade, M. E. (2004). Market power and joint dominance in U.K. brewing. Journal
of Industrial Economics, 52 (1), 133–163.
Stavins, J. (1995). Model entry and exit in a differentiated-product industry: The
personal computer market. The Review of Economics and Statistics, 77 (4), 571–
84.
Stigler, G. J. (1961). The economics of information. Journal of Political Economy,
69, 213.
Sturgeon, T. J. (2002). Modular production networks: a new American model of
industrial organization. Industrial and Corporate Change, 11 (3), 451–496.
Van Heerde, H. J., Mela, C. F. and Manchanda, P. (2004). The Dynamic
Effect of Innovation on Market Structure. Journal of Marketing Research, 41 (2),
166–183.
—, Srinivasan, S. and Dekimpe, M. G. (2010). Estimating cannibalization rates
for pioneering innovations. Marketing Science, 29 (6), 1024–1039.
29

Appendix
Table A.1
Demand Equations
Cumulative no. of newer cameras in same camera format(1) Any quality (2) Higher quality (3) Higher than
median qualitylog(pit) −1.658∗∗∗ −1.637∗∗∗ −1.657∗∗∗
(0.121) (0.121) (0.121)log(price other, same format) 1.755∗∗∗ 1.755∗∗∗ 1.749∗∗∗
(0.355) (0.350) (0.356)log(price other, different format) −0.848 −0.838 −0.864
(0.702) (0.696) (0.704)Cumulative measure −0.00330∗∗ −0.00454∗∗∗ −0.00504∗∗
(0.00134) (0.00141) (0.00223)
Hansen p-value 0.211 0.236 0.183Wald test p-value 0.000 0.000 0.000BIC 3.30 3.297 3.301
No. of cameras 336 336 336No. of observations 2872 2872 2872
Notes
a The dependent variable is log of camera i’s sales at time t.b All equations are estimated using instrumental variable techniques. Columns 1 to 3 show the results using the three differentcumulative count measures. All equations include time dummies.c Hansen is a chi-square test of the overidentifying restrictions.d Robust standard errors are given in parentheses below the estimated coefficientse *** p<0.01, ** p<0.05, * p<0.10
30

Table A.2
Market Stealing versus Cannibalization Effects
Cumulative no. of newer cameras in same camera format(1) Any quality (2) Higher quality (3) Higher than
median qualitylog(pit) −1.545∗∗∗ −1.545∗∗∗ −1.573∗∗∗
(0.118) (0.118) (0.120)log(price other, same format) 1.756∗∗∗ 1.733∗∗∗ 1.756∗∗∗
(0.336) (0.335) (0.340)log(price other, different format) −0.626 −0.693 −0.669
(0.669) (0.670) (0.678)Cumulative measure:
-rival brand −0.00285∗∗ −0.00552∗∗∗ −0.00946∗∗∗(0.00140) (0.00154) (0.00346)
-own brand −0.0172 0.00186 0.0000356(0.0105) (0.0127) (0.0145)
Hansen p-value 0.267 0.291 0.315Wald test p-value 0.000 0.000 0.000BIC 3.298 3.294 3.297
No. of cameras 336 336 336No. of observations 2872 2872 2872
Notes
a The dependent variable is log of camera i’s sales at time t.b All equations are estimated using instrumental variable techniques. Columns 1 to 3 show the results using the three differentcumulative count measures. All equations include time dummies.c Hansen is a chi-square test of the overidentifying restrictions.d Robust standard errors are given in parentheses below the estimated coefficientse *** p<0.01, ** p<0.05, * p<0.10
31