NEW CAR CO REPORT 2016 - SMMT · The automotive industry in the UK had a strong year in ... This...
20
THE SOCIETY OF MOTOR MANUFACTURERS AND TRADERS LIMITED NEW CAR CO2 REPORT 2016 The 15th report
-
Upload
phungtuong -
Category
Documents
-
view
216 -
download
2
Transcript of NEW CAR CO REPORT 2016 - SMMT · The automotive industry in the UK had a strong year in ... This...

THE SOCIETY OF MOTOR MANUFACTURERS
AND TRADERS LIMITED
NEW CAR CO2 REPORT 2016The 15th report
DEF506 SMMT New Car Co2 Report 2016 v2.indd 1 04/03/2016 08:35
THE SOCIETY OF MOTOR MANUFACTURERS AND TRADERSPage 2 | New Car CO2 Report 2016
FOREWORD
The automotive industry in the UK had a strong year in 2015, delivering record volumes of new car registrations and average new car and van carbon dioxide (CO2) emissions hit their lowest level ever. Alternatively-fuelled vehicles, including pure and plug-in hybrid electric vehicles, also saw record volumes and market share.
This 15th annual report continues SMMT’s open and transparent approach to the UK industry’s performance on new car CO2. As always, our reporting uses CO2 fi gures from the offi cial New European Driving Cycle (NEDC) laboratory test, which is required by law and witnessed by a government appointed agency. The industry recognises that these fi gures may not accurately represent real world driving and we welcome moves towards the new World Light vehicle Test Procedure (WLTP), which will help reduce this discrepancy. Given the infi nite variables that can infl uence emissions performance in the real world, laboratory tests will remain a crucial benchmark for consumers to reliably compare the fuel effi ciency of vehicles.
The move to this new test procedure will have signifi cant impacts on a range of measures, such as the EU’s New Car CO2 Regulation, CO2-based taxes on vehicles and the new car fuel economy showroom label. It will be important to inform consumers on the transition to the new test, to ensure they make full use of the improved information in choosing the best vehicle for their particular needs.
It is important that both CO2 and air quality issues are addressed with due consideration when policy decisions are being taken. The latest Euro-6 standard, which became mandatory for new cars from September 2015, and new Real Driving Emissions (RDE) tests, due from 2017, will help restore confi dence in emissions performance. The tightening of the Euro standards in particular is bringing emissions performance of the latest diesel and petrol engines together. Public policy and measures to reduce emissions further should align CO2 and air quality ambitions, so other demand for diesels and CO2 reduction targets are not undermined.
The UK has some of the most ambitious national CO2 targets in the world and road transport has an important role to play in achieving them. A range of technologies will be needed to meet CO2 reduction targets with the internal combustion engine (ICE), with both petrol and diesel technologies making a signifi cant contribution. Further electrifi cation of the vehicle fl eet is also needed. There has been a strong comprehensive approach to encouraging early adopters to the ultra-low emission vehicle (ULEV) market, but continued incentives and policies are needed to ensure this market grows and will overcome the signifi cant gap between current ULEV uptake and target levels. The uptake of ULEVs will greatly infl uence achieving the 2021 EU New Car CO2 Regulation target of 95g/km. It is also important that low emission vehicles are accessible and the technology is cost eff ective, in order to ensure necessary broad market take-up.
This target requires a signifi cant pick-up in the rate of progress in reducing new car CO2 emissions. Average new car CO2 emissions fell by 2.6% in 2015 to 121.4g/km. There has been some suggested discrepancy with the CO2 performance of around 2,500 registrations of one particular brand, these vehicles are included in the database, but given the low volume, out a 2.63 million unit market, they make no material diff erence to the overall performance reported. Emissions have fallen every year since SMMT fi rst started producing this report but we must maintain this momentum, delivering ever more effi cient vehicles. To note we have typically used 2000 or 2007 as the base year for comparisons, as data from 2000 was for 100% of the new vehicles and 2007 was pre-recession and marked a step change in average new car CO2 performance.
2016 will be an important year, with, for example, the on-going debate on the move to the new test cycle and development of post-2020 New Car CO2 Regulations. This report helps set the scene for where the UK market currently is, where it has come from and how we can work collectively with all the key stakeholders, in a comprehensive approach, to deliver further progress. The UK motor industry is best placed to help deliver these objectives, and in doing so secure economic benefi ts to the UK in terms of jobs and wealth creation. n
CONTENTS:
2. FOREWORD 3. SUMMARY
4. DATA SUMMARY 5. AVERAGE UK NEW CAR CO₂
EMISSIONS
6. HOW CO₂ DATA IS DERIVED
7. PARC AND TOTAL CO₂ EMISSIONS
8/9. OTHER EMISSIONS
10. MARKET TRENDS AND CO₂ PERFORMANCE
11/13. MARKET TRENDS AND CO₂ PERFORMANCE
14/16. CO₂ BASED TAXES AND HOW THESE MAY INFLUENCE EMISSIONS
17. LIGHT COMMERCIAL VEHICLE (LCV TO 3.5 TONNES) CO₂ PERFORMANCE
18/19. OUTLOOK FOR NEW CAR CO₂ EMISSIONS
DEF506 SMMT New Car Co2 Report 2016 v2.indd 2 04/03/2016 08:35

THE SOCIETY OF MOTOR MANUFACTURERS AND TRADERS New Car CO2 Report 2016 | Page 3
SUMMARY
2015 NEW CAR CO2 EMISSIONSIn 2015 average new car CO2 emissions in the UK fell to a new low of 121.4g/km, a 26.4% drop on 2007 (pre-recession performance) and a 2.6% reduction on 2014.
UK NEW CAR EMISSIONS AGAINST EU TARGETThe UK’s 2015 performance was 6.6% below the pan-EU 2015 target of 130g/km. However, progression of 4.8% per annum is necessary to achieve the EU’s 2021 target of 95g/km.
PLUG-IN VEHICLE UPTAKE GROWS, BUT NEEDS ON-GOING SUPPORT TO MEET TARGETSRegistrations of pure electric and plug-in hybrid vehicles rose by 94% on 2014 to account for more than 1% of the total market, while the alternatively fuelled vehicle (including hybrids) market share reached a new high of 2.8%. However, there is a signifi cant gap between this and the government’s ambition of a 60% share of the market for pure and plug-in electric vehicles by 2030.
IMPORTANCE OF DIESELS IN MEETING THE CO2 TARGETSDiesel cars can emit up to 20% less CO2 than a petrol car. Therefore any measures that undermine diesel uptake could erode the industry’s ability to meet its 2021 95g/km target.
TOTAL CO2 EMISSIONS FROM ALL CARS IN USECO2 emissions from all cars in use have been reduced by over 15% since 2007. Emissions have been cut despite the rise in vehicle use and the number of vehicles on the roads. This performance refl ects new, lower emitting vehicles entering the market place.
UPTAKE OF NEW TECHNOLOGIES KEY TO GREENING THE FLEETNew cars are, on average, around 20% lower CO2 emitting than the average car in use. Speeding up the rate of renewal in the fl eet will help lower emissions from all vehicles in use, as well as delivering ever-safer and lower-polluting vehicles. n
The 15th New Car CO₂ Report outlines UK automotive performance relating to CO₂ emissions, market trends and the diff erent development drivers. For more detailed fi ndings and regular updates see www.smmt.co.uk/
This report continues to use CO2 fi gures from the offi cial NEDC laboratory test, which is required by law and witnessed by a government appointed agency. There has been considerable interest in how CO2 fi gures are currently derived, given forthcoming changes in the test procedure and diff erences between test and real world performance. These forthcoming test changes are welcomed by industry to ensure trust and confi dence in the data supplied to consumers and other stakeholders.
2015
2007
-26.4%-26.4%-15.1%-15.1%-6.6%-6.6%
2015
2007
62
73
Mt CO2
CO2 emissions from all
cars in use
201414,512 vehicles
201528,199 vehicles
94%
2015
2007
-26.4%-26.4%-15.1%-15.1%-6.6%-6.6%
2015
2007
62
73
Mt CO2
CO2 emissions from all
cars in use
201414,512 vehicles
201528,199 vehicles
94%
2015
2007
-26.4%-26.4%-15.1%-15.1%-6.6%-6.6%
2015
2007
62
73
Mt CO2
CO2 emissions from all
cars in use
201414,512 vehicles
201528,199 vehicles
94%
2015
2007
-26.4%-26.4%-15.1%-15.1%-6.6%-6.6%
2015
2007
62
73
Mt CO2
CO2 emissions from all
cars in use
201414,512 vehicles
201528,199 vehicles
94%
2015
2007
-26.4%-26.4%-15.1%-15.1%-6.6%-6.6%
2015
2007
62
73
Mt CO2
CO2 emissions from all
cars in use
201414,512 vehicles
201528,199 vehicles
94%
DEF506 SMMT New Car Co2 Report 2016 v2.indd 3 04/03/2016 08:35
THE SOCIETY OF MOTOR MANUFACTURERS AND TRADERSPage 4 | New Car CO2 Report 2016
DATA SUMMARY
GLOSSARY
AFV Alternative Fuelled Vehicle CO2 Carbon Dioxide CCT Company car tax DfT Department for Transport EV Electric Vehicle g/km grams per kilometre HFCV Hydrogen Fuel Cell Cars and Vehicles LCV Light Commercial Vehicle MPV Multi-Purpose Vehicle OLEV Office for Low Emission Vehicles PHEV Plug-in Hybrid Electric Vehicle ULEV Ultra-Low Emission Vehicles (<75g/km CO2) ULEZ Ultra-Low Emission VED Vehicle Excise Duty WLTP World Harmonised Light Vehicles Test Procedure WLTC World Harmonised Light vehicles Test Cycle
Internal combustion engine (ICE) Petrol or diesel engine, including those adapted to operate on alternative or gaseous fuels.
Battery electric vehicle – or pure EVSolely powered by a battery charged from the electricity grid. They have zero emissions from the tailpipe, although some emissions maybe associated with the production of the electricity.
HybridPowered by an ICE, but has a battery and electric motors to capture and re-use braking energy.
Plug-in hybrid electric vehicle ( PHEV) Vehicles with a plug-in battery and an ICE.
Ultra Low Emission Vehicle (ULEV) An ultra-low emission vehicle produces 75g/km or less of CO2.
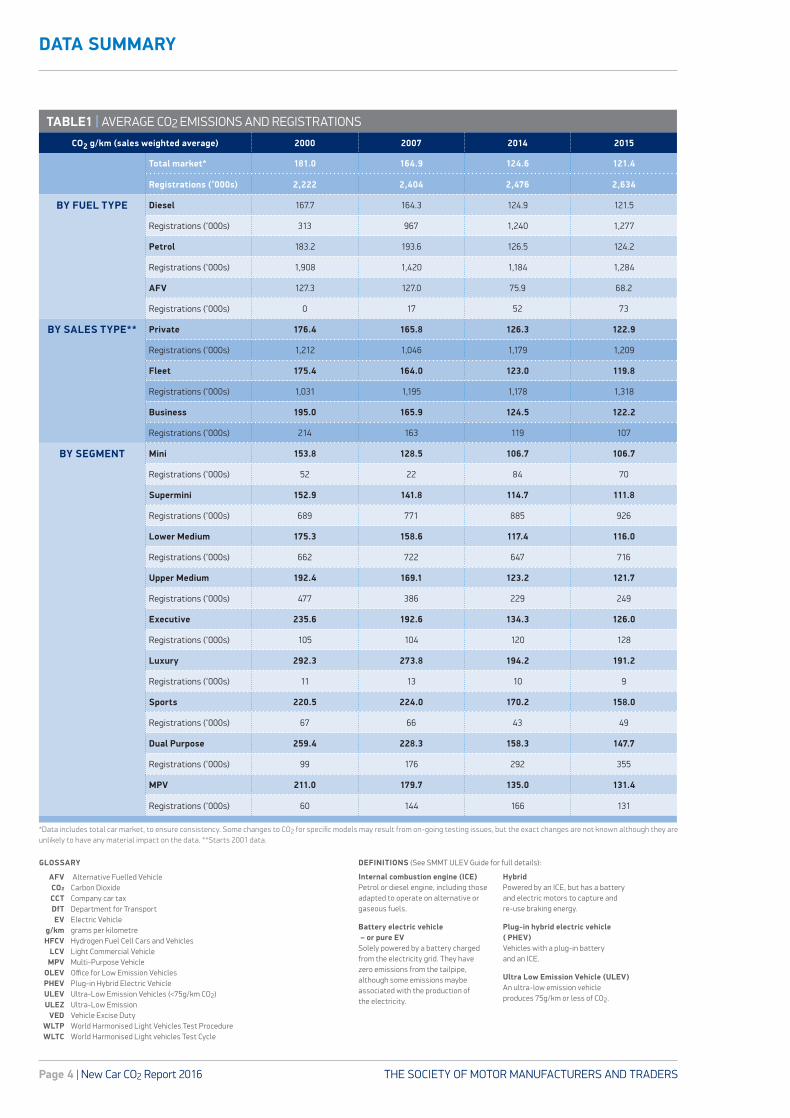
*Data includes total car market, to ensure consistency. Some changes to CO2 for specific models may result from on-going testing issues, but the exact changes are not known although they are unlikely to have any material impact on the data. **Starts 2001 data.
TABLE1 | AVERAGE CO2 EMISSIONS AND REGISTRATIONS
CO2 g/km (sales weighted average) 2000 2007 2014 2015
Total market* 181.0 164.9 124.6 121.4
Registrations (’000s) 2,222 2,404 2,476 2,634
BY FUEL TYPE Diesel 167.7 164.3 124.9 121.5
Registrations (‘000s) 313 967 1,240 1,277
Petrol 183.2 193.6 126.5 124.2
Registrations (‘000s) 1,908 1,420 1,184 1,284
AFV 127.3 127.0 75.9 68.2
Registrations (‘000s) 0 17 52 73
BY SALES TYPE** Private 176.4 165.8 126.3 122.9
Registrations (‘000s) 1,212 1,046 1,179 1,209
Fleet 175.4 164.0 123.0 119.8
Registrations (‘000s) 1,031 1,195 1,178 1,318
Business 195.0 165.9 124.5 122.2
Registrations (‘000s) 214 163 119 107
BY SEGMENT Mini 153.8 128.5 106.7 106.7
Registrations (‘000s) 52 22 84 70
Supermini 152.9 141.8 114.7 111.8
Registrations (‘000s) 689 771 885 926
Lower Medium 175.3 158.6 117.4 116.0
Registrations (‘000s) 662 722 647 716
Upper Medium 192.4 169.1 123.2 121.7
Registrations (‘000s) 477 386 229 249
Executive 235.6 192.6 134.3 126.0
Registrations (‘000s) 105 104 120 128
Luxury 292.3 273.8 194.2 191.2
Registrations (‘000s) 11 13 10 9
Sports 220.5 224.0 170.2 158.0
Registrations (‘000s) 67 66 43 49
Dual Purpose 259.4 228.3 158.3 147.7
Registrations (‘000s) 99 176 292 355
MPV 211.0 179.7 135.0 131.4
Registrations (‘000s) 60 144 166 131
DEFINITIONS (See SMMT ULEV Guide for full details):
DEF506 SMMT New Car Co2 Report 2016 v2.indd 4 04/03/2016 08:35
THE SOCIETY OF MOTOR MANUFACTURERS AND TRADERS New Car CO2 Report 2016 | Page 5
AVERAGE UK NEW CAR CO₂ EMISSIONS
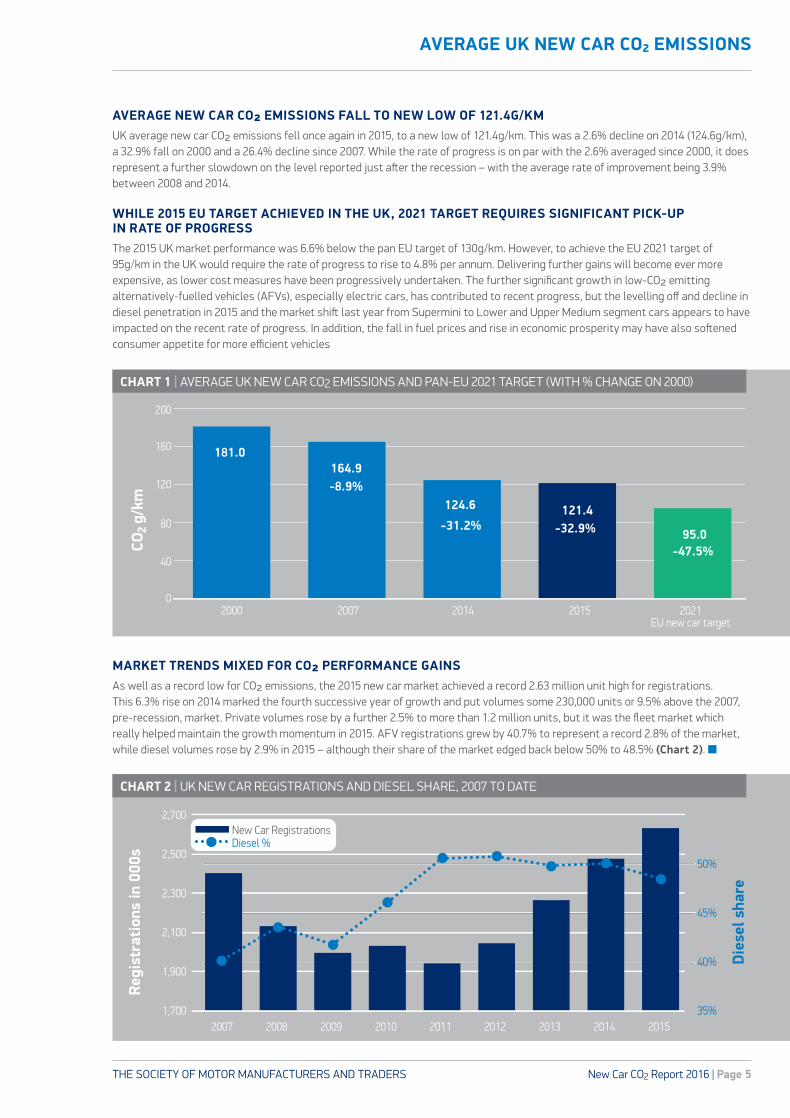
AVERAGE NEW CAR CO2 EMISSIONS FALL TO NEW LOW OF 121.4G/KMUK average new car CO2 emissions fell once again in 2015, to a new low of 121.4g/km. This was a 2.6% decline on 2014 (124.6g/km), a 32.9% fall on 2000 and a 26.4% decline since 2007. While the rate of progress is on par with the 2.6% averaged since 2000, it does represent a further slowdown on the level reported just after the recession – with the average rate of improvement being 3.9% between 2008 and 2014.
WHILE 2015 EU TARGET ACHIEVED IN THE UK, 2021 TARGET REQUIRES SIGNIFICANT PICK-UP IN RATE OF PROGRESSThe 2015 UK market performance was 6.6% below the pan EU target of 130g/km. However, to achieve the EU 2021 target of 95g/km in the UK would require the rate of progress to rise to 4.8% per annum. Delivering further gains will become ever more expensive, as lower cost measures have been progressively undertaken. The further significant growth in low-CO2 emitting alternatively-fuelled vehicles (AFVs), especially electric cars, has contributed to recent progress, but the levelling off and decline in diesel penetration in 2015 and the market shift last year from Supermini to Lower and Upper Medium segment cars appears to have impacted on the recent rate of progress. In addition, the fall in fuel prices and rise in economic prosperity may have also softened consumer appetite for more efficient vehicles
MARKET TRENDS MIXED FOR CO2 PERFORMANCE GAINSAs well as a record low for CO2 emissions, the 2015 new car market achieved a record 2.63 million unit high for registrations. This 6.3% rise on 2014 marked the fourth successive year of growth and put volumes some 230,000 units or 9.5% above the 2007, pre-recession, market. Private volumes rose by a further 2.5% to more than 1.2 million units, but it was the fleet market which really helped maintain the growth momentum in 2015. AFV registrations grew by 40.7% to represent a record 2.8% of the market, while diesel volumes rose by 2.9% in 2015 – although their share of the market edged back below 50% to 48.5% (Chart 2). n
181.0 164.9
-8.9% 124.6
-31.2% 121.4
-32.9% 95.0 -47.5%
0
40
80
120
160
200
2000 2007 2014 2015 2021 EU new car target
CO2 g
/km
35%
40%
45%
50%
1,700
1,900
2,100
2,300
2,500
2,700
2007 2008 2009 2010 2011 2012 2013 2014 2015
Dies
el s
hare
Regi
stra
tion
s in
000
s
New Car Registrations Diesel %
CHART 1 | AVERAGE UK NEW CAR CO2 EMISSIONS AND PAN-EU 2021 TARGET (WITH % CHANGE ON 2000)
CHART 2 | UK NEW CAR REGISTRATIONS AND DIESEL SHARE, 2007 TO DATE
DEF506 SMMT New Car Co2 Report 2016 v2.indd 5 04/03/2016 08:35

THE SOCIETY OF MOTOR MANUFACTURERS AND TRADERSPage 6 | New Car CO2 Report 2016
HOW CO₂ DATA IS DERIVED
HOW CO2 DATA IS DERIVEDForthcoming changes to the test procedure and emissions measurement highlight the focus on how CO2 data is derived and the differences between test and real world performance. This report continues to use CO2 figures from the official laboratory test type approval figures, which is required by law and witnessed by a government appointed agency. The data is collated by SMMT’s Motor Vehicle Registration Information Service (MVRIS), and links vehicles’ CO2 levels to the MVRIS registration database to give average, sales weighted, data. The total new car market is included in this report, to ensure consistency with previous data. There has been some suggested discrepancies with the CO2 performance of around 2,500 registrations of one particular brand, these vehicles are included in the data, but given the low volume - out of a 2.63 million unit market, they make no material difference to the overall performance reported.
TEST PROCEDUREThe CO2 figure declared on each vehicle’s Certificate of Conformity (CoC, the document used to demonstrate the vehicle complies with all the regulations) is derived from the New European Driving Cycle (NEDC) test. This test has its roots in the 1980s and is conducted in a laboratory to enable consumers to make like-for-like comparisons between the CO2 emissions of different vehicles, rather than as a definitive figure that they would be assured of achieving when driving. The vehicle follows a prescribed driving ‘journey’, incorporating particular acceleration, constant speed and idling phases. The test is always completed under the same conditions to enable comparability, for example a cold vehicle with ancillary loads such as lights and air conditions turned off is used on a rolling road or dynamometer to ensure flat road and wind-free conditions.
Limitations in relation to real world performance with the current NEDC test procedure have led to the development of a globally harmonised test procedure – the Worldwide Light vehicle Test Procedure (WLTP). This test will still be carried out under laboratory conditions for comparability purposes, but strict procedures will bring the results closer to real world. For instance, road load or resistance, gear shifts, vehicle weight, tyre type and pressure, fuel quality, ambient temperature and
a revised test pattern will replicate more accurately common driving practices. The new test cycle takes almost 50% longer to complete, covers twice the distance and is undertaken at a 46.5% higher average speed than the NEDC (Chart 3). The WLTP test is expected to be required for new model types from 1 September 2017 and for all new cars from September 2019.
Driving a vehicle in laboratory conditions and on the road will result in different emissions performances. Real world performance will be influenced by driving style, road and weather conditions, ambient temperatures, location (for example altitude and topology), speed and vehicle condition. It is likely that a discrepancy will continue under WLTP due to these various parameters, as it is difficult for consumers to replicate exactly a vehicle’s test performance. The legally required CO2 data remains fit for comparison purposes, while recognising that experience in the real world may vary.
IMPLICATIONS FOR CO2 BASED MEASURESUnderstanding the difference between the two cycles will be important for comparing vehicles tested under the different approaches. The WLTP is likely to result in a higher CO2 figure, given it is a more strenuous test, and may show up to 20% higher CO2. Given that the CO2 performance is used for a variety of measures such as the European New Car CO2 Regulation, motoring taxes, the new car label (label showing fuel consumption and CO2 performance that must be displayed alongside a car in showrooms) and consumer information (e.g. advertising and marketing) it will be important to recognise which test has been undertaken, to ensure buyers can make like-for-like comparisons. Until September 2019, when all new cars are required to be tested on WLTP, it is thought that a conversion metric will be established to convert WLTP to NEDC-equivalent figures. n
0
20
40
60
80
100
120
140
0 200 400 600 800 1000 1200 1400 1600 1800
Spee
d (K
PH)
Time (seconds)
WLTP NEDC
CHART 3 | NEDC AND WLTP TEST CYCLES
DEF506 SMMT New Car Co2 Report 2016 v2.indd 6 04/03/2016 08:35
THE SOCIETY OF MOTOR MANUFACTURERS AND TRADERS New Car CO2 Report 2016 | Page 7
PARC AND TOTAL CO₂ EMISSIONS
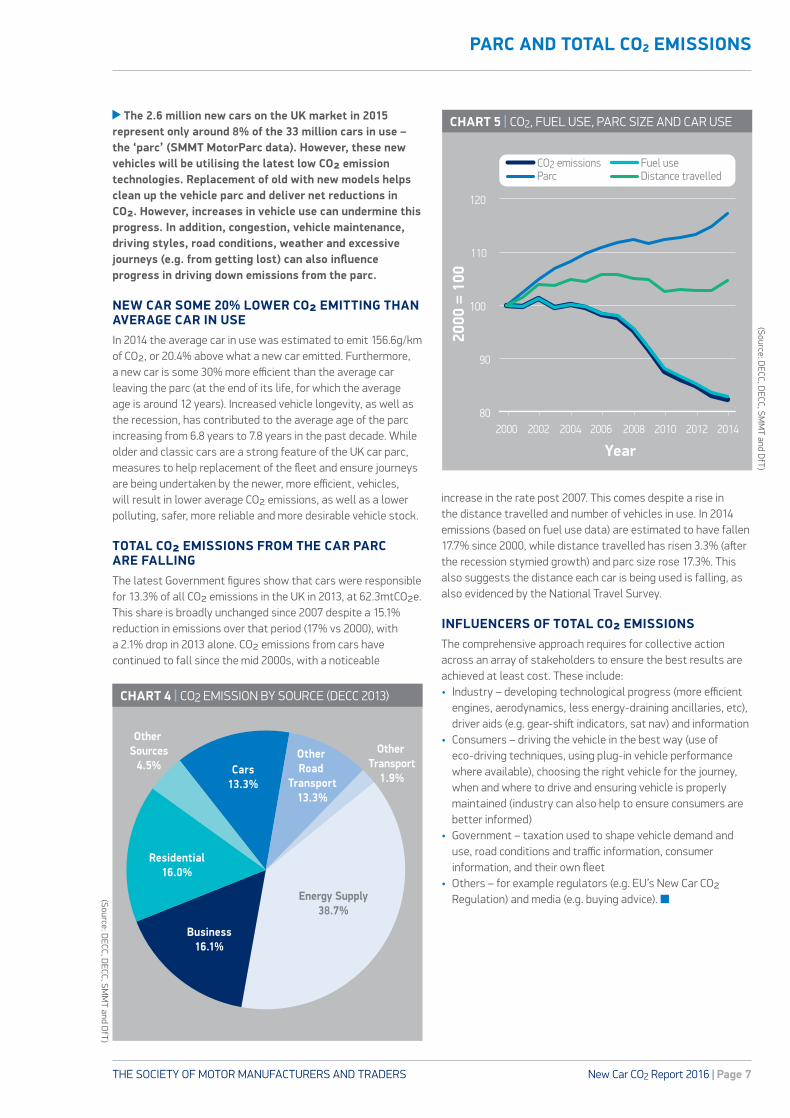
The 2.6 million new cars on the UK market in 2015 represent only around 8% of the 33 million cars in use – the ‘parc’ (SMMT MotorParc data). However, these new vehicles will be utilising the latest low CO2 emission technologies. Replacement of old with new models helps clean up the vehicle parc and deliver net reductions in CO2. However, increases in vehicle use can undermine this progress. In addition, congestion, vehicle maintenance, driving styles, road conditions, weather and excessive journeys (e.g. from getting lost) can also influence progress in driving down emissions from the parc.
NEW CAR SOME 20% LOWER CO2 EMITTING THAN AVERAGE CAR IN USE In 2014 the average car in use was estimated to emit 156.6g/km of CO2, or 20.4% above what a new car emitted. Furthermore, a new car is some 30% more efficient than the average car leaving the parc (at the end of its life, for which the average age is around 12 years). Increased vehicle longevity, as well as the recession, has contributed to the average age of the parc increasing from 6.8 years to 7.8 years in the past decade. While older and classic cars are a strong feature of the UK car parc, measures to help replacement of the fleet and ensure journeys are being undertaken by the newer, more efficient, vehicles, will result in lower average CO2 emissions, as well as a lower polluting, safer, more reliable and more desirable vehicle stock.
TOTAL CO2 EMISSIONS FROM THE CAR PARC ARE FALLINGThe latest Government figures show that cars were responsible for 13.3% of all CO2 emissions in the UK in 2013, at 62.3mtCO2e. This share is broadly unchanged since 2007 despite a 15.1% reduction in emissions over that period (17% vs 2000), with a 2.1% drop in 2013 alone. CO2 emissions from cars have continued to fall since the mid 2000s, with a noticeable
increase in the rate post 2007. This comes despite a rise in the distance travelled and number of vehicles in use. In 2014 emissions (based on fuel use data) are estimated to have fallen 17.7% since 2000, while distance travelled has risen 3.3% (after the recession stymied growth) and parc size rose 17.3%. This also suggests the distance each car is being used is falling, as also evidenced by the National Travel Survey.
INFLUENCERS OF TOTAL CO2 EMISSIONSThe comprehensive approach requires for collective action across an array of stakeholders to ensure the best results are achieved at least cost. These include:• Industry – developing technological progress (more efficient
engines, aerodynamics, less energy-draining ancillaries, etc), driver aids (e.g. gear-shift indicators, sat nav) and information
• Consumers – driving the vehicle in the best way (use of eco-driving techniques, using plug-in vehicle performance where available), choosing the right vehicle for the journey, when and where to drive and ensuring vehicle is properly maintained (industry can also help to ensure consumers are better informed)
• Government – taxation used to shape vehicle demand and use, road conditions and traffic information, consumer information, and their own fleet
• Others – for example regulators (e.g. EU’s New Car CO2 Regulation) and media (e.g. buying advice). n
80
90
100
110
120
2000 2002 2004 2006 2008 2010 2012 2014
2000
= 1
00
Year
CO2 emissions Fuel use Parc Distance travelled
Energy Supply38.7%
Other Sources
4.5%Other
Transport1.9%
Business16.1%
Residential16.0%
Cars13.3%
Other Road
Transport13.3%
CHART 4 | CO2 EMISSION BY SOURCE (DECC 2013)
CHART 5 | CO2, FUEL USE, PARC SIZE AND CAR USE
(Source: DECC, D
ECC, SMM
T and DfT)
(Source: DECC, D
ECC, SMM
T and DfT)
DEF506 SMMT New Car Co2 Report 2016 v2.indd 7 04/03/2016 08:35
THE SOCIETY OF MOTOR MANUFACTURERS AND TRADERSPage 8 | New Car CO2 Report 2016
OTHER EMISSIONS
INDUSTRY COMMITTED TO REDUCING CO2 AND IMPROVING AIR QUALITY IN PARALLELIndustry and policy makers have been focussed on both CO2 emission reductions alongside a continued focus on air quality. The automotive sector takes its responsibilities in improving air quality very seriously and has invested billions of pounds in technology to reduce pollutants, notably oxides of nitrogen (NOx) and particulate matter (PM), in parallel with CO2. CO2 is a global issue, but NOx and PM impact at a local and regional level.
These pollutant emissions are regulated by tailpipe ‘Euro’ standards, which dictate maximum levels that a vehicle can emit. The Euro standard is a pass/fail type test conducted in the laboratory. These pollutants are measured in much smaller volumes than CO2 in the exhaust gases, so the precision required of the test equipment is much greater. For instance, the NOx limit for Euro-6 diesel is more than 1,500 times smaller than the average new car CO2 in 2015 (121.4g/km CO2 vs 0.08g/km NOx).
Ever tougher Euro standards have driven technological development. Public attention has mainly focussed on the performance of diesel vehicles in urban areas. Petrol and diesel car emission levels are broadly aligned with the latest Euro-6 standard. Zero and Ultra-low emission vehicles (ULEVs – below 75g CO2/km) can also provide air quality benefits.
NOX AND PM LEVELS FALLING NATIONALLY, BUT LOCAL AIR QUALITY CONCERNS REMAINUK NOx emissions come from three main sources, power stations (30%), road transport (28%) and other combustion, including stationary sources and heating (25%). National figures from Department for Transport (DfT)
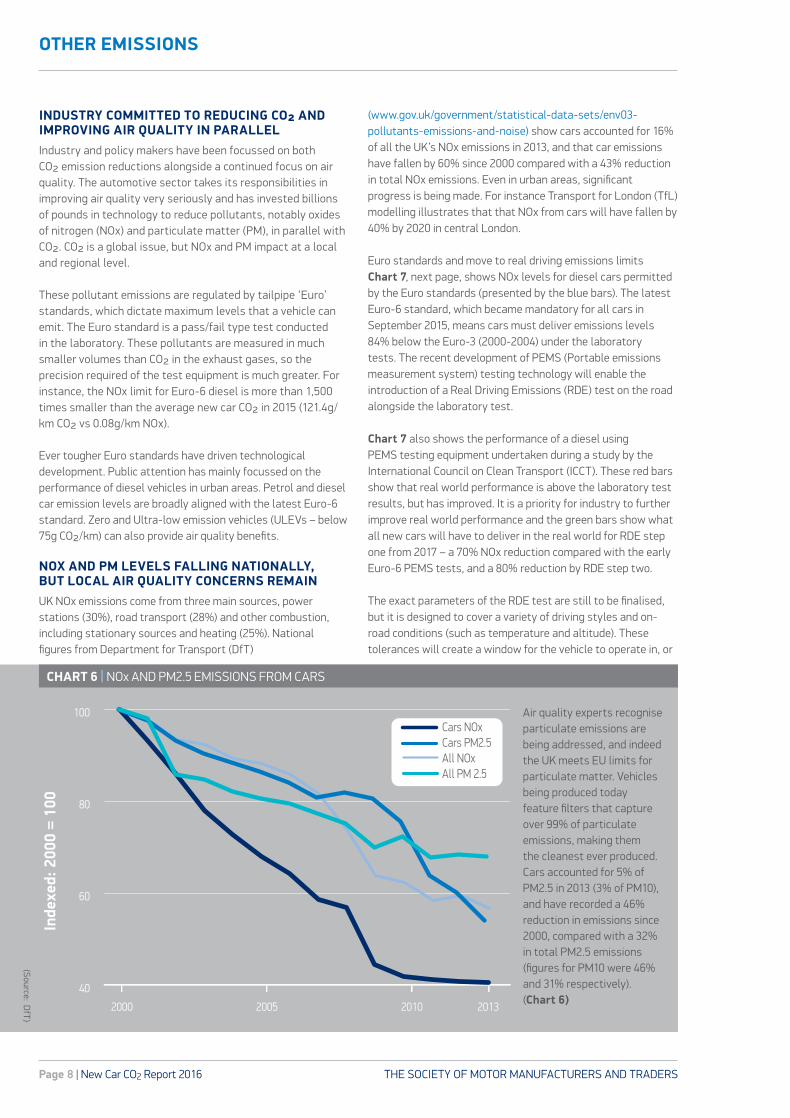
(www.gov.uk/government/statistical-data-sets/env03-pollutants-emissions-and-noise) show cars accounted for 16% of all the UK’s NOx emissions in 2013, and that car emissions have fallen by 60% since 2000 compared with a 43% reduction in total NOx emissions. Even in urban areas, significant progress is being made. For instance Transport for London (TfL) modelling illustrates that that NOx from cars will have fallen by 40% by 2020 in central London.
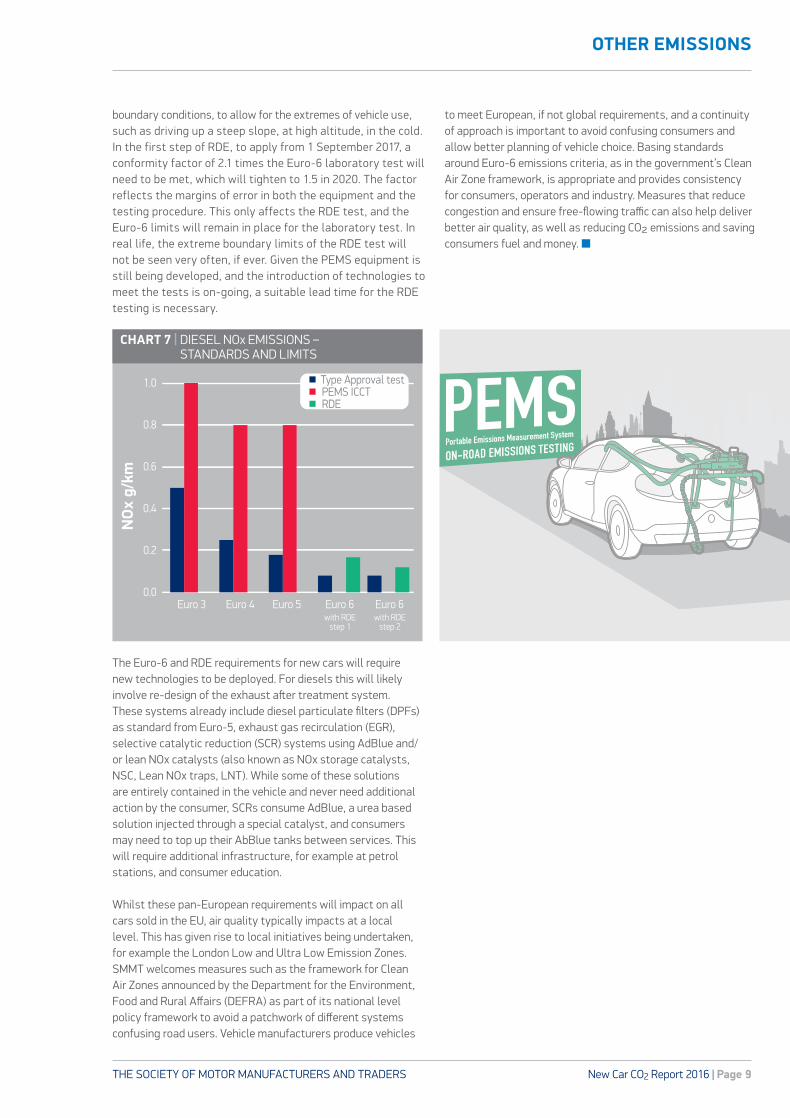
Euro standards and move to real driving emissions limitsChart 7, next page, shows NOx levels for diesel cars permitted by the Euro standards (presented by the blue bars). The latest Euro-6 standard, which became mandatory for all cars in September 2015, means cars must deliver emissions levels 84% below the Euro-3 (2000-2004) under the laboratory tests. The recent development of PEMS (Portable emissions measurement system) testing technology will enable the introduction of a Real Driving Emissions (RDE) test on the road alongside the laboratory test.
Chart 7 also shows the performance of a diesel using PEMS testing equipment undertaken during a study by the International Council on Clean Transport (ICCT). These red bars show that real world performance is above the laboratory test results, but has improved. It is a priority for industry to further improve real world performance and the green bars show what all new cars will have to deliver in the real world for RDE step one from 2017 – a 70% NOx reduction compared with the early Euro-6 PEMS tests, and a 80% reduction by RDE step two.
The exact parameters of the RDE test are still to be finalised, but it is designed to cover a variety of driving styles and on-road conditions (such as temperature and altitude). These tolerances will create a window for the vehicle to operate in, or
40
60
80
100
2000 2005 2010 2013
Inde
xed:
200
0 =
100
Cars NOx
All NOx Cars PM2.5
All PM 2.5
Air quality experts recognise particulate emissions are being addressed, and indeed the UK meets EU limits for particulate matter. Vehicles being produced today feature filters that capture over 99% of particulate emissions, making them the cleanest ever produced. Cars accounted for 5% of PM2.5 in 2013 (3% of PM10), and have recorded a 46% reduction in emissions since 2000, compared with a 32% in total PM2.5 emissions (figures for PM10 were 46% and 31% respectively).(Chart 6)
CHART 6 | NOx AND PM2.5 EMISSIONS FROM CARS
(Source: DfT)
DEF506 SMMT New Car Co2 Report 2016 v2.indd 8 04/03/2016 08:36
THE SOCIETY OF MOTOR MANUFACTURERS AND TRADERS New Car CO2 Report 2016 | Page 9
OTHER EMISSIONS
boundary conditions, to allow for the extremes of vehicle use, such as driving up a steep slope, at high altitude, in the cold. In the first step of RDE, to apply from 1 September 2017, a conformity factor of 2.1 times the Euro-6 laboratory test will need to be met, which will tighten to 1.5 in 2020. The factor reflects the margins of error in both the equipment and the testing procedure. This only affects the RDE test, and the Euro-6 limits will remain in place for the laboratory test. In real life, the extreme boundary limits of the RDE test will not be seen very often, if ever. Given the PEMS equipment is still being developed, and the introduction of technologies to meet the tests is on-going, a suitable lead time for the RDE testing is necessary.
The Euro-6 and RDE requirements for new cars will require new technologies to be deployed. For diesels this will likely involve re-design of the exhaust aft er treatment system. These systems already include diesel particulate fi lters (DPFs) as standard from Euro-5, exhaust gas recirculation (EGR), selective catalytic reduction (SCR) systems using AdBlue and/or lean NOx catalysts (also known as NOx storage catalysts, NSC, Lean NOx traps, LNT). While some of these solutions are entirely contained in the vehicle and never need additional action by the consumer, SCRs consume AdBlue, a urea based solution injected through a special catalyst, and consumers may need to top up their AbBlue tanks between services. This will require additional infrastructure, for example at petrol stations, and consumer education.
Whilst these pan-European requirements will impact on all cars sold in the EU, air quality typically impacts at a local level. This has given rise to local initiatives being undertaken, for example the London Low and Ultra Low Emission Zones. SMMT welcomes measures such as the framework for Clean Air Zones announced by the Department for the Environment, Food and Rural Aff airs (DEFRA) as part of its national level policy framework to avoid a patchwork of diff erent systems confusing road users. Vehicle manufacturers produce vehicles
to meet European, if not global requirements, and a continuity of approach is important to avoid confusing consumers and allow better planning of vehicle choice. Basing standards around Euro-6 emissions criteria, as in the government’s Clean Air Zone framework, is appropriate and provides consistency for consumers, operators and industry. Measures that reduce congestion and ensure free-fl owing traffi c can also help deliver better air quality, as well as reducing CO2 emissions and saving consumers fuel and money. n
0.0
0.2
0.4
0.6
0.8
1.0
Euro 3 Euro 4 Euro 5 Euro 6 with RDE
step 1 with RDE
step 2
Euro 6
Type Approval test PEMS ICCT RDE
NO
x g/
km
CHART 7 | DIESEL NOx EMISSIONS – STANDARDS AND LIMITS
DEF506 SMMT New Car Co2 Report 2016 v2.indd 9 04/03/2016 08:36

THE SOCIETY OF MOTOR MANUFACTURERS AND TRADERSPage 10 | New Car CO2 Report 2016
MARKET TRENDS AND CO₂ PERFORMANCE
MARKET MOVING EN MASSE TO LOWER CO2 EMITTING PRODUCTSChart 8, below, showing the UK market by selected 5g/km CO2 bands, illustrates the shift to lower emitting vehicles across the market place. In 2015, 72.0% of the market emitted less than 130g/km – the EU’s 2015 target and 9.2% were 95g/km or below – the 2021 target. This compares with 10.6% and 0% respectively in 2007 and 68.6% and 6.4% in 2014. The rate of progress has particularly stepped up since 2007 as a multiplicity of factors, such as the New Car CO2 Regulation, technological change – notably arrival of alternatively fuelled vehicles (AFVs) and greater diesel penetration, stricter CO2 based taxes and information provision, plus the recession have all combined to drive consumers and the market into lower CO2 emitting vehicles.
Vehicle type will influence the average CO2 emissions performance. This section looks at the market primarily by fuel and segment type (SMMT splits the market into nine categories
broadly based on body type and engine size). Sales type – e.g. private or fleet buyer, can also be an influence, although on a sales weighted basis the two are virtually the same (with a maximum variance of some 3% since 2000).
CO2 EMISSIONS BY FUEL TYPEAFVs typically offer lower CO2 emissions than regular internal combustion engine (ICE) vehicles, which are normally fuelled by diesel or petrol, as evidenced in Chart 9. Electric vehicles (EVs - those using battery power) have zero emissions from the tail pipe. Hydrogen-fuelled cars are also zero emitting, using hydrogen to make electricity. Hybrids have both electric power and an ICE, whilst a plug-in hybrid electric vehicle (PHEV) can run on electricity from the national grid and so has zero emission capability. Diesel cars tend to emit up to 20% lower CO2 than their petrol equivalent, although on a sales weighted basis are more similar due to types of models typically fitted with diesels being larger/heavier. 2015 once again saw an increase in the availability of AFVs, with 65 models recording
registrations, up from 60 in 2014 and just three in 2007.
On a sales weighted CO2 performance basis, AFVs emitted 68.2g/km in 2015 – more than 40% below the market average. This was 10% below their 2014 performance and 40% below their 2007 average. This reflects the increased availability and sales of pure EVs and PHEVs, as well as broader technological progress. Pure EVs represented 0.4% of the 2015 market, after registrations rose by 48.3% in 2015 to 9,934 units. 2015’s EV volumes accounted for 80% of the total zero emission car registrations in the past three years and 44% in past 15. Nissan’s Leaf was the best selling EV in 2015, accounting for over half the market. Renault’s Zoe and Tesla also reported strong growth during the year.
Chart 10 shows how AFV registrations on the whole have performed and the recent ramp up in market share, to 2.8% in 2015. 2015 was also notable for the dip in diesel share. Diesel
0%
5%
10%
15%
0 65
85
105
125
145
165
185
205
225
245
265
285
301+
Mar
ket s
hare
CO2 g/km - 5g bands
2000 2007
2014 2015
0
20
60
100
140
180
2007 2010 2014 2015
CO2
g/km
AFV Diesel Petrol
CHART 8 | NEW CAR MARKET BY CO2 5G/KM BANDS
CHART 9 | CO2 PERFORMANCE BY FUEL TYPE
DEF506 SMMT New Car Co2 Report 2016 v2.indd 10 04/03/2016 08:36

THE SOCIETY OF MOTOR MANUFACTURERS AND TRADERS New Car CO2 Report 2016 | Page 11
MARKET TRENDS AND CO₂ PERFORMANCE
registrations rose by 2.9% in 2015, but were outpaced by the 8.4% rise by petrol powered cars. This resulted in diesel share slipping back below 50%. Diesel volumes came under pressure from growing concerns over air quality and also possibly from movements in fuel prices swinging the balance towards petrol fuelled cars.
Registrations of PHEVs rose by 133% in 2015 to 18,254 units. The Mitsubishi Outlander was the best selling PHEV, with volumes more than doubling to be the best selling AFV of all (outpacing Toyota’s Yaris and Auris models). The new VW Golf, Mercedes C Class and increased full year registrations of the Audi A3, BMW i3 and i8 series also boosted the plug-in hybrid sector. Registrations of EVs and PHEVs collectively were up 94% in 2015 to account for 1.1% of the market, up from 0.6% in 2014. Petrol/electric hybrids still dominate the AFV market place (Chart 11), and recorded an 18.1% rise in 2015, with Toyota and Lexus models leading the growth. The diesel/electric hybrid market also improved in 2015, up 36.6%.
Chart 12 shows the market for cars with CO2 emissions below 95g/km. While AFVs account for almost 100% of the market
below 80g/km, by the time the 95g/km level is reached AFVs represent only 24% of the market as ICEs pertain at this level. The lowest emitting diesel car in 2015 was the Peugeot 208, at 79g/km, while the lowest emitting petrol car was the Suzuki Celerio at 84g/km.
The registrations of top selling brands of AFVs are detailed in Chart 13. These fi ve manufacturers represent 83.1% of the AFV market. For Toyota, AFVs accounted for 26.5% of their total new car registrations in 2015, while for Lexus the share was 97% and Mitsubishi over 50%. Chart 14 (see next page)shows the top fi ve selling ULEV brands. These fi ve brands account for 82.5% of the ULEV market.
0
20,000
40,000
60,000
80,000
2010 2011 2012 2013 2014 2015
Num
ber
of r
egis
trat
ions
Petrol/electric hybrid Diesel/electric hybrid Other electric (plug-in hybrid/range-extender)
Hydrogen Pure electric
0
20,000
40,000
60,000
80,000
100,000
120,000
140,000
0 10 30 50 70 90 Cu
mul
ativ
e re
gist
ratio
ns
CO2 g/km
Petrol Diesel AFV
0% 40% 80% 120%
0 10,000 20,000 30,000
Mercedes-Benz
Nissan
Mitsubishi
Lexus
Toyota
Share of own registrations
AFV registrations
AFV registrations AFV share
0.0%
0.5%
1.0%
1.5%
2.0%
2.5%
3.0%
0%
30%
60%
90%
2000 2004 2008 2012 2015
Mar
ket s
hare
– A
FVs
Mar
ket s
hare
– p
etro
l/di
esel
Diesel Petrol
AFV (RH axis)
CHART 11 | AFV REGISTRATIONS
CHART 12 | <=95G/KM MARKET BY FUEL TYPE
CHART 13 | TOP FIVE BEST SELLING AFV BRANDS IN 2015
CHART 10 | MARKET SHARE BY FUEL TYPE
DEF506 SMMT New Car Co2 Report 2016 v2.indd 11 04/03/2016 08:36

THE SOCIETY OF MOTOR MANUFACTURERS AND TRADERSPage 12 | New Car CO2 Report 2016
MARKET TRENDS AND CO₂ PERFORMANCE
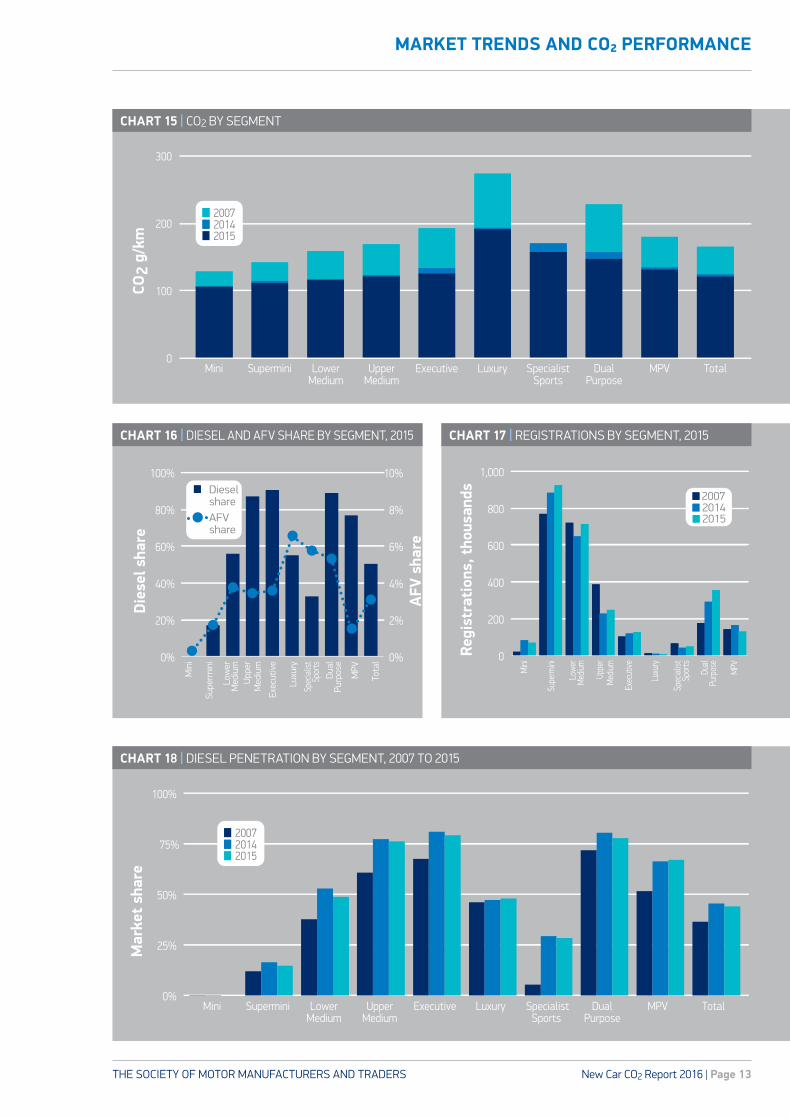
Diesel cars were, on a sales weighted average, 2.2% lower emitting than petrol cars in 2015, although on a like-for-like basis they can be up to 20% lower emitting. Table 2 identifi es the best selling model in each segment and shows the lowest diesel and petrol model of each best seller. Although these models may not always have equivalent power (or specifi cations), the diesels were lower emitting in each case and on average by 18%. The closeness of the average petrol and diesel CO2 performance refl ects diesel engines largely being fi tted into larger vehicles. It is notable that in the Mini segment no diesel variants are available given their generally higher cost and larger physical engine size/capacity
requirements compared with petrol-fuelled models. These infl uences also play out in the Supermini segment, where diesel share was a modest 16.2% in 2015. Diesel penetration was more than 80% in the Upper Medium, Executive and Dual Purpose segments (Chart 16).
CO2 PERFORMANCE BY SEGMENT TYPEAll segments have seen average CO2 emissions fall by 15% or more since 2007. Over this period, the Executive, Luxury Saloon, Specialist Sports and Dual Purpose segments have seen emissions drop by 30-35%, refl ecting their higher starting point for emissions giving them scope for greater percentage gains, dieselisation and also generally higher than average AFV penetration (Chart 16).
The overall progress in new car CO2 emissions was supported by the growth in the Supermini and Mini segments since 2007, (Chart 17). In 2015, however, these segments lost market share aft er stronger growth in the Lower Medium and Upper Medium segments – both of which grew by around 10% in volume terms in 2015. The Dual Purpose segment again saw strong growth, up by over 20% in 2015. This shift in vehicle type may refl ect the timing of model replacement patterns, but is also refl ective of on-going economic growth creating greater confi dence amongst consumers to demand larger and higher specifi cation models. The growth in 2015 being focused on the fl eet market, which also has a preference for larger cars, may also have infl uenced market transformation and the easing in the rate of progress in average CO2 performance. Likewise the drop in fuel prices in 2015 may have diminished consumer demand for high effi ciency products. n
0% 20% 40% 60%
0 5,000 10,000 15,000
Renault
BMW
Nissan
Toyota
Mitsubishi
Share of own registrations
ULEV registrations
ULEV registrations ULEV share
TABLE 2 | SEGMENT BEST SELLER, 2015, INCLUDING LOWEST DIESEL AND PETROL MODEL’S CO2 PERFORMANCE
Market Segment Model Registrations in 2015 Lowest diesel CO2 Lowest petrol CO2 Diff erence
A MINI HYUNDAI i10 23,846 n/a 98 n/a
B SUPERMINI FORD FIESTA 133,434 82 99 -17.2%
C LOWER MEDIUM FORD FOCUS 83,816 88 99 -11.1%
D UPPER MEDIUM BMW 3 SERIES 36,728 99 122 -18.9%
E EXECUTIVE MERCEDES C CLASS 41,821 101 123 -17.9%
F LUXURY SALOON MERCEDES S CLASS 3,063 141 199 -29.1%
G SPECIALIST SPORTS AUDI TT 9,145 110 137 -19.7%
H DUAL PURPOSE FORD KUGA 32,936 122 143 -14.7%
I MULTI PURPOSE CITROEN C4 PICASSO 17,599 98 115 -14.8%
CHART 14 | TOP FIVE BEST SELLING ULEV BRANDS
DEF506 SMMT New Car Co2 Report 2016 v2.indd 12 04/03/2016 08:36
THE SOCIETY OF MOTOR MANUFACTURERS AND TRADERS New Car CO2 Report 2016 | Page 13
MARKET TRENDS AND CO₂ PERFORMANCE
0
100
200
300
Mini Supermini LowerMedium
UpperMedium
Executive Luxury SpecialistSports
DualPurpose
MPV Total
CO2
g/km
2007 2014 2015
0%
25%
50%
75%
100%
Mini Supermini LowerMedium
UpperMedium
Executive Luxury SpecialistSports
DualPurpose
MPV Total
2007 2014 2015
Mar
ket s
hare
CHART 15 | CO2 BY SEGMENT
CHART 18 | DIESEL PENETRATION BY SEGMENT, 2007 TO 2015
Min
i
Supe
rmin
i
Low
er M
ediu
mU
pper
M
ediu
m
Dua
l Pu
rpos
e
Exec
utiv
e
Luxu
ry
MPV
Tota
l0%
20%
40%
60%
80%
100%
0%
2%
4%
6%
8%
10%
Dies
el s
hare
Diesel share AFV share
AFV
sha
re
Spec
ialist
Sp
orts Mini
Supe
rmini
Lowe
r M
edium
Uppe
r M
edium Du
al
Purp
ose
Exec
utive
Luxu
ry
Spec
ialist
Sp
orts
MPV
0
200
400
600
800
1,000 Re
gist
rati
ons,
thou
sand
s
2014 2007
2015
CHART 16 | DIESEL AND AFV SHARE BY SEGMENT, 2015 CHART 17 | REGISTRATIONS BY SEGMENT, 2015
DEF506 SMMT New Car Co2 Report 2016 v2.indd 13 04/03/2016 08:36

THE SOCIETY OF MOTOR MANUFACTURERS AND TRADERSPage 14 | New Car CO2 Report 2016
CO₂ BASED TAXES AND HOW THESE MAY INFLUENCE EMISSIONS
ARRAY OF CO2 BASED TAXES IN PLAYThe UK has a number of tax initiatives in place to encourage consumers to consider lower CO2 emitting vehicles. Vehicle excise duty (VED), the vehicle circulation tax, has been CO2 based since 2001, while company car tax (CCT) has been CO2 based since 2002. Capital allowances are also CO2 based. The UK has the highest fuel duty in both absolute value and as proportion of total pump price in Europe, which also acts to encourage fuel efficient motoring. In addition, some local taxes – such as the London congestion charge and some parking permit charges are CO2 based.
VEHICLE EXCISE DUTY (VED)In 2009 VED was broadened out to the current 13 band system and in 2010 a differential first year rate was introduced. The current 2015-16 rates are presented in Table 3, below. Chart 19 shows how the market has shifted into the lower CO2 bands (highlighted by the movement from blue to green bars in the chart). In 2015 19.8% of the market was in band A, so paid no first year or standard rate, and 72.0% were in bands A-D and so paid nothing in the first year – this is up from 17.7% and 68.6% respectively in 2014, and 0% and 10.6% in 2007. In 2015 the average VED paid in the first year was £59 per vehicle (based on 2015/16 rates applied to 2015 market and with no AFV discount applied), down from £68 in 2014 and less than half the £131 in 2011. Given the amount of cars paying nothing in the first year, those drivers that actually do pay anything, paid on average £210 in 2015, on par with that paid each year between 2010 and 2014.
In Summer Budget 2015, the government announced changes to the VED, redistributing the 13 CO2 bands and introducing different rates from April 2017 – these are also presented in Table 3. These changes threaten the ability of industry and government to meet national carbon budgets and undermine the industry’s ability to achieve the 95g/km pan EU target, in particular by reducing the incentives for low and ultra-low emission vehicles (ULEVs). SMMT believes this sends an important and damaging signal to the marketplace. In addition, the standard rate of VED moving from a sliding scale based on CO2 emissions to a flat rate of £140 for all non-EVs removes the signal to opt for an ULEV and there is no incentive for the used car buyers to consider lower emitting vehicles. Further, the introduction of a £310 surcharge for five years for cars with a showroom price of more than £40,000 will curb demand for some of the innovative lowest emitting vehicles, such as hydrogen vehicles, as well as being administratively complex. It will also have a detrimental impact on some of the UK’s premium, luxury and specialist car manufacturers. To note, if the 2017 rates were applied to the 2015 market then the average vehicle would be subject to a £217 cost, over three and half times more than the average £59 cost they actually paid in 2015.
COMPANY CAR TAX (CCT)CCT plays an important role in the fleet purchaser’s decision making process when choosing a new company car. Running costs are already extremely important to business and CCT focuses the user’s attention on their own personal costs. In 2010, government made the welcome move to ensure zero CO2
TABLE 3 | CURRENT AND PROPOSED VED BANDS AND RATES
Band Current band 2015 (CO2g/km)
Current 1st year/standard rate* 2015 market share Proposed 2017 band
(CO2g/km)Proposed 1st year/
standard rate 2015 market share
A Up to 100 £0 / £0 19.8% 0 £0 / £0 0.4%
B 101-110 £0 / £20 19.9% 1-50 £10 / £140 0.7%
C 111-120 £0 / £30 18.5% 51-75 £25 / £140 0.2%
D 121-130 £0 / £110 13.7% 76-90 £100 / £140 2.6%
E 131-140 £130 / £130 10.4% 91-100 £120/ £140 15.9%
F 141-150 £145 / £145 6.1% 101-110 £140 / £140 19.9%
G 151-165 £180 / £180 6.0% 111-130 £160 / £140 32.3%
H 166-175 £295 / £205 1.9% 131-150 £200 / £140 16.4%
I 176-185 £350 / £225 1.6% 151-170 £500 / £140 7.0%
J 186-200 £490 / £265 0.6% 171-190 £800 / £140 2.7%
K 201-225 £640 / £290 0.9% 191-225 £1,200 / £140 1.3%
L 226-255 £870 / £490 0.3% 226-255 £1,700 / £140 0.3%
M Over 255 £1,100 / £505 0.3% Over 255 £2,000 / £140 0.3%
* AFVs pay £10 less
DEF506 SMMT New Car Co2 Report 2016 v2.indd 14 04/03/2016 08:36

THE SOCIETY OF MOTOR MANUFACTURERS AND TRADERS New Car CO2 Report 2016 | Page 15
CO₂ BASED TAXES AND HOW THESE MAY INFLUENCE EMISSIONS
emitting cars are subject to a 0% rate for five years. However, the incentives have diminished and in 2015/16 zero emitters face a 5% rate of the car list price as basis for CCT, which will rise to 16% by 2019-20, with corresponding rate rises for higher emitting vehicles, as shown in Table 4. SMMT believes CCT should continue to incentivise ULEVs, as fleets make up a large proportion of the new car market. In the 2015 Spending Review the government also reversed its previous decision to remove the 3% diesel surcharge in 2016, and so diesel car users will continue to face a steeper CCT level than petrol cars.
CAPITAL ALLOWANCES (CA) Capital allowances (CA) are a cost relief for business investment against taxable profits and have been referenced against a car’s CO2 emissions since 2009, with a change in 2013. They are a valuable incentive to persuade fleet buyers to consider ULEVs. A 100% first year allowance is available if the car emits 95g/km CO2 or below, then 18% if CO2 emissions are between 96-130g/km and
8% for those over 130/km. In 2018 the rates are due to change, with the 95g/km threshold to be cut to 75g/km.
THE PLUG-IN CAR GRANT (PICG)To encourage the take-up of pure electric, plug-in or hydrogen vehicles, the government introduced the PiCG scheme to tackle one of the biggest barriers for consumers, the initial high cost of these emerging technologies. Since 1 January 2011 government has given an incentive of 35% - up to £5,000, off the full purchase price (list, plus VED and VAT) of a vehicle that qualifies (see www.gov.uk/plug-in-car-van-grants/eligibility). By the end of 2015 some 25,000 cars have been bought through the scheme. In 2015 the government announced the grant would continue until at least the end of March 2018, although from 1 March 2016 the incentive will be lower (£4,500 for vehicles with CO2 emissions of less than 50g/km and a zero emission range of at least 70 miles, or £2,500 for those lower zero emission range or CO2 to 75g/km – those eligible for the £2,500 incentive would also need a list price below £60,000).
TABLE 4 | CCT REGIME 2013 TO 2019 (SOURCE: BUDGET STATEMENTS TO MARCH 2015)
C02 bands (g/km) 2014-15 2015-16 2016-17 2017-18 2018-19 2019-20
0 0% 5% 7% 9% 13% 16%
<=50 5% 5% 7% 9% 13% 16%
51-75 5% 9% 13% 15% 16% 19%
76-94 11% 13% 17% 17% 19% 22%
95-99 12% 14% 18% 18% 20% 23%
100-104 13% 15% 19% 19% 21% 24%
Then 1% rise for each 5g/km band to 37% (35% in 2014-15)
0% 10% 20% 30% 40% 50% 60% 70% 80% 90% 100%
2000
2007
2014
2015
Market share
A (Upto 100) B (101-110) C (111-120) D (121-130) E (131-140) F (141-150) G (151-165) H (166-175) I (176-185) J (186-200) K (201-225) L (226-255) M (Over 255)
CHART 19 | NEW CAR MARKET BY VED BANDS
DEF506 SMMT New Car Co2 Report 2016 v2.indd 15 04/03/2016 08:36

THE SOCIETY OF MOTOR MANUFACTURERS AND TRADERSPage 16 | New Car CO2 Report 2016
CO₂ BASED TAXES AND HOW THESE MAY INFLUENCE EMISSIONS
GO ULTRA LOW (GUL)Government and several vehicle manufacturers have also set up the GUL campaign to promote ULEVs that can also deliver a minimum of 10 miles of zero-emissions driving. In 2015 Mitsubishi joined Audi, BMW, Nissan, Renault, Toyota and VW as a GUL partner. Kia also joined in 2016. GUL has an informative website (www.goultralow.com) and undertakes media campaigns to encourage market transformation.
LONDON CONGESTION CHARGE (CC)Numerous local measures may also be in place to encourage lower emitting cars, such as parking permits or work-place parking measures, government or local authority buying standards. Probably the most well known is the London CC. ULEVs, vehicles emitting <75g/km of CO2, are exempt from the £11.50 per day charge.
UK APPROACHES EU AVERAGE NEW CAR CO2 EMISSIONS, AFTER BETTERING RATE OF PROGRESS AGAINThe UK once again outpaced the rate of improvement in the EU in 2014 (latest figures, source: European Environment Agency). Average new car emissions in the EU fell by 2.8% in 2014 to 123.4g/km, compared with the 2.9% drop in the UK to 124.6g/km. The UK was within 1% of the EU average in 2014, compared with 7.7% in 2000.
The UK’s higher average emissions are the result of the different market structure to other nations, reflecting higher than average GDP per head and so higher demand for larger and more powerful vehicles, as well as tax measures resulting in lower diesel penetration in the UK. The UK does, however, boast the second largest new electric vehicle market in Europe in 2015, after a 97% rise in volumes (source ACEA, www.acea.be). The UK was 13th of 28 in 2014, with the range depicted in Chart 21. The Netherlands (107.3g/km) had the lowest average new car CO2 emissions for a second successive year, after remarkable progress since 2007, when it was 17th of 27 nations. This followed the introduction of CO2 based taxes and large incentives for electrically powered vehicles, which saw the Netherlands have the largest market for EVs for a second
successive year in 2015, following a 193% rise in volumes. The EU’s biggest market, Germany, had average new CO2 emissions 6.3% above the UK’s, at 132.5g/km.
BALANCING CO2 AND AIR QUALITY MEASURES Encouraging transformation of the market to lower CO2 emitting vehicles has been a key pubic policy focus and industry priority for several years. Alongside this objective, regulation through Euro standards has driven air quality improvements. It is important that policy and measures be designed to ensure both CO2 and air quality ambitions are considered and adverse impacts on either are avoided. Industry has spent billions transforming diesel engine emissions technology. New diesels are vastly improved and approaching parity to petrol on emissions that affect air quality under the latest Euro-6 standards.
Diesel vehicles have played an important role in reducing average new car CO2 emissions, with emissions up to 20% lower than an equivalent power petrol car. Achieving the 95g/km target will continue to rely on diesel technologies, given the majority of the market will still be traditional ICE engined cars by 2021. Any measures therefore that penalise diesel cars could undermine achieving future emission targets. SMMT always looks for a technology neutral approach towards incentives and penalties to encourage the uptake of the latest technologies. SMMT also opposes local measures which could undermine diesel vehicles and send confusing and conflicting messages to consumers. We would also note that the UK has a strong track record in producing diesel engines, and measures which undermine this important section of the market could have a detrimental impact on the UK’s wider economic performance.
The market for diesel cars grew in 2015, although market share slipped back for the first time in three years. While the shift to AFVs may have contributed towards this, they did not reflect the overall loss of market share. It remains to be seen if this represents a natural fluctuation in market demand or part of a larger shift away from diesels which may undermine achieving the CO2 reductions required ahead. n
Italy
100
110
120
130
140
Net
herla
nds
Gree
ce
Port
ugal
D
enm
ark
Fran
ce
Mal
ta
Croa
tia
Irela
nd
Spai
n Be
lgui
m
Slov
enia
EU
Ave
rage
UK
Fi
nlan
d Ro
man
ia
Aust
ria
Luxe
mbo
urg
Cypr
us
Swed
en
Czec
h Re
p Sl
ovak
ia
Germ
any
Pola
nd
Hun
gary
Li
thun
ia
Bulg
aria
La
tvia
Es
toni
a
CO2
g/km
120
130
140
150
160
170
180
190
2000 2003 2005 2007 2009 2011 2013 2015
CO2
g/km
Year
UK EU
CHART 21 | AVERAGE NEW CAR CO2, BY COUNTRY, 2014
CHART 20 | UK VS EU NEW CAR CO2 PERFORMANCE
DEF506 SMMT New Car Co2 Report 2016 v2.indd 16 04/03/2016 08:36
THE SOCIETY OF MOTOR MANUFACTURERS AND TRADERS New Car CO2 Report 2016 | Page 17
LIGHT COMMERCIAL VEHICLE (LCV TO 3.5 TONNES) CO₂ PERFORMANCE
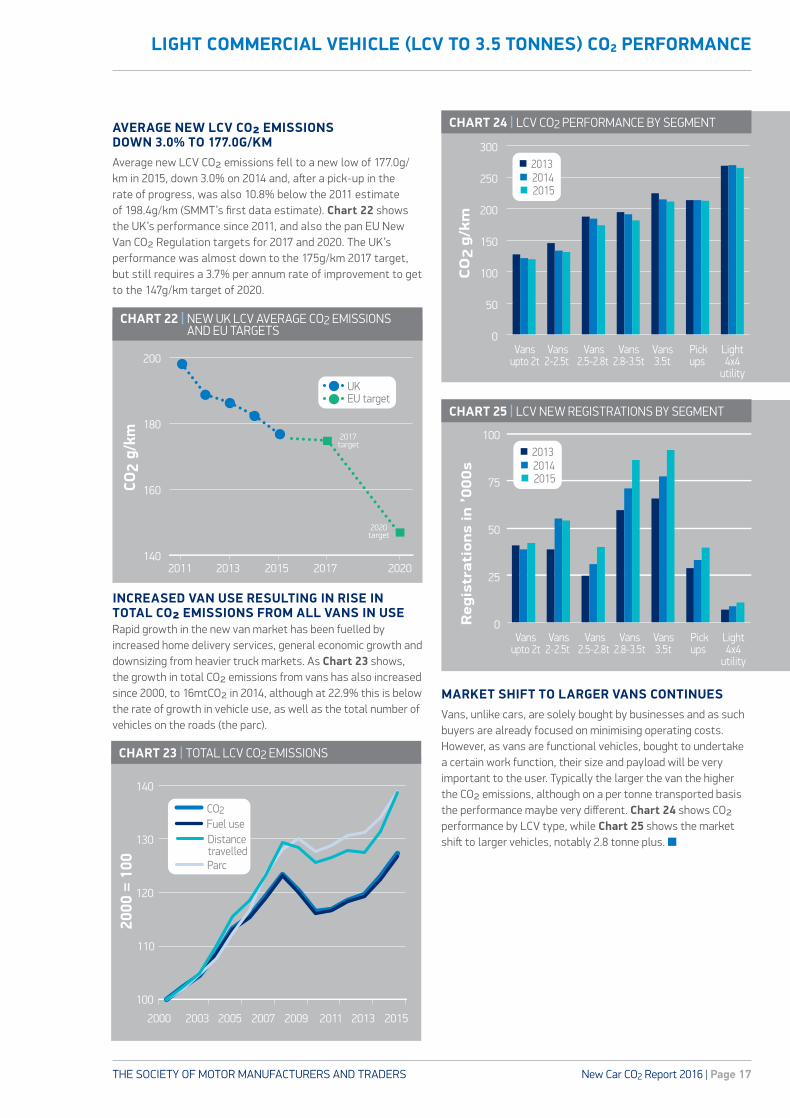
AVERAGE NEW LCV CO2 EMISSIONS DOWN 3.0% TO 177.0G/KMAverage new LCV CO2 emissions fell to a new low of 177.0g/km in 2015, down 3.0% on 2014 and, after a pick-up in the rate of progress, was also 10.8% below the 2011 estimate of 198.4g/km (SMMT’s first data estimate). Chart 22 shows the UK’s performance since 2011, and also the pan EU New Van CO2 Regulation targets for 2017 and 2020. The UK’s performance was almost down to the 175g/km 2017 target, but still requires a 3.7% per annum rate of improvement to get to the 147g/km target of 2020.
INCREASED VAN USE RESULTING IN RISE IN TOTAL CO2 EMISSIONS FROM ALL VANS IN USERapid growth in the new van market has been fuelled by increased home delivery services, general economic growth and downsizing from heavier truck markets. As Chart 23 shows, the growth in total CO2 emissions from vans has also increased since 2000, to 16mtCO2 in 2014, although at 22.9% this is below the rate of growth in vehicle use, as well as the total number of vehicles on the roads (the parc).
MARKET SHIFT TO LARGER VANS CONTINUESVans, unlike cars, are solely bought by businesses and as such buyers are already focused on minimising operating costs. However, as vans are functional vehicles, bought to undertake a certain work function, their size and payload will be very important to the user. Typically the larger the van the higher the CO2 emissions, although on a per tonne transported basis the performance maybe very different. Chart 24 shows CO2 performance by LCV type, while Chart 25 shows the market shift to larger vehicles, notably 2.8 tonne plus. n
CO2
g/km
2017 target
2020 target
140
160
180
200
2011 2013 2015 2017 2020
UK EU target
0
50
100
150
200
250
300
Vansupto 2t
Vans2-2.5t
Vans2.5-2.8t
Vans2.8-3.5t
Vans3.5t
Pickups
Light 4x4
utility
CO
2 g/
km
2013 2014 2015
100
110
120
130
140
2000 2003 2005 2007 2009 2011 2013 2015
2000
= 1
00
CO2 Fuel use
Parc
Distance travelled
0
25
50
75
100
Vansupto 2t
Vans2-2.5t
Vans2.5-2.8t
Vans2.8-3.5t
Vans3.5t
Pickups
Light 4x4
utility
2013 2014 2015
Reg
istr
atio
ns in
’00
0s
CHART 22 | NEW UK LCV AVERAGE CO2 EMISSIONS AND EU TARGETS
CHART 24 | LCV CO2 PERFORMANCE BY SEGMENT
CHART 23 | TOTAL LCV CO2 EMISSIONS
CHART 25 | LCV NEW REGISTRATIONS BY SEGMENT
DEF506 SMMT New Car Co2 Report 2016 v2.indd 17 04/03/2016 08:36

THE SOCIETY OF MOTOR MANUFACTURERS AND TRADERSPage 18 | New Car CO2 Report 2016
OUTLOOK FOR NEW CAR CO₂ EMISSIONS
UK HAS LEGALLY BINDING NATIONAL CO2 TARGETS – 80% REDUCTION BY 2050The UK’s Climate Change Act binds the government to reduce national CO2 emissions by 80% by 2050, from a 1990 basis. The Committee on Climate Change (CCC) develops five-year carbon budgets, which UK government then agrees and gives legal force. The first carbon budget (2008-12) was met and by 2014 emissions were 36% below 1990 levels. Therefore we are on track to meet the second and third (2013–17 and 2018–22) carbon budgets. The fourth carbon budget (2023-27) caps emissions at 52% below 1990 levels. The CCC has recommended that the fifth carbon budget (2028-32) limits emissions to 57% below 1990 levels and the government must legislate for it by June 2016.
EU NEW CAR CO2 REGULATION TO DRIVE TECHNOLOGY CHANGE – POST 2020 TARGETS TO BE FORMULATEDAs part of the EU’s target to cut greenhouse gases (GHG) by 20% by 2020 (from 1990 levels) the New Car CO2 Regulation set a target for the EU new car fleet to be 95g/km in 2021. This would require a 4.8% rate of improvement per annum if the UK were to meet the pan-EU new car target (which it is not legally bound to achieve).
The European Commission is committed to bring forward a post-2020 CO2 regime proposal by Q4 2016/Q1 2017. This is expected to be a continuation of the current pan European sales weighted CO2 g/km target, although it will likely be based on the new WLTP test cycle, which is to be introduced from 2017. However, different options could exist, for example a pathway based on numerous metrics which might influence the uptake of EVs or planned CO2 reductions for ICEs and defined
targets for EV uptake. The Commission is expected to have agreed targets, and their form, by mid 2019.
TECHNOLOGY SHIFT, INCLUDING ELECTRIFICATION OF THE FLEETICEs will continue to play an important role in vehicle markets for many years to come. The lowest conventional ICE is currently emitting 79g/km. However, the rate of progress will be technically limited, especially if reasonable costs are to be applied. The outlook therefore for uptake of alternatively fuelled vehicles, principally plug-in and hydrogen-fuelled vehicles, will be very important.
The CCC’s Carbon Budget scenarios put the UK’s car (and van) parc close to zero carbon by 2050, with all new cars zero emitting by 2040. CCC suggest 60% of new cars will be zero capable vehicles by 2030 (of which 30% are pure EVs and the remaining 70% plug-in electric hybrids), and estimate 9% of new cars and vans will be plug-in by 2020. Not many forecasters provide such long term outlooks, with ACEA envisaging the market for electric cars to be 2-8% by 2020. The CCC’s full recommendations for road transport can be found at www.theccc.org.uk/charts-data/ukemissions-by-sector/transport.
Given the current market for pure EVs represented 0.4% in 2015 (at less than 10,000 units) and 1.1% when including plug-in hybrids (less than 30,000 units), an enormous market transformation is required to deliver the 1.5–1.8 million plug-in vehicles each year to be 60% of the market in 2030 (assuming 2.5-3 million new car market). This suggests compound growth of over 30% per annum, which would see the 2030 market rise by over 400,000 units – which is equivalent to the current world production of zero capability vehicles.
2015 2016 2017 2018 2019 2020 2025 2030 2040 2050
EU New Car CO2 targets
UK National CO2 targets
CCC EV take up
NEDC WLTP NEW TYPE
RDE STEP 1 RDE STEP 2AIR QUALITY IN USE TEST
WLTP ALL CARSCO2 TEST CYCLE
-25%
-45%
9%
60%
100% 100%
-35%
-50%
-80%
-29%
1%
Pan-EU New Car CO2 reduction
target
UK New Car CO2
-33%
UK economy-wide CO2 reduction
Zero emission capable vehicle uptake
3
3
3
1
1
2
2CCC scenario for battery, plug-in and fuel cell vehicles Whole economy, from 1990 base From 2000 base
FIGURE 1 | OUTLOOK FOR TOTAL UK CO2, EV UPTAKE AND REGULATORY CHANGES
DEF506 SMMT New Car Co2 Report 2016 v2.indd 18 04/03/2016 08:36
THE SOCIETY OF MOTOR MANUFACTURERS AND TRADERS New Car CO2 Report 2016 | Page 19
OUTLOOK FOR NEW CAR CO₂ EMISSIONS
MARKET TRANSFORMATION REQUIRES A COMPREHENSIVE APPROACHDelivering such market transformation cannot be achieved by vehicle manufacturers alone. The comprehensive, or integrated, approach seeks to reduce CO2 emissions more effectively by drawing on a full spectrum of solutions, whether this relates to the vehicle itself, faster fleet renewal, intelligent transport systems (ITS), improving infrastructure, decarbonising fuels or altering driver behaviour. These changes will require all stakeholders; this includes industry, fuel suppliers, government and policy makers, media and consumers, to move forward in a common direction. To complement this, manufacturers are also pioneering alternative mobility concepts, such as car sharing, which can contribute to reducing emissions. Combined with the industry’s continuous improvements in vehicle technology, these measures have the potential to address CO2 emissions more successfully. ACEA has set out key recommendations for a comprehensive approach – see www.acea.be/publications/article/backgrounder-reducing-CO2-emissions-from-cars-and-vans.
GOVERNMENT SUPPORT FOR LOWER CO2 EMITTING VEHICLES AHEADThe COP21 (21st Conference of Parties) in December saw the Zero Emission Alliance, a collective of 14 national and sub-national governments, including UK government, Germany, Netherlands, Norway and California sign an agreement to make all new passenger vehicles zero emitting as fast as possible, and no later than by 2050. As identified earlier, the UK’s own targets are for all new cars and vans to have zero emitting capability by 2040.
In the short-term, the UK is committed to supporting the emerging EV market. The 2015 Spending Review confirmed £600 million government funding for ULEVs between 2015-16 and 2020-21. This includes support measures such as the Plug-in Car Grant to 2018. The grant provides a very visible, important and attractive up-front incentive to new car buyers and has helped lift the UK to be Europe’s second largest market for electric vehicles, after Netherlands (source: ACEA). Ensuring adequate longer-term fiscal and policy support is key to ensuring this sector gains a solid foothold in the marketplace. In addition, taxation measures, such as Vehicle Excise Duty and Company Car Tax, infrastructure and other such measures are also necessary to ensure consumers see these vehicles as relevant and that they become the norm in the marketplace.
As outlined earlier in this report, industry has concerns that forthcoming change to VED and CCT regimes, will diminish the incentive for plug-in electric vehicles, and also remove the incentive for used car buyers to purchase lower emitting vehicles. ULEVs require long-term support and signals to encourage market transformation and it is a matter for further debate to understand when the tipping points are for these markets to be established and capable of growing without support.
SMMT welcomes government’s on-going commitment to support the manufacturer of low-carbon technologies in the UK. Projects such as the Advanced Propulsion Centre help foster
innovation, investment and commercialisation of lower carbon technologies here in Britain. Connected and autonomous vehicles can also bring CO2 benefits and further enhance the shift to zero emission vehicles. Government has also been supportive of the push to these technologically advanced vehicles.
BALANCING AIR QUALITY AND CO2 PERFORMANCETypically the less fuel used, the lower both CO2 and other pollutant emissions. The move to ULEVs and ultimately zero emission vehicles can help achieve this. However, sometimes measures to improve air quality can increase CO2, and vice-versa, and so stakeholders should look to ensure a balanced approach is taken. In particular, industry is concerned that short-term measures to curb diesel use, could undermine achieving CO2 targets.
Collective, considered and unified action by stakeholders can ensure the UK motor industry is at the heart of delivering on all fronts, achieving meaningful market transformation of the whole fleet to deliver both air quality and CO2 benefits, whilst promoting economic growth. n
DEF506 SMMT New Car Co2 Report 2016 v2.indd 19 04/03/2016 08:36

THE SOCIETY OF MOTOR MANUFACTURERS AND TRADERS71 Great Peter Street, London, SW1P 2BNTel: +44 (0)20 7235 7000E-mail: [email protected]
:@SMMT :SMMT
www.smmt.co.uk
SMMT, the ‘S’ symbol and the ‘Driving the motor industry’ brandline are registered trademarks of SMMT Ltd
DisclaimerThis publication contains general information and, although SMMT endeavours to ensure that the content
is accurate and up-to-date at the date of publication, no representation or warranty, express or implied,
is made as to its accuracy or completeness and therefore the information in this publication should not be
relied upon. Readers should always seek appropriate advice from a suitably qualifi ed expert before taking,
or refraining from taking, any action. The contents of this publication should not be construed as advice or
guidance and SMMT disclaims liability for any loss, howsoever caused, arising directly or indirectly from
reliance on the information in this publication.
Printed in a sustainable manner, using FSC® certifi ed paper from responsibly managed forests. The paper mill and printer are ISO14001 Environmental Management certifi ed and the printer is based within 10 miles of SMMT, reducing the carbon impact of transporting this printed product. The booklet can be recycled aft er use.
DEF506 SMMT New Car Co2 Report 2016 v2.indd 20 04/03/2016 08:36