New biobased non-ionic hyperbranched polymers as ... · 1 New biobased non-ionic hyperbranched...
18
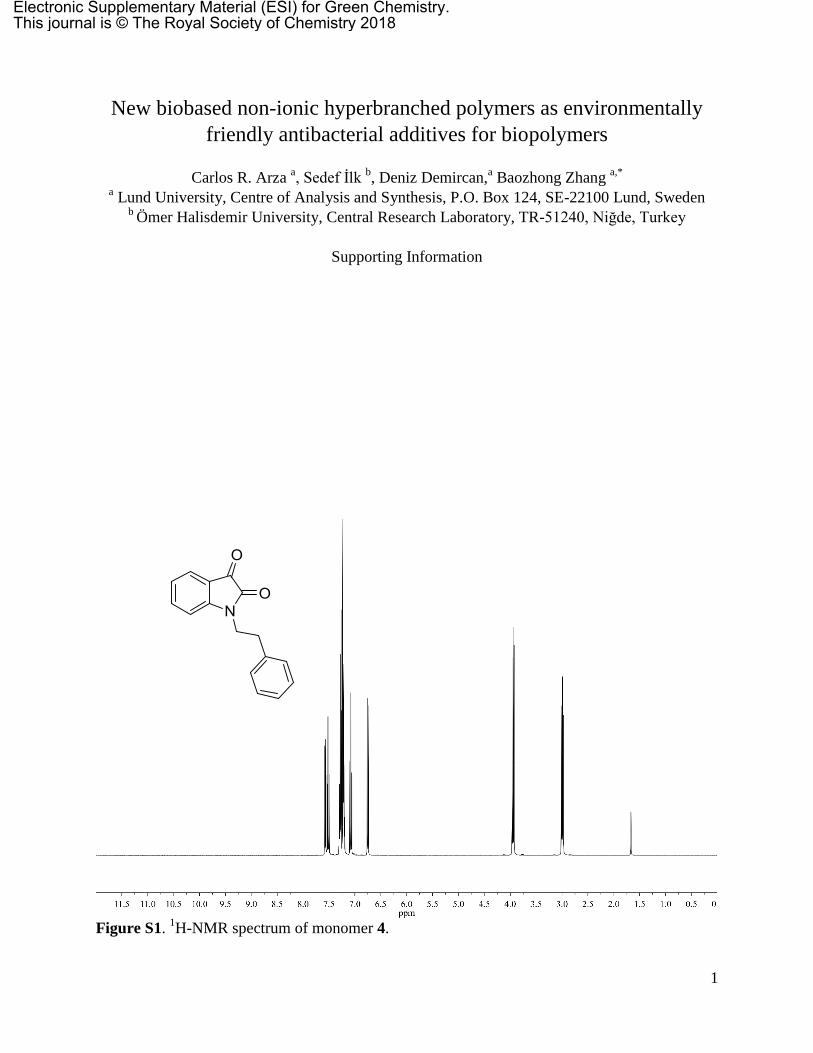
1 New biobased non-ionic hyperbranched polymers as environmentally friendly antibacterial additives for biopolymers Carlos R. Arza a , Sedef İlk b , Deniz Demircan, a Baozhong Zhang a,* a Lund University, Centre of Analysis and Synthesis, P.O. Box 124, SE-22100 Lund, Sweden b Ömer Halisdemir University, Central Research Laboratory, TR-51240, Niğde, Turkey Supporting Information Figure S1. 1 H-NMR spectrum of monomer 4. Electronic Supplementary Material (ESI) for Green Chemistry. This journal is © The Royal Society of Chemistry 2018
Transcript of New biobased non-ionic hyperbranched polymers as ... · 1 New biobased non-ionic hyperbranched...
1
New biobased non-ionic hyperbranched polymers as environmentally
friendly antibacterial additives for biopolymers
Carlos R. Arza a, Sedef İlk
b, Deniz Demircan,
a Baozhong Zhang
a,*
a Lund University, Centre of Analysis and Synthesis, P.O. Box 124, SE-22100 Lund, Sweden
b Ömer Halisdemir University, Central Research Laboratory, TR-51240, Niğde, Turkey
Supporting Information
Figure S1. 1H-NMR spectrum of monomer 4.
Electronic Supplementary Material (ESI) for Green Chemistry.This journal is © The Royal Society of Chemistry 2018

2
Figure S2.
1H-NMR spectrum of model compound 7.
3
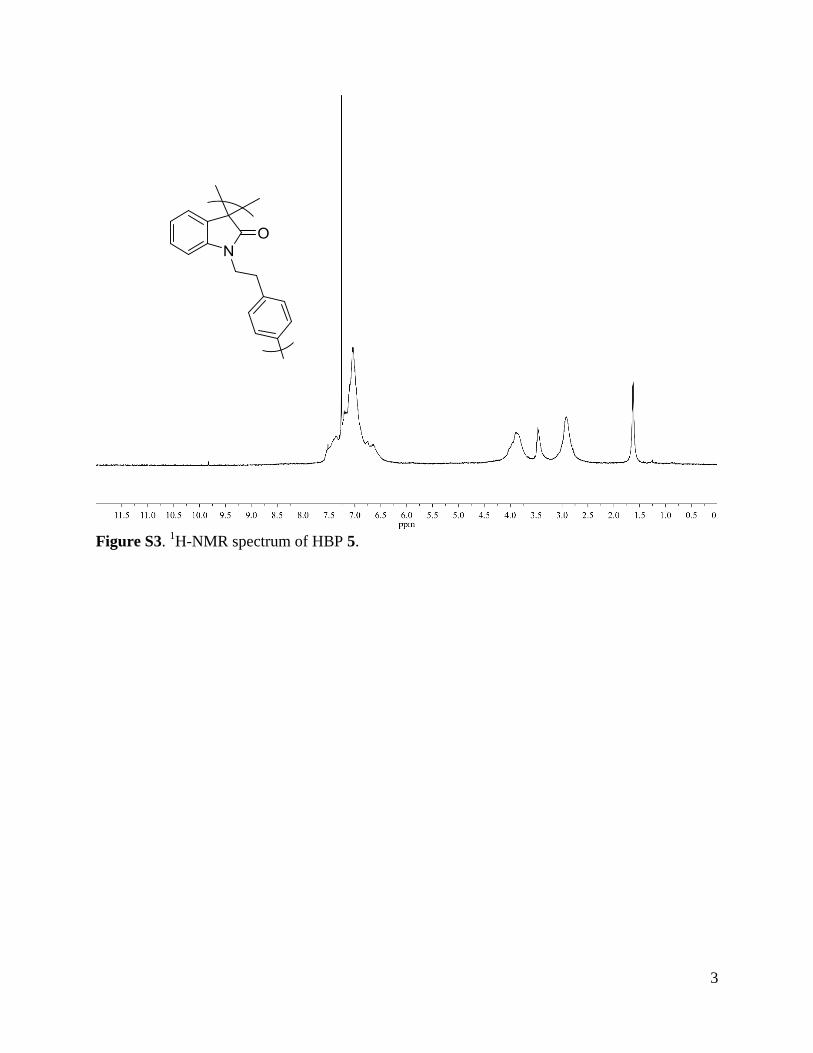
Figure S3.
1H-NMR spectrum of HBP 5.
4
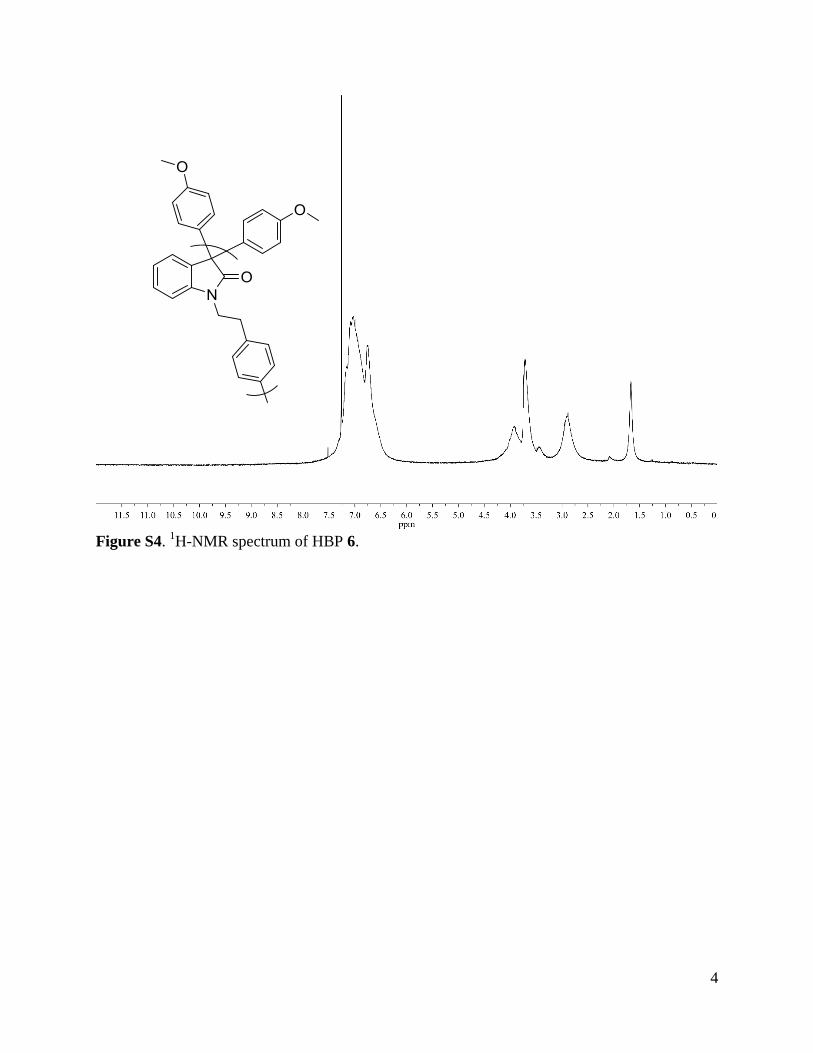
Figure S4.
1H-NMR spectrum of HBP 6.
5
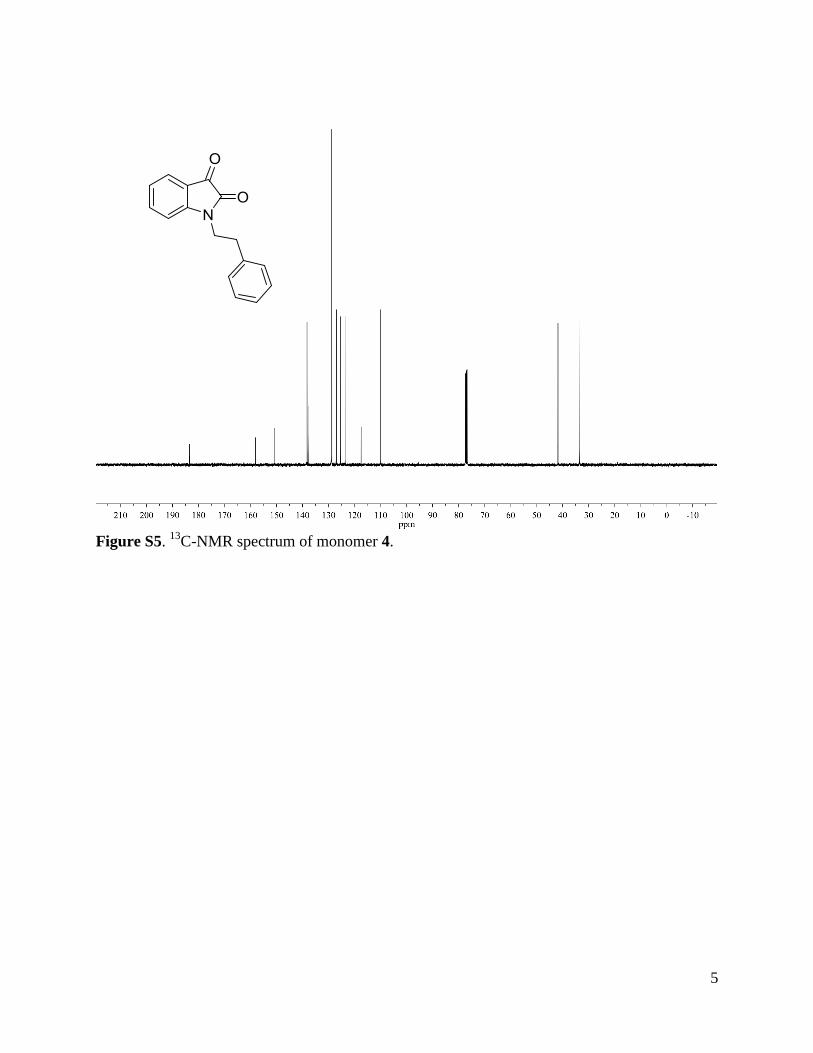
Figure S5.
13C-NMR spectrum of monomer 4.
6
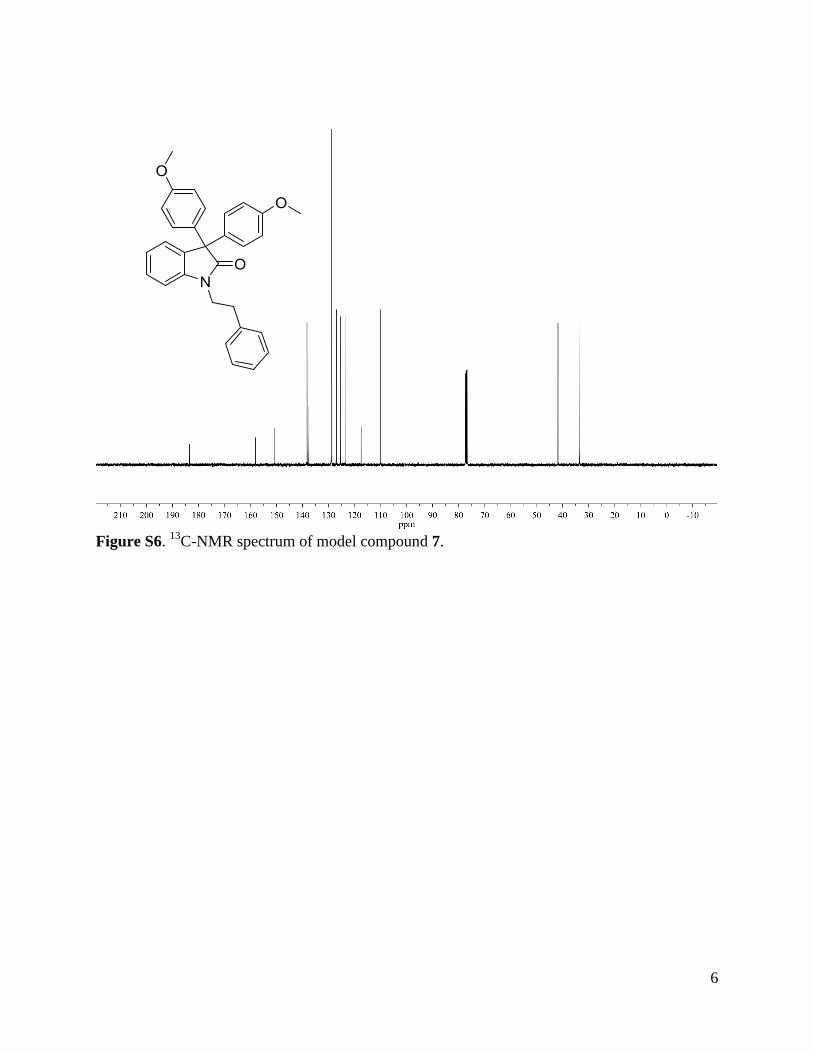
Figure S6.
13C-NMR spectrum of model compound 7.
7
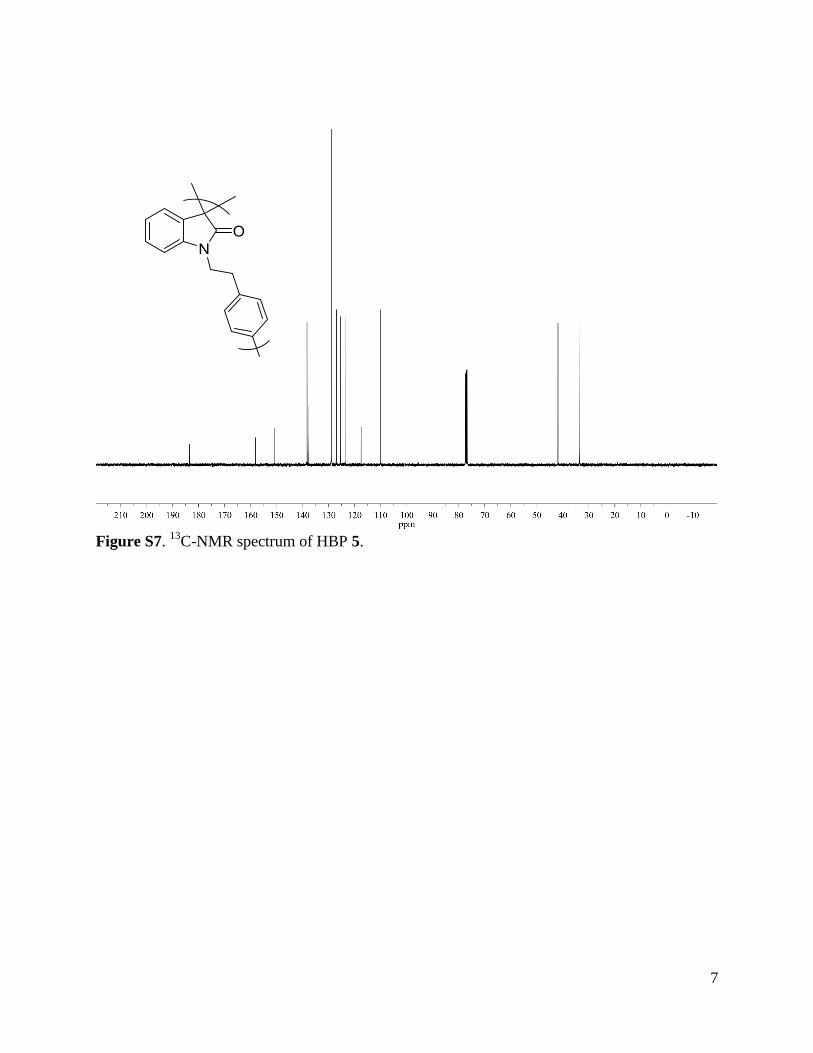
Figure S7.
13C-NMR spectrum of HBP 5.
8
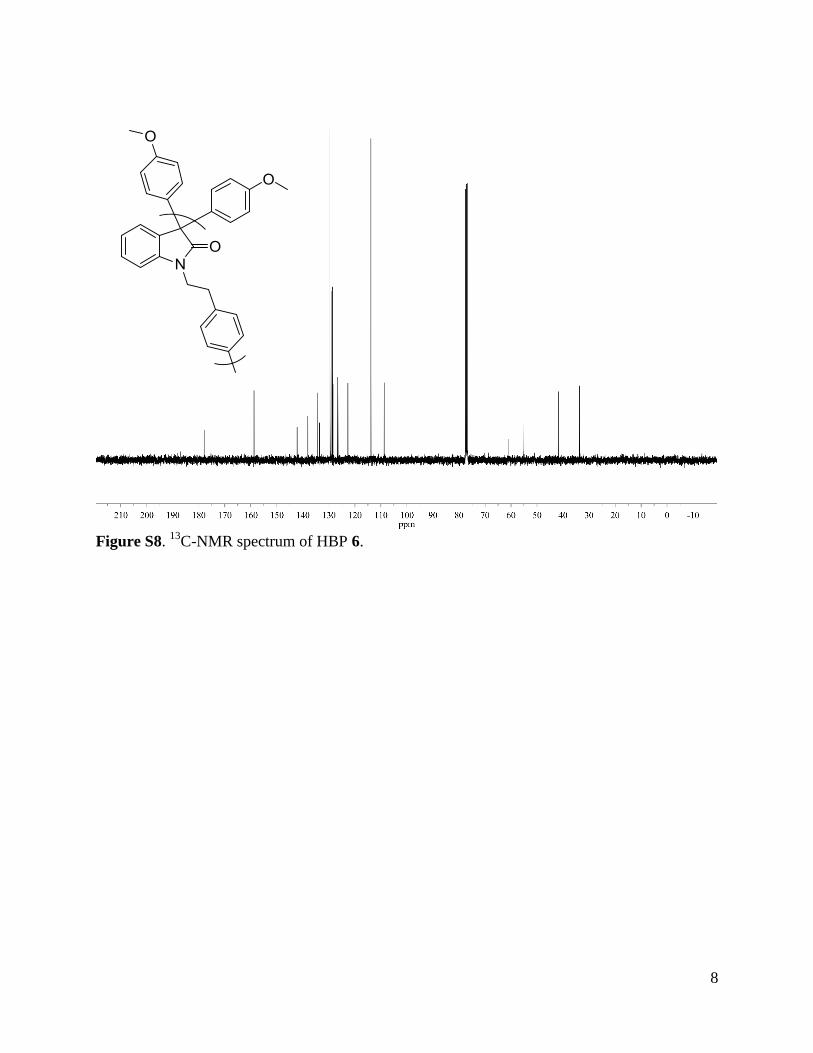
Figure S8.
13C-NMR spectrum of HBP 6.

9
Picture S9. Cellulose-based films after being merged in water for 5 days. From left: cellulose,
cellulose with 5% monomer 4, and cellulose with 5% HBP 5.
Figure S10. PHB-based films after being merged in water for 5 days, which was taken out and
air-dried for 1 day. From left: PHB, PHB with 5% monomer 4, and PHB with 5% HBP 5.
10
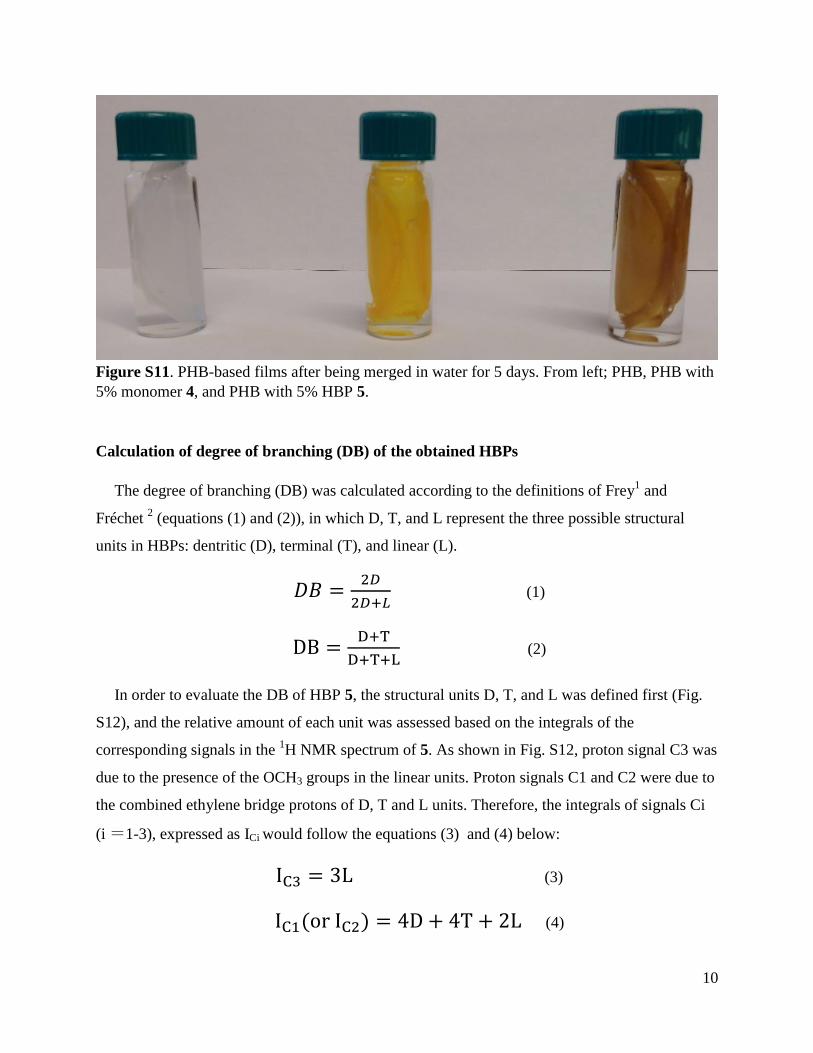
Figure S11. PHB-based films after being merged in water for 5 days. From left; PHB, PHB with
5% monomer 4, and PHB with 5% HBP 5.
Calculation of degree of branching (DB) of the obtained HBPs
The degree of branching (DB) was calculated according to the definitions of Frey1 and
Fréchet 2 (equations (1) and (2)), in which D, T, and L represent the three possible structural
units in HBPs: dentritic (D), terminal (T), and linear (L).
𝐷𝐵 =2𝐷
2𝐷+𝐿 (1)
DB =D+T
D+T+L (2)
In order to evaluate the DB of HBP 5, the structural units D, T, and L was defined first (Fig.
S12), and the relative amount of each unit was assessed based on the integrals of the
corresponding signals in the 1H NMR spectrum of 5. As shown in Fig. S12, proton signal C3 was
due to the presence of the OCH3 groups in the linear units. Proton signals C1 and C2 were due to
the combined ethylene bridge protons of D, T and L units. Therefore, the integrals of signals Ci
(i =1-3), expressed as ICi would follow the equations (3) and (4) below:
IC3 = 3L (3)
IC1(or IC2) = 4D + 4T + 2L (4)
11
Combining Equations (1) -(4), the DB could be calculated according to the following
expressions,
DB =3IC1−2IC3
3IC1+2IC3 (5)
DB =3IC2−2IC3
3IC2+2IC3 (6)
By applying the ICi values (shown in Fig. S12, as IC1 =0.97, IC2 =1.00, IC3 = 0.42), DB of
HBP 5 was calculated as 0.55 (according to Eq. 5), and 0.56 (according to Eq. 6). These two
values are effectively the same within the error range of such evaluations. We therefore used DB
=0.55 in the main text for our discussion.

12
Figure S12. Expanded1H-NMR of HBP 5 and the area integrations of signals C1, C2, and C3.
C1
C2
C3
C2
C1
C1C2
C2
C1
D
L
T
C2C1 C3
C1
C2
13
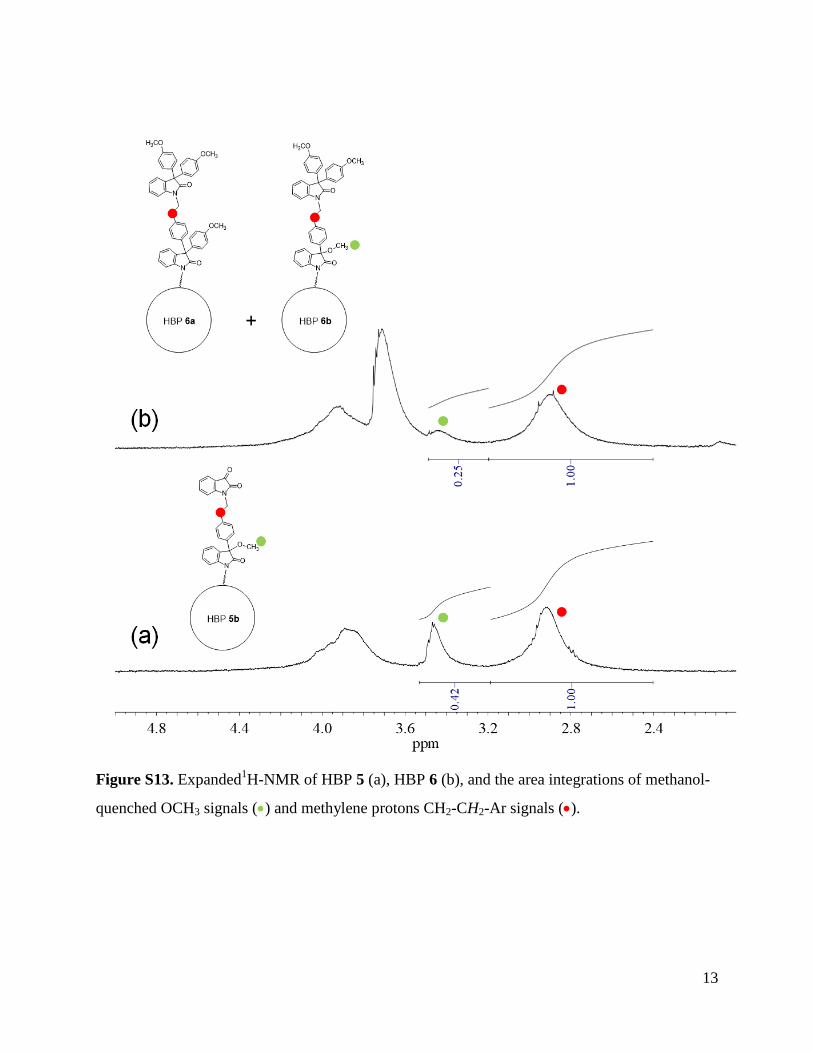
Figure S13. Expanded1H-NMR of HBP 5 (a), HBP 6 (b), and the area integrations of methanol-
quenched OCH3 signals () and methylene protons CH2-CH2-Ar signals ().
14
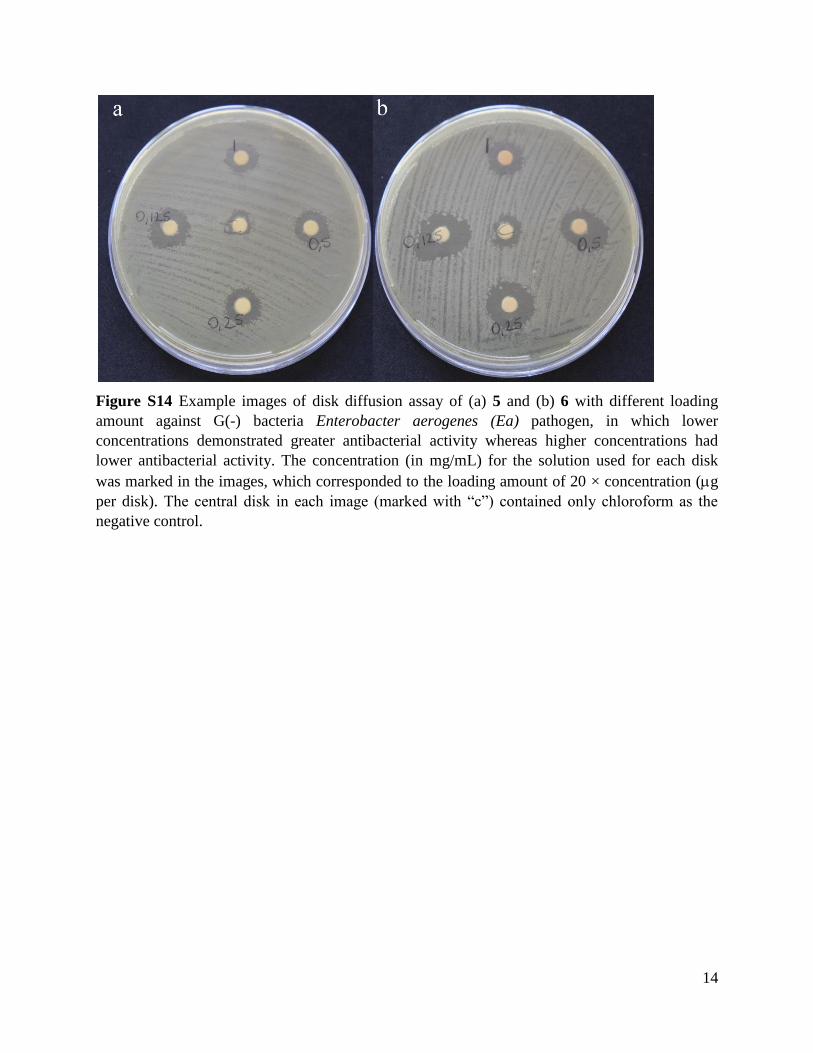
Figure S14 Example images of disk diffusion assay of (a) 5 and (b) 6 with different loading
amount against G(-) bacteria Enterobacter aerogenes (Ea) pathogen, in which lower
concentrations demonstrated greater antibacterial activity whereas higher concentrations had
lower antibacterial activity. The concentration (in mg/mL) for the solution used for each disk
was marked in the images, which corresponded to the loading amount of 20 × concentration (g
per disk). The central disk in each image (marked with “c”) contained only chloroform as the
negative control.
15
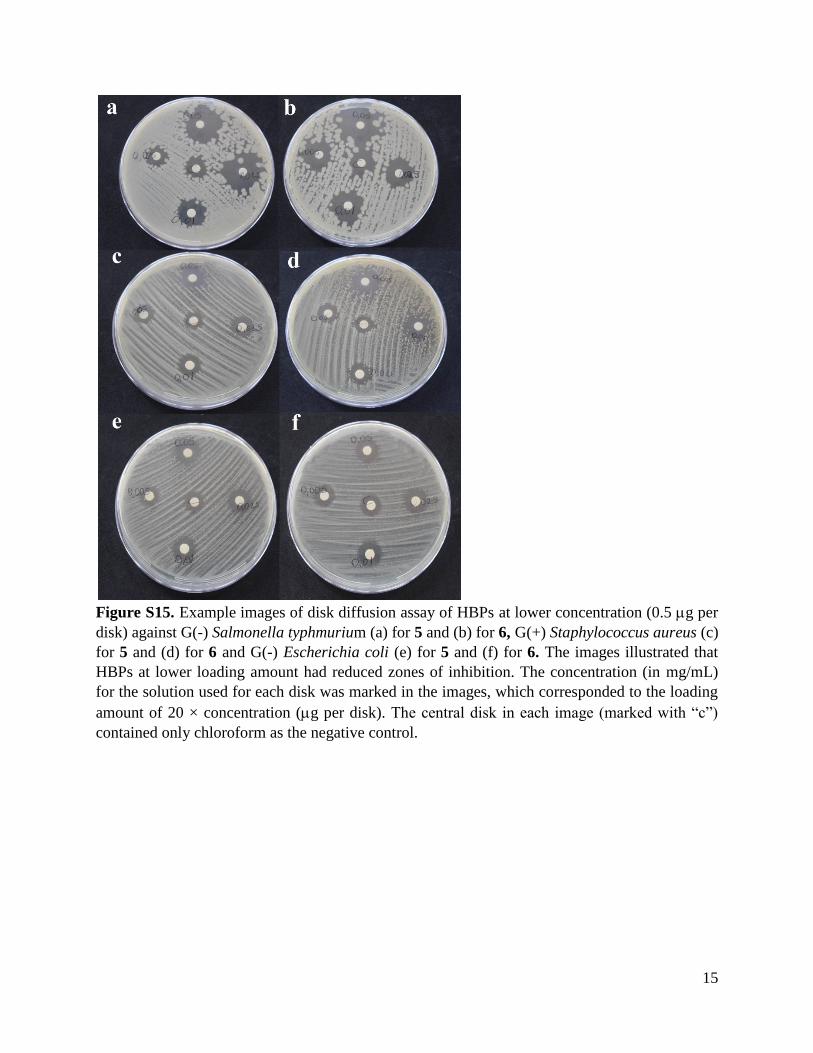
Figure S15. Example images of disk diffusion assay of HBPs at lower concentration (0.5 g per
disk) against G(-) Salmonella typhmurium (a) for 5 and (b) for 6, G(+) Staphylococcus aureus (c)
for 5 and (d) for 6 and G(-) Escherichia coli (e) for 5 and (f) for 6. The images illustrated that
HBPs at lower loading amount had reduced zones of inhibition. The concentration (in mg/mL)
for the solution used for each disk was marked in the images, which corresponded to the loading
amount of 20 × concentration (g per disk). The central disk in each image (marked with “c”)
contained only chloroform as the negative control.

16
Figure S16. (A) MALDI-TOF spectrum and (B) HRMS spectrum of HBP 5. Chemical structures
of identified oligomers of HBP 5 are shown in (C). Note that the possible isomers of the
presented identified oligomers are not shown.
17
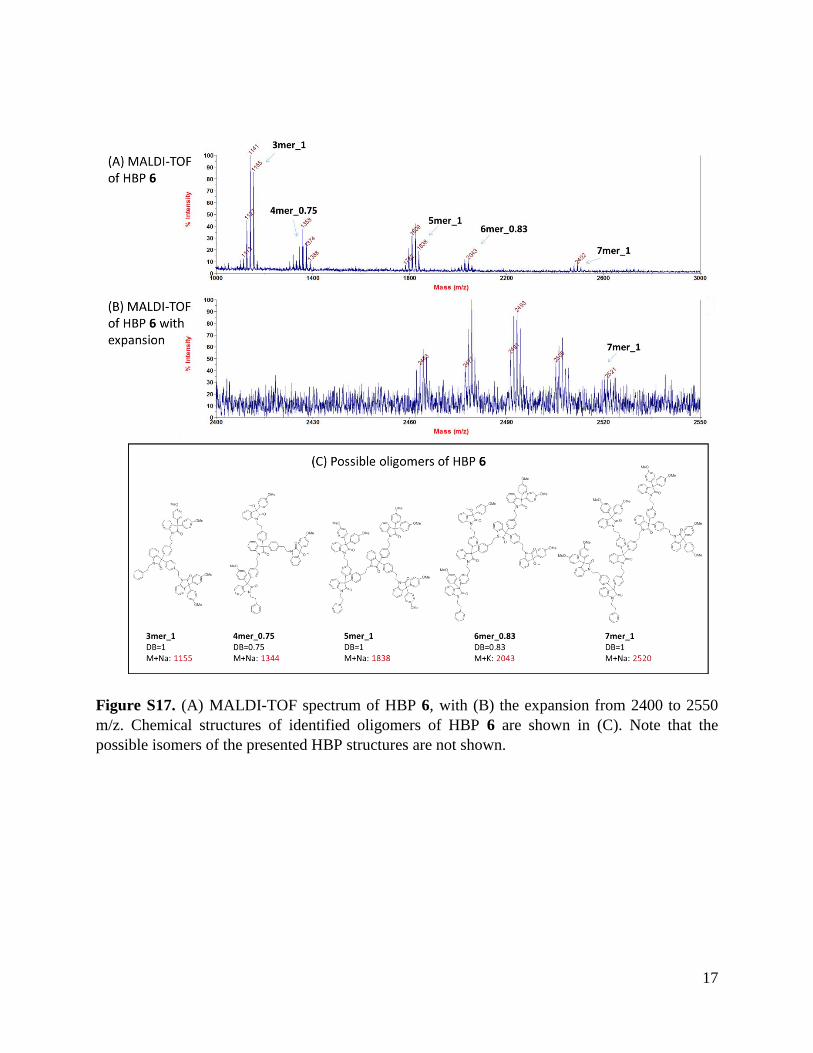
Figure S17. (A) MALDI-TOF spectrum of HBP 6, with (B) the expansion from 2400 to 2550
m/z. Chemical structures of identified oligomers of HBP 6 are shown in (C). Note that the
possible isomers of the presented HBP structures are not shown.
18
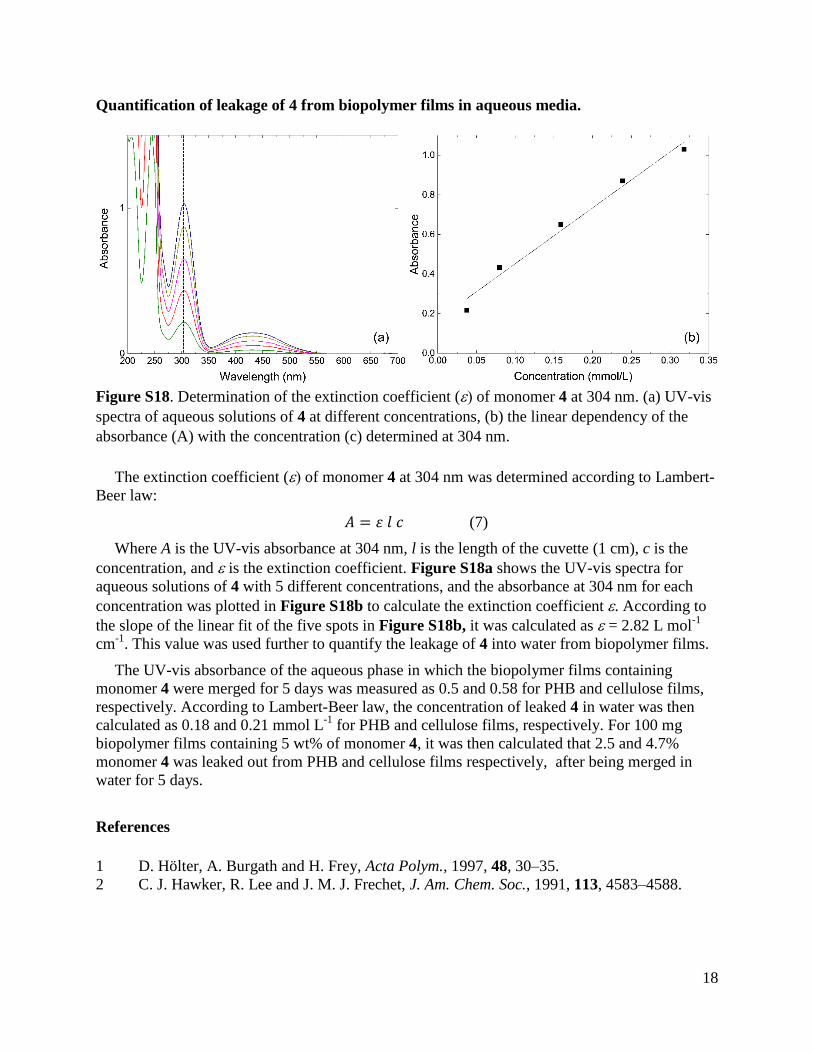
Quantification of leakage of 4 from biopolymer films in aqueous media.
Figure S18. Determination of the extinction coefficient (of monomer 4 at 304 nm. (a) UV-vis
spectra of aqueous solutions of 4 at different concentrations, (b) the linear dependency of the
absorbance (A) with the concentration (c) determined at 304 nm.
The extinction coefficient (of monomer 4 at 304 nm was determined according to Lambert-
Beer law:
𝐴 = 𝜀 𝑙 𝑐 (7)
Where A is the UV-vis absorbance at 304 nm, l is the length of the cuvette (1 cm), c is the
concentration, and is the extinction coefficient. Figure S18a shows the UV-vis spectra for
aqueous solutions of 4 with 5 different concentrations, and the absorbance at 304 nm for each
concentration was plotted in Figure S18b to calculate the extinction coefficient . According to
the slope of the linear fit of the five spots in Figure S18b, it was calculated as = 2.82 L mol-1
cm-1
. This value was used further to quantify the leakage of 4 into water from biopolymer films.
The UV-vis absorbance of the aqueous phase in which the biopolymer films containing
monomer 4 were merged for 5 days was measured as 0.5 and 0.58 for PHB and cellulose films,
respectively. According to Lambert-Beer law, the concentration of leaked 4 in water was then
calculated as 0.18 and 0.21 mmol L-1
for PHB and cellulose films, respectively. For 100 mg
biopolymer films containing 5 wt% of monomer 4, it was then calculated that 2.5 and 4.7%
monomer 4 was leaked out from PHB and cellulose films respectively, after being merged in
water for 5 days.
References
1 D. Hölter, A. Burgath and H. Frey, Acta Polym., 1997, 48, 30–35.
2 C. J. Hawker, R. Lee and J. M. J. Frechet, J. Am. Chem. Soc., 1991, 113, 4583–4588.