
New Approaches to Cardiovascular Risk...
64
New Approaches to Cardiovascular Risk Management Chris K. Guerin, M.D., F.A.C.E. IPP, CA-AACE Board of Directors, AACE Assistant Clinical Professor of Medicine at UCSD November 4 th , 2017
Transcript of New Approaches to Cardiovascular Risk...

New Approaches to Cardiovascular
Risk Management
Chris K. Guerin, M.D., F.A.C.E.
IPP, CA-AACE
Board of Directors, AACE
Assistant Clinical Professor of Medicine at
UCSD
November 4th, 2017

New Approaches to Cardiovascular Risk
Management
• Examine why focusing solely on LDL Cholesterol
is not enough
• Incorporate New Agents into a Treatment
Paradigm
• Be able to recommend Optimal Dietary Regimens
to lower Cardiovascular Risk
• Improve Evaluation of HTN and Rx goals
• Understand the effect of DM control on CV Risk

Evolution of the Lipid HypothesisP
ost-
mo
rte
m e
xa
ms
Fra
min
gham
sta
rts
Epid
em
iolo
gic
al stu
die
s
First
genera
tion c
linic
al stu
die
s
(WH
O, LR
C-C
PP
T)
HH
S)
Ath
ero
scle
rosis
stu
die
s
(FA
TS
, P
LA
C 1
, R
EG
RE
SS
)
Seco
nd g
enera
tion c
linic
al stu
die
s
(WO
SC
OP
S,
CA
RE
, 4S
, LIP
ID,
AF
CA
PS
/TE
XC
AP
S)
1940 1970 1980 1990 1995

Why LDL-Cholesterol is Not Enough
• Also need to focus on Plaque Stabilization
• Residual Risk Even in Intensely Treated
Patients
• Lipoprotein species other than LDL are
involved in atherogenesis (ie, VLDL, IDL,
HDL)
• LDL-Concentration is not the same as LDL
Particle No.

Lipid
core
Lumen
Fibrous cap
Lumen stenotic but plaque stable
Thick fibrous cap
Lumen not stenotic but inflamed
Thin fibrous cap ruptured, leading to
thrombus formation
Plaque Rupture-not Stenosis-causes most
Acute Myocardial Infarctions
Lumen
Stable Plaque Unstable Plaque

Most MI’s Arise From Smaller Stenoses
0%
10%
20%
30%
40%
50%
60%
70%
< 50 50-70 > 70
68%
18%14%M
I P
ati
en
ts
% Stenosis
Falk et al. Circulation, 1995;92:657-671

How Many Feel Most of Their Patient’s
Lipids are Under Control?
• If control means LDL <100 or 70, is that
enough? (Problem of residual risk)
• Are my patients’ LDL levels truly “at goal”
using Friedewald?
• Is my patient heading for an event despite
an LDL <70?

Residual CVD Risk in Patients Treated
With Intensive Statin Therapy
Pa
tie
nts
Ex
pe
rie
nc
ing
Ma
jor
CV
D
Eve
nts
, % Standard statin therapy
Intensive high-dose statin therapy
PROVE IT-TIMI 222 IDEAL3 TNT4
N
LDL-C,*
mg/dL 1Superko HR. Br J Cardiol. 2006;13:131-136.
2Cannon CP, et al. N Engl J Med. 2004;350:1495-1504.3Pedersen TR, et al. JAMA. 2005;294:2437-2445.
4LaRosa JC, et al. N Engl J Med. 2005;352:1425-1435.
4162 8888 10 001
95
*Mean or median LDL-C after treatment
62 104 81 101 77
26.3
13.710.9
12.0
22.4
8.7
0
10
20
30
40
PROVE IT-TIMI 22 IDEAL TNT

Residual Cardiovascular Risk
in Major Statin Trials
Adapted from Libby PJ, et al. J Am Coll Cardiol, 2005:46:1225-1228.
62%69%73%75%
62%
75%
0
20
40
60
80
100
4S LIPID CARE HPS WOS AFCAPS /
TexCAPS
LDL
N 4444 4159 20 536 6595 66059014
-35% -28% -29% -26% -25%-25%
Secondary High Risk Primary
Resid
ual R
isk
Ma
jor
Co
ron
ary
Eve
nts
, %

PP TG’s
Triglycerides (mainly)
LDL Cholesterol
Apo BHDL Cholesterol
Apo A1
Lipoprotein species other than LDL-C
are involved in atherogenesis
(ie, VLDL, IDL, HDL)

Friedewald Equation Conclusions
• In the era of lower LDL’s for high risk patients the Friedewald equation is too inaccurate for clinical use
• Direct measurement of LDL is needed if:
– LDL-C < 100 mg/dL
– Trigs > 200 mg/dL
– Non-fasting specimen or partial fasting
– Drugs or disease states that cause elevated triglycerides

Lipids in Diabetic and Nondiabetic Subjects
0
50
100
150
200
250
300
Total-C LDL-C HDL-C TG
Diabetic
Nondiabetic
Seru
m C
on
cen
trati
on
, m
g/d
L
216
131
41
245
Resnick HE, et al. Diabetes Care. 2000;23:176-180.
American Diabetes Association. Diabetes Care. 2006;29(suppl 1):S4-S42.
215
51
137 143
NHANES III
N = 2844
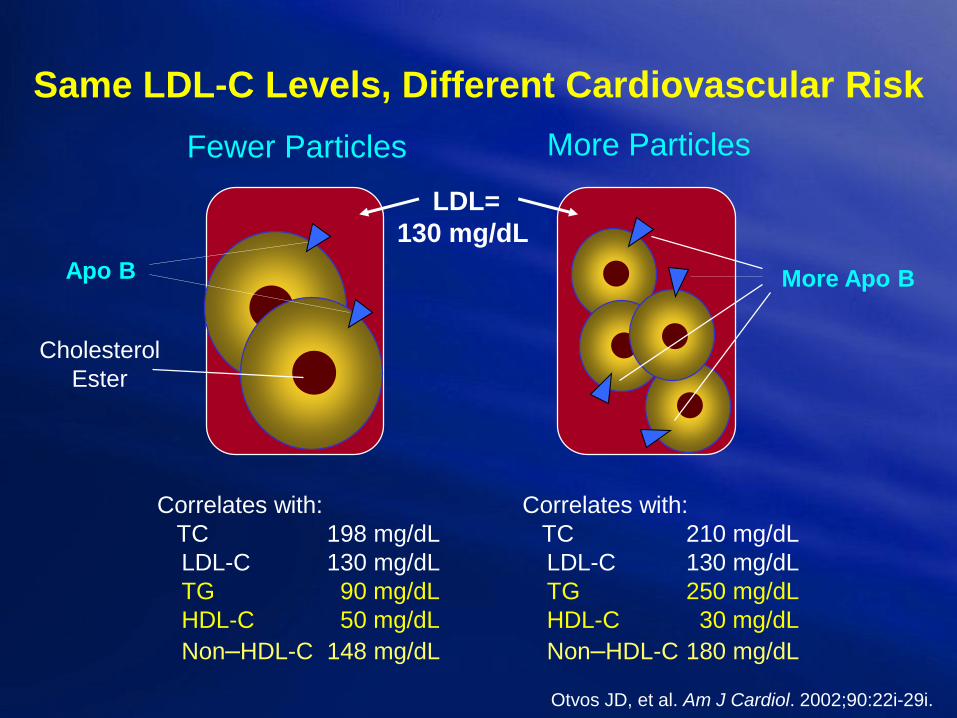
Same LDL-C Levels, Different Cardiovascular Risk
Apo B
LDL=
130 mg/dL
Fewer Particles More Particles
Cholesterol
Ester
More Apo B
Otvos JD, et al. Am J Cardiol. 2002;90:22i-29i.
Correlates with:
TC 198 mg/dL
LDL-C 130 mg/dL
TG 90 mg/dL
HDL-C 50 mg/dL
Non–HDL-C 148 mg/dL
Correlates with:
TC 210 mg/dL
LDL-C 130 mg/dL
TG 250 mg/dL
HDL-C 30 mg/dL
Non–HDL-C 180 mg/dL

0
5
10
15
20
700 1000 1300 1600 (nmol/L)
43%
(n=377)
30%
(n=260)
9%
(n=76)
2%
(n=15)
Percent
of
Subjects
16%
(n=147)
0
5
10
15
20
24%
(n=364)
Percent
of
Subjects
1%
(n=19)
5th 20th 50th 80th percentile
LDL-C
71-99 mg/dL
(n=1,484)
700 1000 1300 1600 (nmol/L)
43%
(n=631)
21%
(n=307)
11%
(n=163)
LDL-C
< 70 mg/dL
(n=871)
LDL Particle Number Distribution in T2DM Subjects
41%
75%
AHA Scientific Sessions, 2005
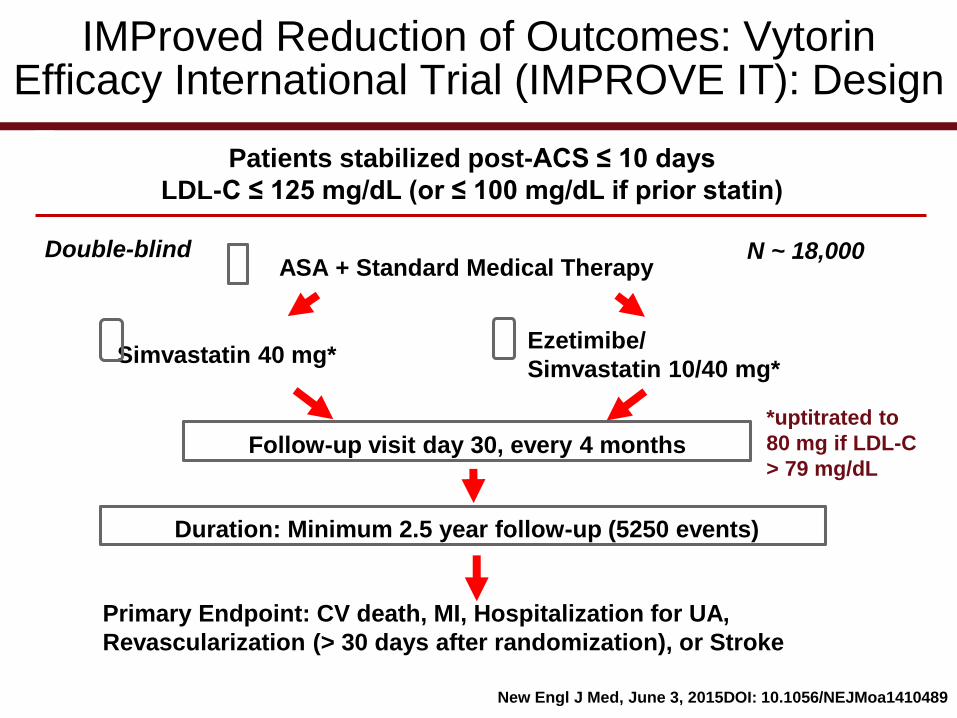
IMProved Reduction of Outcomes: VytorinEfficacy International Trial (IMPROVE IT): Design
Patients stabilized post-ACS ≤ 10 days
LDL-C ≤ 125 mg/dL (or ≤ 100 mg/dL if prior statin)
Double-blind N ~ 18,000ASA + Standard Medical Therapy
Simvastatin 40 mg*Ezetimibe/
Simvastatin 10/40 mg*
Follow-up visit day 30, every 4 months
Duration: Minimum 2.5 year follow-up (5250 events)
Primary Endpoint: CV death, MI, Hospitalization for UA,
Revascularization (> 30 days after randomization), or Stroke
*uptitrated to
80 mg if LDL-C
> 79 mg/dL
New Engl J Med, June 3, 2015DOI: 10.1056/NEJMoa1410489

IMProved Reduction of Outcomes: VytorinEfficacy International Trial (IMPROVE IT)
100
90
80
70
60
50
40
QE R 1 4 8 12 16 24 36 48 60 72 84 96
Time since randomization (months)
Number at risk
EZ/Simva 53.2 125.8 120.4 48.7 3.3
Simva 9009 8921 8306 7843 7289 6939 6607 6192 5684 5267 4395 3387 2569 1068
Mean
LD
L-C
(m
g/d
L)
Median Time
Simva 69.9 145.1 137.1 48.1 3.8
Δ in mg/dL -16.7 -19.3 -16.7 +0.6 -0.5
1 yr mean LDL-C TC TG HDL-C hs-CRP
Ez/Simva 8990 8899 8230 7701 7264 6864 6583 6256 5734 5354 4508 3484 2608 1078
New Engl J Med, June 3, 2015DOI: 10.1056/NEJMoa1410489

IMProved Reduction of Outcomes: VytorinEfficacy International Trial (IMPROVE IT)
Primary Endpoint - ITT
765432100
10
20
30
40
Time Since Randomization (years)
Eve
nt
Ra
te (
%)
EZ/Simva – 32.7%
2572 events
Simva – 34.7%
2742 events NNT = 50
HR 0.936 CI (0.887, 0.988)
p=0.016
7-year event rates
New Engl J Med, June 3, 2015DOI: 10.1056/NEJMoa1410489
American Association of Clinical Endocrinologists and American College of Endocrinology
Guidelines for Management of Dyslipidemia and Prevention of Cardiovascular Disease
Writing Committee
Chair: Paul S. Jellinger, MD, MACE
Co-Chair: Yehuda Handelsman, MD, FACP, FACE
Members:
David S. H. Bell, MD, FACP, FACE
Zachary T. Bloomgarden, MD, MACE
Eliot A. Brinton, MD, FAHA, FNLA
Michael H. Davidson, MD, FACC, FACP, FNLA
Sergio Fazio, MD, PhD
Vivian A. Fonseca, MD, FACE
Alan J. Garber, MD, PhD, FACE
George Grunberger, MD, FACP, FACE
Chris K. Guerin, MD, FNLA, FACE
Jeffrey I. Mechanick, MD, FACP, FACE, FACN, ECNU
Rachel Pessah-Pollack, MD, FACE
Paul D. Rosenblit, MD, PhD, FNLA, FACE
Donald A. Smith, MD, MPH, FACE
Kathleen Wyne, MD, PhD, FNLA, FACE
Reviewers:
Michael Bush, MD
Farhad Zangeneh, MD

The 10-year risk of a coronary event (high, intermediate, or low) sample tools
oFramingham Risk Assessment Tool (https://www.framinghamheartstudy.org/risk-functions/coronary-heart-
disease/hard-10-year-risk.php)
oMulti-Ethnic Study of Atherosclerosis (MESA) 10-year
ASCVD Risk w Coronary Artery Calcification Calculator (https://www.mesanhlbi.org/MESACHDRisk/MesaRiskScore/RiskScore.aspx)
o Reynolds Risk Score, which includes hsCRP and family
history of premature ASCVD) (http://www.reynoldsriskscore.org)
oUnited Kingdom Prospective Diabetes Study (UKPDS)
risk engine to calculate ASCVD risk in individuals with
T2DM) (https://www.dtu.ox.ac.uk/riskengine)
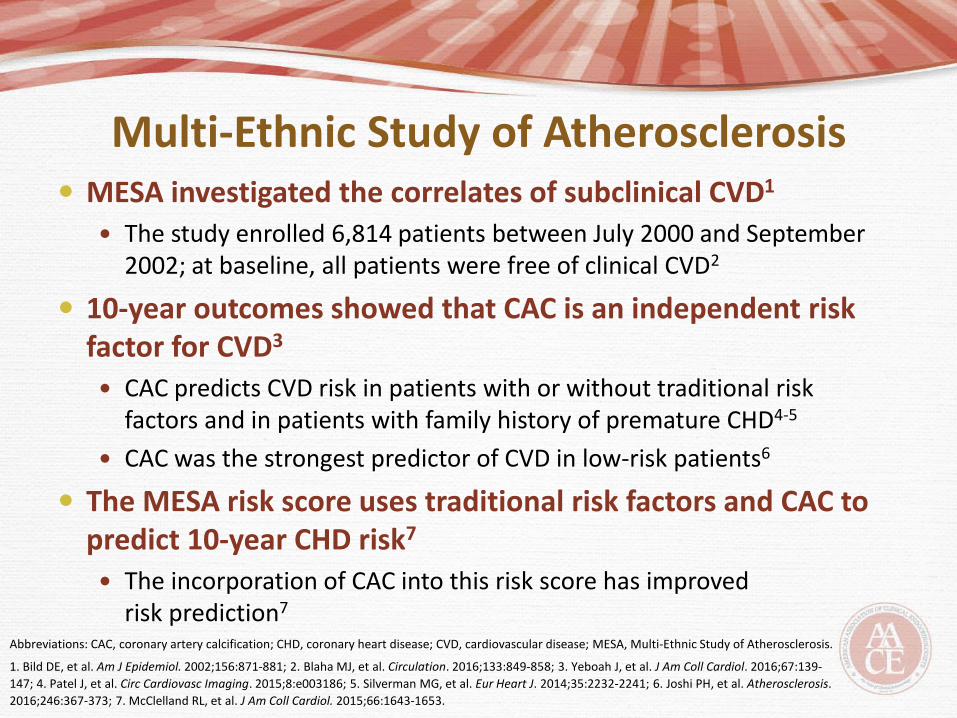
Multi-Ethnic Study of Atherosclerosis MESA investigated the correlates of subclinical CVD1
The study enrolled 6,814 patients between July 2000 and September 2002; at baseline, all patients were free of clinical CVD2
10-year outcomes showed that CAC is an independent risk factor for CVD3
CAC predicts CVD risk in patients with or without traditional risk factors and in patients with family history of premature CHD4-5
CAC was the strongest predictor of CVD in low-risk patients6
The MESA risk score uses traditional risk factors and CAC to predict 10-year CHD risk7
The incorporation of CAC into this risk score has improved risk prediction7
Abbreviations: CAC, coronary artery calcification; CHD, coronary heart disease; CVD, cardiovascular disease; MESA, Multi-Ethnic Study of Atherosclerosis.
1. Bild DE, et al. Am J Epidemiol. 2002;156:871-881; 2. Blaha MJ, et al. Circulation. 2016;133:849-858; 3. Yeboah J, et al. J Am Coll Cardiol. 2016;67:139-
147; 4. Patel J, et al. Circ Cardiovasc Imaging. 2015;8:e003186; 5. Silverman MG, et al. Eur Heart J. 2014;35:2232-2241; 6. Joshi PH, et al. Atherosclerosis.
2016;246:367-373; 7. McClelland RL, et al. J Am Coll Cardiol. 2015;66:1643-1653.
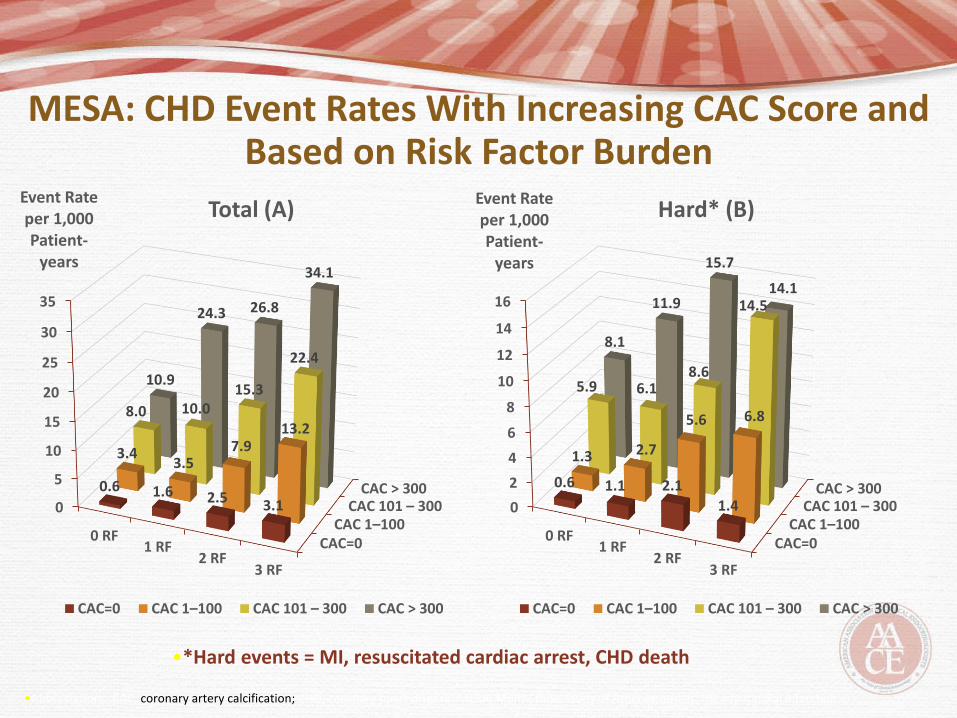
MESA: CHD Event Rates With Increasing CAC Score and Based on Risk Factor Burden
•*Hard events = MI, resuscitated cardiac arrest, CHD death
•Abbreviations: CAC, coronary artery calcification; CHD, coronary heart disease; MESA, Multi-Ethnic Study of Atherosclerosis; MI, myocardial infarction
CAC=0CAC 1–100
CAC 101 – 300CAC > 300
0
5
10
15
20
25
30
35
0 RF1 RF
2 RF3 RF
0.6 1.6 2.5 3.1
3.43.5
7.913.2
8.0 10.015.3
22.4
10.9
24.3 26.8
34.1
Event Rate per 1,000 Patient-
years
Total (A)
CAC=0 CAC 1–100 CAC 101 – 300 CAC > 300
CAC=0CAC 1–100
CAC 101 – 300CAC > 300
0
2
4
6
8
10
12
14
16
0 RF1 RF
2 RF3 RF
0.6 1.1 2.1
1.4
1.3 2.7
5.6 6.8
5.9 6.18.6
14.5
8.1
11.9
15.7
14.1
Event Rate per 1,000 Patient-
years
Hard* (B)
CAC=0 CAC 1–100 CAC 101 – 300 CAC > 300

MESA: Cumulative CHD Incidence Across Coronary Artery Calcium Categories
Joshi PH , et al. Atherosclerosis. 2016;246:367-373

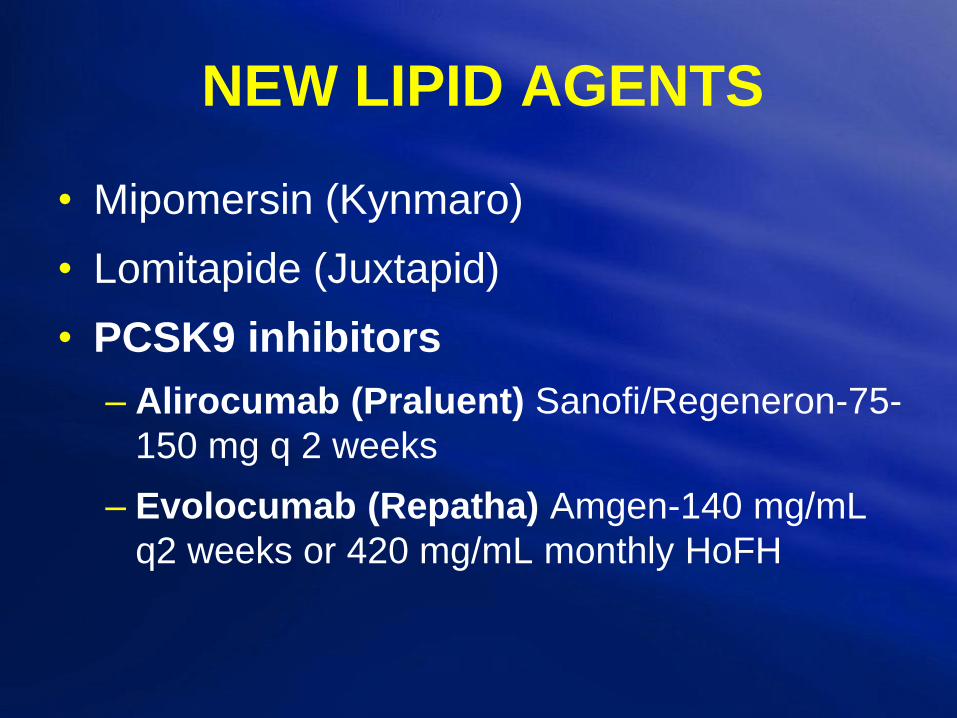
NEW LIPID AGENTS
• Mipomersin (Kynmaro)
• Lomitapide (Juxtapid)
• PCSK9 inhibitors
– Alirocumab (Praluent) Sanofi/Regeneron-75-
150 mg q 2 weeks
– Evolocumab (Repatha) Amgen-140 mg/mL
q2 weeks or 420 mg/mL monthly HoFH

Mipomersen: Crosses the Hepatocyte and Nuclear
Membrane to Target the mRNA for Apo B
Hepatocyte
cell membrane
Mipomersen (Apo B)
antisense strand
Cytoplasm
Nucleus
Apo B mRNA
DNA
mRNA-antisense
duplex
RNase H
recognizes duplex
RNA is cleaved
Excreted in urine
1. Kastelein JJ, et al. Circulation. 2006;114(16):1729-35; 2. Crooke ST, ed. Antisense Drug Technology: Principles, Strategies and Applications. 2nd ed. 2008:601-39; 3. Yu R, et al. Drug Metab Dispos. 2007;35(3):460-8.

Mechanism of Action of LomitapideLomitapide binds and inhibits Microsomal
Triglyceride Transport Protein (MTP), thereby
preventing the assembly of apo B containing
lipoproteins in the enterocytes and hepatocytes.
This inhibits the synthesis of chylomicrons and VLDL-C
LDL-C
TChol
Apo B
Non-HDLHussain M et al. J. Lipid Research. 2003;44:22-32.

PCSK9 (Proprotein convertase subtilisin/kexin type 9)
Targets LDL-R for Lysosomal Degradation
Qian Ywetal, et al. J Lipid Research 2007;48:1488-1498
Horton JD, et al. J Lipid Research 2009;50:S172-S177
Zhang DW, et al. J Biol Chem 2007;282:18602-18612


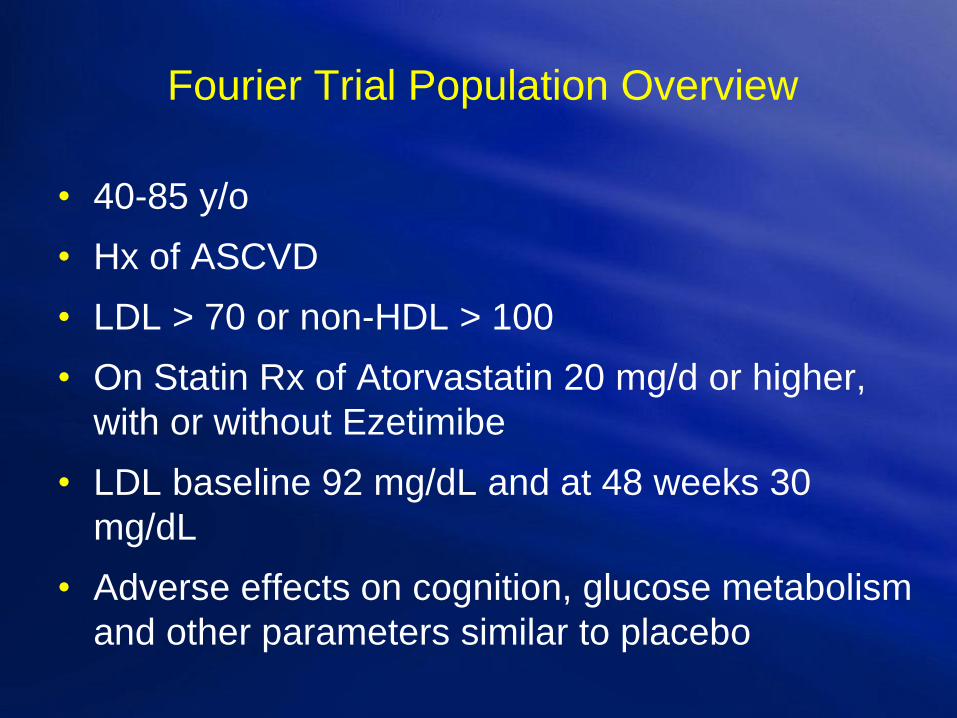
Fourier Trial Population Overview
• 40-85 y/o
• Hx of ASCVD
• LDL > 70 or non-HDL > 100
• On Statin Rx of Atorvastatin 20 mg/d or higher,
with or without Ezetimibe
• LDL baseline 92 mg/dL and at 48 weeks 30
mg/dL
• Adverse effects on cognition, glucose metabolism
and other parameters similar to placebo
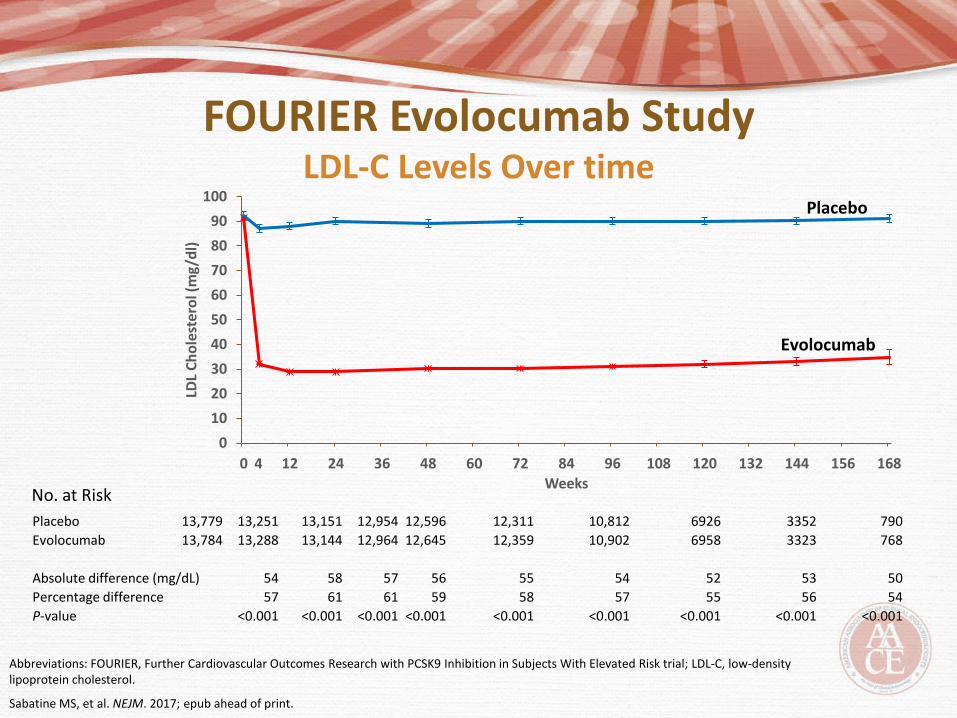
FOURIER Evolocumab StudyLDL-C Levels Over time
Abbreviations: FOURIER, Further Cardiovascular Outcomes Research with PCSK9 Inhibition in Subjects With Elevated Risk trial; LDL-C, low-density lipoprotein cholesterol.
Sabatine MS, et al. NEJM. 2017; epub ahead of print.
0
10
20
30
40
50
60
70
80
90
100
0 12 24 36 48 60 72 84 96 108 120 132 144 156 168
LDL
Ch
ole
ster
ol (
mg/
dl)
Weeks
Placebo
Evolocumab
4
Placebo 13,779 13,251 13,151 12,954 12,596 12,311 10,812 6926 3352 790
Evolocumab 13,784 13,288 13,144 12,964 12,645 12,359 10,902 6958 3323 768
Absolute difference (mg/dL) 54 58 57 56 55 54 52 53 50
Percentage difference 57 61 61 59 58 57 55 56 54
P-value <0.001 <0.001 <0.001 <0.001 <0.001 <0.001 <0.001 <0.001 <0.001
No. at Risk

FOURIER Evolocumab Study Endpoints
Abbreviations: FOURIER, Further Cardiovascular Outcomes Research with PCSK9 Inhibition in Subjects With Elevated Risk trial; MI, myocardial infarction.
Sabatine MS, et al. NEJM. 2017; epub ahead of print.
Cumulative event rates for the primary efficacy endpoint (Composite of cardiovascular death, MI, stroke, hospitalization for unstable angina, or coronary
revascularization)
Cumulative rates for the key secondary efficacy endpoint (Composite of cardiovascular death,
MI, or stroke)

FOURIER Primary and Secondary Endpoints
At 26 months, extremely tight lipid control with evolocumab led to a 15% decrease in risk for the primary composite endpoint and 20% decrease in risk for a secondary composite endpoint
The primary endpoint included MI, cardiovascular death, stroke, coronary revascularization, or hospitalization for unstable angina
The secondary endpoint included cardiovascular death, MI, or stroke
Beyond the second year of follow-up, the risk reduction increased to 20% for the primary endpoint and to 25% for the secondary endpoint
For singular endpoints at 26 months, very tight lipid control reduced the risk of MI by 27%, stroke by 21%, and coronary revascularization by 22%
Abbreviations: FOURIER, Further Cardiovascular Outcomes Research with PCSK9 Inhibition in Subjects With Elevated Risk trial; LDL-C, low-density
lipoprotein cholesterol; MI, myocardial infarction.
Sabatine MS, et al. NEJM. 2017; epub ahead of print.

PCSK9 Inhibitors
• 2 PCSK9 inhibitors, Alirocumab (Praluent) and
Evolocumab (Repatha), are available, and more
are on the way
• Not only do they work well with statins, their
effect on cholesterol lowering is additive
• Low Side effect profile
• Large outcome trials, like Fourier, are underway
with other agents
• Drug acquisition costs are relatively expensive,
compared to traditional therapies
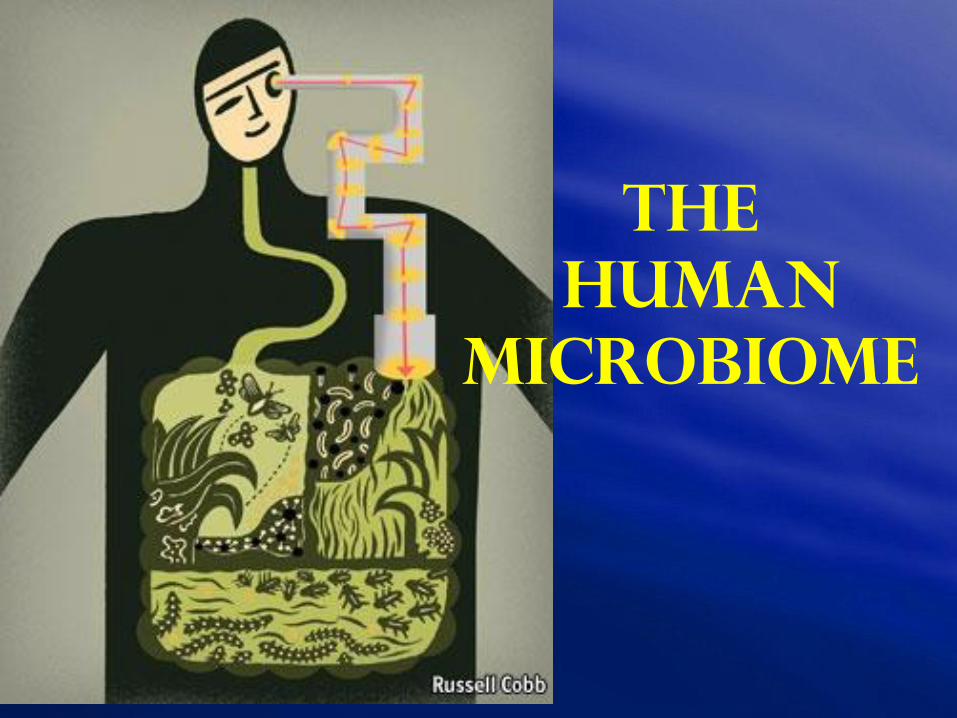
The
Human
Microbiome


Gut Microbiota participates in Atherosclerosis in
the presence of specific dietary exposures
Wang Z et al, Nature (2011). Koeth RA et al, Nature Medicine (2013).
Tang WHW et al, NEJM (2013)

TMAO is formed from dietary Carnitine and
Choline in Omnivores
“Standard American Diet”=SAD
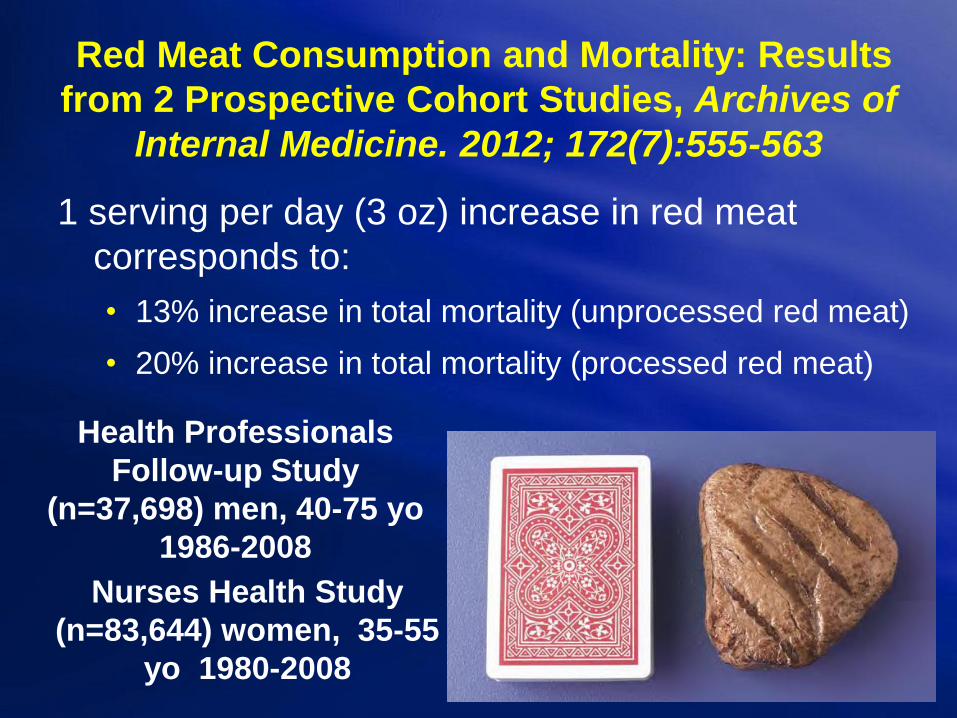
Red Meat Consumption and Mortality: Results
from 2 Prospective Cohort Studies, Archives of
Internal Medicine. 2012; 172(7):555-563
1 serving per day (3 oz) increase in red meat
corresponds to:
• 13% increase in total mortality (unprocessed red meat)
• 20% increase in total mortality (processed red meat)
Health Professionals
Follow-up Study
(n=37,698) men, 40-75 yo
1986-2008
Nurses Health Study
(n=83,644) women, 35-55
yo 1980-2008
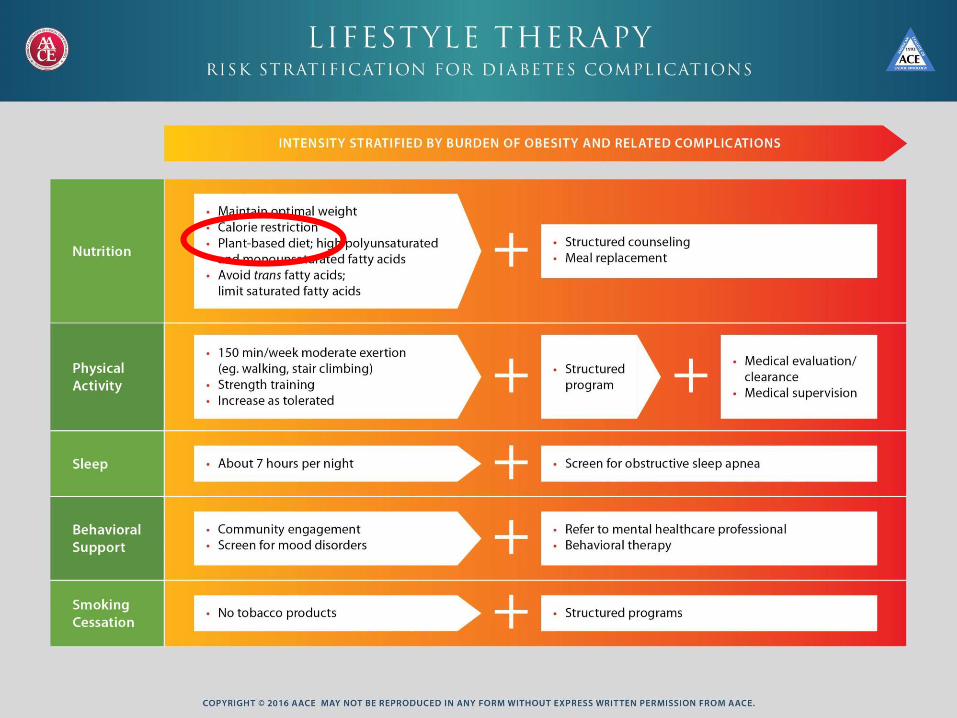


What is a Plant-Based Diet?
• Beware of Junk Food-white bread, potato chips and diet cola are technically plant based
• Whole food, non-processed is the goal; this will be high in fiber and promote a healthy microbiome
• Complex Carbohydrates are desirable and not to be avoided. Resistant Starch-remains intact through cooking and digestion-ie. beans, potatoes, split peas, slightly green bananas, barley and brown rice.
Concentrate on what is included instead of what isn’t

Refined (Simple) vs. Whole (Complex)
Carbs
• Whole grains are derived from the seeds of
grasses and include rice, oats, rye, wheat, wild
rice, quinoa, barley, buckwheat, bulgur, corn,
millet, amaranth, and sorghum. (They have zero
cholesterol and are low in fat.)
• Refined grains-the bran and germ
have been removed, leaving only
the endosperm. These end products
are stripped of vitamins, minerals,
and fiber.
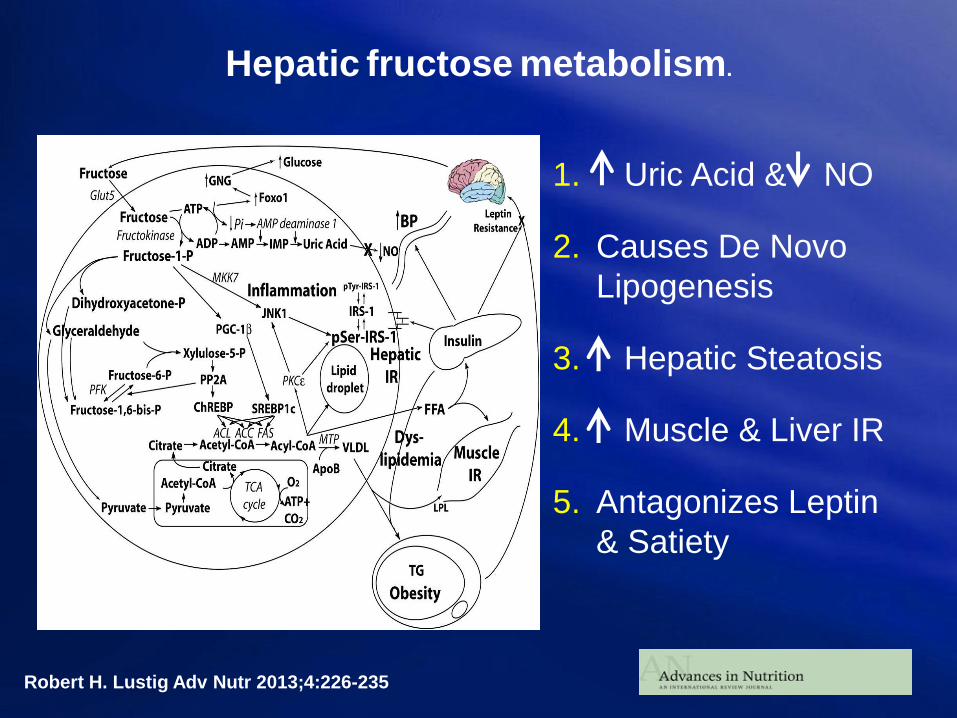
Hepatic fructose metabolism.
Robert H. Lustig Adv Nutr 2013;4:226-235
1. Uric Acid & NO
2. Causes De Novo
Lipogenesis
3. Hepatic Steatosis
4. Muscle & Liver IR
5. Antagonizes Leptin
& Satiety

What We Really Have is a FIBER Deficiency
• Soluble fiber-can be dissolved in water, and can be found in oats, barley, beans, peas, apples, citrus fruits, carrots and seaweed. Soluble fiber lowers cholesterol and glucose.
• Insoluble fiber-improves digestion, constipation, increases satiety, and removes toxins. Foods include vegetables like asparagus, celery, wheat bran, whole grains, and nuts.

How much Protein do we Need?
• The average American diet contains @ 120 grams of protein
• RDA for adults-0.8 gram/kg/day
• Multiple studies correlate meat consumption with DM, Inflammation, Obesity, CVD, Dyslipidemia, HTN, CKD, Cancer
Types of Fats• MUFA (monounsaturated fatty
acids)-found in olives, peanuts,
avocados, pecans, almonds, their
oils, and canola oil.
• PUFA (polyunsaturated fatty
acids)-make up omega-3 and
omega-6. Found in walnuts,
flaxseeds, hempseeds, vegetable
oils (especially canola, soybean,
and flaxseed), fish, and marine
oils.
• SFA (saturated fatty acids)-found
primarily in animal products. They
raise cholesterol and promote
heart disease.
• TFA (trans fatty acids)-if you see
hydrogenated or partly
hydrogenated-stay away!


Sprint Trial
Systolic Blood Pressure Intervention Trial
Background: Optimal target for SBP lowering
uncertain
Randomized 9300: SBP 120 vs. 140 mm Hg
Stopped at 3.3 years; planned average 5 year f/u
“Landmark NIH study…Milestone…Major
Advance…SPRINT shows intensive blood
pressure management may save lives”
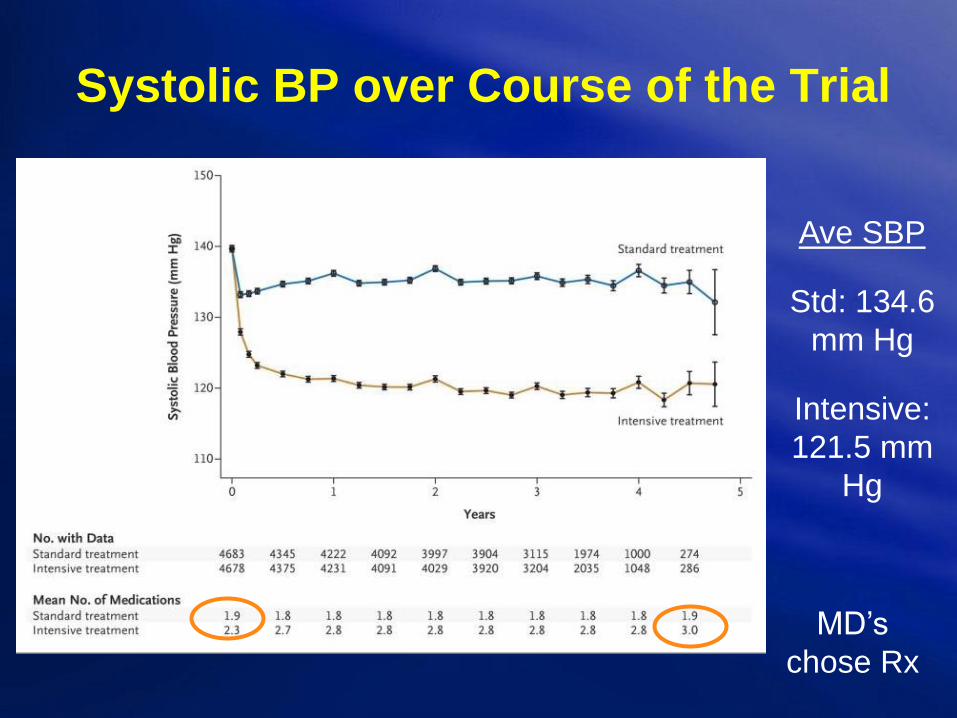
Systolic BP over Course of the Trial
Ave SBP
Std: 134.6
mm Hg
Intensive:
121.5 mm
Hg
MD’s
chose Rx

SPRINT: Main Results
Primary Outcome
Death from any Cause

Hypertension Caveats
Use ACE i first d/t cost; @
10% intolerant d/t cough
In DM, Beta blockers can
mask hypoglycemia and
worsen glucose intolerance
Don’t be surprised if it takes
2-4 agents for control
Salt restriction is helpful!
Consider screening for
Secondary HTN-ie renin/aldo
ratio, Cushing’s, Pheo, etc.

Rule Out Endocrine Causes
• Onset before age 25
• Not controlled on 3 drugs, including diuretic
• Palpitations, Headache, Sweats (1/300)
• Abdominal bruit, central obesity, striae
• Adrenal Nodule; hypokalemia
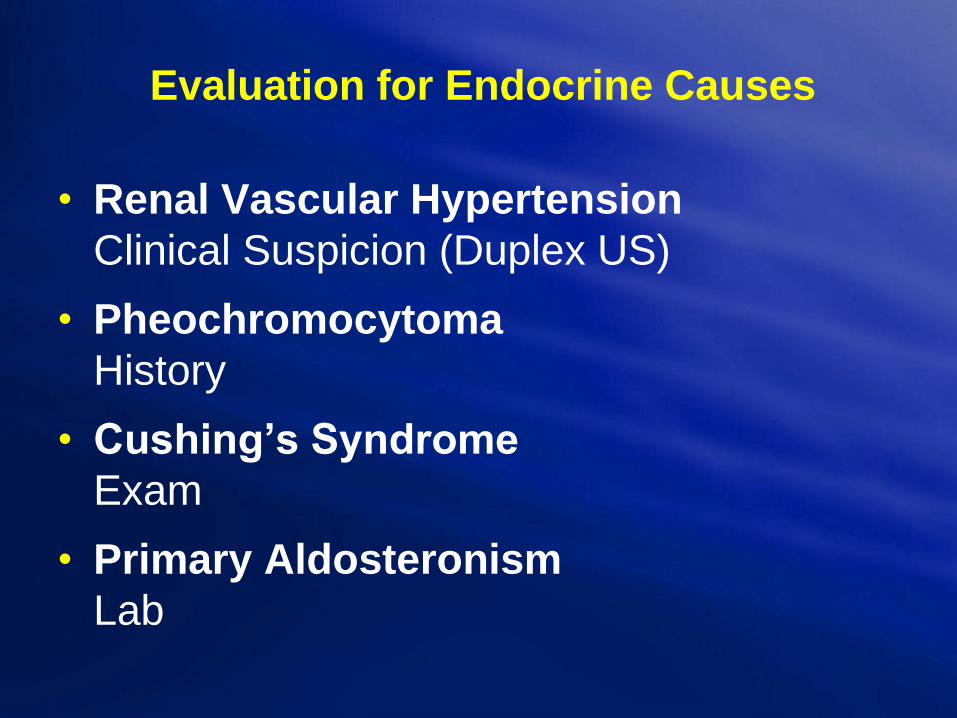
Evaluation for Endocrine Causes
• Renal Vascular Hypertension
Clinical Suspicion (Duplex US)
• Pheochromocytoma
History
• Cushing’s Syndrome
Exam
• Primary Aldosteronism
Lab

Other Causes of Secondary HTN
• Obesity
• Aging
• Sleep Apnea
• CKD
• Thyroid or PTH
• Excess Na
• Excess EtOH
• Drugs
– NSAID’s, OC’s, illicit,
supplements
• Improper BP
measurement
• White Coat
Phenomenon
• Noncompliance

BP Goals for DM patients?
2003
JNC7 <130/80 mm
2013
ADA raised target to
<140/90 mm
2017….
ADA suggests <130/80 if at
High risk and it’s safe •DM


But it takes a long time!

Steno-2: Effects of MultifactorialIntervention on CV OutcomesN = 160 with type 2 diabetes and microalbuminuria
Gæde P et al. N Engl J Med. 2003;348:383-93.
53% risk reduction
P = 0.01
Follow-up (months)
Primary
composite
outcome*
(%)
*CV death, MI, stroke, revascularization, amputation
Conventional
Intensive
60
50
40
30
20
10
0
0 12 24 36 48 60 72 84 96
Gaede P et al. N Engl J Med 2008;358:580-591
New Approaches to Cardiovascular
Risk Management
Chris K. Guerin, M.D., F.A.C.E.
IPP, CA-AACE
Board of Directors, AACE
Assistant Clinical Professor of Medicine at
UCSD
November 4th, 2017


