NEUTRON CLUSTERING & TRAVELING WAVES IN MONTE … · Cluster density profile from the BBM...
49
NEUTRON CLUSTERING & TRAVELING WAVES IN MONTE-CARLO CRITICALITY SIMULATIONS E. Dumonteil Contact: [email protected] IRSN PSN-EXP/SNC France
Transcript of NEUTRON CLUSTERING & TRAVELING WAVES IN MONTE … · Cluster density profile from the BBM...

NEUTRON CLUSTERING & TRAVELING WAVES
IN
MONTE-CARLO CRITICALITY SIMULATIONS
E. Dumonteil Contact: [email protected]
IRSN PSN-EXP/SNC
France

2
Common work
M&C 2017 (Jeju) selected papers

3
Outline
Part 1. Bias of the local tallies of decoupled systems
Under-sampling & Loose coupling & Boundary conditions…
Part 2. Hand-waving approach to model the bias
Artificial fission
Part 3. Mathematical approach to model the bias
What equation do MC criticality codes solve?
Clustering & Traveling waves
Part 4. Conclusions

4
Outline
Part 1. Bias of the local tallies of decoupled systems
Under-sampling & Loose coupling & Boundary conditions…

5
OECD/NEA R1 Benchmark
q Expert Group on Advanced Monte-Carlo Techniques @ OECD/NEA q R1 Benchmark = ¼ PWR-type reactor core q Designed to understand biases on local tallies estimates (+uncertainties)
Reflective boundary Conditions (Neumann)
Absorbing boundary Conditions (Dirichlet)

6
MORET Simulation of the R1 benchmark
1-std dev. “apparent” statistical errors (104 active cycles of 104 neutrons)
1-std dev. “true” statistical errors (104 active cycles of 104 neutrons)
Correlations due to reflective bc lead to increased true statistical errors
independent simulations

7
MORET Simulation of the R1 benchmark
Fluxes (104 active cycles of 104 neutrons) Fluxes (106 active cycles of 102 neutrons) Fluxes (102 active cycles of 106 neutrons)
Under-estimation of the flux inside the core, over-estimation for the outer assemblies
8
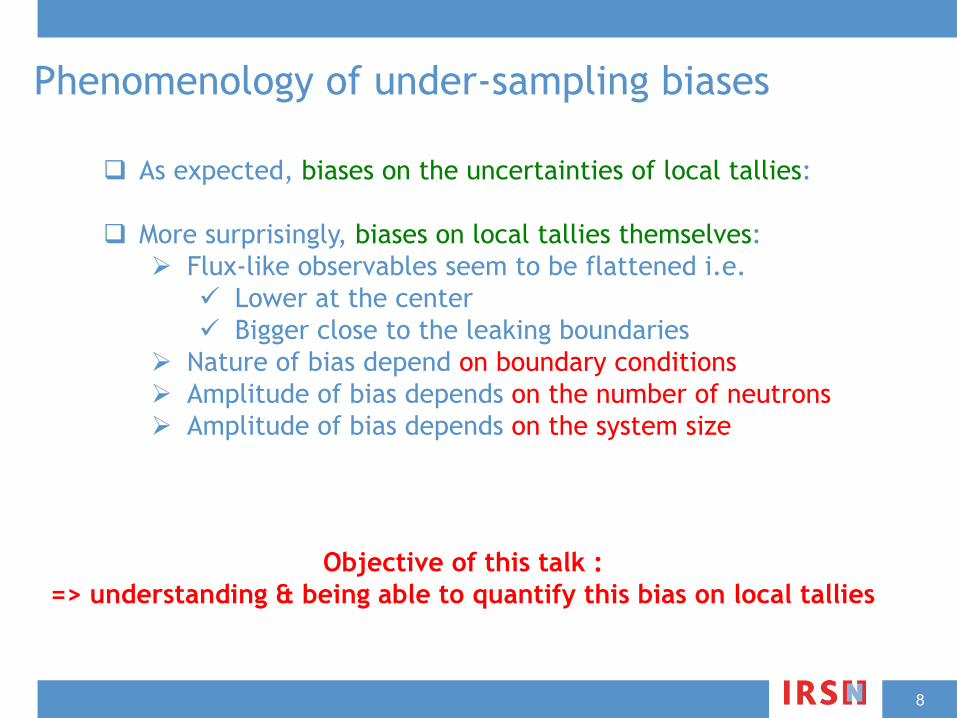
Phenomenology of under-sampling biases
q As expected, biases on the uncertainties of local tallies:
q More surprisingly, biases on local tallies themselves: Ø Flux-like observables seem to be flattened i.e.
ü Lower at the center ü Bigger close to the leaking boundaries
Ø Nature of bias depend on boundary conditions Ø Amplitude of bias depends on the number of neutrons Ø Amplitude of bias depends on the system size
Objective of this talk : => understanding & being able to quantify this bias on local tallies

9
Outline
Part 2. Hand-waving approach to model the bias
Artificial fission

10
1-D binary branching Brownian motion
Branching Brownian motion with population control couples: ⇒ Galton-Watson birth-death process to describe fission and absorption ⇒ Brownian motion to simulate neutron transport ⇒ Population control that reproduces the end of cycle renormalization of MC criticality codes
q Uniform material, mono-energy, leakage bc q Brownian motion with diffusion coefficient D [cm2.s-1] q undergoes collision at Poissonian times with rate [s-1] q at each collision, k descendants with probability q total number of particles N kept constant
< x
2(t) >= Dt
p(0) / �
p(1) / �
p(2) / �
� + � + �
t or g
Population control algo. to keep N constant
splitting roulette

11
q Poisson statistics q Cosine shape
q 1-D BBM with population control q Uniform initial distribution
Strongly coupled
q 50 neutrons q [-L,L] Dirichlet
DN
�L2>> 1

12
q Clustering ?
Loosely coupled
q 1-D BBM with population control q Uniform initial distribution
q 50 neutrons q [-L,L] Dirichlet
DN
�L2<< 1
13
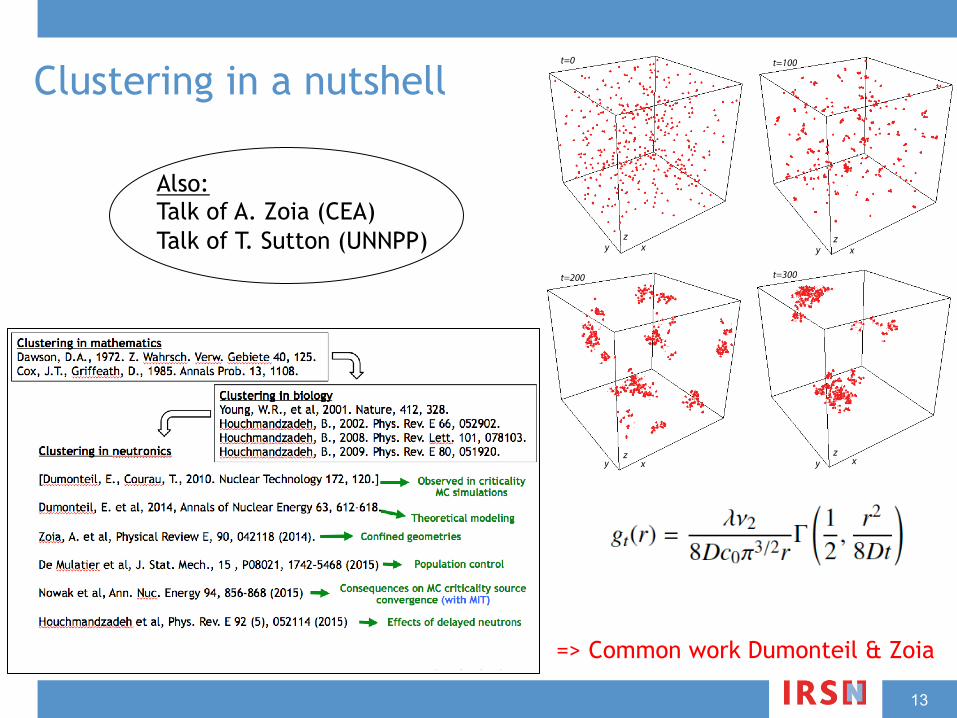
Clustering in a nutshell
x x
x x
y y
yy
z z
z z
t=0 t=100
t=300t=200
Also: Talk of A. Zoia (CEA) Talk of T. Sutton (UNNPP)
=> Common work Dumonteil & Zoia

14
q Clustering q Only one cluster after some time q Reflected albeit leaking boundaries !
Loosely coupled
Reflection due to N=constant !
Reflection due to N=constant !
q 1-D BBM with population control q Uniform initial distribution
q 50 neutrons q [-L,L] Dirichlet
DN
�L2<< 1

15
How do these processes average through time ?
From strongest to lousiest coupled systems
q Reproduces the R1 benchmark q Grasp the features of the under-sampling bias
Ø Leakage boundaries Ø Amplitude depends on N & the system size

16
Outline
Part 3. Mathematical approach to model the bias
What equation do MC criticality codes solve?
Clustering & Traveling waves

17
Diffusion equation with population control
@t� = Dr2�+ (� � �) �
q Monte-Carlo criticality codes = Boltzmann equation + population control q Population control = Weight Watching techniques (i.e. splitting+roulette) played at end of cycles to ensure that N~cte
Can we build an equation for what MC criticality codes actually solve ?
Fission rate
Capture rate Diffusion operator
(same demonstration for transport)
+ ?

18
Fission/Capture vs Splitting/Russian Roulette
f(N)N�(t)N
�N�N�⇤N
�⇤N
renormalization rate depends on N and t/g
N
2N
N
2
N
Beginning of cycle
End of cycle
N
End of renormalization
t or g
Probability for a given neutron to be splitted/captured depends
on the overall # of neutrons

19
Pair interactions But how many neutrons do we
remove/split at the end of each cycle and how to select them ?
q Combinatorial interactions ! ~ N2 at first order (# pairs) q Depends on the total mass N q Depends on the local mass N(x)
renormalization rate depends on time and N !
�(t)f(N)N
(N � 1)N⇡
N2
Generalization # neutrons captured in if k>1
number of pairs
x± dx
Birch et al, Theoretical Population Biology, 70, 26–42 (2006)
�(t)
Zdy G(x, y, t)

20
Diffusion with pair interactions
@t� = Dr2�+ (� � �) �
@t� = Dr2�+ (� � �) �+ �
Zdy G(x, y, t)
number of pairs
rate of renormalization
G(x, y, t) =h1 + g(x, y, t)
i�(x)�(y)
g(x, y, t) spatial correlation function
+ pair interactions
q “Hierarchy horror” (2d order moment pops back in the mean field equation!) q Clustering = spatial correlations => Bias induced on the flux wrt pure diffusion
�(t)
Zdy G(x, y, t)

21
Population control
�(t) =�� + � �D
R L�L dx r2
�(x, t)R L�L dx
R L�L dy G(x, y, t)
Z L
�Ldx �(x, t) = 1
Newman et al, Phys. Rev. Lett., 92, 228103 (2004)
q N has to be kept constant :
q depends on time!
q Injecting the normalization relation in our equation, we can calculate
�
�(t)

22
What equation do MC codes solve ?
�(t) =�� + � �D
R L�L dx r2
�(x, t)R L�L dx
R L�L dy G(x, y, t)
@t� = Dr2�+ (� � �) �+ �(t)
Z L
�Ldy (1 + g(x, y, t))�(y, t)�(x, t)
Large population size
Small population size
g(x, y, t) ! 0
g(x, y, t) ! g
1N (x, y) >> 1
De Mulatier et al, J. Stat. Mech., 15, P08021, 1742–5468 (2015)
Probability that one neutron in x is captured
Flux factorized out of the integral

23
Large population size
r2��
Z L
�Ldx r2
�(x)
!� = 0
r2�+⇡2
2L2� = 0
@
x
�(x)��x=±L
r2� = 0Neumann/Reflective bc
Dirichlet/Absorbing bc No criticality conditions ;)

24
Small population size
@
t
� = Dr2�+ (� � �) �+
�� + � �D @
x
�(x, t)��x=±LR +L
�L
dx
R +L
�L
dx �(x, t)2
!�(x, t)2
@t� = Dr2�+ (� � �) �(1� �)
q Non-linear equation with term q Can be simplified under some assumptions
q F-KPP equation with traveling waves solutions q Counter-reaction depending on the sign of
�2
Fisher, Ann. Eugenics 7:353-369 (1937)
�(x, t) =
1
⇣1 + C exp
± 16
p6(���)x� 5
6 (���)t⌘2
1� �

25
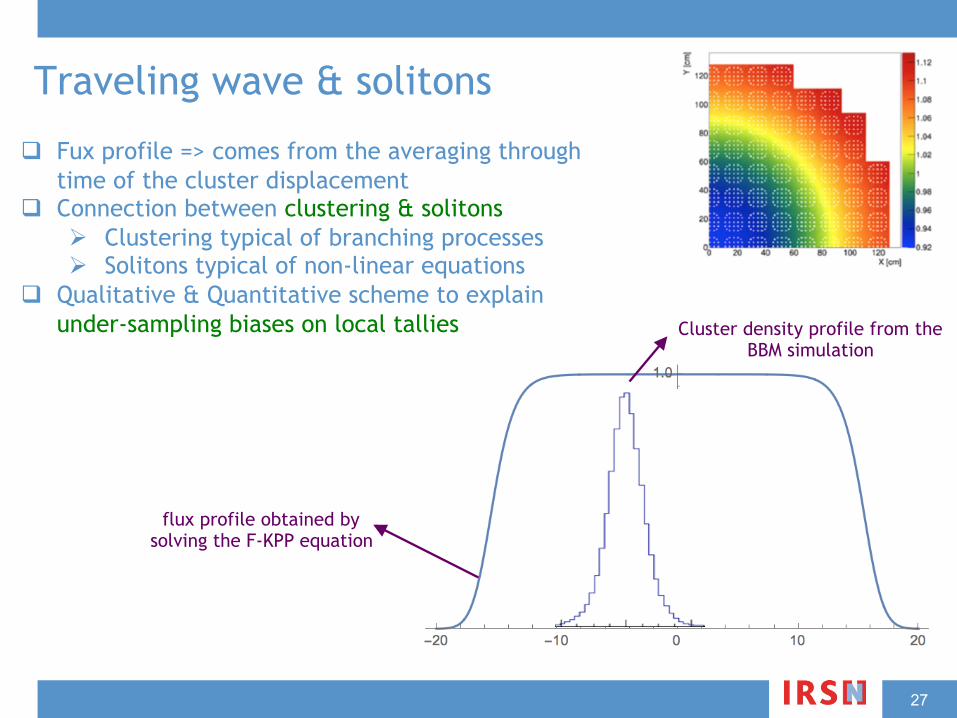
flux profile obtained by solving the F-KPP equation
Cluster density profile from the BBM simulation
Traveling wave & solitons q Fux profile => comes from the averaging through
time of the cluster displacement q Connection between clustering & solitons
Ø Clustering typical of branching processes Ø Solitons typical of non-linear equations
q Qualitative & Quantitative scheme to explain under-sampling biases on local tallies

26
flux profile obtained by solving the F-KPP equation
Cluster density profile from the BBM simulation
Traveling wave & solitons q Fux profile => comes from the averaging through
time of the cluster displacement q Connection between clustering & solitons
Ø Clustering typical of branching processes Ø Solitons typical of non-linear equations
q Qualitative & Quantitative scheme to explain under-sampling biases on local tallies
27
flux profile obtained by solving the F-KPP equation
Cluster density profile from the BBM simulation
Traveling wave & solitons q Fux profile => comes from the averaging through
time of the cluster displacement q Connection between clustering & solitons
Ø Clustering typical of branching processes Ø Solitons typical of non-linear equations
q Qualitative & Quantitative scheme to explain under-sampling biases on local tallies

28
flux profile obtained by solving the F-KPP equation
Cluster density profile from the BBM simulation
Traveling wave & solitons q Fux profile => comes from the averaging through
time of the cluster displacement q Connection between clustering & solitons
Ø Clustering typical of branching processes Ø Solitons typical of non-linear equations
q Qualitative & Quantitative scheme to explain under-sampling biases on local tallies

29
flux profile obtained by solving the F-KPP equation
Cluster density profile from the BBM simulation
Traveling wave & solitons q Fux profile => comes from the averaging through
time of the cluster displacement q Connection between clustering & solitons
Ø Clustering typical of branching processes Ø Solitons typical of non-linear equations
q Qualitative & Quantitative scheme to explain under-sampling biases on local tallies

30
flux profile obtained by solving the F-KPP equation
Cluster density profile from the BBM simulation
Traveling wave & solitons q Fux profile => comes from the averaging through
time of the cluster displacement q Connection between clustering & solitons
Ø Clustering typical of branching processes Ø Solitons typical of non-linear equations
q Qualitative & Quantitative scheme to explain under-sampling biases on local tallies

31
flux profile obtained by solving the F-KPP equation
Cluster density profile from the BBM simulation
Traveling wave & solitons q Fux profile => comes from the averaging through
time of the cluster displacement q Connection between clustering & solitons
Ø Clustering typical of branching processes Ø Solitons typical of non-linear equations
q Qualitative & Quantitative scheme to explain under-sampling biases on local tallies

32
flux profile obtained by solving the F-KPP equation
Cluster density profile from the BBM simulation
Traveling wave & solitons q Fux profile => comes from the averaging through
time of the cluster displacement q Connection between clustering & solitons
Ø Clustering typical of branching processes Ø Solitons typical of non-linear equations
q Qualitative & Quantitative scheme to explain under-sampling biases on local tallies

33
flux profile obtained by solving the F-KPP equation
Cluster density profile from the BBM simulation
Traveling wave & solitons q Fux profile => comes from the averaging through
time of the cluster displacement q Connection between clustering & solitons
Ø Clustering typical of branching processes Ø Solitons typical of non-linear equations
q Qualitative & Quantitative scheme to explain under-sampling biases on local tallies

34
flux profile obtained by solving the F-KPP equation
Cluster density profile from the BBM simulation
Traveling wave & solitons q Fux profile => comes from the averaging through
time of the cluster displacement q Connection between clustering & solitons
Ø Clustering typical of branching processes Ø Solitons typical of non-linear equations
q Qualitative & Quantitative scheme to explain under-sampling biases on local tallies

35
flux profile obtained by solving the F-KPP equation
Cluster density profile from the BBM simulation
Traveling wave & solitons q Fux profile => comes from the averaging through
time of the cluster displacement q Connection between clustering & solitons
Ø Clustering typical of branching processes Ø Solitons typical of non-linear equations
q Qualitative & Quantitative scheme to explain under-sampling biases on local tallies
36
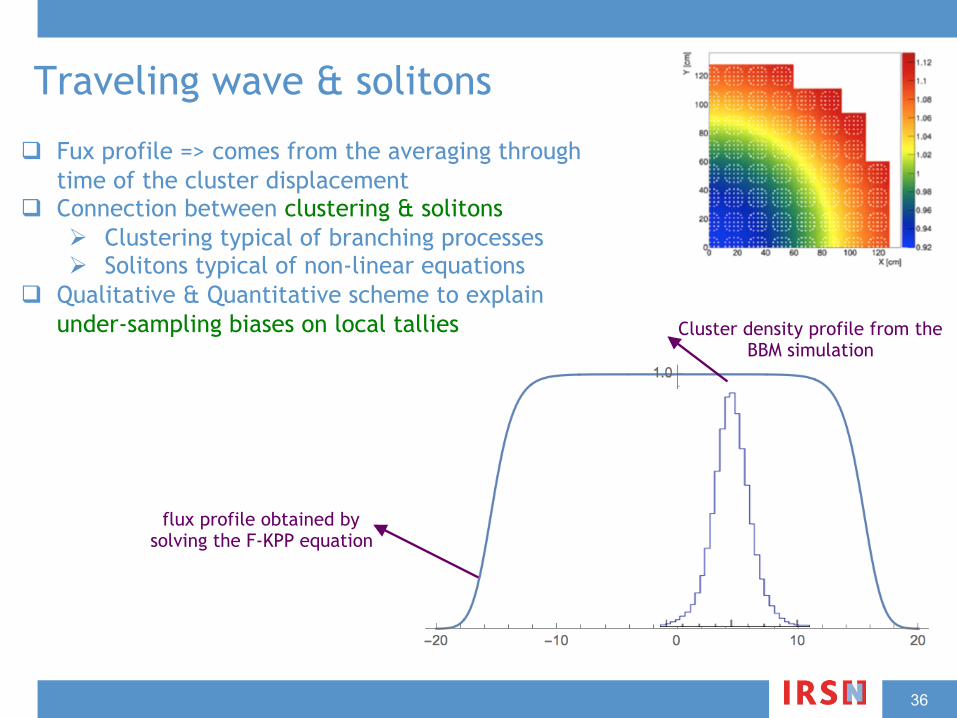
flux profile obtained by solving the F-KPP equation
Cluster density profile from the BBM simulation
Traveling wave & solitons q Fux profile => comes from the averaging through
time of the cluster displacement q Connection between clustering & solitons
Ø Clustering typical of branching processes Ø Solitons typical of non-linear equations
q Qualitative & Quantitative scheme to explain under-sampling biases on local tallies

37
flux profile obtained by solving the F-KPP equation
Cluster density profile from the BBM simulation
Traveling wave & solitons q Fux profile => comes from the averaging through
time of the cluster displacement q Connection between clustering & solitons
Ø Clustering typical of branching processes Ø Solitons typical of non-linear equations
q Qualitative & Quantitative scheme to explain under-sampling biases on local tallies

38
flux profile obtained by solving the F-KPP equation
Cluster density profile from the BBM simulation
Traveling wave & solitons q Fux profile => comes from the averaging through
time of the cluster displacement q Connection between clustering & solitons
Ø Clustering typical of branching processes Ø Solitons typical of non-linear equations
q Qualitative & Quantitative scheme to explain under-sampling biases on local tallies

39
flux profile obtained by solving the F-KPP equation
Cluster density profile from the BBM simulation
Traveling wave & solitons q Fux profile => comes from the averaging through
time of the cluster displacement q Connection between clustering & solitons
Ø Clustering typical of branching processes Ø Solitons typical of non-linear equations
q Qualitative & Quantitative scheme to explain under-sampling biases on local tallies

40
flux profile obtained by solving the F-KPP equation
Cluster density profile from the BBM simulation
Traveling wave & solitons q Fux profile => comes from the averaging through
time of the cluster displacement q Connection between clustering & solitons
Ø Clustering typical of branching processes Ø Solitons typical of non-linear equations
q Qualitative & Quantitative scheme to explain under-sampling biases on local tallies

41
flux profile obtained by solving the F-KPP equation
Cluster density profile from the BBM simulation
Traveling wave & solitons q Fux profile => comes from the averaging through
time of the cluster displacement q Connection between clustering & solitons
Ø Clustering typical of branching processes Ø Solitons typical of non-linear equations
q Qualitative & Quantitative scheme to explain under-sampling biases on local tallies

42
flux profile obtained by solving the F-KPP equation
Cluster density profile from the BBM simulation
Traveling wave & solitons q Fux profile => comes from the averaging through
time of the cluster displacement q Connection between clustering & solitons
Ø Clustering typical of branching processes Ø Solitons typical of non-linear equations
q Qualitative & Quantitative scheme to explain under-sampling biases on local tallies

43
flux profile obtained by solving the F-KPP equation
Cluster density profile from the BBM simulation
Traveling wave & solitons q Fux profile => comes from the averaging through
time of the cluster displacement q Connection between clustering & solitons
Ø Clustering typical of branching processes Ø Solitons typical of non-linear equations
q Qualitative & Quantitative scheme to explain under-sampling biases on local tallies

44
flux profile obtained by solving the F-KPP equation
Cluster density profile from the BBM simulation
Traveling wave & solitons q Fux profile => comes from the averaging through
time of the cluster displacement q Connection between clustering & solitons
Ø Clustering typical of branching processes Ø Solitons typical of non-linear equations
q Qualitative & Quantitative scheme to explain under-sampling biases on local tallies

45
Back to the under-sampling bias q Parameters controlling the amplitude of the
under-sampling bias?
q N q Total reaction rate q Typical size of the system q Diffusion coefficient q Second moment of the descending factorial of p(z)
Test for N dependence OK
De Mulatier et al, J. Stat. Mech., 15, P08021, 1742–5468 (2015)

46
Outline
Part 4. Conclusions

47
Conclusions q Under-sampling bias on local tallies discussed at the OECD/NEA/EGAMCT
q Due to combination between: Ø Population control Ø Boundary conditions Ø Spatial correlations (clustering)
q Equation that mimics MC criticality algorithms
q Solutions of this equation establishes a link between clusters & traveling waves and allows to quantify under-sampling biases
q => Importance of diagnosing clustering & spatial correlations
q In the future : Ø Exploration of straightforward consequences on reactor physics Ø Clustering experiment end of May @ RPI (LANL/IRSN)
48
Spare slides

49
Reaction rate of Weight Watching depends on N
⌧(N, t)Ne = Ne �Nb
⌧(N, t) = 1�Nb/Ne
⌧(N, t) = 1� Nb
(k(t,N)Nb)= 1� 1
k(t,N)
k(N) = keff(1 +cte
N)
⌧(N) ⇡ cte1 + cte2N
Estimator of keff