Network Visualization – FINAL PAPER
12
NETWORK VISUALIZATION – FINAL PAPER CSOL 570.FINAL PAPER. CHAD NELLEY Chad Nelley [email protected]; [email protected] Abstract A compilation of lab assignments and outputs designed to show practical application and understanding of a subset of Network Visualization tools and their application.
Transcript of Network Visualization – FINAL PAPER

NETWORK
VISUALIZATION – FINAL
PAPER
CSOL 570.FINAL PAPER. CHAD NELLEY
Chad Nelley [email protected]; [email protected]
Abstract A compilation of lab assignments and outputs designed to show practical application and
understanding of a subset of Network Visualization tools and their application.

1
CHAD NELLEY
FINAL PAPER
CSOL570 - Network Visualization
OVERVIEW & INTRODUCTION
In this paper I will summarize and recap all of the various lab activities and outputs from the
Network Visualization Course. Here-in, I will lay out and explain the methodologies and
assessments used to evaluate a subset of network visualization tools
The Objective – Practical Application of Network Visualization tools
As I entered this course, I caveat on the fact that my prior network configuration and
environment build experience in a professional application was 1999. Obviously since then, the
world has changed and the technologies involved have advanced mightily. I experienced a
number of initial set-backs in getting an environment established and stabilized and will show
through this paper and the other assignments for the course my attempts to make good on the
course materials.
Deliverables for this Paper as defined in the Assignment:
Trade studies - describing each of the trade studies you completed during the project and the results of each study.
Virtualized test lab architecture - describing each Virtual Machine (VM), the network connectivity for each VM (e.g., IP addresses/networks) and the role that each VM plays in your test lab.
Your security toolkit - describing the role that each unique security tool (e.g., wireshark, etc) plays in your test lab. This can be a simple table that inventories each tool you have made use of from the Kali Linux install as well as any additional tools you have installed and used throughout the course.
Surveillance and reconnaissance processes - detailing the commands you have used to perform the following actions:
Scan a network to determine the operating systems installed on hosts Perform a dictionary attack against a host’s SSH service Launch an exploit payload against a vulnerable web service Identify the ports listening on a host Eavesdrop on communications between two hosts Identify the SSID of an active wireless network Lessons learned and final thoughts - Detailing what you’ve learned from the labs and how you will use what you’ve learned in your role(s) moving forward.
2
DELIVERABLES:
Trade Studies
For purposes of this course, two separate Trade Studies were conducted. One to compare two
Network Visualization Tools and one to compare two Network Vulnerability Tools to show
proficiency in evaluating and applying the tool outputs against the virtualized test environment
that was built initially to support the Class objectives. Below you will find the detailed outputs of
both Trade Studies and the application outputs as the selected tools were deployed and
implemented in the test environment.
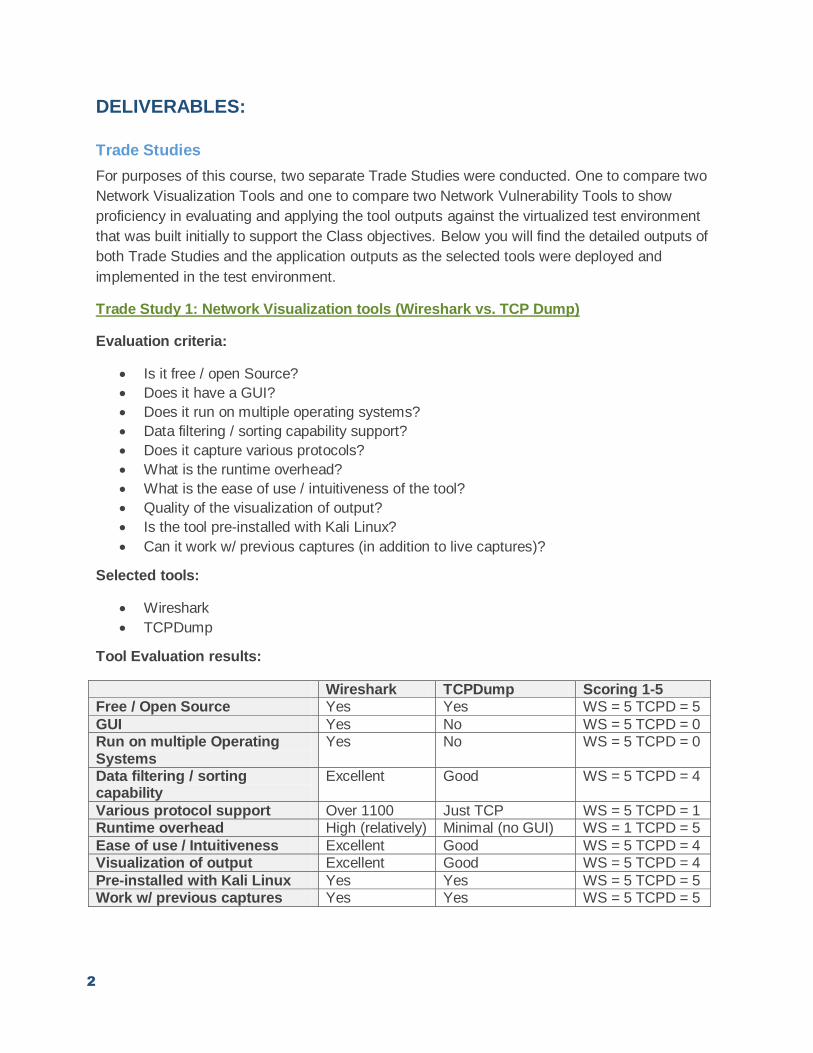
Trade Study 1: Network Visualization tools (Wireshark vs. TCP Dump)
Evaluation criteria:
Is it free / open Source?
Does it have a GUI?
Does it run on multiple operating systems?
Data filtering / sorting capability support?
Does it capture various protocols?
What is the runtime overhead?
What is the ease of use / intuitiveness of the tool?
Quality of the visualization of output?
Is the tool pre-installed with Kali Linux?
Can it work w/ previous captures (in addition to live captures)?
Selected tools:
Wireshark
TCPDump
Tool Evaluation results:
Wireshark TCPDump Scoring 1-5 Free / Open Source Yes Yes WS = 5 TCPD = 5
GUI Yes No WS = 5 TCPD = 0 Run on multiple Operating Systems
Yes No WS = 5 TCPD = 0
Data filtering / sorting capability
Excellent Good WS = 5 TCPD = 4
Various protocol support Over 1100 Just TCP WS = 5 TCPD = 1 Runtime overhead High (relatively) Minimal (no GUI) WS = 1 TCPD = 5
Ease of use / Intuitiveness Excellent Good WS = 5 TCPD = 4 Visualization of output Excellent Good WS = 5 TCPD = 4
Pre-installed with Kali Linux Yes Yes WS = 5 TCPD = 5 Work w/ previous captures Yes Yes WS = 5 TCPD = 5

3
Scoring Rubric:
Wireshark Score = 46/50: Avg 4.6/5 across all categories evaluated
TCP Dump Score = 33/50 Avg 3.3/5 across all categories evaluated
Given the exploratory nature of the assignment, a tool that provided ease of use through a
graphical user interface was a more desirable choice. In addition, to gain an understanding of
all the types of network traffic, a tool that captures and visualizes multiple protocols is more
advantageous. These prioritized characteristics made the selection of Wireshark as the tool of
choice clear.
Wireshark 2.2.5 was already installed on the Kali Linux machine under the Applications /
Sniffing & Spoofing application favorites. This Kali Linux VM was already configured as a
node in the VirtualBox “Host-Only Network” previously set up and depicted in the network
diagram. In order to visualize all traffic on the network, I launched the Wireshark tool. From the
“Welcome to Wireshark” screen, it shows network activity on the single network interface eth0
and the “any” interface. The loopback (lo) interface is also listed. Despite having only one
network interface, I selected “any” just for completeness. The main window of Wireshark then
opens showing a live capture of all (unfiltered) activity on the network.
In order to verify the basic ability to use the tool to selectively filter network traffic of interest, I
applied the filter expression ip.addr == 192.168.56.103 (IP of the Kali Linux VM running
Wireshark) to the live capture. From the Windows system hosting VirtualBox, I pinged the Kali
Linux VM with ping 192.168.56.103. From the Wireshark live capture window I can see the 4
sets of ICMP requests/replies between the host system and the Kali Linux system.
Trade Study 2: Network Vulnerability tools (OpenVAS vs. NESSUS)
Vulnerability scanning tool evaluation criteria:
Is it free / open Source?
Does it have a GUI?
Does it run on multiple operating systems?
What is the ease of use / intuitiveness of the tool?
Quality of the visualization of output?
Is the tool pre-installed with Kali Linux?
Complexity of installation
Compatibility with CVE program
Selected tools:
OpenVAS
NESSUS
Primary resources:
http://www.openvas.org/

4
https://www.tenable.com/products/nessus-vulnerability-scanner
Tool Evaluation results:
OpenVAS NESSUS Score Criteria 1-5 Free / Open Source Yes No OV = 5, N = 0
GUI Yes Yes OV = 4, N = 5 Run on multiple Operating Systems
Yes Yes OV = 3, N = 5
Ease of use / Intuitiveness Fair (Install Complexity)
Good OV = 4, N = 5
Visualization of output Good Good OV = 4, N = 5 Pre-installed with Kali Linux No No OV = 0, N = 0
Installation complexity High Low OV = 2, N = 5 Compatible with CVE program No Yes OV = 0, N = 5
Scoring Rubric:
0-2 = Does not meet criteria
3-4 = Adequately meets criteria for use
5 = Meets or exceeds minimum expectation
Results
NESSUS Avg Score = 3.75 Against all criteria
OpenVAS Avg Score = 2.75 Against all criteria
NESSUS 30 points out of 40 Possible Scored
OpenVAS 22 out of 40 possible Scored
Despite the fact that the NESSUS tool isn’t free/open source software, the overriding reasons
for selecting it were its compatibility with the CVE program and the significantly less complex
installation process. The following 2 resources were used in researching how to install each.
The OpenVAS installation process appeared to have significant opportunity for problems, in
particular, for those not experts in the environment. Additionally, I determined that NESSUS
would be the better tool of choice given its extensive portability to a greater number of OS’s.
Also, given its broader application, NESSUS is also approved for use in internal scanning for
PCI. This adds to the robustness, application and credibility of the tool as it has been approved
for use in the PCI DSS compliance for 11.2.1 requirement. This indicates a commercial grade
quality and further tilts the scale towards the selection of NESSUS. Also, in a corporate
environment, NESSUS offers and management and administrative component, which makes
deployment and scale-ability of the solution all the more feasible across a larger distributed
environment. Based on these elements alone Nessus became the clear winner.

5
NESSUS: http://www.tenable.com/blog/getting-started-with-nessus-on-kali-linux
OpenVAS: https://www.youtube.com/watch?v=HsDXT1P_xak
Lab Architecture
Test lab environment:
The test lab network environment for purposes of this exercise was as depicted below:
Kali-1 (Kali Linux)10.0.2.17
Metasploitable-2 (Ubuntu Linux)
10.0.2.15
Ubuntu-3 (Ubuntu Linux)
10.0.2.16
VirtualBox Host10.0.2.1
VirtualBox “Host-Only Network”DHCP Server: 10.0.2.2Lower Address Bound: 10.0.2.15Uppper Address Bound: 10.0.2.254
Security Tool Kit
While Kali has an extensive library of tools, given my limited experience and dated networking
skills and background, I limited my experimentation in the course to the 4 tools outlined in the
trade studies. Had time prevailed and if time allows in the future, I will definitely familiarize
myself with more of the actual use of the Kali toolset. For purposes of this class the tools used
were OpenVAS, Wireshark, NESSUS and TCPDump.

6
Surveillance and Recon Processes
Utilizing NESSUS to conduct scanning resulted in the following findings as illustrated in the
Week 4 assignment output. Included below are the specific steps I took in installing and running
NESSUS in the lab environment:
Installation of NESSUS:
From Tenable’s NESSUS website at https://www.tenable.com/products/nessus-
vulnerability-scanner I registered for a free 7 day trial of the “Nessus Professional”
product. Apparently because usage of NESSUS on Kali Linux has become fairly
popular, a blog off the site has an entry that specifically addresses “Getting Started with
Nessus on Kali Linux” (http://www.tenable.com/blog/getting-started-with-nessus-on-kali-
linux). I followed the steps verbatim including ensuring that the Kali Linux installation
was up to date via the command:
apt update && apt upgrade. The only deviation from the instructions were that I
downloaded the updated Nessus-6.10.5-debian6_amd64.deb distribution as opposed
to what was stated in the blog post instructions.
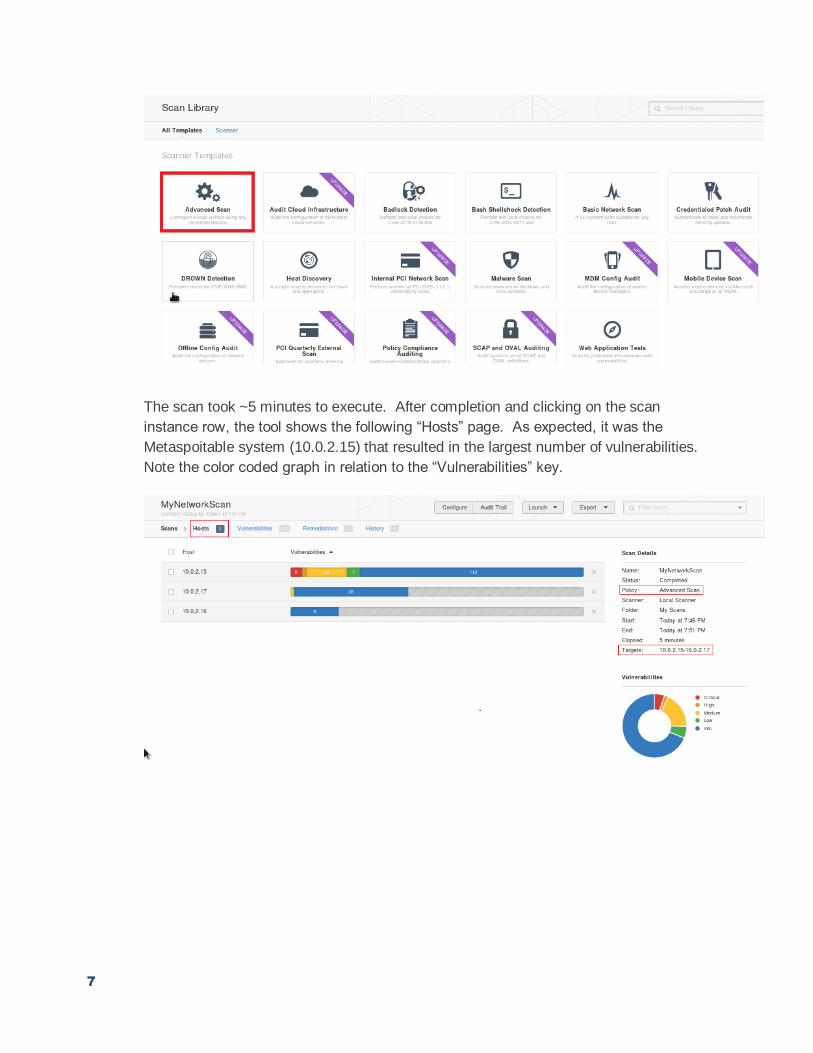
Configuration of NESSUS:
After installation was complete, I pointed the Firefox browser to https://kali.8834/ in order
to access the tool and configure a scan. The UI presents the set of possible scans to
perform as shown below. Of course many of them are inaccessible until you upgrade to
the full product. For this exercise, I exercised the “Advanced Scan”. The only additional
configuration required was to name the scan instance and assign the “Target” of the
scan. This target allows for an IP range so I applied 10.0.2.15-10.0.2.17 to encompass
the 3 systems on the network shown in the diagram above.
7
The scan took ~5 minutes to execute. After completion and clicking on the scan
instance row, the tool shows the following “Hosts” page. As expected, it was the
Metaspoitable system (10.0.2.15) that resulted in the largest number of vulnerabilities.
Note the color coded graph in relation to the “Vulnerabilities” key.

8
The “Vulnerabilities” page then shows each specific vulnerability.
Then the “Remediations” page shows some recommended remediations for the vulnerabilities.
In deploying Wireshark and running configurations and outputs from that tool, here are the
actions and steps I took to garner specific outputs related to network visualization/sniffing.
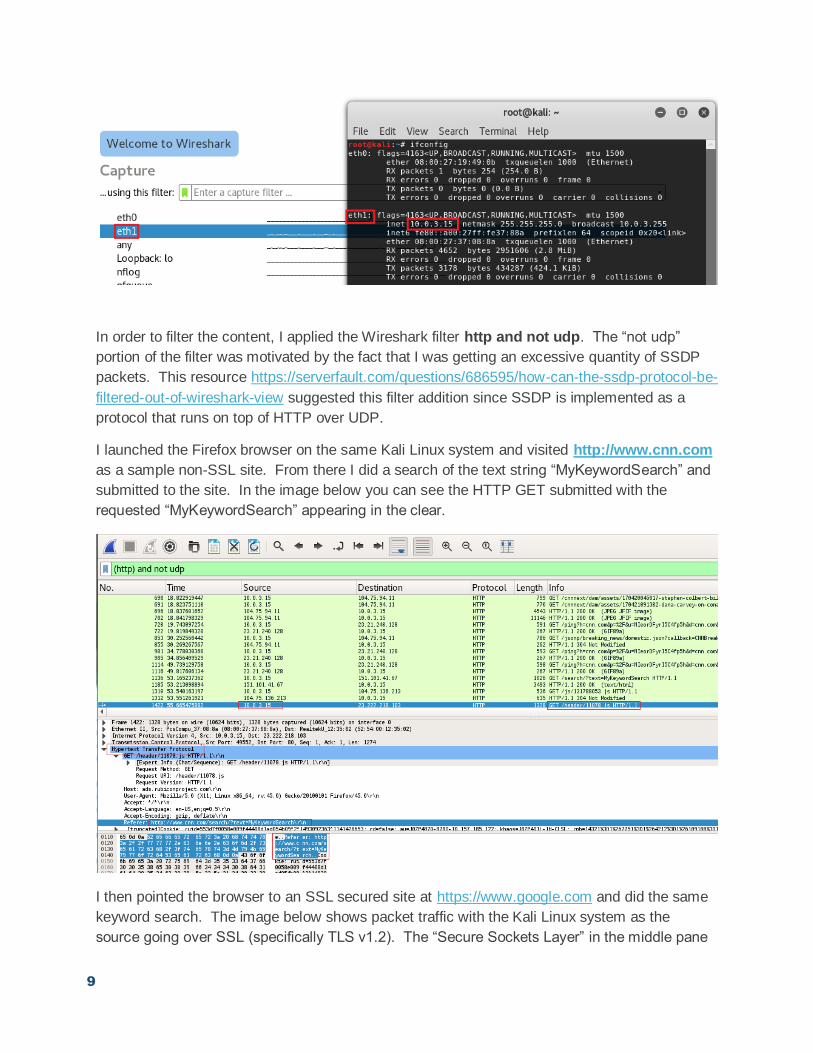
In order to visualize traffic on the network, I launched the Wireshark tool. From the “Welcome to
Wireshark” screen, it shows network activity on the single network interface eth1. I confirmed
that the eth1 interface is associated with IP 10.0.3.15. The main window of Wireshark then
opens showing a live capture of all (unfiltered) activity on the network.
9
In order to filter the content, I applied the Wireshark filter http and not udp. The “not udp”
portion of the filter was motivated by the fact that I was getting an excessive quantity of SSDP
packets. This resource https://serverfault.com/questions/686595/how-can-the-ssdp-protocol-be-
filtered-out-of-wireshark-view suggested this filter addition since SSDP is implemented as a
protocol that runs on top of HTTP over UDP.
I launched the Firefox browser on the same Kali Linux system and visited http://www.cnn.com
as a sample non-SSL site. From there I did a search of the text string “MyKeywordSearch” and
submitted to the site. In the image below you can see the HTTP GET submitted with the
requested “MyKeywordSearch” appearing in the clear.
I then pointed the browser to an SSL secured site at https://www.google.com and did the same
keyword search. The image below shows packet traffic with the Kali Linux system as the
source going over SSL (specifically TLS v1.2). The “Secure Sockets Layer” in the middle pane
https://serverfault.com/questions/686595/how-can-the-ssdp-protocol-be-filtered-out-of-wireshark-view

10
confirms that the traffic is “http-over-TLS”. The Wireshark status pane on the bottom confirms
that the packet payload is encrypted data.
My thoughts on how Wireshark can be used as an effective tool in the security engineers
toolbox. In order to frame this properly, lets first look at the very specific benefits of Wireshark
as a network analysis and sniffing tool:
1. Wireshark is the leading standard for network analysis tools with more than half a million
downloads of it per month. It’s clearly evident that the IT security industry has adopted
WS as a “go-to” tool. This makes it effective as a tool in the “toolbox” for universal
application. As a network security engineer one would want to have knowledge and
practical application ability with this tool.
2. Networking data analysis is all about “packet” analysis. Wireshark focuses on the data
packet analysis. By using a tool like Wireshark a network security engineer will be
looking at what matters most.
3. Wireshark enables proactive analysis. As a network security engineer using Wireshark
will be the best way to have proactive insight as to what is happening on the network
and provide an opportunity to see and mitigate issues before they become widespread.
4. Wireshark is FREE. This will benefit both the network security analyst and the firm. Free,
robust tools are usually an oxymoron – not in this case.

11
5. Protocol Support – Wireshark supports greater than 850 networking protocols. Everyone
knows a tool is only as valuable as its limited or unlimited application constraints. There
are very few network scenarios in which Wireshark cannot be applied to for info
gathering. Universal application is a strong selling point.
Lessons Learned & Final Thoughts
Ultimately, at the end of the day, this course and its outputs helped me dust off and revitalize a
set of skills and applications that I have either never directly worked on or with and has given
me greater insight into the security practitioners world. As an Operations Execuitve with a
background in pure operations and infrastructure and database IT systems – being able to dive
in and use some of the tools that network security professionals use every day has been both
challenging and insightful. It has been both rewarding and eye opening to see what folks at the
front line are dealing with on a regular basis and going through these exercises has taught me
even more to appreciate the struggles of the practitioner. From system crashes, to network
issues, to command line frustrations – this class has definitely helped me better understand the
day-to-day grind that penetration testers, white hat hackers and network engineers are dealing
with and has given insight as to how they cull their data and information. If nothing else, it will
help me better communicate with my Network and infrastructure security teams who are
wrenching on the environment every day.
CONCLUSION
In conclusion, I’d like to thank Professor Hallman and the USD technical staff for their patience
as I worked through the various challenges I was presented at the front end of this course and
for the gracious extension of time granted to get an environment properly established and the
coursework executed. Outputs from this course will be directly applicable to my day-to-day
oversight of the network infrastructure and continuous monitoring policies we have established
at ESET.