ENAVis: Enterprise Network Activities Visualization
16
ENAVis: Enterprise Network Activities Visualization Qi Liao, Andrew Blaich, Aaron Striegel, and Douglas Thain – University of Notre Dame ABSTRACT With the prevalence of multi-user environments, it has become an increasingly challenging task to precisely identify who is doing what on an enterprise network. Current management systems that rely on inferring user identity and application usage via log files from routers and switches are not capable of accurately reporting and managing a large-scale network due to the coarseness of the collected data. We propose a system that utilizes finer-grained data in the form of local context, i.e., the precise user and application associated with a network connection. Through the use of dynamic correlation and graph modeling, we developed a visualization tool called ENAVis (Enterprise Network Activities Visualization). ENAVis aids a real-world administrator in allowing them to more efficiently manage and gain insight about the connectivity between hosts, users, and applications that is otherwise obfuscated, lost or not collected in systems currently deployed in an enterprise setting. Introduction Complex systems are hard to understand and visualize. The causes for this problem are due to the specific data not being available or the inability to cor- relate and present the data in a meaningful and under- standable way. Additionally, the administrator faces an overwhelming amount of data to manage especially on large scale enterprise networks. Network connections ranging from a few hundred to several thousand are generated on a daily basis by each host. Tracking down precisely who (users) and what (applications) are responsible for the generation of this network con- nectivity is a non-trivial task. Administrators need a tool that allows them to sift through massive amounts of traffic logs in a visually appealing and interactive manner that encourages data exploration rather than hindering it. Despite the abundant amount of data available, the coarseness of the data derived from point-to-point logging does not make it particularly useful. The cur- rent logging schemes such as NetFlow [1] data, pro- vide activity details in terms of IP addresses and ports, but are unable to tell which users and what applica- tions are running on the managed network. Since the identity of the traffic flow is important [2], and the users and applications are the essential components of the network, the identity should be associated with the users and applications in addition to the hosts. It is necessary for the context of a connection, i.e., the user and application responsible for the network activity, to be known rather than simply where (address) it came from and went to. Existing solutions to this problem have involved tie-ins of network flow data and authentication systems such as Active Directory [3] and Kerberos [4, 5]. Critically, these existing logging sys- tems are not geared towards real-world system admini- stration. Network flow data will only detail the where of a connection, whereas an Active Directory and Ker- beros tie-in can explain the who. A few visualization and data exploration tools [6, 7] that exist, primarily rely on chaining together network connections based on the flow data. However, multiple hop connections are typically obfuscated due to the nature of network flows; the level of detail supplied is traditionally limited to the IP addresses and port numbers involved. Rather, a method to interactively explore the inter-relationships of the data so as to gain insight as to what is occurring as opposed to inferring, due to lack of log details or time to trace-back and locate the necessary information, is needed. For example, if an account on a network is compromised then it needs to be known what hosts that user account attempted to log into, along with the applications and programs they attempted to run, and files that may have been modified or touched. Knowing exactly who (users) and what (applications), not inferring from IP and port, at both sides of connections is of particular inter- est in policy compliance auditing. Being able to present all of this information in a single visual appeasing and manageable view would be a tremen- dous asset for network administrators. To facilitate solving the above problems, we present ENAVis (Enterprise Network Activities Visual- ization). ENAVis is a tool for visualizing the network activities among hosts/domains, users and applica- tions, which is possible through the gathering of local context information. ENAVis offers interesting, ready- to-use, and invaluable functions for monitoring, visu- alizing, exploring and investigating the activities on a network by real-world network administrators. Through the use of a highly detailed local context data collection system spanning over 300 machines with a mixture of student, faculty and grid computing nodes on the University of Notre Dame’s campus since April 22nd Large Installation System Administration Conference (LISA ’08) 59
Transcript of ENAVis: Enterprise Network Activities Visualization

ENAVis: Enterprise NetworkActivities Visualization
Qi Liao, Andrew Blaich, Aaron Striegel, and Douglas Thain – University of Notre Dame
ABSTRACT
With the prevalence of multi-user environments, it has become an increasingly challengingtask to precisely identify who is doing what on an enterprise network. Current managementsystems that rely on inferring user identity and application usage via log files from routers andswitches are not capable of accurately reporting and managing a large-scale network due to thecoarseness of the collected data. We propose a system that utilizes finer-grained data in the form oflocal context, i.e., the precise user and application associated with a network connection. Throughthe use of dynamic correlation and graph modeling, we developed a visualization tool calledENAVis (Enterprise Network Activities Visualization). ENAVis aids a real-world administrator inallowing them to more efficiently manage and gain insight about the connectivity between hosts,users, and applications that is otherwise obfuscated, lost or not collected in systems currentlydeployed in an enterprise setting.
Introduction
Complex systems are hard to understand andvisualize. The causes for this problem are due to thespecific data not being available or the inability to cor-relate and present the data in a meaningful and under-standable way. Additionally, the administrator faces anoverwhelming amount of data to manage especially onlarge scale enterprise networks. Network connectionsranging from a few hundred to several thousand aregenerated on a daily basis by each host. Trackingdown precisely who (users) and what (applications)are responsible for the generation of this network con-nectivity is a non-trivial task. Administrators need atool that allows them to sift through massive amountsof traffic logs in a visually appealing and interactivemanner that encourages data exploration rather thanhindering it.
Despite the abundant amount of data available,the coarseness of the data derived from point-to-pointlogging does not make it particularly useful. The cur-rent logging schemes such as NetFlow [1] data, pro-vide activity details in terms of IP addresses and ports,but are unable to tell which users and what applica-tions are running on the managed network. Since theidentity of the traffic flow is important [2], and theusers and applications are the essential components ofthe network, the identity should be associated with theusers and applications in addition to the hosts.
It is necessary for the context of a connection, i.e.,the user and application responsible for the networkactivity, to be known rather than simply where (address)it came from and went to. Existing solutions to thisproblem have involved tie-ins of network flow data andauthentication systems such as Active Directory [3] andKerberos [4, 5]. Critically, these existing logging sys-tems are not geared towards real-world system admini-stration. Network flow data will only detail the where of
a connection, whereas an Active Directory and Ker-beros tie-in can explain the who. A few visualizationand data exploration tools [6, 7] that exist, primarilyrely on chaining together network connections based onthe flow data. However, multiple hop connections aretypically obfuscated due to the nature of network flows;the level of detail supplied is traditionally limited to theIP addresses and port numbers involved.
Rather, a method to interactively explore theinter-relationships of the data so as to gain insight asto what is occurring as opposed to inferring, due tolack of log details or time to trace-back and locate thenecessary information, is needed. For example, if anaccount on a network is compromised then it needs tobe known what hosts that user account attempted tolog into, along with the applications and programsthey attempted to run, and files that may have beenmodified or touched. Knowing exactly who (users)and what (applications), not inferring from IP andport, at both sides of connections is of particular inter-est in policy compliance auditing. Being able topresent all of this information in a single visualappeasing and manageable view would be a tremen-dous asset for network administrators.
To facilitate solving the above problems, wepresent ENAVis (Enterprise Network Activities Visual-ization). ENAVis is a tool for visualizing the networkactivities among hosts/domains, users and applica-tions, which is possible through the gathering of localcontext information. ENAVis offers interesting, ready-to-use, and invaluable functions for monitoring, visu-alizing, exploring and investigating the activities on anetwork by real-world network administrators.
Through the use of a highly detailed local contextdata collection system spanning over 300 machines witha mixture of student, faculty and grid computing nodeson the University of Notre Dame’s campus since April
22nd Large Installation System Administration Conference (LISA ’08) 59

ENAVis: Enterprise Network Activities Visualization Liao, et al.
2007, we have collected over 300 GB of raw data anddeveloped ENAVis to allow an administrator to explorethis informative data set.
With ENAVis, the administrator is presented withan array of connectivity graphs and statistics on howthe network is being used. To assist the user in under-standing the many possible visualization modes, weprovide a novel meta-visualization which compactlyrepresents and controls how data is represented. Byadjusting the Host-User-Application (HUA) control,the user may easily expand, contract, and explore avery rich data space in a visually appealing and highlyinteractive manner. Figure 1 illustrates the ENAVisapproach and how it ties into an enterprise network.
Figure 1: Inline (left) vs. end-host (right) monitoring scheme. End-host gatherers the missing local context (user, ap-plication, files, etc.) associated with each network connection.
The key highlights of this paper include:• Data Collection: The light-weight, easy-to-de-
ploy monitoring agent, the Monitor, collects themissing yet important local context information(who, what, when, and where) associated witheach network connection in an enterprise net-work at a very fine level of granularity.
• Graph Model: Our novel hierarchical graphrepresentation of data in terms of domain/hosts,users, and applications (HUA) captures the dy-namic relationship and interaction between ma-chines and user applications.
• Vi s u a l i z a t i o n: An easy-to-use yet powerfulgraphical interface that makes exploration oflarge amounts of network connectivity interac-tive and manageable.
The rest of paper is organized as follows. In thenext section we discuss the objectives of our tool, i.e.,the design principles and desired functions. We empha-size the problems this paper targets and propose our
solutions. We then talk about the design and implemen-tation of the data collection system. Next, the graphmodel in terms of combinations of hosts/domains,users, and applications is presented. Then we examineseveral important cases to demonstrate how the visual-ization tool functions. The design and implementationof functional models of ENAVi s are presented in the fol-lowing section. The related work section compares oursystem with currently existing tools. Finally, we con-clude and suggest future work.
Objectives
It is good practice for administrators to log thesystem events and network activities [8]. However, thelarge amount of data accumulated each day is difficultfor human beings to understand and explore. Visual-ization is therefore an important topic in network andsystem adminstration since it eases the manual processof going through log data and correlate informationand present it in a meaningful way. The objectives ofENAVis is to plot various combinations of the fea-ture/attribute vectors in the log data and provide a cus-tomizable and interactive interface for human auditorsto explore and investigate the activities that occurredon their networks. Most importantly, a unique inter-hosts/users/processes matching capability included inENAVis provides the administrator with intuitive infor-mation on the dependant relationships, which mayhelp many other important problems such as securitytracing and fault localization.
Problem Statement and Solution
There are two problems which we tackle in thispaper. First, there is a lack of tools and data to capturethe user and application level of network activities.
60 22nd Large Installation System Administration Conference (LISA ’08)
Liao, et al. ENAVis: Enterprise Network Activities Visualization
Second, there is also a lack of tools to visualize andcapture the inter-relationships of such data. They arediscussed in more detail below.
In addressing the first problem, administrators donot usually lack for log data for security measurement[7]. However, administrators are facing a dilemma thaton one side is an overwhelming amount of data, but onthe other side many of these data are not at the level ofdetail they would like. Although there are tools to lognetwork activities in either packet or flow format,there is no light-weight mechanism in current practiceto monitor the network at a finer granularity than host-to-host. For example, the network IP addresses in-cluded in the packet header only means locators forthe machines. It tells nothing about the identities ofthe end-users. On the other hand, the transport layer’sport numbers are also less meaningful in determiningthe actual end-processes. While using deep packetinspection requires an understanding of all known pro-tocols, it is still unknown which users and applicationsare sending those data.
Motivated by the observation that the end hosthas full visibility of the user’s processes, our approachto the first problem is to deploy a simple agent on theend hosts to collect these missing local context datafor each network connection. The agent is easy todeploy and lightweight in that it is purely written in abash script that calls commonly available system toolssuch as netstat and ps. Through careful mappingbetween each TCP/UDP socket with the user ID andprocess ID, we associate users and applications witheach network connection. The data is then sent se-curely from each host to a central database server forcorrelation, analysis and audit.
The second problem, independent of data collec-tion mechanism, is how to understand and interpretthe data. The natural question to ask is now that wehave the data, how should we visualize it in a moreintuitive manner? With the amount of workload on abusy system administrator, being able to quicklybrowse through the data, view summary statistics andcharts, and interact with connectivity graphs can helpthem very much.
Visualization is the key to solve the second prob-lem, which is the focus of this paper. It is commonlyrecognized that many of the human errors are due tothe lack of understanding of their domain knowledge.A properly designed human-computer interaction canexpedite data understanding and improve the explo-ration process. Our solution is to develop a powerfulyet friendly graphic user interface that allows the net-work administrators to view their network activities atthe user and application levels in addition to the topol-ogy created by the host connectivity . The design prin-ciples of our system are described in the next section.Design Principles
The target of the system, namely what is to beachieved by this tool, is detailed below:
Know who, what, when and where (4W): Thefundamental motivation of the system is for an admin-istrator to know what is happening on their network,i.e., who (which users) are running what (applications)on where (which hosts) at when (what time). All infor-mation relevant to the connection context needs to berecorded.
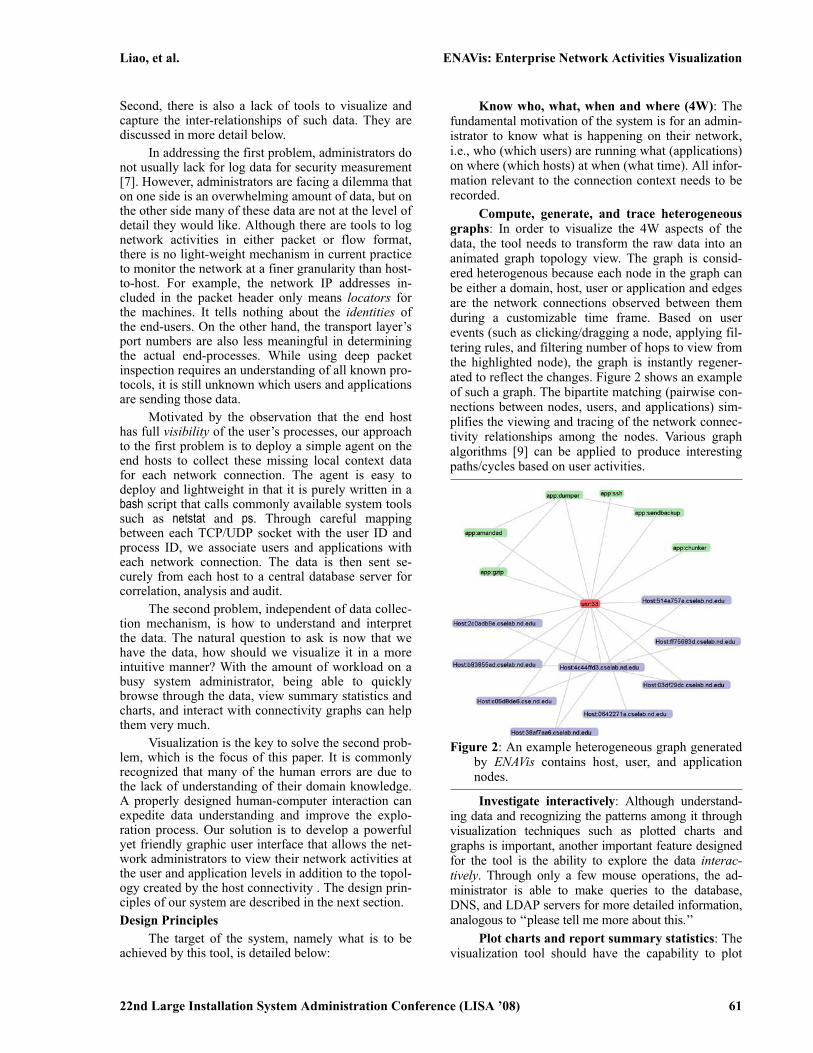
Compute, generate, and trace heterogeneousgraphs: In order to visualize the 4W aspects of thedata, the tool needs to transform the raw data into ananimated graph topology view. The graph is consid-ered heterogenous because each node in the graph canbe either a domain, host, user or application and edgesare the network connections observed between themduring a customizable time frame. Based on userevents (such as clicking/dragging a node, applying fil-tering rules, and filtering number of hops to view fromthe highlighted node), the graph is instantly regener-ated to reflect the changes. Figure 2 shows an exampleof such a graph. The bipartite matching (pairwise con-nections between nodes, users, and applications) sim-plifies the viewing and tracing of the network connec-tivity relationships among the nodes. Various graphalgorithms [9] can be applied to produce interestingpaths/cycles based on user activities.
Figure 2: An example heterogeneous graph generatedby ENAVis contains host, user, and applicationnodes.
Investigate interactively: Although understand-ing data and recognizing the patterns among it throughvisualization techniques such as plotted charts andgraphs is important, another important feature designedfor the tool is the ability to explore the data interac-tively. Through only a few mouse operations, the ad-ministrator is able to make queries to the database,DNS, and LDAP servers for more detailed information,analogous to ‘‘please tell me more about this.’’
Plot charts and report summary statistics: Thevisualization tool should have the capability to plot
22nd Large Installation System Administration Conference (LISA ’08) 61

ENAVis: Enterprise Network Activities Visualization Liao, et al.
charts based on time, host, user, and application infor-mation:
• line chart: useful for viewing number of con-nections for selected domains, hosts, users, andapplications.
• pie chart: useful for determining the percentagethat each host/user/application contributes tothe total traffic generated.
• scatter plot: useful to see the distribution ofconnectivity points with possible combinationof x/y coordinates such as IP addresses, portnumbers, user IDs, and time.The tool would also be able to provide summary
statistics based on the daily log data, such as the topand average hosts, users or applications making themost number of connections, and to produce need-attention reports on demand for an administrator’sreview.
DMZ
Internet
AgentAgent
Agent
Agent
Netstat, ps, lsof
sleep
Agent
Local
disk
/tmp
Database
MySQL
Network Analysis
Parse Data,
Insert, Query...
File Server
XML files
Viewer
LDAP Server
DNS Server
Figure 3: Overview of the system’s architecture shows the monitoring, collecting, analyzing and visualizing of thelocal context from the connections made by users and applications within an enterprise network.
Make it simple, efficient and customizable:Ideally, the tool should be simple yet powerful, usablefor real-world administrators.
• Simplicity: The tool must be easy to use evenfor first-time users. Exploring and viewing net-work activities should consist of only moderatemouse clicks.
• Efficiency: Despite the large amount of dataavailable, if the tool responds too slow it willreduce the user’s experience. We admit it is achallenging task to, upon user’s request, querythe database, download the files, plot charts, andgenerate animated graphs, while keeping efficientuse of the available memory with large data sets.
• Customization: While most users will not need tomodify the base set of views, the ability to cus-tomize via a modular viewer is a powerful fea-ture. Ideally, users would be able to customizetheir configuration and build an environment in
which they are most interested (ex. Top 10Applications, Current Connectivity of HumanResource (HR) Users, Status of Grid ComputeNodes, etc.).Consider future extensibility: One potential
extension for the tool is to analyze the underlying databy applying various data mining and machine learningtechniques. For example, building trees to classify net-work events, or building clusters to group similar userbehaviors, and identifying anomaly based on themodel built. The extension for data mining and anom-aly detection is an ongoing work and will be includedin future releases.
Data Collection
This section describes the type of data we havebeen collecting and gives an overview of the entire sys-tem. It defines and introduces local context. As dis-cussed earlier in the Objectives Section, the first prob-lem we are trying to solve is how to collect the missingcontext, i.e., to capture the user and application level ofnetwork activities (4W). The system we propose tiesthe user and application identities into the enterprisenetwork management by utilizing existing tools (netstat,ps, lsof), which together build a hierarchical gatheringof local context related to network connectivity.System Overview
The data gathering component utilizes commonlyavailable tools in order to take advantage of develop-ment robustness and administrator familiarity. The toolsshould augment the existing data significantly, i.e., notjust another method to report IPflows or SNMP data.
A natural fit for these criterion is the netstat tool,in essence the equivalent of whois for network con-nectivity. Moreover, netstat can be coupled with othertools such as the process table via ps (linking process
62 22nd Large Installation System Administration Conference (LISA ’08)

Liao, et al. ENAVis: Enterprise Network Activities Visualization
ID to the application and arguments) and the open filehandles via lsof (linking the application to files and analternative method for linking the application to con-nection). Each of the tools or equivalent is present bydefault on most major operating systems and each ofthe tools runs with minimal computational cost.
Host Proto Local IP Local Port Foreign IP Foreign Port STATE
32dfdffb tcp 180.83.70.53 33318 180.83.46.242 636 ESTABLISHED57e0a268 tcp 180.83.70.224 9230 162.203.142.116 50942 ESTABLISHED321fc626 tcp 180.83.193.184 43825 180.83.46.242 636 ESTABLISHEDcf58df4b tcp 180.83.21.235 22 242.86.74.143 46688 ESTABLISHEDbb326ee6 tcp 180.83.21.98 39493 180.83.46.242 389 ESTABLISHEDad8a26cf tcp 180.83.41.162 9679 17.11.56.128 0 LISTEN3a677f01 udp 17.11.56.128 40423 17.11.56.128 0 –
Start Stop UID GID i_node PID PPID Direction Application
1178116633 1197926231 104092 40 6875664 30525 30520 1 firefox-bin1177746632 1197926196 108172 40 29494600 16114 4325 2 condor_starter1178046253 1178047203 119100 40 12618336 15863 1 1 mozilla-bin1190653418 1198003091 0 0 5981424 27669 3669 1 sshd:1190607911 1197926168 105273 40 8121972 12901 24139 1 vim1177381883 1177381889 108172 40 25103156 10615 4264 0 condor_starter1177425206 1177867251 0 42 26116251 4365 3771 0 gdm-binary
Path Args
/usr/lib64/firefox-1.5.0.10/firefox-bin -UILocale en-US/afs/nd.edu/user37/condor/software/i386_rhel30/sbin/condor_starter -f macbeth.rcac.purdue.edu/usr/lib/mozilla-seamonkey-1.0.8/mozilla-bin -UILocale en-US/usr/sbin/sshd [accepted]/usr/bin/vim exercise1.c/afs/nd.edu/user37/condor/software/i386_rhel30/sbin/condor_starter -f bach.helios.nd.edu/usr/bin/gdm-binary -nodaemon
Table 1: Sample network connectivity data from the fusion of netstat, ps and lsof (Host names and network addresses areanonymized). Among the fields, HosT, Proto, Local IP, Local Port, Foreign IP, Foreign Port, State, i_node, UID, andPID are from netstat; Application, Args, GID, and PPID are from ps; Path is from lsof; Direction is deduced from pre-vious Listen state; Start and Stop are from diff.
Figure 3 shows an overview of the data gatheringand analyzing architecture. Each host employs themonitoring agent whose purpose is to periodically pollthe tools and push the locally buffered data to therepository for future analysis. The administrator canthen retrieve the data from the repository (or reposito-ries) for the purpose of analysis and forensics from asingle vantage point replete with local context. Thelocal context is defined as the information fully detail-ing a network connection (protocol, src/dst IP/port),user, application, application arguments, and network-related file accesses. The lightweight nature of the sys-tem comes from the fact that it provides local contextwith regards to the presence of connectivity (networkand files), not the content passed in the connectivityitself (data payloads, packet headers, etc.).A Hierarchy for Gathering Local Context
We now briefly describe the three major toolsused in our data gathering system, what each supplies,and how the supplied information can be fused
together to provide a complete view of the local con-text associated with each network connection. Con-ceptually, one can view the data available from thetools and their fused data in terms of tiers. In the basetier, Tier 1 (simple local context), only netstat data isanalyzed. The next tier, Tier 2 (enhanced local con-text), enhances the local context of netstat to offerincreased application information as well as theprocess tree. The final tier, Tier 3 (complete local con-text), offers insight regarding potential informationflow (what files a connected process is touching) and amore precise identification of the application (exactpath, libraries, etc.). An example of the result of thefusion of the data from these three tools as stored inour database is shown in Table 1.1
Tier One (netstat)netstat [10], is the most important command uti-
lized to capture each instance of network connectivityoccurring on the monitored system. In comparison tothe standard rules in the firewall, netstat provides simi-lar information with regards to the connection tuple(protocol, source IP, destination IP, source port, destina-tion port). The State field can be any of the twelve
1For privacy purpose, host names are hashed and IP ad-dresses are mapped by using prefix-preserving anonymiza-tion technique.
22nd Large Installation System Administration Conference (LISA ’08) 63

ENAVi s : Enterprise Network Activities Visualization Liao, et al.
values such as SYN_SENT/RECV, FIN_WAIT, etc., but wefocus on the LISTEN and ESTABLISHED state for TCPconnections.
Tier Two (netstat+ps)ps is the second tier command that is used to sup-
plement the information from netstat. It provides a listof all current running processes. Although the -p flagin netstat provides important information such as theprogram ID/name responsible for each socket, it doesnot provide the whole picture. Through another light-weight tool, the ps [11] command, not only is theapplication name make available, but also the argu-ments provided to the application can be retrieved. Wenote that while lsof tool with -i option provides similarinformation as netstat and ps supply, lsof is not avail-able everywhere and less stable than netstat and ps.
Tier Three (netstat+ps+lsof)The optional lsof [12] command lists each open
file on the current host and provides the third tier ofinformation. By extracting the PID and UID from net-stat and/or ps, a linkage can now be made to what filesare being accessed for the PID responsible for a net-work connection. With the help of lsof, a more accu-rate picture of the application itself can be provided,as noted by the absolute application path (not just theexecuted command), the libraries, and files touched bythe application.
The most interesting aspect of lsof is the discern-ment of an application’s location. From a policy man-agement standpoint, centrally served (ex. NFS/AFSmount) or validated local versions (ex. MD5, SHA1hash) can reduce the ambiguity associated with appli-cations. The notion of classifying according to appli-cation location can offer an additional mechanism forextracting characteristics such as versions of applica-tions. In a broad sense, one could view applications asexisting in one of three forms, user local (local direc-tory or user path), machine local (root-level install, ex./usr/bin), and enterprise served (root-level mounted).The file accesses of the applications noted by lsof canalso be categorized in a similar manner.
Host Config Info
When the agent component initializes for thefirst time, it collects an array of system-wide informa-tion that is sent back to the central administrationserver. The information collected includes:
• Current System Time• Host name and OS version (i.e., uname -a)• Snapshot of /etc/passwd and /etc/group• List of iptable rules (i.e., iptables -L)• Network Interface Parameters (i.e., ifconfig -a)• Hardware info (i.e., /proc/cpuinfo, /proc/meminfo,
/proc/uptime, /proc/version, etc.)• Tool Versions (i.e., netstat --version, ps --version,
lsof -v, etc.)• Any other information that administrators would
like to collect.
ImplementationThe data collection agent was implemented as a
bash script that calls UNIX commands netstat, ps, lsof,and diff periodically. The benefit of implementing theagent as a script is its immediate deployability withoutany special changes to the network or hosts. MySQLserver is set up on an dual-core Opteron box runningSolaris 10 with two 400 GB disks. A parsing programwritten in Java that is used to parse the collected rawdata from each host and is inserted into the databaseusing the Java Database Connectivity (JDBC) inter-face. The structure of the database is composed of aset of tables, each of which stores the output fromeach of the tools as described earlier in this section.
The data collection agent is deployed on 300+machines throughout our campus. The machines are amix of CSE faculties and students office computers,scientific grid computing nodes, and engineering labmachines. The goal was to capture various characteris-tics ranging from manual human interaction to batchjob oriented network connection styles. We have beenrunning data collection over one year since April 2007with a database size of 300 GB. Although the currentstate of the deployed agent utilizes only the Linux ver-sion of these tools, Solaris and Mac OS X versionshave been developed and tested as well, and a nativeWindows agent is under development.
Concerning the cost of agent deployment, theaverage CPU usage of the agents observed on hosts inour engineering computer labs where students may logon via console or ssh peaks at four or five percent onlywhen the agent is awakened to call the netstat, ps, lsofand diff. The empirical data suggests that the config-urable sampling rate of five seconds is a good balanceof granularity of logging and overhead. The memoryusage is bound by the usage of those standard UNIXtools. Concerning the diff output size, lsof has the largestvolume followed by netstat and ps. As stated earlier, theusage of lsof is optional due to its relatively highexpense when compared with netstat and ps. Overall,the average total data size of each host per day is 2.8MB, or in other words less than 1 GB for each moni-tored host per year. Moderate disk space requirementallows for one common 500 GB disk to store all datafor an entire year on a 500-host network. Since theagents push out the data every 15 minutes in our set-ting, the total bandwidth consumption for collectingsuch data is only 120 Kb/s for a monitoring scale of500 hosts (all hosts within the 120 Kb/s), and thereforethe network bandwidth overhead is negligible.
While an event-based model appears more ap-pealing, a bash script that only uses standard UNIXcommands is adopted for fast and easy deploymentwithout any modification to the kernel or recompila-tion for different architectures. On the other hand, ournovel usage of diff output (by comparing previous andcurrent calls) achieves the event-based model to someextent because only the difference is recorded, not all
64 22nd Large Installation System Administration Conference (LISA ’08)
Liao, et al. ENAVis: Enterprise Network Activities Visualization
data. The difference can be interpreted as the begin-ning of a new connection/activity or the end of anexisting connnection/activity. It is understood that thedata collected in this polling scheme may not be per-fect and could miss some transient events such as TCPconnection state changes. The script is also not themost efficient way of logging compared to a compiledbinary program. One of the purposes of the system isto invoke thoughts on what type of data should be col-lected and how ready-to-deploy and widely availabletools can achieve this. It is also possible that we com-bine the reports from the end hosts with the NetFlowdata if we want more accuracy in connection time,direction, packet size, etc. The full visibility at the endhosts provides a richer context (in terms of users andapplications) of network connectivity that is not read-ily available from inline monitoring.
Network Connectivity Graphs
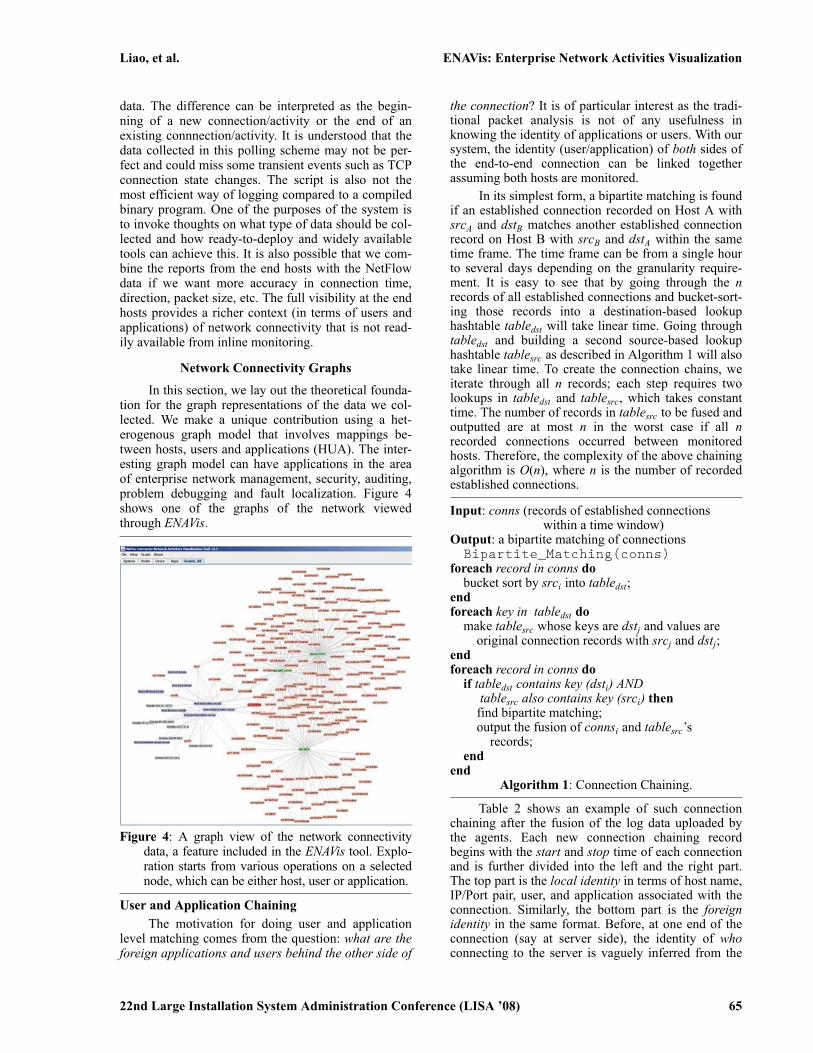
In this section, we lay out the theoretical founda-tion for the graph representations of the data we col-lected. We make a unique contribution using a het-erogenous graph model that involves mappings be-tween hosts, users and applications (HUA). The inter-esting graph model can have applications in the areaof enterprise network management, security, auditing,problem debugging and fault localization. Figure 4shows one of the graphs of the network viewedthrough ENAVis.
Figure 4: A graph view of the network connectivitydata, a feature included in the ENAVi s tool. Explo-ration starts from various operations on a selectednode, which can be either host, user or application.
User and Application Chaining
The motivation for doing user and applicationlevel matching comes from the question: what are theforeign applications and users behind the other side of
the connection? It is of particular interest as the tradi-tional packet analysis is not of any usefulness inknowing the identity of applications or users. With oursystem, the identity (user/application) of both sides ofthe end-to-end connection can be linked togetherassuming both hosts are monitored.
In its simplest form, a bipartite matching is foundif an established connection recorded on Host A withsrcA and dstB matches another established connectionrecord on Host B with srcB and dstA within the sametime frame. The time frame can be from a single hourto several days depending on the granularity require-ment. It is easy to see that by going through the nrecords of all established connections and bucket-sort-ing those records into a destination-based lookuphashtable tabledst will take linear time. Going throughtabledst and building a second source-based lookuphashtable tablesrc as described in Algorithm 1 will alsotake linear time. To create the connection chains, weiterate through all n records; each step requires twolookups in tabledst and tablesrc, which takes constanttime. The number of records in tablesrc to be fused andoutputted are at most n in the worst case if all nrecorded connections occurred between monitoredhosts. Therefore, the complexity of the above chainingalgorithm is O(n), where n is the number of recordedestablished connections.
Input: conns (records of established connectionswithin a time window)
Output: a bipartite matching of connectionsBipartite_Matching(conns)
foreach record in conns dobucket sort by srci into tabledst;
endforeach key in tabledst do
make tablesrc whose keys are dstj and values areoriginal connection records with srcj and dstj;
endforeach record in conns do
if tabledst contains key (dsti) ANDtablesrc also contains key (srci) thenfind bipartite matching;output the fusion of connsi and tablesrc’s
records;end
endAlgorithm 1: Connection Chaining.
Table 2 shows an example of such connectionchaining after the fusion of the log data uploaded bythe agents. Each new connection chaining recordbegins with the start and stop time of each connectionand is further divided into the left and the right part.The top part is the local identity in terms of host name,IP/Port pair, user, and application associated with theconnection. Similarly, the bottom part is the foreignidentity in the same format. Before, at one end of theconnection (say at server side), the identity of whoconnecting to the server is vaguely inferred from the
22nd Large Installation System Administration Conference (LISA ’08) 65

ENAVis: Enterprise Network Activities Visualization Liao, et al.
IP/Port pair (assuming only user A can use that clientmachine). Now, the identity of who is connecting to ahost can be precisely known from the bipartite match-ing (no longer inferred from the IP/Port). Which userand what application are revealed at both sides of con-nection. This is useful in evaluating the effectivenessof the enforcement of the existing policy on the enter-prise network.
Start Stop Location Host IP/Port(proto) User Application
Local 211fba9b 180.83.12.112/631(tcp) 0 cupsdRemote 3a9d336a 180.83.12.178/34406(tcp) 97392 gnome-pdf-view
1177527137 1177527148
Local 211fba9b 180.83.12.112/631(tcp) 0 cupsdRemote 06baa7ef 180.83.12.85/35775(tcp) 92362 gedit
1177543303 1177543309
Local f464cee2 180.83.183.147/54427(tcp) 105464 parrotRemote c9c6e734 180.83.159.14/9094(tcp) 108172 chirp_server
1177448975 1177449026
Local 0642271a 180.83.12.72/40096(tcp) 33 dumper1Remote 38af7aa6 180.83.12.241/33084(tcp) 33 amandad
1177391778 1177391807
Local 0642271a 180.83.12.72/40211(tcp) 33 dumper3Remote 2c0adb9e 180.83.12.172/38429(tcp) 33 gzip
1177392075 1177392151
Local 0642271a 180.83.12.72/40212(tcp) 33 dumper3Remote 2c0adb9e 180.83.12.172/53342(tcp) 33 sendbackup
1177392075 1177392151
Local b83855ad 77.46.16.81/36019(tcp) 317 httpdRemote b83855ad 77.46.16.81/1521(tcp) 27 oracletestdb
1177515292 1177515299
Local c9c6e732 180.83.159.108/9094(tcp) 108172 chirp_serverRemote ad8a26cf 180.83.41.162/49857(tcp) 102744 condor_exec.e
1177610657 1177611222
Local c9c6e733 180.83.159.135/9710(tcp) 108172 condor_scheddRemote ad8a26cf 180.83.41.162/9788(tcp) 108172 condor_startd
1177610633 1177610638
Local c9c6e733 180.83.159.135/9314(tcp) 102744 condor_shadowRemote ff75683d 180.83.12.132/9868(tcp) 108172 condor_starter
1177625404 1177625765
Local af8f7bb2 180.83.12.155/34479(tcp) 97464 sshRemote 633bfecc 180.83.12.167/22(tcp) 0 sshd:root
1177548953 1177548992
Local 06baa7ef 180.83.12.85/34739(tcp) 92362 geditRemote 211fba9b 180.83.12.112/631(tcp) 0 cupsd
1177459056 1177459112
Local 06baa7ef 180.83.12.85/35714(tcp) 0 sshRemote 633bfecc 180.83.12.167/22(tcp) 0 sshd: root
1177541462 1177541473
Table 2: An output example of bipartite matching. Not only are the IP Address and Port known for each establishedconnection, but also the User and Process identity at both ends of the connections now become known (hostnames and network addresses are anonymized here).
Heterogenous Graph ModelOnce we have collected and matched enhanced
connectivity information, the next step is to visualizethe network connections in the form of a graph. How-ever, while we have a rich pool of data containing theentirety of host, user, and application connectivity, it isnot desirable to view all the data at once. For instance,we may only want to view how users are interacting orperhaps would like visualize which application mix isbeing executed and by what hosts. To that end, wehave created a novel control tool based on three corenode characteristics, i.e., hosts, users, and applications(HUA), as illustrated in Figure 5. At the top, we haveH denoting the host level chaining. This is also themost common scenario, in which all the connectivity
Figure 5: A meta graph illustrating the various combi-nations of states (H, U, A, HU, HA, UA, HUA)for modeling our network connectivity graphs. H,U, and A stands for Hosts, Users, and Applica-tions respectively.
between physical end-host machines is constructed. Atthe lower left and right, we have U and A, denotingthe user and application level chaining; this is usefulwhen we want to quickly know which users or appli-cations have been communicating with each other.
The interesting exploration continues when weconsider the various combination of the states shown
66 22nd Large Installation System Administration Conference (LISA ’08)

Liao, et al. ENAVis: Enterprise Network Activities Visualization
H
AU
Figure 6: A HU graph representation showing user 1(U1) on host 1 and 2 (H1, H2) are talking to eachother. Similarly, user 2 (U2) on H1 and user 4(U4) on H2 are talking to each other. The user-level bipartite matching resulting a shortcut paththat forms a simple cycle to distinguish multiuserconnectivity.
H
AU
H
AU
Figure 7: Suppose host 3 (H3) is an external host notrunning the agent and therefore no mappingbetween users on H1 and H3. The top graph hasambiguity between U1 and U2 that connecting toH3. An alternative HU graph representation can beconstructed by removing edge between host nodes.
in Figure 5, namely a heterogenous graph containingthe hosts, users, and applications (HUA). We canimagine a 4D space, where the time, host, user and
application interact with each other. We briefly discussthese graphs below.
H: At a higher layer, we have the host connectiv-ity, basically denoted by traditional IP/port pairsamong servers and clients. Using H only is analogousto a connectivity view offered by NetFlow data.
U: At the middle layer, we have the user connec-tivity, in which we can observe the connectivity rela-tionships among the users. Because multiple users canlog onto the same machine and a single user can logonto multiple machines, by treating an enterprise user(no matter how many physical hosts they have loggedon) as one single entity node, we are able to observethe overall network activities among users.
A: At the bottom layer, we have the applicationconnectivity, in which we can observe the connectivityrelationships among applications. A simple examplewould be which browsers are interacting on myintranet web server (i.e., Firefox 2.0, Internet Explorer7, etc.) without worrying about user-agent spoofing.Similarly, what applications (and their versions) arechecking out licenses from my license server?
HU: The first mix-mode is the interaction be-tween users and hosts. As we said earlier, a user canlog on multiple hosts and a host has multiple userssimultaneously logged in. There are two options forconstructing such HU graphs. First, we simply mergethe H and U graphs. This ‘glue’ process is done by con-structing an edge between the user and the host only ifthat user has made at least one connection on that host.A simple graph example is illustrated in Figure 6.Notice there is no ambiguity in who causes the trafficbetween host 1 and 2 because the connectivity forms asimple cycle (i.e., no vertex is traversed twice) that cov-ers both vertices H1 and H2. For example, we knowuser 2 on host 1 has connections with user 4 on host 2,but user 1 cannot have connections with user 4 becausea simple cycle is not formed. Note that this is only truewhen both host 1 and 2 are running the agents. If thereis an external domain not under our control, there canbe ambiguity in this representation, as shown in Figure7. Therefore, the second graph representation of thedata is constructed by simply removing the edge be-tween hosts, taking the observation that there must auser associated with each connection on a host. Hostnodes can be reached from the user nodes.
HA: Similar to HU, hosts and applications canbe used to construct a connectivity graph when usersare of less concern. Constructing HA graphs is similarto constructing HU graphs.
UA: The concept of location of physical hostsbecomes less relevant as the real players on the net-work are the users and applications. In this case, wecan temporarily filter out H and only leave UAbecause we are more interested in who (users) andwhat (applications) are running on the network. UAgraphs is therefore a perfect choice. Constructing suchgraphs are similar to HU and HA.
22nd Large Installation System Administration Conference (LISA ’08) 67

ENAVis: Enterprise Network Activities Visualization Liao, et al.
HUA: Lastly, building hosts, users and applica-tions into one graph provides the most comprehensiveview as we show in later case studies. Constructingsuch a graph is just merging H, U, A graphs by usinguser nodes as the ‘glue’ for host and applicationnodes, i.e., an edge is drawn between a host and a userand between a user and an application if the user onthat host has made at least one connection using thatapplication. An edge connecting two application nodesrepresents the network connectivity between theirrespective users on two end hosts.
H1 H2 Hn
MRTG
NetFlow
Central auth server (Kerberos)
H1 H2 Hn
U1 U2U3 U4U1
?
ENAVis
Selecttime range
database
Charts / Graphs / Queries
load
trace ssh log
Figure 8: On the left is an example of problem tracingcarried out by a sys admin by hopping throughcentral authentication server log and local hostsssh logs. On the right we show that admin doesnot have to deal with the scale of a distributedsystem. The investigation is a quick, convenient,fixed-step process with mouse-click driven explo-ration.
Application Discussion and Case Studies
We discuss several cases scenarios in whichENAVis can be helpful in local network management.The graphical exploration reduces the tedious, error-prone nature of log checking and mapping down to afew mouse clicks, which makes administrators’ lifemuch easier. With the capability of correlating hosts,users and applications through interacting with HUAgraphs and straightforward statistical charts offered byENAVis, the investigation carried out by the systemand network adminstration can be confined to O(1)steps and does not have to hop through O(n) hosts inscale of a distributed system. Figure 8 illustrates thebenefit of ENAVis visualization.
We will study several cases in detail with sup-porting graphs and data from using the tool. Thesescenarios are
• user and application-level policy compliancecheck;
• find the source of network bandwidth slowness;• investigate and cleanup after user account com-
promise;
Scenario 1: Policy Compliance
The management needs to know whether theiremployees have complied with the company’s networkusage policy with regards to finance information com-pliance. Specifically, the administrator is requested toprovide a report of whether the mechanisms are ade-quate for enforcing the current policy. For this casestudy, consider a financial intranet server whose accesspolicy is defined such that only authorized users canaccess or even see the financial system. To that end, aset of host-based firewall rules are put in place on thefinance server (finance.nd.edu) with restrictions to thehosts of authorized finance personnel (concert.cse.nd.edu, striegel) on the company campus.
Current Approach: First, the admin checks thatthe firewall rules (IP/port) settings are correct for thefinance server through the application of a policy rulevisualization tool such as [13]. Once the rules are vali-dated, the administrator checks the ipfilter log andNetFlow log data to ensure that only authorized hostsaccessed the server. Upon only seeing authorized hostson the list (concert), the admin concludes that the pol-icy is sound and not violated.
ENAVis Approach: Unfortunately, the earlierapproach is only sufficient if the host to user mappingstays consistent, i.e., only user striegel uses the hostconcert.cse.nd.edu. If host to user mapping is dynamicor unclear, the notion of host as identity quicklybreaks down (see Figure 9). Suppose in the same envi-ronment that ssh connectivity was enabled on the net-work. In the scenario of Figure 9, an unauthorized userqliao connects from IrishFB.nd.edu with X11 for-warding to concert.cse.nd.edu and launches an in-stance of firefox to access the finance web server. In amultiuser environment, where multiple users arelogged onto the same machine and make network con-nections, other tools have no way of differentiatingthose connections because the connections all have thesame source IP. Similarly, the legitimate user striegelmay carelessly connect from a Starbucks shop to hisoffice desktop concert in order to access a financialaccount just for convenience. Neither of these twocases is desirable and is a violation of the policybecause the original intent of the policy was that any-one not part of the finance department should not beable to access the finance host.
The tiered graph created with ENAVis includesnodes representing hosts, users and applications, tak-ing advantage of our data which records every UIDand PID associated with each network socket created.Since each connection tuple now is expanded to be{time, proto, src_ip/port, dst_ip/port, usr, app}, we
68 22nd Large Installation System Administration Conference (LISA ’08)
Liao, et al. ENAVis: Enterprise Network Activities Visualization
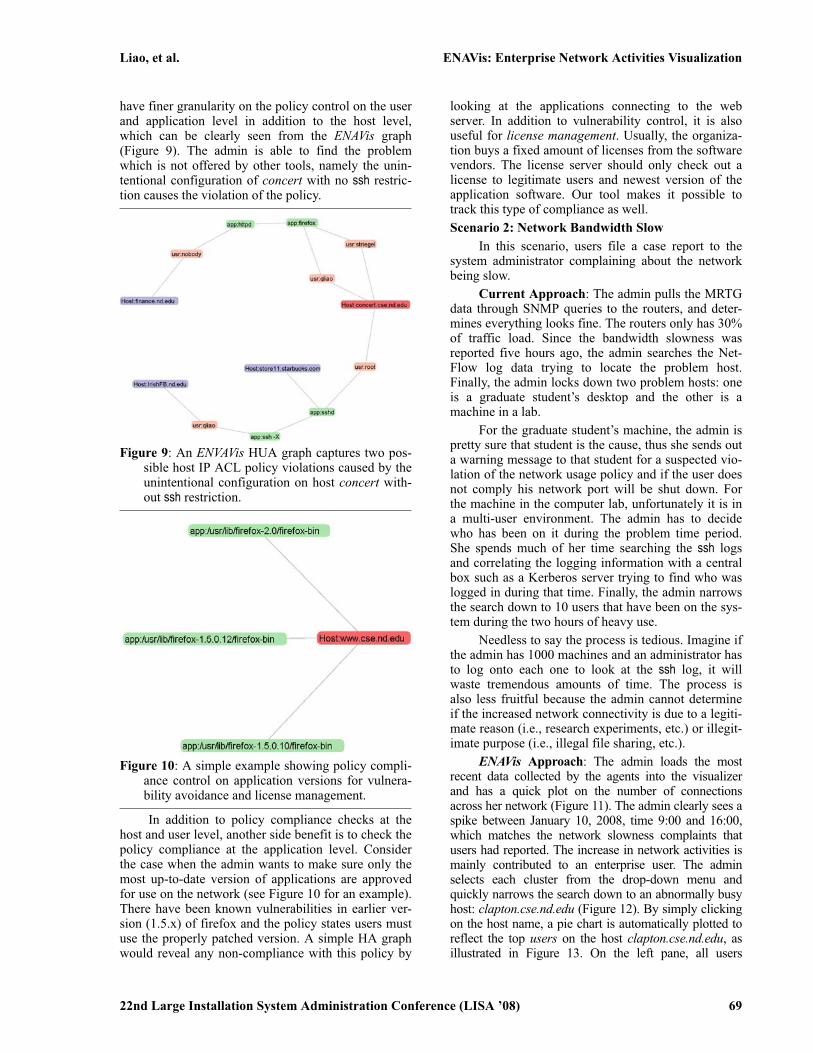
have finer granularity on the policy control on the userand application level in addition to the host level,which can be clearly seen from the ENAVis graph(Figure 9). The admin is able to find the problemwhich is not offered by other tools, namely the unin-tentional configuration of concert with no ssh restric-tion causes the violation of the policy.
Figure 9: An ENVAVis HUA graph captures two pos-sible host IP ACL policy violations caused by theunintentional configuration on host concert with-out ssh restriction.
Figure 10: A simple example showing policy compli-ance control on application versions for vulnera-bility avoidance and license management.
In addition to policy compliance checks at thehost and user level, another side benefit is to check thepolicy compliance at the application level. Considerthe case when the admin wants to make sure only themost up-to-date version of applications are approvedfor use on the network (see Figure 10 for an example).There have been known vulnerabilities in earlier ver-sion (1.5.x) of firefox and the policy states users mustuse the properly patched version. A simple HA graphwould reveal any non-compliance with this policy by
looking at the applications connecting to the webserver. In addition to vulnerability control, it is alsouseful for license management. Usually, the organiza-tion buys a fixed amount of licenses from the softwarevendors. The license server should only check out alicense to legitimate users and newest version of theapplication software. Our tool makes it possible totrack this type of compliance as well.
Scenario 2: Network Bandwidth Slow
In this scenario, users file a case report to thesystem administrator complaining about the networkbeing slow.
Current Approach: The admin pulls the MRTGdata through SNMP queries to the routers, and deter-mines everything looks fine. The routers only has 30%of traffic load. Since the bandwidth slowness wasreported five hours ago, the admin searches the Net-Flow log data trying to locate the problem host.Finally, the admin locks down two problem hosts: oneis a graduate student’s desktop and the other is amachine in a lab.
For the graduate student’s machine, the admin ispretty sure that student is the cause, thus she sends outa warning message to that student for a suspected vio-lation of the network usage policy and if the user doesnot comply his network port will be shut down. Forthe machine in the computer lab, unfortunately it is ina multi-user environment. The admin has to decidewho has been on it during the problem time period.She spends much of her time searching the ssh logsand correlating the logging information with a centralbox such as a Kerberos server trying to find who waslogged in during that time. Finally, the admin narrowsthe search down to 10 users that have been on the sys-tem during the two hours of heavy use.
Needless to say the process is tedious. Imagine ifthe admin has 1000 machines and an administrator hasto log onto each one to look at the ssh log, it willwaste tremendous amounts of time. The process isalso less fruitful because the admin cannot determineif the increased network connectivity is due to a legiti-mate reason (i.e., research experiments, etc.) or illegit-imate purpose (i.e., illegal file sharing, etc.).
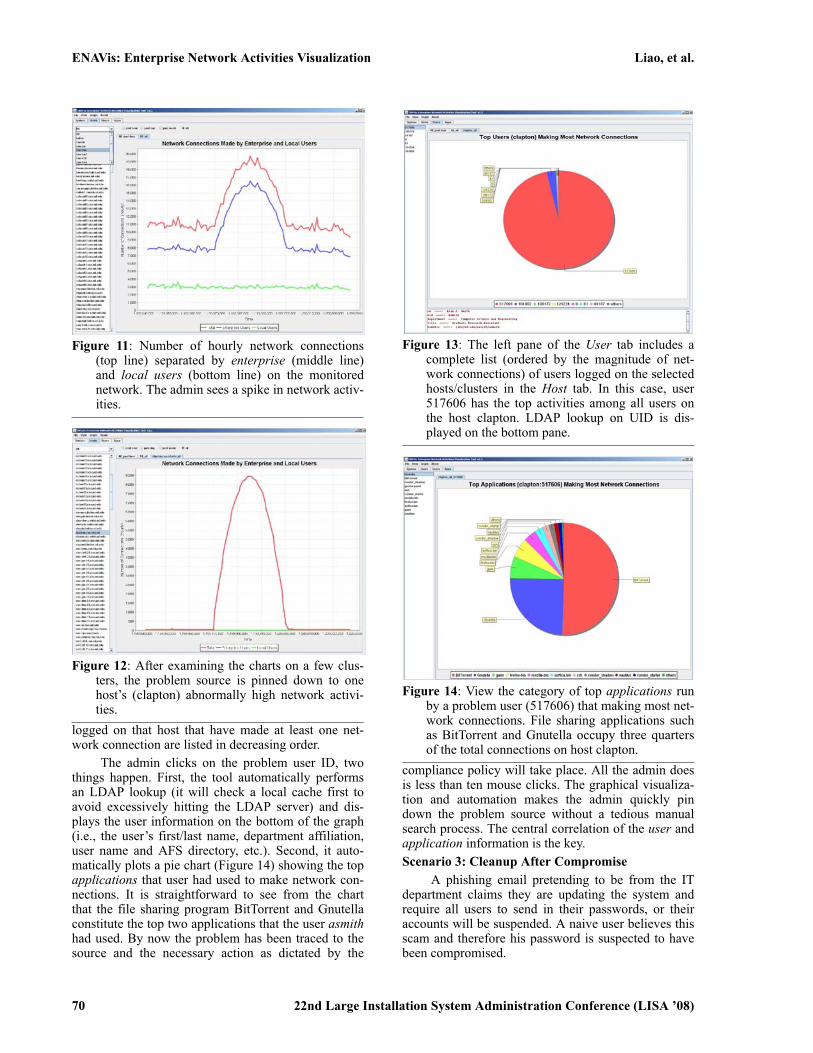
ENAVi s Approach: The admin loads the mostrecent data collected by the agents into the visualizerand has a quick plot on the number of connectionsacross her network (Figure 11). The admin clearly sees aspike between January 10, 2008, time 9:00 and 16:00,which matches the network slowness complaints thatusers had reported. The increase in network activities ismainly contributed to an enterprise user. The adminselects each cluster from the drop-down menu andquickly narrows the search down to an abnormally busyhost: clapton.cse.nd.edu (Figure 12). By simply clickingon the host name, a pie chart is automatically plotted toreflect the top users on the host clapton.cse.nd.edu, asillustrated in Figure 13. On the left pane, all users
22nd Large Installation System Administration Conference (LISA ’08) 69
ENAVis: Enterprise Network Activities Visualization Liao, et al.
Figure 11: Number of hourly network connections(top line) separated by enterprise (middle line)and local users (bottom line) on the monitorednetwork. The admin sees a spike in network activ-ities.
Figure 12: After examining the charts on a few clus-ters, the problem source is pinned down to onehost’s (clapton) abnormally high network activi-ties.
logged on that host that have made at least one net-work connection are listed in decreasing order.
The admin clicks on the problem user ID, twothings happen. First, the tool automatically performsan LDAP lookup (it will check a local cache first toavoid excessively hitting the LDAP server) and dis-plays the user information on the bottom of the graph(i.e., the user’s first/last name, department affiliation,user name and AFS directory, etc.). Second, it auto-matically plots a pie chart (Figure 14) showing the topapplications that user had used to make network con-nections. It is straightforward to see from the chartthat the file sharing program BitTorrent and Gnutellaconstitute the top two applications that the user asmithhad used. By now the problem has been traced to thesource and the necessary action as dictated by the
Figure 13: The left pane of the User tab includes acomplete list (ordered by the magnitude of net-work connections) of users logged on the selectedhosts/clusters in the Host tab. In this case, user517606 has the top activities among all users onthe host clapton. LDAP lookup on UID is dis-played on the bottom pane.
Figure 14: View the category of top applications runby a problem user (517606) that making most net-work connections. File sharing applications suchas BitTorrent and Gnutella occupy three quartersof the total connections on host clapton.
compliance policy will take place. All the admin doesis less than ten mouse clicks. The graphical visualiza-tion and automation makes the admin quickly pindown the problem source without a tedious manualsearch process. The central correlation of the user andapplication information is the key.
Scenario 3: Cleanup After CompromiseA phishing email pretending to be from the IT
department claims they are updating the system andrequire all users to send in their passwords, or theiraccounts will be suspended. A naive user believes thisscam and therefore his password is suspected to havebeen compromised.
70 22nd Large Installation System Administration Conference (LISA ’08)

Liao, et al. ENAVis: Enterprise Network Activities Visualization
Current Approach: The system administratorneeds to find out which hosts the compromised useraccount has used. Have those hosts been compromisedas well? What applications did that user invoke? Whatdata files did this user account touch during the pasttwo weeks since the user revealed his password? Theadmin must make sure the student/faculty’s sensitiveinformation and intellectual property was not leakedfrom the network. In order to do this, the adminchecks a centralized server such as an Active Direc-tory or Kerberos 5’s log file. Fortunately, the log file isstill there, and the admin can then manually searchand find all hosts that user has been trying to log intovia the ssh pluggable authentication modules (PAM).The admin logs into each machine and makes surethey are clean. However, the admin has no idea whatfiles have been read/modified or been sent out toexternal hosts. The admin also does not know whatapplications have been run by that user accountbecause the data is not available.
Figure 15: The HUA network graph reveals a high-lighted user (jdoe) has logged on seven machinesvia ssh and has used the application John the Rip-per to crack password files on those machines.
ENAVis Approach: The admin simply generatesa network graph by selecting the HUA from the graphmenu. The admin highlights the problem user node(jdoe) (as in Figure 15). It is straightforward to seewhich hosts the user has touched during the timeframe and what applications the user used. The fileaccess information logged by lsof is not available toother tools, neither in a centralized authenticationserver nor in the normal end-host’s access logs.Although we do not normally plot the lsof data, eachfile accessed by that user is kept in the master data-base. Therefore, a single query would reveal all filesthat user ID has touched among all the hosts. In thiscase, a visual graph is very helpful to see what hostsand users that a compromised user account has con-tacted and which applications it has attempted to
launch. This helps expedite significantly such aninvestigation should it occur.
Other FunctionalitiesThere are a few other potential uses of the tool,
which we briefly cover here. For example, networkfault localization. By comparing and contrast the dif-ference between a working set and a problem set ofnetwork connectivity graphs, a system administratorwould be able to detect the possible causes of networkfaults. Another example would be forensic auditing.The detailed user activities recorded in database mayprovide evidence when it is needed by some govern-ment agency.
Data mining is another potential use of our toolto detect possible anomalies in the network by invok-ing data mining and machine learning algorithms builtinto the tool (future work). The tool automatically col-ors nodes (hosts, users, applications) based on theclusters. Various classifiers kick in to evaluate the riskscores of the network events. It then generates a reportthat needs the attention or possible action by the man-agement team.
ENAVis: The Visualization Tool
This section describes the implementation offunctions of each module in the viewer2 and how theycan be used to explore the local context of monitorednetworks. The visualization tool was implementedusing Java. The plotting functions utilized JFreeChart[14] and the graph animation was build on top ofPrefuse [15], both are free open-source Java libraries.Time Selection and System Message
As mentioned earlier, the tool should provide aquick summary of the past history, a time windowdefined by the user, and provide extensive reports onstatistics of the hosts, users, and applications. Thestart and stop time of an investigation can either bespecified as the command line arguments or simplyselected from a GUI calendar object within the tool’sinterface. The tool then scans through the local disk tocheck if it already has the data files for the specifiedtime range. If not, those files will be downloaded ondemand in the form of either XML or comma-sepa-rated files at the user’s choice. The ‘‘Update’’ buttoncauses the tool to synchronize with the data file server.
Number of Connections Made By UsersThe ‘‘Hosts’’ tab, shown in Figure 11, presents
an overview picture on the number of network con-nections made by either enterprise users or the localusers. On the left pane, administrator can select a setof predefined physical clusters (or all nodes in the net-work) from a combo box (drop-down list), which inturn propagates a complete list of monitored hostswithin the cluster, where the user can select each spe-cific host to view.
2More information and code available at http://netscale.cse.nd.edu/LockDown .
22nd Large Installation System Administration Conference (LISA ’08) 71
ENAVis: Enterprise Network Activities Visualization Liao, et al.
After selecting which host, cluster, or all moni-tored nodes, the user can further specify the time gran-ularity of investigation by selecting one of the fourradio buttons on top, i.e., ‘‘past hour’’, ‘‘past day’’,‘‘past week’’, or ‘‘all’’. Based on the selection, a linechart is automatically refreshed to reflect the change.The different colors of lines, as indicated in the legendbox at the bottom, indicates whether it is made byenterprise users or the local users. The differentiationof enterprise and local users is through querying theLDAP servers. The query results are cached locally toensure any future lookup on the same UID will not hitthe LDAP server.
Host ConfigurationEach host configuration information can be dis-
played by right-clicking the host name in the list, andchoose ‘‘configuration’’ from the pop-up menu. Thistriggers a query against the database host informationtable that return a complete list of a host’s system sta-tuses collected by the agent. The information currentlystored for each host is: OS type and version, patchlevel, up time, local user and group info, firewall (ipt-able) rules, ethernet and network addresses for eachnetwork interface, hardware (CPU/mem/disk) informa-tion and versions of various system tools; as describedin the Data Collection part of the paper. This function-ality gives a quick and handy way for the system ad-ministrator to view each system status within the toolwithout requiring logging into each machine separately.
Alternative Data ViewWhile graphical visualization is great, the option
of being able to examine the raw data is always handyjust in case the investigator needs to. Therefore, a ta-ble view is provided within the tool interface to dis-play all raw connectivity records.
UsersBased on the various combination of hosts/clus-
ters and time frames selected in the ‘‘Hosts’’ tab, the‘‘Users’’ tab shows a vivid percentage summary as apie chart for the top n users that are making the largestnumber of network connections. Figure 13 is onescreenshot. The bottom frame shows a summary ofuser information: first/last name, netID, AFS homedirectory, department affiliation and job title, whichare pulled from the enterprise LDAP server with thesimilar cache scheme described earlier.
ApplicationsThe investigation flow continues in ‘‘Apps’’ tab
(Figure 14), which shows a classification on the topapplications run by a specific user. The pie chart tells anetwork administrator what is running on his network,e.g., are they mainly web browsers, email clients,printers, office software, or condor batch jobs, etc.?Presumably, different users have different behaviors inchoosing personalized applications for network ac-cesses. This is especially interesting for data miningand anomaly detection.
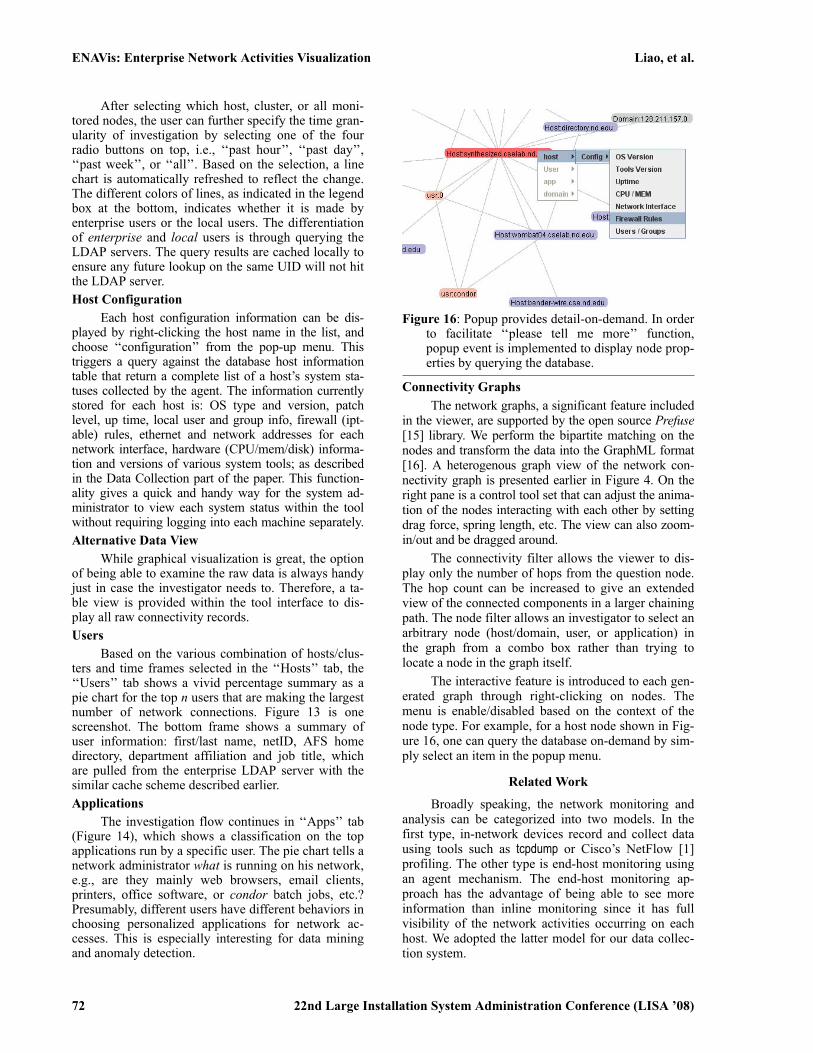
Figure 16: Popup provides detail-on-demand. In orderto facilitate ‘‘please tell me more’’ function,popup event is implemented to display node prop-erties by querying the database.
Connectivity Graphs
The network graphs, a significant feature includedin the viewer, are supported by the open source Prefuse[15] library. We perform the bipartite matching on thenodes and transform the data into the GraphML format[16]. A heterogenous graph view of the network con-nectivity graph is presented earlier in Figure 4. On theright pane is a control tool set that can adjust the anima-tion of the nodes interacting with each other by settingdrag force, spring length, etc. The view can also zoom-in/out and be dragged around.
The connectivity filter allows the viewer to dis-play only the number of hops from the question node.The hop count can be increased to give an extendedview of the connected components in a larger chainingpath. The node filter allows an investigator to select anarbitrary node (host/domain, user, or application) inthe graph from a combo box rather than trying tolocate a node in the graph itself.
The interactive feature is introduced to each gen-erated graph through right-clicking on nodes. Themenu is enable/disabled based on the context of thenode type. For example, for a host node shown in Fig-ure 16, one can query the database on-demand by sim-ply select an item in the popup menu.
Related Work
Broadly speaking, the network monitoring andanalysis can be categorized into two models. In thefirst type, in-network devices record and collect datausing tools such as tcpdump or Cisco’s NetFlow [1]profiling. The other type is end-host monitoring usingan agent mechanism. The end-host monitoring ap-proach has the advantage of being able to see moreinformation than inline monitoring since it has fullvisibility of the network activities occurring on eachhost. We adopted the latter model for our data collec-tion system.
72 22nd Large Installation System Administration Conference (LISA ’08)

Liao, et al. ENAVis: Enterprise Network Activities Visualization
sFlow [17] uses agents on switches/routers to logpackets and send the logs to a central collector foranalyzing. However, the traffic monitoring is at thepacket level, thus missing the local context informa-tion for each connection. Another network traffic datavisualizer is Multi Router Traffic Grapher (MRTG)[18] that monitors router traffic in a graphical formbased on SNMP-enabled devices. There are also a fewother visual analyzers based around using NetFlow’sdata. ISIS [6] is a tool that visualizes temporal rela-tionships among network flow data by using a time-line and event plot. By plotting time in combinationswith IPs, ISIS trys to find correlations between eventsto aid investigations regarding network intrusion. NVi-sionIP and VisFlowConnect-IP [7] have also beendeveloped to visualize NetFlow data. As stated earlier,the key weakness of NetFlow data is the missing userand application information, which we posit is criticalfor enterprise network management.
Visualization techniques have been applied toview static data, such as distributed firewall rules todetect potential conflicts or anomalies. PolicyVis [13]is a visualization tool for inspecting firewall rules. Ithelps detect policy anomalies by plotting IP addressesand port numbers specified by the firewall rules in a2D space and looking for overlap. We are in line withone of their motivations that visual inspection can beuseful in understanding the otherwise complicatedrelationships among this form of data. Instead of visu-alizing policy rules, we visualize the dynamic data,which is the actual network activities made by users’applications. The visual analysis done on the empiricaldata is a substantial and necessary supplement to thestatic rules inspection as a proof of correctness to thepolicy rules.
Beyond the analysis of network data, variousclean slate efforts have attempted to bring identity intothe network flow. Among the re-architecturing at-tempts in the enterprise network, SANE [19] andEthane [20] take a drastic approach in that instead ofusing a traditional layered approach, a single protec-tion layer governs all connectivity within the enter-prise. The enforcement of enterprise-wide securitypolicies is done at the link layer. User authenticationto a centralized server and switch-level source routesare mandatory to access services and end hosts.Within a SANE enterprise, IP address are not used foridentification, location, or routing.
Finally, out of the various related works, perhapsthe works closest to ours are those of [21] and [22]. In[21], the authors propose capturing the inter-dependen-cies among network components in ‘Leslie graphs,’based on the original dependency work of Lamport. The‘‘black-box’’ approach relies on the correlation ofobserved network traffic to infer system dependencies.The agents in their system called AND perform tempo-ral correlation of the packets sent and received by thehosts; where the central server engine performsBayesian inference from the reports generated by the
agents. While these works mainly focus on computingthe dependency graphs for fault localization (i.e.,debugging the location of network failure or sluggishperformance), our system focuses on the lightweightaspects of information gathering and how to visualizenot only connectivity but, the context of the connectiv-ity itself. In short, while these tools help to locatedependency-related performance problems at the host-level in a theoretical sense, ENAVis provides a robustplatform for exploring and visualizing the connectivitydata for a much wider assortment of security and per-formance-related issues.
Conclusion
It is desirable, yet difficult, to know exactly whoand what is running on an enterprise network. In cur-rent network architecture, the identity of user andapplication in network flows is inferred from apacket’s content (i.e., IP addresses and port numbers)rather than directly from the context (user processes)that actually make those connections.
In this paper, we describe a network local contextdata collection system and ENAVi s, an Enterprise Net-work Activities Visualization and analysis tool. In addi-tion to the regular analysis functions provided similarlyby NetFlow and packet monitoring tools, ENAVi s offersinteresting new features of visual analysis on the user’sand application’s level. Connectivity graphs in combi-nations of hosts, users and applications capture thedynamic interactions among these essential componentsin the network, and provide an interactive explorationof the network connection log data. Future work isplanned to incorporate data mining techniques into thetool to aid in automatic analysis of the data.
Acknowledgements
The authors would like to thank Curt Freeland,faculty specialist at CSE department of University ofNotre Dame, for helping deploying the system. Spe-cial thanks to Adam Moskowitz and the anonymousreviewers for their insightful comments.
This work was supported in part by the NationalScience Foundation (CNS-03-47392, CNS-05-49087)as well as a Sun Academic Excellence Grant (AEG)(EDUD-7824-080234-US).
Author Biographies
Qi Liao is a Ph.D. student at the Computer Sci-ence & Engineering department of the University ofNotre Dame. His current research interests includecomputer security, network management, data miningand economic applications on networks and security.He received his master degree in computer scienceand engineering (MSCSE) from the University ofNotre Dame, Indiana. Qi graduated with a B.S. andDepartmental Distinction in Computer Science fromHartwick College, New York, with minor concentra-tion in Mathematics. He is a member of Kappa Mu
22nd Large Installation System Administration Conference (LISA ’08) 73

ENAVis: Enterprise Network Activities Visualization Liao, et al.
Epsilon and Upsilon Pi Epsilon. Reach him at [email protected] .
Andrew Blaich is a Ph.D student at the Universityof Notre Dame’s Computer Science and EngineeringDepartment. His research interests are focused on com-puter security and networking; with current work beingdone on network management. He received his B.S. andM.S. in Computer Engineering from Villanova Univer-sity. Andrew can be reached at [email protected] .
Dr. Aaron Striegel is currently an assistant profes-sor in the Department of Computer Science & Engi-neering at the University of Notre Dame. He receivedhis Ph.D. in December 2002 in Computer Engineeringat Iowa State University under the direction of Dr. G.Manimaran. His research interests include networking(bandwidth conservation, QoS), computer security, gridcomputing, and real-time systems. During his tenure asa student at Iowa State, he worked for various compa-nies in research and development that included SunMicrosystems, Architecture Technology Corporation,and Emerson Process. He has received research andequipment funding from NSF, DARPA, Sun Microsys-tems, Hewlett Packard, Architecture Technology Cor-poration, and Intel. Dr. Striegel was the recipient of anNSF CAREER award in 2004. Dr. Striegel can bereached at [email protected] .
Douglas Thain is Assistant Professor of Com-puter Science and Engineering at the University ofNotre Dame. His research interests focus on harness-ing large scale computing systems such as clusters,clouds, and grids to attack large problems in scienceand engineering. Dr. Thain received the Ph.D. fromthe University of Wisconsin in 2004. He can bereached at [email protected] .
Bibliography
[1] Cisco Systems, ‘‘Introduction to Cisco IOS Net-Flow – A Technical Overview (White Paper),’’October, 2007, http://www.cisco.com/en/US/products/ps6601/prod_white_papers_list.html .
[2] Moskowitz, R. and P. Nikander, ‘‘Host IdentityProtocol (HIP) Architecture,’’ RFC 4423, May,2006.
[3] Microsoft, Planning, Implementing, and Main-taining a Microsoft Windows Server 2003 ActiveDirectory Infrasture, Microsoft Press, 2003.
[4] Neuman, C., T. Yu, S. Hartman, and K. Raeburn,‘‘The Kerberos Network Authentication Service(V5),’’ RFC 4120, July, 2005.
[5] MIT, ‘‘Kerberos: The Network AuthenticationProtocol,’’ 2008, http://web.mit.edu/Kerberos/ .
[6] Pham, D., J. Gerth, M. Lee, A. Paepcke, and T.Winograd, ‘‘Visual Analysis of Network FlowData with Timelines and Event Plots,’’ Workshopon Visualization for Computer Security (VizSEC),Sacramento, CA, pp. 85-99, October 29, 2007.
[7] Yurcik, W., ‘‘Visualizing Netflows for Security atLine Speed: The SIFT Tool Suite,’’ 19th Large
Installation System Administration Conference(LISA ’05), San Diego, CA, p. 16. December 4-9,2005.
[8] Takada, T. and H. Koike, ‘‘MieLog: A HighlyInteractive Visual Log Browser Using Informa-tion Visualization and Statistical Analysis,’’ Pro-ceedings of the 16th USENIX Conference on Sys-tem Administration (LISA ’02), Philadelphia, PA,pp. 133-144, November 3-8, 2002.
[9] Cormen, T. H., C. E. Leiserson, R. L. Rivest, andC. Stein, Introduction to Algorithms, second edi-tion, MIT Press and McGraw-Hill, 2001.
[10] netstat(8), Linux Programmer ’s Manual.[11] ps(1), Linux User’s Manual.[12] Abell, V., LiSt Open Files (lsof), Open-Source,
UNIX Administrative Tool, ftp://lsof.itap.purdue.edu/pub/tools/unix/lsof/ .
[13] Tran, T., E. Al-Shaer, and R. Boutaba, ‘‘Poli-cyVis: Firewall Security Policy Visualization andInspection,’’ 21st Large Installation System Ad-ministration Conference (LISA ’07), Dallas, TX,pp. 1-16, November 11-16, 2007.
[14] JFreeChart, ‘‘Free Java Chart Library,’’ http://www.jfree.org/jfreechart/ .
[15] Prefuse, ‘‘The Prefuse Visualization Toolkit,’’http://prefuse.org/ .
[16] GraphML, ‘‘The graphml File Format,’’ http://graphml.graphdrawing.org/ .
[17] sFlow, ‘‘Traffic Monitoring Using sFlow,’’ 2003,http://www.sflow.org/sFlowOverview.pdf .
[18] Oetiker, T., ‘‘MRTG – The Multi Router TrafficGrapher,’’ 12th Systems Administration Confer-ence (LISA ’98), Boston, MA, pp. 141-147, De-cember 6-11, 1998.
[19] Casado, M., T. Garfinkel, A. Akella, M. J. Freed-man, D. Boneh, N. McKeown, and S. Shenker,‘‘SANE: A Protection Architecture for EnterpriseNetworks,’’ 15th USENIX Security Symposium,Vancouver, Canada, p. 10, July, 2006.
[20] Casado, M., M. Freedman, J. Pettit, J. Luo, N.McKeown, and S. Shenker, ‘‘Ethane: Taking Con-trol of the Enterprise,’’ Proceedings of ACM SIG-COMM, Kyoto, Japan, pp. 1-12, 2007.
[21] Bahl, P., P. Barham, R. Black, R. Chandra, M.Goldszmidt, R. Isaacs, S. Kandula, L. Li, J. Mac-Cormick, D. A. Maltz, R. Mortier, M. Wawrzo-niak, and M. Zhang, ‘‘Discovering Dependenciesfor Network Management,’’ ACM SIGCOMM 5thWorkshop on Hot Topics in Networks (Hotnets-V), Irvine, California, pp. 97-102, November 29and 30, 2006.
[22] Bahl, P., R. Chandra, A. Greenberg, S. Kandula,D. A. Maltz, and M. Zhang, ‘‘Towards HighlyReliable Enterprise Network Services via Infer-ence of Multi-Level Dependencies.’’ ACM SIG-COMM Computer Communication Review, Vol.37, Num. 4, pp. 13-24, 2007.
74 22nd Large Installation System Administration Conference (LISA ’08)