ENAVis: Enterprise Network Activities Visualization Qi Liao, Andrew Blaich, Aaron Striegel, and...
25
ENAVis: Enterprise Network Activities Visualization Qi Liao, Andrew Blaich, Aaron Striegel, and Douglas Thain Department of Computer Science & Engineering University of Notre Dame cse.nd.ed u
-
Upload
blake-cain -
Category
Documents
-
view
218 -
download
0
Transcript of ENAVis: Enterprise Network Activities Visualization Qi Liao, Andrew Blaich, Aaron Striegel, and...

ENAVis: Enterprise Network
Activities Visualization
Qi Liao, Andrew Blaich, Aaron Striegel, and Douglas Thain
Department of Computer Science & Engineering
University of Notre Dame
cse.nd.edu

Problem
04/19/2322nd Large Installation System Administration
Conference (LISA '08), Nov. 9-14, 2008. San Diego, CA 2
Complex systems are hard to understand and visualize.
Plenty of micro-level tools Host level (syslog, ssh log, etc) Network level (MRTG, Netflow, etc)
Need macro-level picture of network Not just in raw network connectivity Need to know:
Who (users) are responsible What (applications) are running on the network.

Context vs. Content
04/19/2322nd Large Installation System Administration
Conference (LISA '08), Nov. 9-14, 2008. San Diego, CA 3
NetFlow & sFlow Analyzer
Who?
What?
Packet content (protocol:IP
address:port number)
local context (Network
connection, user, application, arguments, file accesses)

Host
ENAVis
04/19/23
Users
4
Applications
22nd Large Installation System Administration Conference (LISA '08), Nov. 9-14, 2008. San Diego, CA

IP/Port ≠ User/App
Logging usually in form of Network addresses User identity Port numbers Application identity
Network addresses and port numbers are NOT good identifier for network activities
Two problems: Lack of a mechanism to collect this missing
Local Context. Lack of a tool to correlate the huge amount of
local context data. Visually and interactively explore the data. Visualization is the key.
04/19/2322nd Large Installation System Administration
Conference (LISA '08), Nov. 9-14, 2008. San Diego, CA 5
Highlights
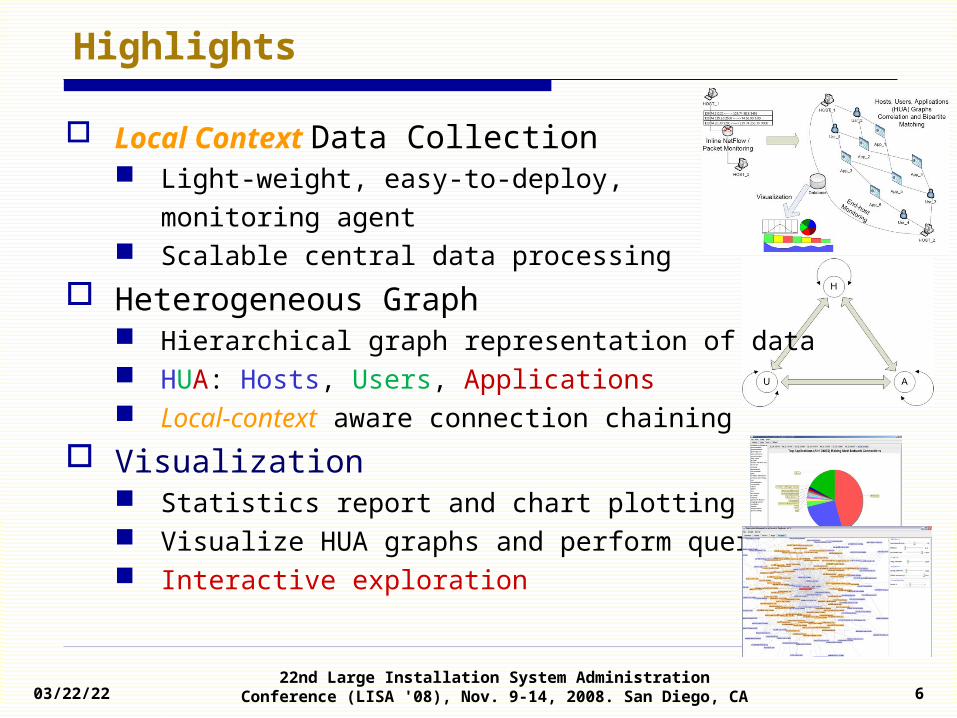
Local Context Data Collection Light-weight, easy-to-deploy,
monitoring agent Scalable central data processing
Heterogeneous Graph Hierarchical graph representation of data HUA: Hosts, Users, Applications Local-context aware connection chaining
Visualization Statistics report and chart plotting Visualize HUA graphs and perform queries Interactive exploration
04/19/2322nd Large Installation System Administration
Conference (LISA '08), Nov. 9-14, 2008. San Diego, CA 6
Data Collection
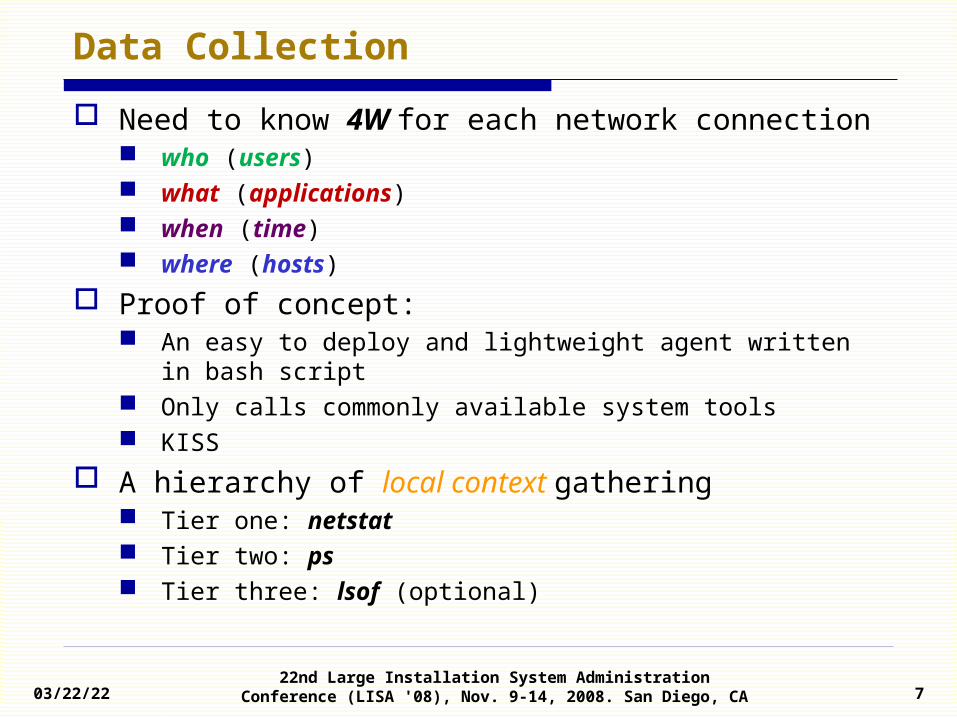
Need to know 4W for each network connection who (users) what (applications) when (time) where (hosts)
Proof of concept: An easy to deploy and lightweight agent written in
bash script Only calls commonly available system tools KISS
A hierarchy of local context gathering Tier one: netstat Tier two: ps Tier three: lsof (optional)
04/19/2322nd Large Installation System Administration
Conference (LISA '08), Nov. 9-14, 2008. San Diego, CA 7
Built-in System Tools
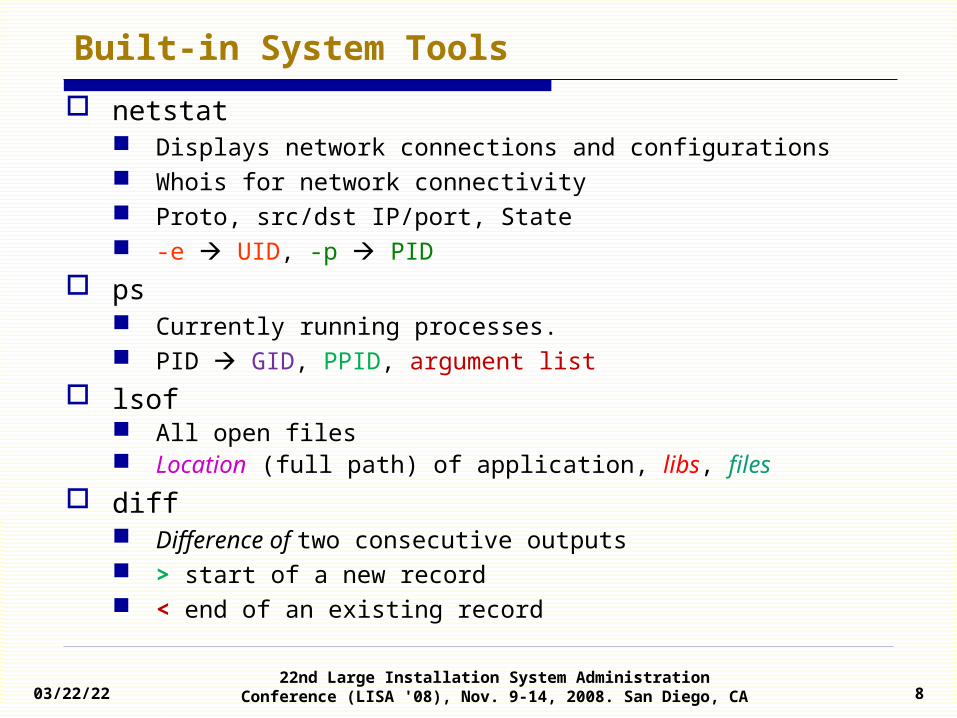
netstat Displays network connections and configurations Whois for network connectivity Proto, src/dst IP/port, State -e UID, -p PID
ps Currently running processes. PID GID, PPID, argument list
lsof All open files Location (full path) of application, libs, files
diff Difference of two consecutive outputs > start of a new record < end of an existing record
04/19/2322nd Large Installation System Administration
Conference (LISA '08), Nov. 9-14, 2008. San Diego, CA 8

Directories/files structure
04/19/2322nd Large Installation System Administration
Conference (LISA '08), Nov. 9-14, 2008. San Diego, CA 9
days
hosts

Agent Performance
300+ machines on our campus since April 2007 Over 400 GB data Mix of CSE faculty / students, scientific grid,
engineering lab. Linux, Solaris, Mac OS X, (Windows) CPU
<100 ms CPU time every 5 sec (2%)
Bandwidth Total data size sent to the server: < 3 MB / day 1000 hosts: 240 Kbps
04/19/2322nd Large Installation System Administration
Conference (LISA '08), Nov. 9-14, 2008. San Diego, CA 10

Server Performance
Disk Sun Fire X2100, AMD Opteron dual core (2.2GHz), 2
GB SDRAM, 1TB SATA disk. 1000 hosts, window size = one year: 1 TB disk 300 hosts, window size = past month: 30 GB
Processing Time
Up to 4500hosts
04/19/2322nd Large Installation System Administration
Conference (LISA '08), Nov. 9-14, 2008. San Diego, CA 11

HUA Graph Model
04/19/2322nd Large Installation System Administration
Conference (LISA '08), Nov. 9-14, 2008. San Diego, CA 12
Heterogeneous graph 4D space
Hosts, Users, Applications (HUA), Time A meta-graph illustrating states
Host-to-Host(similar to Netflow)
Application-to-ApplicationUser-to-User
Host-to-User Host-to-App
User-to-App

Example: HU graph
A HUA graph uses “User” nodes to glue “Host” and “Application”
nodes use “Application” nodes to glue local and remote parties.
04/19/2322nd Large Installation System Administration
Conference (LISA '08), Nov. 9-14, 2008. San Diego, CA 13

Identities Linking
Perform connection chaining and bipartite matching. Mapping src/dst identifiers in O(n) time.
Allow explicit identity linking between any pair of nodes. User and Application identities is no longer inferred from
host addresses or port numbers.
04/19/2322nd Large Installation System Administration
Conference (LISA '08), Nov. 9-14, 2008. San Diego, CA 14
Implementation
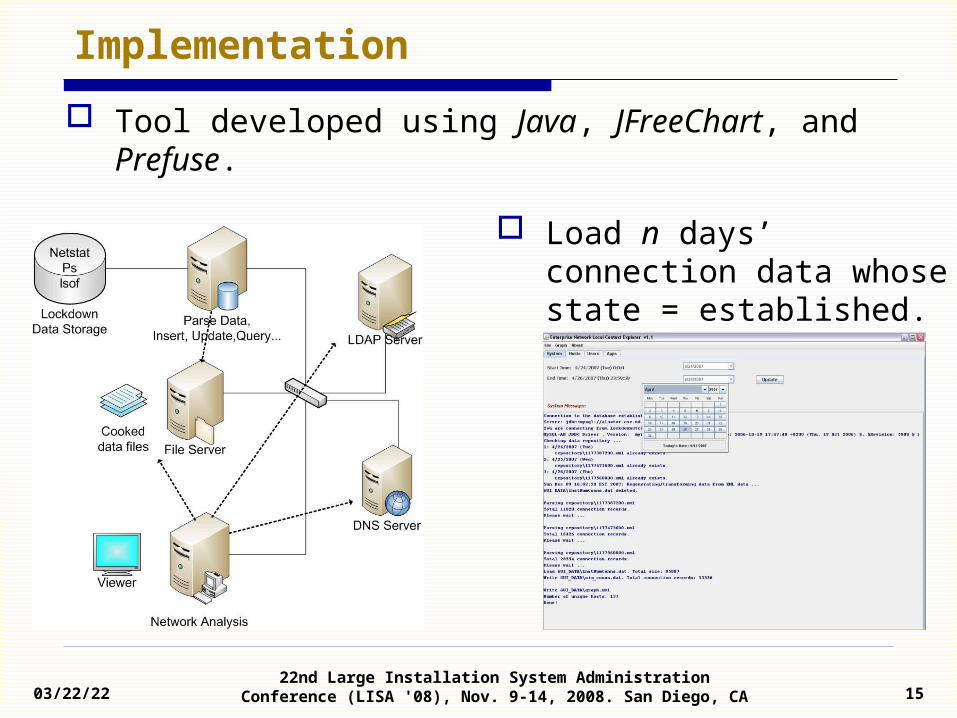
Tool developed using Java, JFreeChart, and Prefuse.
04/19/2322nd Large Installation System Administration
Conference (LISA '08), Nov. 9-14, 2008. San Diego, CA 15
Load n days’ connection data whose state = established.

Graph View
04/19/2322nd Large Installation System Administration
Conference (LISA '08), Nov. 9-14, 2008. San Diego, CA 16
Monitored hosts
Users
Apps
External Domains
hops
Node selection
Graph controls
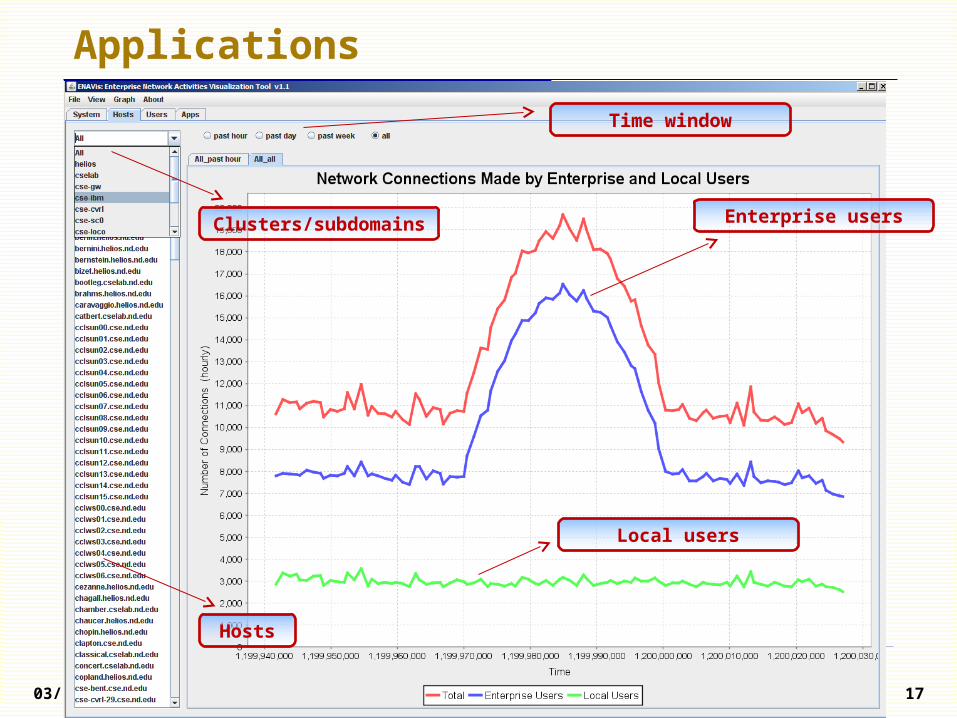
Applications
04/19/2322nd Large Installation System Administration
Conference (LISA '08), Nov. 9-14, 2008. San Diego, CA 17
Clusters/subdomains
Hosts
Time window
Enterprise users
Local users

Applications
04/19/2322nd Large Installation System Administration
Conference (LISA '08), Nov. 9-14, 2008. San Diego, CA 18
Top Users
User IDs
User Info

Applications
04/19/2322nd Large Installation System Administration
Conference (LISA '08), Nov. 9-14, 2008. San Diego, CA 19
Application Names
Top Apps

Applications
04/19/2322nd Large Installation System Administration
Conference (LISA '08), Nov. 9-14, 2008. San Diego, CA 20
Finance System
Trusted Host
Violation 1
Violation 2

Summary
04/19/2322nd Large Installation System Administration
Conference (LISA '08), Nov. 9-14, 2008. San Diego, CA 21
Centralized correlation and visualization make life easier for admins
Augmented local-context data (Users and Applications), which are not available in existing schemes.
Traditional approach
ENAVis approach

Conclusion
It is important to know who is responsible and what is running on an enterprise network.
Local-context (users and applications) is useful. Network management, security policy auditing, fault
localization, forensic, etc. ENAVis:
Collects, fuses, and visualizes the missing local-context data.
Interesting HUA network connectivity graph. Interactive exploration tool.
Future works Windows agent as a service Data mining modules built into the tool.
04/19/2322nd Large Installation System Administration
Conference (LISA '08), Nov. 9-14, 2008. San Diego, CA 22
Acknowledgements
This work was supported in part by the National Science Foundation (CNS-03-47392,
CNS-05-49087), as well as Sun Academic Excellence Grant (AEG) (EDUD-
7824-080234-US).
04/19/2322nd Large Installation System Administration
Conference (LISA '08), Nov. 9-14, 2008. San Diego, CA 23

Visit http://netscale.cse.nd.edu/Lockdown/
04/19/2322nd Large Installation System Administration
Conference (LISA '08), Nov. 9-14, 2008. San Diego, CA 24
Thank You !Thank You !

Demo
04/19/2322nd Large Installation System Administration
Conference (LISA '08), Nov. 9-14, 2008. San Diego, CA 25