
Network PlaNNiNg 2015 - Amazon...
20
NETWORK PLANNING 2015 Exclusive insight, powered by data from the Flightglobal portfolio Visit us on booth N229 Top 100 airlines African aviation focus World’s leading airports Infographics and analysis flightglobal.com
Transcript of Network PlaNNiNg 2015 - Amazon...

Network PlaNNiNg
2015Exclusive insight, powered by data from the Flightglobal portfolio
Visit us on booth N229
Top 100 airlines
African aviation focus
World’s leading airports
Infographics and analysis
flightglobal.com

Network PlaNNiNg 2015
coNteNtS
about us 3
airlines Airlines keep steady traffic pace 5Top 100 passenger operations 6 Focus on African airlines 8
airports The world’s top airports (traffic) 12Top 10 African airports 14Building African capacity 15Airport analysis: focus on growth 16The world’s top 20 airport groups (revenue) 17

Flightglobal | 3
Find out more at:flightglobal.com
about us
Flightglobal connects professionals to intelligence and data across aerospace, aircraft finance and air transport. Powered by the world’s most comprehensive fleets data, aircraft values and airline schedules, Flightglobal delivers intelligence, analysis and insight to drive the strategies of leading aviation companies, enabling them to generate growth, find new opportunities and make informed investment decisions.
Flightglobal now includes Innovata, a leading source of airline schedules data covering more than 800 carriers worldwide, providing our customers with unparalleled schedules data.
Flightglobal provides insight and analysis to drive growth:
Analysis toolsFlexible data feeds
Mapping solutions
Schedule dataNew and ceased routes
Airline intelligence
flightglobal.com
Visit us on booth N229 to find out more about us and to pick up a copy of Airline Business magazine, the leading journal for senior airline executives

Network PlaNNiNg 2015
daShboard ad
Illustration shows conceptual data only
Professionals in aviation and aerospace rely on Flightglobal to inform business opportunitiesin route development and market growth through its unique combination of fleets, aircraftschedules data, airline and traffic data, together with news, analysis and insights.
With access to the dashboard you can:
Identify areas for expansion with new and ceased routes information
Map and analyse current, historic and future routes and review how a potential new route would work within your existing network
Stay informed with the latest news on airline fleet and network plans, route launches and alliance developments
Find out more at flightglobal.com/dashboard or visit us at booth N49
From industry trends to detailed routes and airline data, Flightglobal can help you to build your growth strategy
FG-Dashboard.qxp_AmerAirlines-Advert-197x267-FINAL 08/09/2014 15:38 Page 1
Find out more at flightglobal.com/dashboard or visit us at booth N229

Flightglobal | 5
Find out more at:flightglobal.com
flightglobal.com/airlines July-August 2015 | Airline Business | 39
world airline rankings traffic
Qan
tas
Chin
a So
uthe
rn
Am
eric
an A
irlin
es
Star Alliance
SkyTeam
Oneworld
Unaligned
Del
ta A
ir L
ines
Uni
ted
Air
lines
Am
eric
an A
irlin
es
Emir
ates
Sout
hwes
t
Luft
hans
a
Air
Fra
nce
Bri
tish
Air
way
sCh
ina
East
ern
Chin
a So
uthe
rn
US
Air
way
s
Am
eric
an A
irlin
es
Luft
hans
a
Uni
ted-
Cont
inen
tal
Del
ta A
ir L
ines
Air
Fra
nce-
KLM
FedE
x
IAG
Emir
ates
Sout
hwes
t A
irlin
es
Qan
tas
Chin
a So
uthe
rnA
ir C
hina
AN
A
Chin
a Ea
ster
n
LATA
M
Japa
n A
irlin
es
Cath
ay P
aci�
c
Sing
apor
e A
irlin
esA
ir C
anad
a
Kor
ean
Air
Turk
ish
Air
lines
Aer
o�ot
Etih
ad A
irw
ays
Easy
Jet
Qat
ar A
irw
ays
Am
eric
an A
irlin
es
Luft
hans
a
Uni
ted-
Cont
inen
tal
Del
ta A
ir L
ines
Air
Fra
nce-
KLM
FedE
x
IAG
Emir
ates
Sout
hwes
t A
irlin
esQ
anta
s
Chin
a So
uthe
rnA
ir C
hina
AN
A
Chin
a Ea
ster
nLA
TAM
Japa
n A
irlin
esCa
thay
Pac
i�c
Sing
apor
e A
irlin
esA
ir C
anad
aK
orea
n A
irTu
rkis
h A
irlin
esA
ero�
ot
Rya
nair
Thai
Air
way
s
Qat
ar A
irw
ays
(REVENUE)
traffic (RPKm)
Star Alliance
SkyTeam
Oneworld
Unaligned
Luft
hans
a
Uni
ted-
Cont
inen
tal
Del
ta A
ir L
ines
Air
Fra
nce-
KLM
FedE
x
AM
R
IAG
Emirat
es
AN
A
Sout
hwes
t
Air
Chi
na
US
Airw
ays
LATA
M
Sing
apor
e A
irlin
es
Air C
anad
a
Turk
ish
Air
lines
Aer
o�ot
Qat
ar
$194bnEurope
$10bn
Africa
Air C
hina
Chin
a So
uthe
rn
Japa
n A
irlin
esCh
ina
East
ern
Sing
apor
e A
irlin
es
Kor
ean
Air
Thai
Airw
ays
Luft
hans
a
Air
Fra
nce-
KLM
IAG
Turk
ish
Air
lines
Aer
o�ot
Easy
Jet
LATA
M
Uni
ted-
Cont
inen
tal
Del
ta A
ir L
ines
FedE
xSo
uthw
est
Air
lines
Air
Can
ada
$219bn
NorthAmerica
$32bn
LatinAmerica
$52bn
MiddleEast
$197bn
Asia-Paci�c
$43bn $8bn
Rya
nair
Air
Chi
naCa
thay
Pac
i�c
Sing
apor
e A
irlin
esA
ir C
anad
aK
LM
Qan
tas
Turk
ish
Air
lines
Qat
ar A
irw
ays
Kor
ean
Air
Easy
Jet
AN
ATh
ai A
irw
ays
TAM
203,299 RPKm 54,003 RPKm
Japa
n A
irlin
es
$2,344m $253m
Uni
ted
Air
lines
Am
eric
an A
irlin
es
Emir
ates
Sout
hwes
t A
irlin
es
Luft
hans
a
Air
Fra
nce
Bri
tish
Air
way
s
Chin
a Ea
ster
n Ch
ina
Sout
hern
US
Air
way
s
Rya
nair
Air
Can
ada
Qat
ar A
irw
ays
Etih
ad A
irw
ays
LATA
M
6.3%Europe
2.0%Africa
3.0%
NorthAmerica
5.0%
LatinAmerica
11.5%
MiddleEast
17.0%
Asia-Paci�c
Del
ta A
ir L
ines
Air
Chi
na
AN
A
Emir
ates
Rya
nair
Turk
ish
Air
lines
US
Air
way
s Ch
ina
Sout
hern
U
PS
Luft
hans
a Ch
ina
East
ern
Sout
hwes
t Fe
dEx
Ala
ska
Air
Ea
syJe
tA
ir C
anad
aCo
pa A
irlin
esA
irA
sia
JetB
lue
Wes
tJet
Aer
o�ot
Hai
nan
Air
lines
Av
ianc
a Th
omso
n
Japa
n A
irlin
es
Del
ta A
ir L
ines
Air
Chi
na
AN
A
Emir
ates
Rya
nair
Turk
ish
Air
lines
US
Air
way
s
Chin
a So
uthe
rn
UP
S
Luft
hans
a
Chin
a Ea
ster
n
Sout
hwes
t Fe
dEx
Ala
ska
Air
Ea
syJe
tA
ir C
anad
a
Copa
Air
lines
Air
Asi
a
JetB
lue
Wes
tJet
Aer
o�ot
Hai
nan
Air
lines
Avia
nca
Thom
son
$5.9bn
Europe
$0.2bn
Africa
$17.2bn
NorthAmerica
$1.7bn
LatinAmerica
$1.16bn
MiddleEast
$3.3bn
Asia-Paci�c
Japa
n A
irlin
esA
ir C
hina
AN
A
Chin
a So
uthe
rn
Chin
a Ea
ster
n Ca
thay
Pac
i�c
Hai
nan
Air
lines
Emir
ates
IAG
Turk
ish
Air
lines
Luft
hans
a
Rya
nair
Easy
Jet
Thom
son
Air
way
s
Copa
Air
lines
LATA
M
Am
eric
an A
irlin
es
Del
ta A
ir L
ines
Uni
ted
Cont
inen
tal
Sout
hwes
t A
irlin
es
operating profit
Emir
ates
Qat
ar A
irw
ays
Turk
ish
Air
lines
KLM
Easy
Jet
Aer
o�ot
Del
ta A
ir L
ines
Cath
ay P
aci�
c
Sing
apor
e A
irlin
es
Air
Chi
na
Qan
tas
Kor
ean
Air
AN
A
Thai
Air
way
s
Uni
ted
Air
lines
Am
eric
an A
irlin
esSo
uthw
est
Air
lines
US
Air
way
sA
ir C
anad
a
Del
ta A
ir L
ines
Qan
tas
Cath
ay P
aci�
c
Cath
ay P
aci�
cSi
ngap
ore
Air
lines
Air
Chi
na
Qan
tas
Kor
ean
Air
Chin
a So
uthe
rnCh
ina
East
ern
All
Nip
pon
Air
way
s
AN
A
Chin
a Ea
ster
n Ja
pan
Air
lines
Cath
ay P
aci�
c K
orea
n A
irQat
ar A
irw
ays
Emir
ates
Etih
ad
FedE
xA
lask
a A
ir
Air
Can
ada
JetB
lue
Wes
tJet
Airlines keep steady traffic paceANALYSIS BY flightglobAl insight DATA COMPILED BY silvA ishAk FLIGHTGLOBAL DATA RESEARCH
Global passenger traffic among the 150 leading carriers increased 6% in 2014, the latest Airline Business World Airline Rankings show. This was slightly ahead of the capacity added and helped lift collective load factors to 80.5%
top 150 pAssenger Airline stAtistics by region: 2014
region passenger traffic (rpk) load factors passenger numbers employeeMillion change (%) percent pt change Million change (%) share (%)
Africa 104,530 2.0 68.8 -1.5 42 6.3 3.8Asia Pacific 1,765,358 7.0 77.9 -0.4 930 7.4 35.0Europe 1,694,832 6.3 82.3 0.4 830 6.5 23.4Latin America 285,489 5.6 80.0 1.9 202 5.4 5.8Middle East 528,300 11.5 78.2 0.8 147 11.1 7.8North America 1,536,863 3.0 83.4 0.3 813 2.9 24.3totAl 5,915,370 6.0 80.5 0.2 2,964 5.9 100.0NOTE: Based on returns to the latest Top 150 airlines ranking
top 150 pAssenger Airline stAtistics by Airline type: 2014
Airline type passenger traffic (rpk) load factors passenger numbers employeeMillion change (%) percent pt change Million change (%) share (%)
Leisure 219,073 4.5 88.3 -0.4 79 3.6 1.7Low-cost 992,794 10.0 83.3 1.6 758 8.2 11.2Mainline 4,606,395 5.3 79.5 -0.2 2,015 5.4 84.9Regional 97,109 2.8 81.1 1.7 113 1.5 2.3totAl 5,915,370 6.0 80.5 0.2 2,964 5.9 100.0NOTE: Based on returns to the latest Top 150 airlines ranking
Qan
tas
Chin
a So
uthe
rn
Am
eric
an A
irlin
es
Star Alliance
SkyTeam
Oneworld
Unaligned
Del
ta A
ir L
ines
Uni
ted
Air
lines
Am
eric
an A
irlin
es
Emir
ates
Sout
hwes
t
Luft
hans
a
Air
Fra
nce
Bri
tish
Air
way
sCh
ina
East
ern
Chin
a So
uthe
rn
US
Air
way
sAm
eric
an A
irlin
es
Luft
hans
a
Uni
ted-
Cont
inen
tal
Del
ta A
ir L
ines
Air
Fra
nce-
KLM
FedE
x
IAG
Emir
ates
Sout
hwes
t A
irlin
esQ
anta
s
Chin
a So
uthe
rnA
ir C
hina
AN
A
Chin
a Ea
ster
nLA
TAM
Japa
n A
irlin
esCa
thay
Pac
i�c
Sing
apor
e A
irlin
esA
ir C
anad
aK
orea
n A
irTu
rkis
h A
irlin
esA
ero�
ot
Rya
nair
Thai
Air
way
s
Qat
ar A
irw
ays
Am
eric
an A
irlin
es
Luft
hans
a
Uni
ted-
Cont
inen
tal
Del
ta A
ir L
ines
Air
Fra
nce-
KLM
FedE
x
IAG
Emir
ates
Sout
hwes
t A
irlin
esQ
anta
s
Chin
a So
uthe
rnA
ir C
hina
AN
A
Chin
a Ea
ster
nLA
TAM
Japa
n A
irlin
esCa
thay
Pac
i�c
Sing
apor
e A
irlin
esA
ir C
anad
aK
orea
n A
irTu
rkis
h A
irlin
esA
ero�
ot
Rya
nair
Thai
Air
way
s
Qat
ar A
irw
ays
(REVENUE)
traffic (RPKm)
Star Alliance
SkyTeam
Oneworld
Unaligned
Luft
hans
a
Uni
ted-
Cont
inen
tal
Del
ta A
ir L
ines
Air
Fra
nce-
KLM
FedE
x
AM
R
IAG
Emirat
es
AN
A
Sout
hwes
t
Air
Chi
naUS
Airw
ays
LATA
M
Sing
apor
e A
irlin
es
Air C
anad
a
Turk
ish
Air
lines
Aer
o�ot
Qat
ar
$200bnEurope
$14bn
Africa
Air C
hina
Chin
a So
uthe
rn
Japa
n A
irlin
esCh
ina
East
ern
Sing
apor
e A
irlin
es
Kor
ean
Air
Thai
Airw
ays
Luft
hans
a
Air
Fra
nce-
KLM
IAG
Turk
ish
Air
lines
Aer
o�ot
Rya
nair
Emir
ates
Q
atar
Air
way
s
LATA
M
Uni
ted-
Cont
inen
tal
Del
ta A
ir L
ines
FedE
x
Sout
hwes
t A
irlin
es
Air
Can
ada
$216bn
NorthAmerica
$35bn
LatinAmerica
$53bn
MiddleEast
$200bn
Asia-Paci�c
$41bn $6bn
Rya
nair
Air
Chi
naCa
thay
Pac
i�c
Sing
apor
e A
irlin
esA
ir C
anad
aK
LM
Qan
tas
Turk
ish
Air
lines
Qat
ar A
irw
ays
Kor
ean
Air
Easy
Jet
AN
ATh
ai A
irw
ays
TAM
203,299 RPKm 54,003 RPKm
Japa
n A
irlin
es
$2,344m $253m
Uni
ted
Air
lines
Am
eric
an A
irlin
es
Emir
ates
Sout
hwes
t A
irlin
es
Luft
hans
aA
ir F
ranc
eB
riti
sh A
irw
ays
Chin
a Ea
ster
n Ch
ina
Sout
hern
US
Air
way
s
Rya
nair
Air
Can
ada
Qat
ar A
irw
ays
LATA
M
5.5%Europe
2.0%
Africa
1.9%
NorthAmerica
5.7%
LatinAmerica
10.6%
MiddleEast
7.7%
Asia-Paci�c
Del
ta A
ir L
ines
Air
Chi
na
AN
A
Emir
ates
Rya
nair
Turk
ish
Air
lines
US
Air
way
s Ch
ina
Sout
hern
U
PS
Luft
hans
a Ch
ina
East
ern
Sout
hwes
t Fe
dEx
Ala
ska
Air
Ea
syJe
tA
ir C
anad
aCo
pa A
irlin
esA
irA
sia
JetB
lue
Wes
tJet
Aer
o�ot
Hai
nan
Air
lines
Av
ianc
a Th
omso
n
Japa
n A
irlin
es
Del
ta A
ir L
ines
Air
Chi
na
AN
A
Emir
ates
Rya
nair
Turk
ish
Air
lines
US
Air
way
s
Chin
a So
uthe
rn
UP
S
Luft
hans
a
Chin
a Ea
ster
n
Sout
hwes
t Fe
dEx
Ala
ska
Air
Ea
syJe
tA
ir C
anad
a
Copa
Air
lines
Air
Asi
a
JetB
lue
Wes
tJet
Aer
o�ot
Hai
nan
Air
lines
Avia
nca
Thom
son
$2,637m
Europe
-$160m
Africa
$8,106m
NorthAmerica
$2,637m
LatinAmerica
$939m
MiddleEast
$8,087m
Asia-Paci�c
Japa
n A
irlin
es
Air
Chi
na
AN
A
Chin
a So
uthe
rn
Chin
a Ea
ster
n A
irA
sia
Hai
nan
Air
lines
Emir
ates
Rya
nair
Turk
ish
Air
lines
Luft
hans
a A
ero�
otTh
omso
n
Copa
Air
lines
Avia
nca
Del
ta A
ir L
ines
US
Air
way
s U
PS
Sout
hwes
t Fe
dEx
Ala
ska
Air
Ea
syJe
tA
ir C
anad
aJe
tBlu
e W
estJ
et
operating profit
Emir
ates
Qat
ar A
irw
ays
Turk
ish
Air
lines
KLM
Easy
Jet
Aer
o�ot
Del
ta A
ir L
ines
Cath
ay P
aci�
c
Sing
apor
e A
irlin
es
Air
Chi
na
Qan
tas
Kor
ean
Air
AN
A
Thai
Air
way
s
Uni
ted
Air
lines
Am
eric
an A
irlin
esSo
uthw
est
Air
lines
U
S A
irw
ays
Air
Can
ada
Del
ta A
ir L
ines
Qan
tas
Cath
ay P
aci�
c
Cath
ay P
aci�
c
Sing
apor
e A
irlin
es
Air
Chi
na
Qan
tas
Kor
ean
Air
AN
ATh
ai A
irw
ays
Chin
a So
uthe
rnCh
ina
East
ern
AN
A
Chin
a Ea
ster
n Ja
pan
Air
lines
Cath
ay P
aci�
c K
orea
n A
irTh
ai A
irw
ays
KEy
Regional traffic changes are based on RPKs for the top 150 airlines
top 20 Airline groups by trAffic
rank Airline group rpk (m)
1 Delta Air Lines 326,4652 American Airlines Group 314,8023 United-Continental Holdings 288,0364 Emirates Airline 235,4985 Air France-KLM Group 229,3476 Lufthansa Group 214,6417 IAG 202,5628 Southwest Airlines 173,8299 China Southern Airlines Group 166,62910 Air China 154,68311 China Eastern Airlines 127,63712 Ryanair 120,00013 Cathay Pacific Group 112,25714 Qantas Group 109,65915 LATAM Airlines Group 108,53416 Turkish Airlines 106,78717 Singapore Airlines Group 99,95218 Air Canada 99,14019 Aeroflot 90,07520 Qatar Airways 95,977
ABU_170715_039.indd 39 10/07/2015 16:35
airliNeS keeP Steady traffic Pace

Network PlaNNiNg 2015
toP 100 PaSSeNger oPeratioNS
flightglobal.com/airlines40 | Airline Business |
world airline rankings traffic
top 150 passenger operations
July-August 2015
Top passenger operaTions ranked by Traffic 2014: 1 To 50
ranking airline country passenger traffic (rpk) seat capacity (ask) Load factor passenger number fleet
2014 (2013) Million change (%) Million change (%) percent pt change Million change (%) current
1 (1) Delta Air Lines USA 326,465 4.1 385,642 3.0 84.7 0.9 171.4 4.1 796 2 (2) United Airlines USA 288,036 0.2 344,495 0.5 83.6 -0.2 91.5 0.2 707 3 (3) Emirates Airline UAE 235,498 9.4 295,740 9.1 79.6 0.2 49.3 10.7 234 4 (4) American Airlines USA 208,108 0.7 253,576 2.0 82.1 -1.0 88.0 1.2 964 5 (5) Southwest Airlines USA 173,829 3.4 210,785 0.4 82.5 2.4 135.8 2.0 670 6 (6) Lufthansa Germany 156,826 2.3 197,478 1.9 79.4 0.3 77.5 1.7 276 7 (8) British Airways UK 138,431 5.4 170,917 5.9 81.0 -0.4 41.5 3.9 262 8 (9) China Southern Airlines China 135,637 11.4 168,530 11.3 80.5 0.1 77.9 9.6 491 9 (7) Air France est France 134,000 -1.8 162,500 -1.7 82.5 -0.1 47.0 -1.8 231 10 (10) China Eastern Airlines China 127,637 6.0 160,600 5.6 79.5 0.3 83.9 6.0 289 11 (13) Ryanair est Ireland 120,000 15.7 136,000 8.5 88.2 5.5 90.5 10.8 323 12 (12) Air China China 112,495 7.9 145,924 13.7 77.1 -4.1 54.6 5.0 333 13 (16) Turkish Airlines Turkey 106,787 16.1 135,330 16.3 78.9 -0.1 54.7 13.3 247 14 (11) US Airways USA 106,679 0.2 128,579 2.6 83.0 -2.0 57.6 0.9 15 (15) Cathay Pacific Hong Kong 100,048 6.8 118,481 5.8 84.4 0.8 22.3 4.2 143 16 (17) Air Canada Canada 99,140 8.5 118,887 7.8 83.4 0.6 38.5 7.7 167 17 (19) Qatar Airways Qatar 95,977 16.4 126,767 15.5 75.7 0.6 22.3 14.9 161 18 (14) Singapore Airlines Singapore 94,209 -0.9 119,674 -0.7 78.7 -0.2 18.7 0.6 105 19 (18) KLM Netherlands 91,477 2.7 105,755 1.9 86.5 0.7 27.7 4.4 112 20 (21) All Nippon Airways Japan 74,221 8.4 109,698 7.0 67.7 0.9 50.4 2.9 190 21 (23) EasyJet UK 72,933 7.9 79,525 7.1 91.7 0.7 64.8 6.6 216 22 (20) Qantas Australia 71,270 -2.3 91,270 0.4 78.1 -2.1 22.1 -2.0 118 23 (28) Etihad Airways UAE 68,600 23.6 85,792 20.7 79.2 1.2 14.8 22.3 112 24 (22) Korean Air South Korea 67,948 -0.6 90,980 2.1 74.7 -2.0 23.5 -0.5 162 25 (25) Aeroflot Russia 67,122 11.4 85,822 12.3 78.2 -0.6 23.6 13.0 160 26 (27) JetBlue Airways USA 60,842 5.5 72,395 5.1 84.0 0.4 32.1 5.3 208 27 (26) TAM Linhas Aereas Brazil 60,247 1.7 72,715 -2.2 82.9 3.2 37.9 1.5 162 28 (24) Thai Airways International Thailand 56,377 -11.2 81,652 -4.7 69.0 -5.1 17.8 -17.4 80 29 (29) Japan Airlines Japan 52,890 7.6 72,960 8.2 72.5 -0.4 28.2 17.2 157 30 (32) Saudia Saudi Arabia 51,782 10.1 67,848 4.3 76.3 4.0 27.4 8.3 161 31 (30) Air Berlin Germany 49,270 1.4 59,031 3.1 83.5 -1.4 31.7 0.6 98 32 (34) LAN Airlines est1 Chile 48,250 2.7 57,500 0.9 83.9 1.5 30.0 1.7 82 33 (33) Transaero Airlines Russia 47,066 0.1 56,367 0.2 83.5 -0.1 13.2 5.6 98 34 (31) Malaysia Airlines Malaysia 46,375 -1.9 62,570 7.2 74.1 -6.9 17.0 -1.0 97 35 (43) Hainan Airlines China 45,072 36.2 51,742 34.3 87.1 1.2 25.4 37.3 139 36 (35) Alaska Airlines USA 44,695 6.1 52,180 6.6 85.7 -0.4 21.0 6.3 139 37 (36) Iberia Spain 42,686 2.9 54,328 3.6 78.6 -0.6 10.7 1.1 75 38 (40) Shenzhen Airlines China 38,668 11.4 47,875 12.5 80.8 -0.8 26.3 10.2 155 39 (41) Gol Transportes Aereos Brazil 38,085 9.8 49,503 -0.3 76.9 7.1 40.1 9.5 129 40 (37) Virgin Atlantic Airways UK 37,664 -4.7 48,772 -3.1 77.2 -1.3 6.0 1.3 41 41 (59) Norwegian Norway 37,615 39.9 46,479 35.4 80.9 2.6 24.0 15.8 86 42 (42) China Airlines Taiwan 35,886 4.9 46,200 4.3 77.7 0.5 14.2 10.1 79 43 (39) Swiss Switzerland 35,717 1.8 42,679 1.8 83.7 0.0 16.2 1.3 76 44 (45) Asiana Airlines South Korea 35,223 7.4 46,780 5.0 75.3 1.7 16.5 7.7 84 45 (44) Air India India 35,101 6.7 47,702 6.9 73.6 -0.2 16.7 7.0 100 46 (46) SAS Sweden 34,594 5.9 45,158 4.4 76.6 1.1 28.4 6.2 146 47 (38) Alitalia est Italy 34,500 -3.0 46,000 -3.6 75.0 0.4 23.4 -2.6 106 48 (52) Jet Airways India 34,423 15.7 41,769 9.7 82.4 4.2 19.5 13.1 104 49 (48) WestJet Canada 33,514 6.3 41,165 6.7 81.4 -0.3 19.7 6.3 107 50 (49) Virgin Australia Australia 33,067 5.6 42,218 1.1 78.3 3.4 19.7 2.1 95 NOTES: est RPK/ASK/load factor estimated based on full-year passenger data; est1 Airline Business estimate; American Airlines includes US Airways Fleet; Air Berlin includes Niki; Virgin Australia 2013 figure includes SkyWest Australia for May and June only; Avianca includes TACA; SAS does not include Wideroe; China Eastern includes Shanghai Airlines; Air China includes Dalian
ANALYSIS BY fLigHTgLobaL insigHT DATA COMPILED BY siLva isHak FLIGHTGLOBAL DATA RESEARCH
ABU_170715_040-045.indd 40 10/07/2015 13:26
7 (8) british airways UK 138,431 5.4 170,917 5.9 81.0 -0.4 42.5 3.9 262

Flightglobal | 7
Find out more at:flightglobal.com
flightglobal.com/airlines | Airline Business | 41July-August 2015
Top passenger operaTions ranked by Traffic 2014: 51 To 100
ranking airline country passenger traffic (rpk) seat capacity (ask) Load factor passenger number fleet
2014 (2013) Million change (%) Million change (%) percent pt change Million change (%) current
51 (50) Avianca Colombia 32,602 4.5 41,052 5.9 79.4 -1.0 26.2 6.5 83 52 (47) Thomson Airways UK 31,652 0.2 34,018 -0.4 93.0 0.6 10.4 -1.7 62 53 (60) Sichuan Airlines China 31,414 17.8 36,522 14.2 86.0 2.6 19.2 14.7 101 54 (51) Lion Air est Indonesia 31,400 5.0 35,000 4.8 89.7 0.2 36.0 5.2 103 55 (57) EVA Air Taiwan 30,518 10.2 39,039 12.3 78.2 -1.4 8.9 11.1 65 56 (55) Garuda Indonesia Indonesia 30,231 8.9 42,904 13.9 70.5 -3.2 21.6 10.0 134 57 (54) TAP Portugal Portugal 30,119 7.0 37,389 5.5 80.6 1.1 11.4 6.6 61 58 (63) Grupo Aeromexico Mexico 28,772 15.0 36,217 11.5 79.8 2.6 17.2 11.0 131 59 (53) Jetstar Australia 28,644 -0.1 36,824 1.5 77.8 -1.3 17.1 2.3 70 60 (56) Air New Zealand New Zealand 28,078 1.2 33,396 0.7 84.1 0.5 13.7 2.3 51 61 (66) Xiamen Airlines China 27,712 14.5 37,382 15.6 74.5 -0.5 20.4 9.6 11862 (61) AirAsia Malaysia 27,274 2.5 34,590 3.6 78.8 -0.8 22.1 1.3 80 63 (62) Vietnam Airlines est1 Vietnam 26,500 5.6 33,500 5.9 79.1 -0.2 16.0 6.7 79 64 (70) IndiGo India 26,048 14.0 33,528 16.3 77.7 -1.6 22.9 18.9 96 65 (65) Condor Germany 25,916 5.3 28,667 4.9 90.4 0.3 7.2 5.9 42 66 (58) ExpressJet Airlines USA 25,608 -5.6 31,536 -7.3 81.2 1.5 31.0 -6.1 367 67 (68) Copa Airlines Panama 25,604 9.5 33,398 9.5 76.7 0.0 7.8 0.2 80 68 (72) Wizz Air Hungary 25,351 21.5 29,267 20.0 86.7 1.0 16.5 18.4 61 69 (67) SkyWest Airlines USA 24,953 3.7 29,919 2.2 83.4 1.2 27.8 2.4 337 70 (78) Philippine Airlines Philippines 24,821 32.1 34,780 30.1 71.4 1.1 9.6 43.1 58 71 (64) Finnair Finland 24,772 0.0 30,889 -0.9 80.2 0.7 9.6 3.9 46 72 (76) Spirit Airlines USA 22,783 18.0 26,291 17.9 86.7 0.1 14.3 15.1 73 73 (71) Hawaiian Airlines USA 22,399 1.8 27,471 1.7 81.5 0.1 10.2 2.6 48 74 (69) South African Airways South Africa 22,313 -4.4 30,533 -1.7 73.1 -2.1 7.0 0.0 56 75 (73) Ethiopian Airlines Ethiopia 22,267 11.7 31,602 13.3 70.5 -1.0 6.2 10.7 69 76 (75) Air Europa Spain 21,980 13.1 26,174 14.1 84.0 -0.7 9.6 10.3 53 77 (82) Vueling Airlines Spain 21,445 25.3 26,686 24.2 80.4 0.7 21.5 24.9 99 78 (88) AirAsia X Malaysia 20,817 31.3 25,374 31.4 82.0 -0.1 4.2 33.8 16 79 (74) Thomas Cook Airlines UK 20,696 4.5 22,644 6.4 91.4 -1.7 6.0 -0.7 37 80 (83) UTair Russia 20,199 20.4 25,249 15.6 80.0 3.2 8.6 4.7 266 81 (85) Pegasus est Turkey 19,500 20.1 24,378 20.9 79.9 -0.6 19.7 17.4 54 82 (79) El Al Israel 18,984 1.7 23,018 2.2 82.5 -0.4 4.6 4.0 38 83 (80) TUIfly est Germany 18,500 2.8 20,500 2.5 90.2 0.2 7.8 2.6 27 84 (81) Austrian Austria 18,428 4.1 23,343 3.6 78.9 0.4 11.2 -1.0 76 85 (77) Egyptair Egypt 18,358 -3.1 28,562 -3.3 64.3 0.1 8.8 3.3 57 86 (84) Spring Airlines China 18,258 10.7 19,617 11.2 93.1 -0.5 11.4 8.5 50 87 (87) Frontier Airlines USA 17,946 13.1 20,175 15.4 89.0 -1.8 12.2 14.0 56 88 (90) Shandong Airlines China 17,580 12.8 22,881 13.8 76.8 -0.7 14.1 9.8 82 89 (86) Air Transat est1 Canada 17,500 9.4 19,500 11.4 91.5 -0.5 3.5 5.0 25 90 (100) Cebu Pacific Air Philippines 16,213 25.4 20,496 26.5 79.1 -0.7 16.9 17.5 51 91 (89) Virgin America USA 16,212 2.7 19,695 0.0 82.3 2.2 6.5 2.8 53 92 (93) Aer Lingus Ireland 16,088 8.7 20,373 7.8 79.0 0.6 9.8 1.5 49 93 (92) Azul Brazil 15,707 4.9 19,701 4.1 79.7 0.6 20.0 7.3 146 94 (91) Monarch Airlines UK 15,705 2.8 19,357 7.8 81.1 -4.0 7.0 3.0 34 95 (95) Volaris Mexico 15,644 8.0 19,034 8.5 82.2 -0.4 9.8 9.7 53 96 (96) S7 Airlines Russia 15,583 9.8 19,503 11.1 79.9 -1.0 7.9 12.0 45 97 (97) Transavia Airlines est Netherlands 14,000 3.7 15,500 3.3 91.0 1.0 6.8 4.6 36 98 (107) Capital Airlines China 13,823 20.2 15,562 15.3 88.8 3.3 9.2 12.5 91 99 (103) Air Arabia UAE 13,800 11.3 17,000 11.3 81.0 1.0 6.8 11.3 34 100 (99) Nordwind Airlines Russia 13,402 -0.2 14,663 -4.5 91.4 3.9 4.5 22.3 18 NOTES: est RPK/ASK/load factor estimated based on full-year passenger data; est1 Airline Business estimate; Lion Air passenger number reported locally; Cebu Pacific includes Tigerair Phillipines since July 2014
ABU_170715_040-045.indd 41 10/07/2015 13:26
Network PlaNNiNg 2015
focuS oN africaN airliNeS
While fast-growing Ethiopian Airlines can point to another year of profit for its financial year just closed, fortunes have been much tougher at sub-Saharan Africa’s two other biggest operators.
Kenya Airways and South African Airways both ended their most recent financial years in the red, and face much work to complete restructuring plans.
SOUTH AFRICAN AIRWAYSStruggling SAA late last year found itself in familiar territory, with mounting financial woes, renewed boardroom tensions and the boss of its low-cost arm drafted in again as acting chief executive.
On taking up the acting role for the second time in two years, Mango boss Nico Bezuidenhout embarked on a 90-day plan to stem losses as the carrier’s financial problems grew critical. This put the airline back on a firm enough footing for it to finalise its financial results and secure an additional finance ministry guarantee of R6.48 billion ($565 million). SAA is aiming to return to an EBIT profit in the next year and generate a bottom-line profit in the next five years.
The restructuring dropping unprofitable long-haul routes, covered instead by codeshares, enabling SAA to boost its own capacity on its more profitable intra-African routes.
But uncertainty remains after Bezuidenhout moved back to Mango in August 2015 – to be replaced by another acting chief, the flag carrier’s general manager of human resources, Thuli Mpshe.
Much attention has focused on potential efforts to secure
an investor for SAA, with the carrier linked to Gulf carriers Emirates and Etihad, and latterly, Air China.
But South Africa’s finance ministry, which took over ministerial responsibility for the airline last year, in August said that it is not in talks with any party seeking an equity stake in the state-owned carrier.
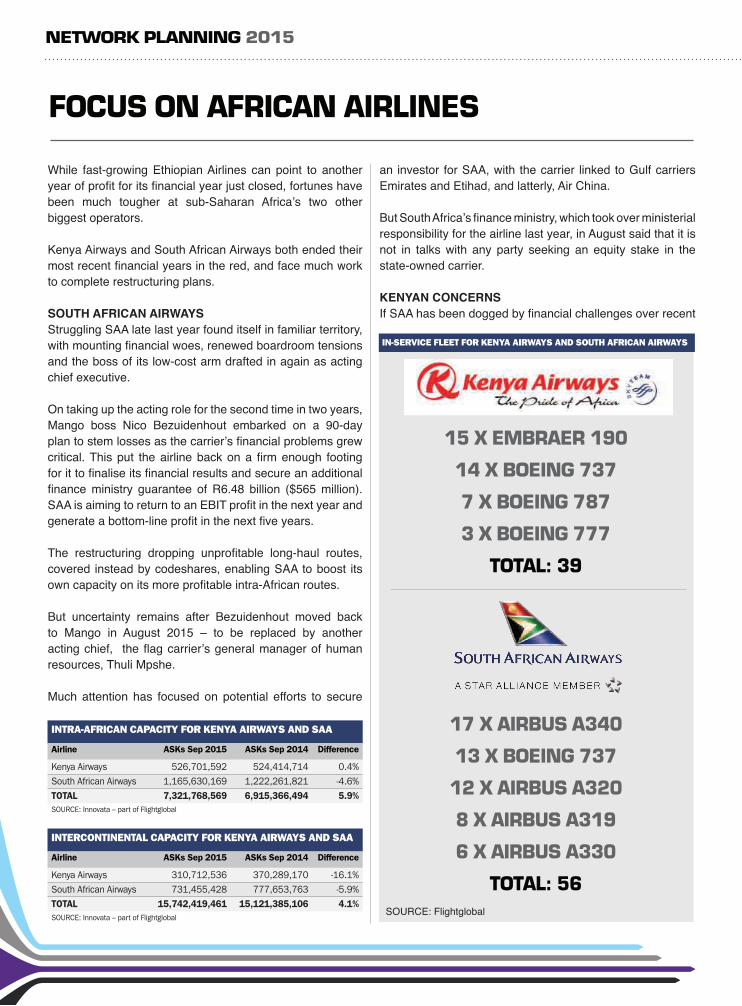
KENYAN CONCERNSIf SAA has been dogged by financial challenges over recent
in-service fleet for kenya airways and south african airways
intra-african capacity for kenya airways and saa
airline asKs sep 2015 asKs sep 2014 Difference
Kenya Airways 526,701,592 524,414,714 0.4%South African Airways 1,165,630,169 1,222,261,821 -4.6%total 7,321,768,569 6,915,366,494 5.9%SoUrce: Innovata – part of Flightglobal
intercontinental capacity for kenya airways and saa
airline asKs sep 2015 asKs sep 2014 Difference
Kenya Airways 310,712,536 370,289,170 -16.1%South African Airways 731,455,428 777,653,763 -5.9%total 15,742,419,461 15,121,385,106 4.1%SoUrce: Innovata – part of Flightglobal
15 x embraer 190
14 x boeiNg 737
7 x boeiNg 787
3 x boeiNg 777
total: 39
17 x airbuS a340
13 x boeiNg 737
12 x airbuS a320
8 x airbuS a319
6 x airbuS a330
total: 56SOuRCE: Flightglobal

Flightglobal | 9
Find out more at:flightglobal.com
years, the mounting problems facing Kenya Airways is less familiar. The airline had been something of a poster child for liberalisation in Africa, after successfully securing an investor in the shape of KLM, and embarking on a decade of unbroken operating profits. But its fortunes too have turned sharply.
The airline blamed terror attacks in East Africa and the outbreak of Ebola for a worsening of its annual result. Its loss for the 12 months ended 30 March widened to KSh16.3 billion ($160 million) from KSh2.7 billion the previous year.
While the airline lifted revenues 4%, costs spiralled which the Nairobi-based carrier attributed to higher overheads associated with its fleet renewal programme.
The carrier says the arrival of five Boeing 787s, two 777-200ERs and three 737-800s and the disposal of its 767 fleet “coincided with a difficult business environment driven by the incidences of terrorism in the region, together with adverse external factors like [the] West Africa Ebola crisis and the effects of travel advisories”.
The carrier is in the market to sell four Boeing 777-200ERs as part of its efforts to rationalise its fleet, and recently returned two 767-300ERs to lessor GECAS.
The airline though has secured a €200 million ($218 million) bridging loan from Afreximbank to help stabilise its finances. The Cairo-based bank will become a financial adviser to the airline and conduct a “comprehensive review of Kenya Airways’ debt profile with a view to recommending an optimal liability structure”.
While it has been a challenging year for some of Africa’s largest network carriers, some of the continent’s smaller players are expanding at a frenetic pace.
LOW-COST EXPANSIONLow-cost carriers such as Fastjet and Flyafrica are adding new routes and destinations, taking advantage of a relative loosening of regulatory regimes as they deploy subsidiaries to tap new markets beyond their respective bases in Tanzania and Zimbabwe.
Despite the airline having only started domestic and regional flights in July, Flightglobal’s Innovata schedules show that Flyafrica is now Zimbabwe’s second-largest operator, with a 15% market share by seat capacity, just behind Air Zimbabwe with 16%.
Flyafrica chief executive Adrian Hamilton-Manns says the carrier’s success is a result both of wooing travellers away from rivals and of stimulating new demand.
“It’s a combination of the two: lots of low-cost carriers will tell you they are convincing people to fly rather than taking alternative forms of transport like buses, but it’s also anybody who wants to save on an airfare. We have reduced the cost by 70% in markets we serve,” says Hamilton-Manns.
Not content with this, the low-cost carrier has started a Namibian subsidiary and disclosed plans for several more, including a Gabon-based unit.
The Namibian subsidiary, it is envisioned, will initially operate services from Windhoek to Johannesburg three times a week before increasing this to a daily service and adding services to Cape Town. The airline intends to expand its fleet from one Boeing 737 to three in the next nine to 12 months.
Ethiopian Airlines experienced another year of profit for its financial year that closed in June 2014
airlines serving harare share by seat capacity (sep 2015)
SOURCE: Innovata – part of Flightglobal
AirZimbabwe
Emirates
SAAEthiopianAirlines
FlyAfricaZimbabwe
KenyaAirways
Other
16.3%
15.7%
15.7%15.4%
14.8%
11.6%
10.5%
Boei
ng

Network PlaNNiNg 2015
This strategy has not been without its challenges, however. An attempt to take over South Africa’s 1time as a precursor to starting flights within the country ended without a deal, and Fastjet has faced repeated delays to the processing of its licence to start a unit in Kenya.
Nevertheless, Bodin foresees the carrier’s planned Zambian and Zimbabwean subsidiaries both starting operations this year.
TANZANIASuleiman Said Suleiman, director general of the Tanzania Airports Authority, describes the country’s aviation market as being in a “positive state of flux” thanks to more long-haul capacity added by the likes of Swiss and KLM but also to the “phenomenal growth” of Fastjet.
The low-cost carrier is now the largest operator at capital Dar es Salaam’s Julius Nyerere International airport, and Suleiman expects low-cost carriers to become the “prime drivers of new traffic growth across Africa”.
He adds: “Fastjet has given Tanzania the opportunity to grow its regional trade and leisure connections, primarily by stimulating new demand. This new air travel demand comes to a large extent from people who would previously have travelled inefficiently over long distances by car and bus. Over 30% of Fastjet’s passengers remain first-time flyers.”
Meanwhile, Tanzania’s second-tier Kilimanjaro International airport (KIA) is also attracting new airlines and growing its passenger traffic. The self-styled “gateway to Africa’s wildlife
airlines serving dar es salaam share by seat capacity (sep 2015)
Hamilton-Manns says he wants to establish at least one more start-up to serve the West African market. He acknowledges “a lot of speculation” that a unit could also be established in Mozambique.
FASTJET GROWTHA similar picture is emerging in Tanzania where low-cost carrier Fastjet has become the largest operator in the country. Three years after starting flights, Innovata schedules show the carrier has taken the lead this year, with a 22% market share, ahead of local carrier Precision Air on 20%.
“Fastjet’s success is based upon a firm market-stimulation model,” says Richard Bodin, the airline’s commercial chief. “With fares as a low as $20 plus tax, we have managed to attract passengers from both existing airlines but, more critically, from buses, ferries and trains. We have given people the opportunity to travel by air and made it safer and more reliable.”
To support this, Bodin notes that in December 2014 the African carrier found that 35% of its passengers had “never been inside an airport before this first Fastjet flight”.
Fastjet continues to grow its Tanzanian network, adding a new service from Kilimanjaro to Entebbe in March. The ugandan city was Fastjet’s first international destination from Kilimanjaro, and the carrier added a route to Malawi’s capital Lilongwe in July.
But the carrier also has ambitions to become a continent-wide operator and is seeking to start new subsidiaries in Kenya, Zambia and Zimbabwe.
airlines serving tanazania share by seat capacity (sep 2015)
SOURCE: Innovata – part of Flightglobal
Fastjet
PrecisionAir
EthiopianKenyaAirways
Other
21.9%
19.9%
8.7%
43.8%
5.7%
SOURCE: Innovata – part of Flightglobal
Fastjet
PrecisionAir
EthiopianAirlines
KenyaAirways
Other
31.6%
20.3%14.0%
10.2%
23.9%

Flightglobal | 11
Find out more at:flightglobal.com
heritage” is close to the northern safari-circuit national parks, the Serengeti national park and Mount Kilimanjaro, helping it to attract long-haul airlines and tour operators.
For this reason, KIA primarily serves leisure passengers and has a mix of European and Middle Eastern carriers including Condor, KLM, Qatar Airways and Turkish Airlines. In 2014, the airport handled just over 800,000 passengers.
“While KIA largely serves a leisure market, this traffic reaches KIA almost exclusively on scheduled services. We have KLM and Condor from Europe, Turkish and Qatar via the Middle East region, and Ethiopian and Kenya Airways via Africa as key seat providers for this segment,” says KIA’s acting managing director Bakari Murusuri.
Murusuri says that while there is a “lot of focus now on China and India, we see this is a longer-term effort”. For the time being, KIA is concentrating on attracting more carriers from the Middle East, through which long-haul passengers can be hubbed, and South Africa, which he describes as “a large market for us that remains unserved”.
SOUTH AFRICASouth Africa continues to attract new entrants and start-ups. New domestic and regional airlines regularly appear to challenge the dominance of South African Airways and serve some of the country’s lucrative domestic city pairs, with 2015 being no exception.
Innovata schedules show that, overall, the lion’s share of the South African market is divided between flag carrier SAA and its low-cost subsidiary Mango, with over 50% of seat capacity, while Comair – through its British Airways franchise operations and its low-cost brand Kulula – commands nearly a quarter.
But the domestic market provides a slightly more varied picture. On the Johannesburg-Cape Town route, for example, while Comair and SAA remain dominant new entrant Skywise accounts for 6.4% of the market and FlySafair accounts for another 8.8% – despite both airlines having operated on the route for less than a year.
A concept developed by the original founders of defunct carrier 1time, Skywise was non-operational until the licence was purchased by a company called PAK Aviation in 2014. Launch with a single 737 followed in March this year. The carrier currently operates only from Johannesburg to Cape Town but targets an average of 36,000 passengers per month.
Another airline that has just started flights is Fly Blue Crane. Headed by ex-SAA chief executive Siza Mzimela, the Johannesburg-based carrier makes no reference to a low-cost model but plans to operate a fleet of Embraer ERJ-145s in single-class configuration on domestic routes from its Johannesburg base to Bloemfontein, Kimberley and Nelspruit.
But it is possibly FlySafair that has made the greatest impression on the market. Having started operations in October 2014 with a single 737-400 on the Johannesburg-Cape Town route, the South African operator soon added a service linking Cape Town with Port Elizabeth.
In November, FlySafair opened its second base at Johannesburg, complementing its operation at Cape Town.
Today, the carrier has four 737-400s, and plans to take delivery of three 737-800s to give it a total of six once two of its 737-400s are phased out. It will begin flights to East London and Durban from Johannesburg and Cape Town on 25 October.
Chief executive Elmar Conradie says the carrier had originally only planned to have a fleet of two aircraft by the end of the year, but growth of passengers on all routes “happened a lot quicker than we thought”. He expects the airline to have carried one million passengers by December.
This is an abridged version of articles published on flightglobal.com. To read more on this and other African airline developments go to flightglobal.com/dashboard
airlines serving cape town-johannesburg share by seat capacity (sep 2015)
SOURCE: Innovata – part of Flightglobal. *BA includes Comair franchise flights
SAA
Skywise
Kulula
Mango
BritishAirways*
Safair
Other
36.4%8.8%
18.6%12.9%
10.9%
6.4%6.0%

Network PlaNNiNg 2015
flightglobal.com/airlines30 | Airline Business |
airports rankings
the world’s top airportsData compileD by flightglobal iNSight
may 2015
the Airline Business top 150 airports traffic ranking, compiled using airports council international data, shows passenger numbers increased by 5.4% in 2014, outpacing the 4% growth leading hubs enjoyed in the previous year
top 150 airportS: prelimiNary paSSeNger raNkiNg 2014 (1-50) aNd iNNovata frequeNcy/capacity aNalySiS (may 2015)
rank city airport code country passengers available seats per week Seats share by destination frequencies per week average seats per flight proportion of flights/frequencies by three leading carriers2014 (2013) Number (000) change (%) Number (000) av change (%) intercont’l (%) regional (%) Number change (%) Number change (%) carrier 1 carrier 2 carrier 3
1 (1) Atlanta Hartsfield int'l atl USa 96,179 1.9 2,531 9.1 8.1 91.9 18,378 4.7 138 4.1 Delta air lines 63.6% expressJet airlines 15.2% Southwest airlines 10.1%2 (2) Beijing capital peK china 86,128 2.9 2,313 3.6 17.1 82.9 11,796 0.1 196 3.5 air china 39.0% china Southern airlines 14.9% china eastern airlines 14.2%3 (3) London Heathrow lHR UK 73,408 1.4 2,055 4.8 55.1 44.9 9,726 1.7 211 3.1 british airways 51.6% aer lingus 4.6% Virgin atlantic airways 3.2%4 (4) Tokyo Haneda international HND Japan 72,827 5.7 2,108 -0.4 7.8 92.2 9,198 1.0 229 -1.4 all Nippon airways 32.7% Japan airlines 31.5% Solaseed air 7.6%5 (6) Los Angeles international laX USa 70,663 6.0 1,998 6.8 20.9 79.1 13,022 1.8 153 5.0 SkyWest airlines 14.4% Southwest airlines 14.0% United airlines 11.8%6 (7) Dubai international DXb Uae 70,476 6.1 2,127 34.2 76.0 24.0 7,560 40.3 281 -4.3 emirates 46.2% Flydubai 20.1% Qatar airways 2.7%7 (5) Chicago o'Hare international oRD USa 69,999 4.8 1,954 8.6 11.9 88.1 17,986 -0.8 109 9.5 United airlines 18.1% envoy air 16.6% american airlines 13.3%8 (8) Paris charles de Gaulle cDG France 63,814 2.8 1,625 4.0 52.1 47.9 8,898 1.8 183 2.1 air France 43.0% aerienne europeene 9.1% easyJet 7.3%9 (9) Dallas/Fort Worth international DFW USa 63,554 5.1 1,592 3.1 7.1 92.9 13,444 1.4 118 1.7 american airlines 48.6% envoy air 18.5% mesa airlines 9.2%10 (11) Hong Kong international HKG china 63,122 5.9 1,687 5.8 49.4 50.6 6,852 6.8 246 -0.9 cathay pacific airways 26.1% Dragonair 17.1% Hong Kong airlines 8.9%11 (12) Frankfurt international FRa Germany 59,566 2.6 1,689 2.3 48.0 52.0 9,100 -1.0 186 3.4 lufthansa 58.0% lufthansa cityline 7.5% austrian airlines 2.2%12 (10) Jakarta Soekarno Hatta cGK indonesia 57,221 -4.8 1,695 1.3 11.0 89.0 8,958 3.0 189 -1.7 Garuda indonesia 31.1% lion airlines 28.3% Sriwijaya air 10.3%13 (18) Istanbul ataturk international iSt turkey 56,767 10.6 1,554 11.0 44.4 55.6 8,740 8.5 178 2.3 turkish airlines 76.0% onur air 4.9% atlasjet airlines 4.7%14 (14) Amsterdam Schiphol amS Netherlands 54,978 4.6 1,406 6.9 37.2 62.8 8,634 4.0 163 2.8 Klm 29.8% Klm cityhopper 23.5% easyJet 7.6%15 (16) Guangzhou baiyun international caN china 54,780 4.4 1,397 2.5 15.7 84.3 8,374 3.0 167 -0.6 china Southern airlines 50.8% china eastern airlines 9.0% Shenzhen airlines 7.9%16 (13) Singapore changi SiN Singapore 54,093 0.7 1,519 2.3 56.1 43.9 6,742 1.9 225 0.3 Singapore airlines 24.0% Silkair 11.2% tiger airways 10.5%17 (15) Denver international DeN USa 53,473 1.7 1,544 6.6 1.6 98.4 12,702 1.5 122 5.1 Southwest airlines 23.4% SkyWest airlines 19.8% United airlines 19.8%18 (19) New York JFK JFK USa 53,255 5.6 1,438 4.7 50.7 49.3 8,582 2.0 168 2.6 Jetblue airways 25.8% Delta air lines 19.9% american airlines 11.2%19 (21) Shanghai pudong pVG china 51,688 9.5 1,588 21.2 24.7 75.3 8,612 22.4 184 -1.0 china eastern airlines 29.2% Shanghai airlines 10.1% china Southern airlines 9.6%20 (20) Kuala Lumpur international KUl malaysia 48,930 3.0 1,384 6.2 36.8 63.2 6,970 6.6 199 -0.4 airasia 35.7% malaysia airlines 35.0% malindo air 4.9%21 (22) San Francisco international SFo USa 47,115 4.8 1,350 6.4 18.1 81.9 8,870 -1.0 152 7.5 United airlines 30.2% SkyWest airlines 19.7% Virgin america 8.7%22 (17) Bangkok Suvarnabhumi bKK thailand 46,423 -9.6 1,366 11.0 63.2 36.8 6,112 13.6 223 -2.3 thai airways 25.9% bangkok airways 16.8% centurion air cargo 6.8%23 (24) Seoul incheon international icN South Korea 45,662 9.6 1,225 12.0 48.6 51.4 5,280 11.4 232 0.6 Korean air lines 28.4% asiana airlines 22.7% coyne airways 5.1%24 (23) Charlotte Douglas clt USa 44,280 1.9 1,094 0.6 6.0 94.0 10,482 2.1 104 -1.5 US airways 38.0% pSa airlines 31.1% piedmont 8.6%25 (25) Las Vegas mccarran laS USa 42,870 4.7 1,340 4.5 3.5 96.5 8,658 2.0 155 2.4 Southwest airlines 44.4% United airlines 8.1% Delta air lines 6.5%26 (27) Phoenix Sky Harbor pHX USa 42,125 4.4 1,238 5.3 1.3 98.7 8,908 2.2 139 3.0 US airways 33.3% Southwest airlines 31.5% SkyWest airlines 11.7%27 (29) Madrid barajas maD Spain 41,823 5.3 1,173 10.5 28.7 71.3 6,962 9.2 169 1.2 iberia 23.0% air Nostrum 15.1% air europa 12.8%28 (28) Houston George bush iaH USa 41,240 3.6 1,161 10.7 13.6 86.4 10,494 3.1 111 7.4 United airlines 34.0% expressJet airlines 32.6% SkyWest airlines 8.8%29 (26) Miami international mia USa 40,942 0.9 1,049 9.5 43.9 56.1 6,626 4.7 158 4.6 american airlines 57.3% Republic airline 11.7% Delta air lines 5.9%30 (33) Sao Paulo Guarulhos int'l GRU brazil 39,766 9.9 972 -4.2 23.1 76.9 5,552 -5.1 175 0.9 Gol transportes aereos 30.6% tam 30.6% azul 9.1%31 (32) Delhi indira Gandhi int'l Del india 39,753 8.3 1,262 5.0 23.7 76.3 7,188 6.0 176 -0.9 indigo 25.0% air india 20.5% Jet airways 18.7%32 (30) Munich international mUc Germany 39,701 2.7 1,093 -2.8 27.9 72.1 7,030 -4.4 156 1.7 lufthansa 32.2% lufthansa cityline 22.1% air berlin 7.2%33 (31) Sydney Kingsford Smith SyD australia 38,863 1.6 1,006 1.5 27.7 72.3 6,070 3.2 166 -1.6 Qantas airways 34.7% Virgin australia 24.2% Jetstar airways 12.9%34 (35) Toronto pearson international yyZ canada 38,569 6.8 996 9.0 29.5 70.5 8,420 7.2 118 1.7 air canada 28.6% Jazz air 18.4% Westjet 15.7%35 (34) Rome Fiumicino Fco italy 38,506 6.5 1,107 10.7 28.3 71.7 6,664 9.1 166 1.5 alitalia 32.6% Vueling airlines 9.1% easyJet 8.2%36 (37) London Gatwick lGW UK 38,106 7.5 956 3.3 21.2 78.8 5,312 2.3 180 0.9 easyJet 44.8% british airways 17.1% Norwegian 8.1%37 (36) Shanghai Hongqiao int'l SHa china 37,971 6.7 1,054 6.3 0.0 100.0 5,902 6.6 179 -0.2 china eastern airlines 33.3% Shanghai airlines 17.1% Spring airlines 9.3%38 (44) Chengdu Shuangliu int'l ctU china 37,712 12.8 1,030 9.4 5.1 94.9 6,294 8.6 164 0.8 air china 27.9% Sichuan airlines 19.0% china eastern airlines 12.7%39 (39) Barcelona el prat bcN Spain 37,540 6.7 1,019 3.0 15.2 84.8 5,724 2.1 178 0.9 Vueling airlines 39.3% Ryanair 12.8% easyJet 7.7%40 (41) Seattle Tacoma international Sea USa 37,498 7.7 1,075 12.3 7.4 92.6 7,912 11.0 136 1.1 alaska airlines 30.8% Horizon air 21.9% Delta air lines 9.9%41 (47) Shenzhen baoan international SZX china 36,273 12.4 1,066 12.0 2.5 97.5 6,530 14.6 163 -2.3 Shenzhen airlines 28.7% china Southern airlines 25.3% Hainan airlines 10.0%42 (51) Taipei taoyuan int'l tpe taiwan 35,804 16.6 948 6.9 32.4 67.6 3,756 7.7 252 -0.7 china airlines 26.0% eVa air 21.9% cathay pacific airways 7.7%43 (42) Orlando international mco USa 35,714 2.7 1,135 15.6 10.4 89.6 7,290 13.2 156 2.1 Southwest airlines 30.8% Jetblue airways 14.8% Delta air lines 12.0%44 (40) Newark liberty international eWR USa 35,611 1.7 1,047 13.2 23.8 76.2 8,494 12.9 123 0.3 United airlines 35.9% expressJet airlines 19.7% Shuttle america 6.7%45 (38) Tokyo Narita international NRt Japan 35,535 0.6 936 2.8 54.0 46.0 4,094 3.1 229 -0.3 Japan airlines 16.4% all Nippon airways 11.3% Jetstar Japan 11.0%46 (43) Minneapolis-St. Paul international mSp USa 35,147 3.7 906 2.4 4.5 95.5 7,856 -3.1 115 5.7 Delta air lines 34.5% endeavor air 16.9% SkyWest airlines 15.3%47 (48) Mumbai international bom india 34,994 9.5 1,114 6.3 25.6 74.4 6,226 7.3 179 -0.9 Jet airways 29.1% indigo 23.6% air india 14.8%48 (49) Mexico City benito Juarez int'l meX mexico 34,256 8.6 988 10.4 13.9 86.1 7,658 5.5 129 4.6 aeromexico connect 26.2% aeromexico 21.3% interJet 20.5%49 (45) Manila Ninoy aquino int'l mNl philippines 34,015 3.5 932 -11.3 35.7 64.3 5,016 -15.4 186 4.8 cebu pacific 34.2% pal express 17.5% philippine airlines 17.0%50 (50) Moscow Domodedovo int'l Dme Russia 33,108 7.3 721 3.6 54.5 45.5 4,680 0.9 154 2.7 S7 airlines 25.3% transaero airlines 12.4% Ural airlines 7.9%
ABU_240415_030-033.indd 30 2015-04-17 14:23
top 50
the world’S toP airPortS

Flightglobal | 13
Find out more at:flightglobal.com
flightglobal.com/airlines | Airline Business | 31May 2015
top 150 airports: preliminary passenger ranking 2014 (1-50) and innovata frequency/capacity analysis (may 2015)
rank city airport code country passengers available seats per week seats share by destination frequencies per week average seats per flight proportion of flights/frequencies by three leading carriers2014 (2013) number (000) change (%) number (000) av change (%) intercont’l (%) regional (%) number change (%) number change (%) carrier 1 carrier 2 carrier 3
1 (1) Atlanta Hartsfield Int'l ATL USA 96,179 1.9 2,531 9.1 8.1 91.9 18,378 4.7 138 4.1 Delta Air Lines 63.6% ExpressJet Airlines 15.2% Southwest Airlines 10.1%2 (2) Beijing Capital PEK China 86,128 2.9 2,313 3.6 17.1 82.9 11,796 0.1 196 3.5 Air China 39.0% China Southern Airlines 14.9% China Eastern Airlines 14.2%3 (3) London Heathrow LHR UK 73,408 1.4 2,055 4.8 55.1 44.9 9,726 1.7 211 3.1 British Airways 51.6% Aer Lingus 4.6% Virgin Atlantic Airways 3.2%4 (4) Tokyo Haneda International HND Japan 72,827 5.7 2,108 -0.4 7.8 92.2 9,198 1.0 229 -1.4 All Nippon Airways 32.7% Japan Airlines 31.5% Solaseed Air 7.6%5 (6) Los Angeles International LAX USA 70,663 6.0 1,998 6.8 20.9 79.1 13,022 1.8 153 5.0 SkyWest Airlines 14.4% Southwest Airlines 14.0% United Airlines 11.8%6 (7) Dubai International DXB UAE 70,476 6.1 2,127 34.2 76.0 24.0 7,560 40.3 281 -4.3 Emirates 46.2% Flydubai 20.1% Qatar Airways 2.7%7 (5) Chicago O'Hare International ORD USA 69,999 4.8 1,954 8.6 11.9 88.1 17,986 -0.8 109 9.5 United Airlines 18.1% Envoy Air 16.6% American Airlines 13.3%8 (8) Paris Charles de Gaulle CDG France 63,814 2.8 1,625 4.0 52.1 47.9 8,898 1.8 183 2.1 Air France 43.0% Aerienne Europeene 9.1% EasyJet 7.3%9 (9) Dallas/Fort Worth International DFW USA 63,554 5.1 1,592 3.1 7.1 92.9 13,444 1.4 118 1.7 American Airlines 48.6% Envoy Air 18.5% Mesa Airlines 9.2%10 (11) Hong Kong International HKG China 63,122 5.9 1,687 5.8 49.4 50.6 6,852 6.8 246 -0.9 Cathay Pacific Airways 26.1% Dragonair 17.1% Hong Kong Airlines 8.9%11 (12) Frankfurt International FRA Germany 59,566 2.6 1,689 2.3 48.0 52.0 9,100 -1.0 186 3.4 Lufthansa 58.0% Lufthansa CityLine 7.5% Austrian Airlines 2.2%12 (10) Jakarta Soekarno Hatta CGK Indonesia 57,221 -4.8 1,695 1.3 11.0 89.0 8,958 3.0 189 -1.7 Garuda Indonesia 31.1% Lion Airlines 28.3% Sriwijaya Air 10.3%13 (18) Istanbul Ataturk International IST Turkey 56,767 10.6 1,554 11.0 44.4 55.6 8,740 8.5 178 2.3 Turkish Airlines 76.0% Onur Air 4.9% Atlasjet Airlines 4.7%14 (14) Amsterdam Schiphol AMS Netherlands 54,978 4.6 1,406 6.9 37.2 62.8 8,634 4.0 163 2.8 KLM 29.8% KLM Cityhopper 23.5% EasyJet 7.6%15 (16) Guangzhou Baiyun International CAN China 54,780 4.4 1,397 2.5 15.7 84.3 8,374 3.0 167 -0.6 China Southern Airlines 50.8% China Eastern Airlines 9.0% Shenzhen Airlines 7.9%16 (13) Singapore Changi SIN Singapore 54,093 0.7 1,519 2.3 56.1 43.9 6,742 1.9 225 0.3 Singapore Airlines 24.0% Silkair 11.2% Tiger Airways 10.5%17 (15) Denver International DEN USA 53,473 1.7 1,544 6.6 1.6 98.4 12,702 1.5 122 5.1 Southwest Airlines 23.4% SkyWest Airlines 19.8% United Airlines 19.8%18 (19) New York JFK JFK USA 53,255 5.6 1,438 4.7 50.7 49.3 8,582 2.0 168 2.6 JetBlue Airways 25.8% Delta Air Lines 19.9% American Airlines 11.2%19 (21) Shanghai Pudong PVG China 51,688 9.5 1,588 21.2 24.7 75.3 8,612 22.4 184 -1.0 China Eastern Airlines 29.2% Shanghai Airlines 10.1% China Southern Airlines 9.6%20 (20) Kuala Lumpur International KUL Malaysia 48,930 3.0 1,384 6.2 36.8 63.2 6,970 6.6 199 -0.4 AirAsia 35.7% Malaysia Airlines 35.0% Malindo Air 4.9%21 (22) San Francisco International SFO USA 47,115 4.8 1,350 6.4 18.1 81.9 8,870 -1.0 152 7.5 United Airlines 30.2% SkyWest Airlines 19.7% Virgin America 8.7%22 (17) Bangkok Suvarnabhumi BKK Thailand 46,423 -9.6 1,366 11.0 63.2 36.8 6,112 13.6 223 -2.3 Thai Airways 25.9% Bangkok Airways 16.8% Centurion Air Cargo 6.8%23 (24) Seoul Incheon International ICN South Korea 45,662 9.6 1,225 12.0 48.6 51.4 5,280 11.4 232 0.6 Korean Air Lines 28.4% Asiana Airlines 22.7% Coyne Airways 5.1%24 (23) Charlotte Douglas CLT USA 44,280 1.9 1,094 0.6 6.0 94.0 10,482 2.1 104 -1.5 US Airways 38.0% PSA Airlines 31.1% Piedmont 8.6%25 (25) Las Vegas McCarran LAS USA 42,870 4.7 1,340 4.5 3.5 96.5 8,658 2.0 155 2.4 Southwest Airlines 44.4% United Airlines 8.1% Delta Air Lines 6.5%26 (27) Phoenix Sky Harbor PHX USA 42,125 4.4 1,238 5.3 1.3 98.7 8,908 2.2 139 3.0 US Airways 33.3% Southwest Airlines 31.5% SkyWest Airlines 11.7%27 (29) Madrid Barajas MAD Spain 41,823 5.3 1,173 10.5 28.7 71.3 6,962 9.2 169 1.2 Iberia 23.0% Air Nostrum 15.1% Air Europa 12.8%28 (28) Houston George Bush IAH USA 41,240 3.6 1,161 10.7 13.6 86.4 10,494 3.1 111 7.4 United Airlines 34.0% ExpressJet Airlines 32.6% SkyWest Airlines 8.8%29 (26) Miami International MIA USA 40,942 0.9 1,049 9.5 43.9 56.1 6,626 4.7 158 4.6 American Airlines 57.3% Republic Airline 11.7% Delta Air Lines 5.9%30 (33) Sao Paulo Guarulhos Int'l GRU Brazil 39,766 9.9 972 -4.2 23.1 76.9 5,552 -5.1 175 0.9 Gol Transportes Aereos 30.6% TAM 30.6% Azul 9.1%31 (32) Delhi Indira Gandhi Int'l DEL India 39,753 8.3 1,262 5.0 23.7 76.3 7,188 6.0 176 -0.9 Indigo 25.0% Air India 20.5% Jet Airways 18.7%32 (30) Munich International MUC Germany 39,701 2.7 1,093 -2.8 27.9 72.1 7,030 -4.4 156 1.7 Lufthansa 32.2% Lufthansa CityLine 22.1% Air Berlin 7.2%33 (31) Sydney Kingsford Smith SYD Australia 38,863 1.6 1,006 1.5 27.7 72.3 6,070 3.2 166 -1.6 Qantas Airways 34.7% Virgin Australia 24.2% Jetstar Airways 12.9%34 (35) Toronto Pearson International YYZ Canada 38,569 6.8 996 9.0 29.5 70.5 8,420 7.2 118 1.7 Air Canada 28.6% Jazz Air 18.4% Westjet 15.7%35 (34) Rome Fiumicino FCO Italy 38,506 6.5 1,107 10.7 28.3 71.7 6,664 9.1 166 1.5 Alitalia 32.6% Vueling Airlines 9.1% EasyJet 8.2%36 (37) London Gatwick LGW UK 38,106 7.5 956 3.3 21.2 78.8 5,312 2.3 180 0.9 EasyJet 44.8% British Airways 17.1% Norwegian 8.1%37 (36) Shanghai Hongqiao Int'l SHA China 37,971 6.7 1,054 6.3 0.0 100.0 5,902 6.6 179 -0.2 China Eastern Airlines 33.3% Shanghai Airlines 17.1% Spring Airlines 9.3%38 (44) Chengdu Shuangliu Int'l CTU China 37,712 12.8 1,030 9.4 5.1 94.9 6,294 8.6 164 0.8 Air China 27.9% Sichuan Airlines 19.0% China Eastern Airlines 12.7%39 (39) Barcelona El Prat BCN Spain 37,540 6.7 1,019 3.0 15.2 84.8 5,724 2.1 178 0.9 Vueling Airlines 39.3% Ryanair 12.8% EasyJet 7.7%40 (41) Seattle Tacoma International SEA USA 37,498 7.7 1,075 12.3 7.4 92.6 7,912 11.0 136 1.1 Alaska Airlines 30.8% Horizon Air 21.9% Delta Air Lines 9.9%41 (47) Shenzhen Baoan International SZX China 36,273 12.4 1,066 12.0 2.5 97.5 6,530 14.6 163 -2.3 Shenzhen Airlines 28.7% China Southern Airlines 25.3% Hainan Airlines 10.0%42 (51) Taipei Taoyuan Int'l TPE Taiwan 35,804 16.6 948 6.9 32.4 67.6 3,756 7.7 252 -0.7 China Airlines 26.0% EVA Air 21.9% Cathay Pacific Airways 7.7%43 (42) Orlando International MCO USA 35,714 2.7 1,135 15.6 10.4 89.6 7,290 13.2 156 2.1 Southwest Airlines 30.8% JetBlue Airways 14.8% Delta Air Lines 12.0%44 (40) Newark Liberty International EWR USA 35,611 1.7 1,047 13.2 23.8 76.2 8,494 12.9 123 0.3 United Airlines 35.9% ExpressJet Airlines 19.7% Shuttle America 6.7%45 (38) Tokyo Narita International NRT Japan 35,535 0.6 936 2.8 54.0 46.0 4,094 3.1 229 -0.3 Japan Airlines 16.4% All Nippon Airways 11.3% Jetstar Japan 11.0%46 (43) Minneapolis-St. Paul International MSP USA 35,147 3.7 906 2.4 4.5 95.5 7,856 -3.1 115 5.7 Delta Air Lines 34.5% Endeavor Air 16.9% SkyWest Airlines 15.3%47 (48) Mumbai International BOM India 34,994 9.5 1,114 6.3 25.6 74.4 6,226 7.3 179 -0.9 Jet Airways 29.1% Indigo 23.6% Air India 14.8%48 (49) Mexico City Benito Juarez Int'l MEX Mexico 34,256 8.6 988 10.4 13.9 86.1 7,658 5.5 129 4.6 Aeromexico Connect 26.2% Aeromexico 21.3% InterJet 20.5%49 (45) Manila Ninoy Aquino Int'l MNL Philippines 34,015 3.5 932 -11.3 35.7 64.3 5,016 -15.4 186 4.8 Cebu Pacific 34.2% PAL Express 17.5% Philippine Airlines 17.0%50 (50) Moscow Domodedovo Int'l DME Russia 33,108 7.3 721 3.6 54.5 45.5 4,680 0.9 154 2.7 S7 Airlines 25.3% Transaero Airlines 12.4% Ural Airlines 7.9%
ABU_240415_030-033.indd 31 2015-04-17 14:23

Network PlaNNiNg 2015
toP 10 africaN airPortS
o.r. tambo internationalPax: 19.16m
JNB
Cape town internationalPax: 8.64m
cPT
Mohammed VPax: 7.97m
cMN
LoS
HrG
Cairo internationalPax: 14.68m
ADD
addis abada bole int’lPax: 6.93m
algiers Houari boumedienePax: 6.46m
ALG
NBo
Murtala Muhammed int’lPax: 7.50m
Hurghada internationalPax: 7.22m
sharm el sheikh int’lPax: 6.24mSSH
Jomo Kenyatta int’lPax: 6.39m
cAI
1
2
3
4
5
6
7
8
9
10
Note: passenger figures for 2014SOuRCE: Flightglobal

Flightglobal | 15
Find out more at:flightglobal.com
Abidjan IVORY COAST
• $50m refurbishment project• Expanded passenger terminal• New parallel runway
Nairobi KENYA
• New passenger Terminal 1A (opened July 2014)• New passenger Terminal 2 (opened May 2015)• New ‘greenfield’ Terminal 3 (Phase 1 due to be opened in 2018)
Entebbe UGANDA
• $200m development project announced August 2015• New passenger terminal• New cargo terminal
Addis Ababa ETHIOPIA
• $250m development project• Expanded passenger terminal• Expanded aircraft apron• New cargo terminal
Sharm El-Sheikh EGYPT
• $671m development project• New passenger terminal• New runway• New air traffic control tower
Cairo EGYPT
• $400m (approx.) redevelopment project• Brand new passenger Terminal 2 (due to open in Q4 2015)• Double the capacity over previous facility, to 8 MPPA
Zanzibar TANZANIA
• New passenger terminal (due to be completed in 2015)
Cape Town SOUTH AFRICA
• New replacement runway• Location of runway further from the current terminal area will allow for future facility expansion
Luanda ANGOLA
• New cargo terminal (opened April 2015)
Accra GHANA
• Expanded arrivals hall of passenger Terminal 2 (due to be completed Q4 2015)• New passenger Terminal 3 due to be constructed in future
Investment is underway across a number of African airports, as the region works to provide the necessary infrastructure to support the continent’s growth ambitions.
One African hub airport which has seen the most change over the past two years is Nairobi’s Jomo Kenyatta (JKIA). The airport was already in the midst of much needed redevelopment and expansion, even before a fire destroyed part of the terminal two years ago. The brand new Terminal 1A had been under construction for several years prior to it’s opening in July 2014, and compared with the existing facilities features state of the art security equipment and vastly superior passenger comforts.
To alleviate the capacity strain on the Terminal 1 facilities another new structure has been built. Terminal 2 opened
in mid-May with capacity for 2.5 million passengers per annum, boosting JKIA’s total capacity to 7.5 million. The prefabricated structure may be simple and inexpensive, but is ultimately a temporary measure.
JKIA is preparing to handle approximately 25 million passengers per annum a decade from now, and it’s long term development centres around a new Greenfield terminal, which will replace all of the current infrastructure. Terminal 3 will be capable of handling 20 million passengers annually with phase 1 of the project expected to be opened in 2018.
Our graphic depicts a selection of ongoing and recently completed infrastructure development projects at some of the larger operational airports around Africa. It does not include entirely new start-up airports.
buildiNg africaN caPacity

Network PlaNNiNg 2015
airPort aNalySiS: focuS oN growth
Some of the fastest growing airports in Africa have been in Egypt as tourism in the country has rebounded. September data from Flightglobal’s schedules specialist Innovata shows four of the ten fastest growing African airports compared with the same month in 2014 are based in Egypt. Fastest growing is popular tourist spot Sharm El-Sheikh which is showing a 30% increase in capacity followed by nearby Hurghada with a 26% increase. Sharm El-Sheikh is currently going through a significant development including a new passenger terminal and a new runway.
Egyptian capital Cairo – the second most visited airport in Africa with more than 14 million passengers in 2014 – grew faster in absolute terms, It has over 24,000 more weekly departing seats this September – an increase in capacity of 11%. It too is in the middle of a redevelopment project and is due to open a new passenger terminal by the end of the year.
Among the other fastest growing African airports are Tanzania’s Dar es Salaam and Ethiopia’s Addis Ababa. Low-cost carriers such as Fastjet are fueling growth at Dar es Salaam, while fast developing home carrier Ethiopian Airlines is driving growth at Addis Ababa.
September data shows the continued fast growth of the big Gulf carrier hubs. Qatar Airways’ Doha hub and the Abu Dhabi base of Etihad – which has also driven additional traffic to the airport through its airline partnerships strategy – are both among the ten fastest growing airports by percentage rates, even allowing for their existing scale. The region’s biggest airport, Dubai, also continued to see double-digit capacity expansion in September.
While there are wider concerns of an economic slowdown,
asia-pacific airports – seat capacity growth
airport sept 2015 sept 2014 Difference Change
Bangkok, TH (DMK) 368,684 256,435 112,249 43.8%Fuzhou, cN 148,490 107,924 40,566 37.6%Hangzhou, cN 366,377 287,907 78,470 27.3%Urumqi, cN 259,644 205,435 54,209 26.4%Tianjin, cN 175,369 140,071 35,298 25.2%Taiyuan, cN 122,183 100,024 22,159 22.2%Hanoi, VN 203,778 167,260 36,518 21.8%Nanjing, cN 247,132 204,488 42,644 20.9%Ho chi Minh city, VN 315,171 263,137 52,034 19.8%chengdu, cN 504,633 426,677 77,956 18.3%SoUrce: Innovata – part of Flightglobal Note: Data is based on one week of scheduled data(September 2015 against September 2014) for airports with a minimum of 100,000 seats/week
europe airports – seat capacity growth
airport sept 2015 sept 2014 Difference Change
Simferopol, UA 114,244 55,926 58,318 104.3%Moscow-Vnukovo, cF, rU 244,863 162,846 82,017 50.4%Sabiha Gokcen, Tr 394,035 317,324 76,711 24.2%Antalya, Tr 253,372 212,088 41,284 19.5%Budapest, HU 136,405 116,038 20,367 17.6%Porto, PT 103,080 89,867 13,213 14.7%Istanbul, Tr 825,370 728,449 96,921 13.3%London-Luton, eN 159,796 142,227 17,569 12.4%Izmir-Adnan Mend, Tr 148,873 132,678 16,195 12.2%Glasgow, Sc 119,151 106,446 12,705 11.9%SoUrce: Innovata – part of Flightglobal Note: Data is based on one week of scheduled data(September 2015 against September 2014) for airports with a minimum of 100,000 seats/week
africa airports – seat capacity growth
airport sept 2015 sept 2014 Difference Change
Sharm el-Sheikh, eG 39,160 30,037 9,123 30.4%Hurghada, eG 39,988 31,698 8,290 26.2%Dar es Salaam, TZ 39,461 33,160 6,301 19.0%cape Town, ZA 111,063 94,895 16,168 17.0%Addis Ababa, eT 110,547 94,642 15,905 16.8%Alexandria, eG 35,793 32,071 3,722 11.6%cairo, eG 238,580 214,575 24,005 11.2%Algiers, DZ 93,942 86,529 7,413 8.6%Mauritius, MU 32,307 30,024 2,283 7.6%Marrakech, MA 49,566 46,413 3,153 6.8%SoUrce: Innovata – part of Flightglobal Note: Data is based on one week of scheduled data(September 2015 against September 2014) for airports with a minimum of 30,000 seats/week
airlines continue to lift capacity in China, Seven of the fastest growing Asia-Pacific airports by capacity are Chinese, September Innovata seat data shows. Notably some of the fastest rates of growth are being seen at airports beyond the big Chinese gateways. Elsewhere in the region low-cost carriers are helping to drive rapid growth at Bangkok’s Don Mueang airport, which enjoyed a 43% increase in capacity compared with a year ago.
Innovata schedules data shows that Sharm El-Sheikh’s seat capacity has increased by 30% in September 2015 on the previous year

Flightglobal | 17
Find out more at:flightglobal.com
world’s top 20 airport groups by revenue: 2014
rank main airport
revenue2014 airports operator country $ million change
1 Heathrow airport Holdings UK LHr 4,425 14.4%
2 aena aeropuertos Spain MAD 4,172 7.0%
3 aeroports de paris France cDG 3,679 0.5%
4 Fraport Germany FrA 3,156 -0.1%
5 port authority of new York & new Jersey USA JFK 2,479 6.8%
6 Hong Kong international airport Hong Kong HKG 2,111 10.6%
7 schiphol Group Netherlands AMS 1,943 7.1%
8 narita international airport Japan NrT 1,834 -7.6%
9 avinor Norway oSL 1,674 -0.7%
10 incheon international airport South Korea IcN 1,664 8.0%
11 Flughafen Munchen Germany MUc 1,582 0.5%
12 Japan airport terminal Japan HND 1,566 7.0%
13 new Kansai international airport Japan KIX 1,388 10.0%
14 state airports authority (turkey) Turkey IST 1,381 13.7%
15 taV airports Turkey IST 1,296 7.9%
16 infraero Brazil GrU 1,267 -10.8%
17 beijing Capital international airport china PeK 1,241 5.5%
18 airports of thailand Thailand BKK 1,230 -9.9%
19 Manchester airports Group UK MAN 1,185 10.7%
20 aeroporti di roma Italy Fco 1,061 14.0%
SoUrce: Flightglobal Note: 2014 financial results for Airports Authority of India and changiAirport Group, which ranked 17th and 11th on 2013 revenues, have not been released at thetime of going to press. The full Airport Group Financial report will be published in the Novemberissue of Airline Business.
north america airports – seat capacity growth
airport sept 2015 sept 2014 Difference Change
Dallas-Love, TX, US 189,499 109,265 80,234 73.4%cleveland, oH, US 101,036 84,587 16,449 19.4%Miami, FL, US 443,992 398,700 45,292 11.4%orlando, FL, US 366,560 331,236 35,324 10.7%New orleans, LA, US 122,357 110,652 11,705 10.6%Seattle, WA, US 489,613 444,385 45,228 10.2%Washington-National, Dc, US 286,187 261,071 25,116 9.6%Fort Lauderdale, FL, US 242,947 222,154 20,793 9.4%Austin, TX, US 138,655 127,682 10,973 8.6%orange county, cA, US 117,535 108,601 8,934 8.2%SoUrce: Innovata – part of Flightglobal Note: Data is based on one week of scheduled data(September 2015 against September 2014) for airports with a minimum of 100,000 seats/week
latin america airports – seat capacity growth
airport sept 2015 sept 2014 Difference Change
Lima, Pe 220,959 189,923 31,036 16.3%Guadalajara, MX 115,147 99,258 15,889 16.0%cancun, MX 153,358 132,395 20,963 15.8%Buenos Aires, Ar 116,961 102,821 14,140 13.8%Monterrey, MX 101,867 94,034 7,833 8.3%Mexico city, MX 463,276 431,346 31,930 7.4%Brasilia, DF, Br 244,695 233,563 11,132 4.8%Belo Horizonte, Br 144,983 139,323 5,660 4.1%Sao Paulo-congonhas, Br 261,620 251,594 10,026 4.0%Santiago, cL 182,663 176,911 5,752 3.3%SoUrce: Innovata – part of Flightglobal Note: Data is based on one week of scheduled data(September 2015 against September 2014) for airports with a minimum of 100,000 seats/week
middle east airports – seat capacity growth
airport sept 2015 sept 2014 Difference Change
Tehran, Ir (THr) 72,264 49,325 22,939 46.5%Tehran, Ir (IKA) 77,726 58,624 19,102 32.6%Muscat, oM 145,598 114,882 30,716 26.7%Doha, QA 448,626 368,478 80,148 21.8%Madinah, SA 57,745 48,435 9,310 19.2%Abu Dhabi, Ae 294,647 252,712 41,935 16.6%Jeddah, SA 344,342 296,937 47,405 16.0%Kuwait, KW 183,879 159,808 24,071 15.1%Sharjah, Ae 106,584 92,917 13,667 14.7%Dammam, SA 112,558 99,992 12,566 12.6%SoUrce: Innovata – part of Flightglobal Note: Data is based on one week of scheduled data(September 2015 against September 2014) for airports with a minimum of 50,000 seats/week
In Europe airline capacity growth is strong at several non-Eu airports – notably in Turkey – after a recent period in which passenger growth in that region has been outshone by European union airports. The Russian market has been particularly hard hit. But while airlines continue to curb capacity at Moscow’s two biggest airports of Sheremetyevo and Domodedovo, airlines – including Aeroflot budget unit Pobeda – have expanded at the city’s smaller Vnukovo airport. Western European low-cost carriers are behind much of the strong growth at Porto, London Luton and Glasgow airports.
While capacity growth has been much tighter across US airports, some airports such as Cleveland are seeing airlines coming in to fill a gap left after united Airlines dropped its hub at the airport in June 2014. The fastest growing uS airport is Dallas Love Field airport, driven by expansion from Southwest Airlines after local constraints on flight operations from the airport were lifted last October.
Perhaps the most telling sign of the current climate in Latin America is the relative absence of Brazilian airports from the list of fastest growing. Airlines have curbed their Brazilian operations, the biggest market in the region, as economic and political challenges have mounted.
TOP AIRPORT GROUPSAhead of publication in Airline Business of our annual Airport Group Financial report, featuring the Top 100 Global Airports and Airport Groups ranked by operating revenue, we highlight the Top 20 companies ranked by 2014 operating revenue published to date. Overall the ranking remains in largely the same order as 2013. Although some of the biggest players suffered a decline in revenues, such as Airports of Thailand and Infraero, many more saw significant gains, like Manchester Airports Group, Hong Kong International and Turkey’s State Airports Authority.

Network PlaNNiNg 2015
africa-euroPe: New routeS
FlightMaps Analytics is a map-based analysis tool for route development professionals and is powered by flight frequency and capacity data from the Innovata airline schedules database, together with Flightglobal’s aircraft seat database.
It provides access to current, future and historic airline schedules, flight frequency and seat capacity data, allowing you to identify new, ceased and underserved routes, analyse current and potential connections, and plot market share.
To find out more about how this service can help you analyse key schedules data and inform your growth strategy, go to: flightglobal.com/maps
Notes: Data is based on one week of schedules data, September 2015 against September 2014.Figures reflect airlines operating nonstop unrestricted scheduled passenger services.
The snapshot below highlights the scheduled flights between Africa and Europe for new passenger routes in September 2015 against the same period in 2014. This is just one of the many features available on FlightMaps Analytics.

Flightglobal | 19
Find out more at:flightglobal.com
caPacity SNaPShot
Who’s flying what, where and when? Flightglobal’s network analysis function allows users to search the Innovata schedules database and identify potential new business opportunities. The detailed search menu allows you to:
•�Search by region, country, city and airport level•�Display aggregated data or drill down to individual flights at airline level•�choose to see additional data, e.g. seat capacity and days of operation simply by adding
more columns
Find out more at flightglobal.com/dashboard
SOuRCE: Innovata – part of Flightglobal
Africa
Asia-Pacific
Europe
Latin America
Middle East
North
Ameri
ca
Focus on Africa
5.4bn ASKs/wk 3.7% YoY
Weekly capacity ASK
Region Millions Change
Europe 2,071 <1%
Intra-region 1,709 5%
Middle East 1,039 14%
Asia-Pacific 328 6%
North America 183 3%
Latin America 42 1%
Capacity is down 6% between Africa and
Asia-Pacific compared with last year. Cuts
include South African Airways dropping flights to Mumbai and Beijing, though it will codeshare
on Air China’s new Johannesburg-Beijing flights from October.
Compared with 2014, Ethiopian Airlines will
increase its intra-region capacity by 53 million ASKs
per week this September. Big gains can be found between
its Addis Ababa hub and Brazzaville, Khartoum and Kano – all seeing a 1,000+ increase in weekly seats.
Johannesburg, Addis Ababa and Zanzibar all saw
significant capacity increases from the Middle East
compared with September 2014, with Zanzibar receiving
new traffic from Oman Air, Qatar Airways and Flydubai.
Notes: Data is based on one week of schedules data, September 2015 against September 2014.Figures reflect airlines operating nonstop unrestricted scheduled passenger services.
September Capacity:164bn ASKs/wk
6.5%vs Sep 2014

For more information visit
flightglobal.com
to FinD out More about tHe inForMation (Data anD analYsis) inCluDeD in tHis report anD our networK planninG serViCes, ContaCt:
europe, Middle east and africa
Michael Walker
email: [email protected]
asia
cory Mathews
email: [email protected]
connect with us
© 2015 flightglobal, part of reed business information ltd.
the information contained in our databases and used in this presentation has been assembled from many sources, and whilst reasonable care has been taken to ensure accuracy, the information is supplied on the understanding that no legal liability whatsoever shall attach to flightglobal, its offices, or employees in respect of any error or omission that may have occurred.
linkedin group ‘flightglobal’
twitter.com/flightglobal
americas
Thomas Terry
email: [email protected]
aircraft appraiserof the Year2011, 2013, 2014 and 2015