NERSC Role in Basic Energy Science Research · NERSC Role in Basic Energy Science Research...
48
NERSC Role in Basic Energy Science Research Katherine Yelick NERSC Director Requirements Workshop
-
Upload
nguyenthuan -
Category
Documents
-
view
214 -
download
0
Transcript of NERSC Role in Basic Energy Science Research · NERSC Role in Basic Energy Science Research...

NERSC Role in Basic Energy
Science Research
Katherine Yelick
NERSC Director
Requirements Workshop

NERSC Mission
Accelerate the pace of scientific discovery for all DOE Office of Science (SC) research through computing and data systems and services.
Efficient algorithms
+ flexible software
+ effective machines
great computational science.
2

2010 Allocations
NERSC is the Production Facility
for DOE Office of Science
•NERSC serves a large population
Approximately 3000 users,
400 projects, 500 code instances
•Focus on “unique” resources –Expert consulting and other services
–High end computing systems
–High end storage systems
– Interface to high speed networking
• Science-driven
–Machine procured competitively using application benchmarks from DOE/SC
–Allocations controlled by DOE/SC Program Offices to couple with funding decisions
3

DOE Priorities for NERSC
Change Over Time
0%
5%
10%
15%
20%
25%
30%
35%
2002 2003 2004 2005 2006 2007 2008 2009
Usage by Science Type as a Percent of Total Usage Accelerator Physics
Applied Math
Astrophysics
Chemistry
Climate Research
Combustion
Computer Sciences
Engineering
Environmental Sciences
Fusion Energy
Geosciences
High Energy Physics
Humanities
Lattice Gauge Theory
Life Sciences
Materials Sciences
Nuclear Physics

NERSC at LBNL • 1000+ users,100+ projects
• Allocations:
– 80% DOE program manager
control
– 10% ASCR Leadership
Computing Challenge*
– 10% NERSC reserve
• Science includes all of
DOE Office of Science
• Machines procured
competitively
• Introspective security
ASCR’s Computing Facilities
LCFs at ORNL and ANL
• 100+ users 10+ projects
• Allocations:
– 60% ANL/ORNL managed
INCITE process
– 30% ACSR Leadership Computing Challenge*
– 10% LCF reserve
• Science limited to largest
scale; no limit to DOE/SC
• Machines procured
through partnerships
• Policy-based security
5
NERSC at LBNL • 1000+ users,100+ projects
• Allocations:
– 80% DOE program manager
control
– 10% ASCR Leadership
Computing Challenge*
– 10% NERSC reserve
• Science includes all of
DOE Office of Science
• Machines procured
competitively
• Introspective security
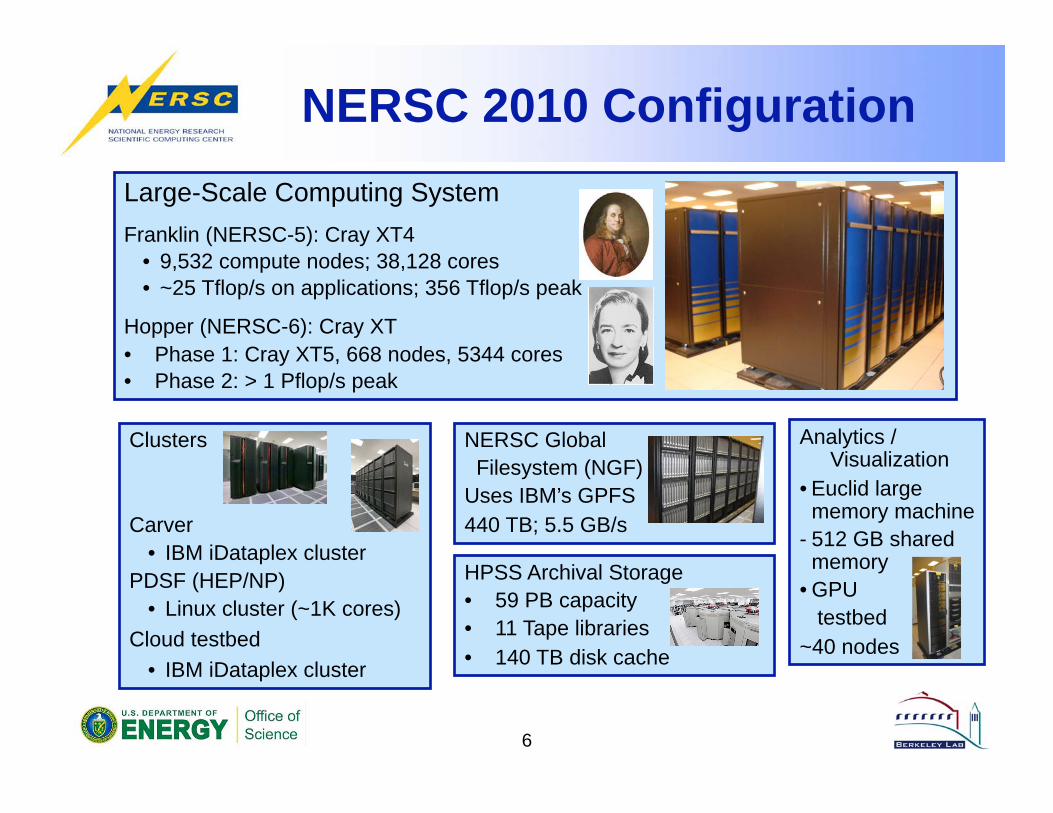
HPSS Archival Storage
• 59 PB capacity
• 11 Tape libraries
• 140 TB disk cache
NERSC 2010 Configuration
6
Large-Scale Computing System
Franklin (NERSC-5): Cray XT4
• 9,532 compute nodes; 38,128 cores
• ~25 Tflop/s on applications; 356 Tflop/s peak
Hopper (NERSC-6): Cray XT
• Phase 1: Cray XT5, 668 nodes, 5344 cores
• Phase 2: > 1 Pflop/s peak
Clusters
Carver
• IBM iDataplex cluster
PDSF (HEP/NP)
• Linux cluster (~1K cores)
Cloud testbed
• IBM iDataplex cluster
NERSC Global
Filesystem (NGF)
Uses IBM’s GPFS
440 TB; 5.5 GB/s
Analytics / Visualization
• Euclid large memory machine
- 512 GB shared memory
• GPU
testbed
~40 nodes

Demand for More Computing
• Each year DOE users
requests ~2x as many
hours as can be
allocated
• This 2x is artificially
constrained by
perceived availability
• Unfulfilled allocation requests amount to
hundreds of millions
of compute hours in
2010
7
0
100
200
300
400
500
600
2007 2008 2009 2010
Unallocated Requests
Allocated hours

How NERSC Uses Your Requirements

2005: NERSC Five-Year Plan
• 2005 Trends:
– Widening gap between application
performance and peak
– Emergence of multidisciplinary teams
– Flood of scientific data
– (Missed multicore, along with most)
• NERSC Five-Year Plan
– Major system every 3 years
9
• Implementation
– NERSC-5 (Franklin) and NERSC-6 (underway) + clusters
– Question: What trends do you see for 2011-2015?
– Algorithms / application trends and other requirements

10
Applications Drive
NERSC Procurements Because hardware peak performance does not necessarily
reflect real application performance
NERSC-6 “SSP” Benchmarks
CAM
Climate
GAMESS
Quantum
Chemistry
GTC
Fusion
IMPACT-T
Accelerator
Physics
MAESTRO
Astro-
physics
MILC
Nuclear
Physics
PARATEC
Material
Science
• Benchmarks reflect diversity of science and algorithms
• SSP = average performance (Tflops/sec) across machine
• Used before selection, during and after installation • Question: What applications best reflect your workload?

Benjamin Franklin,
One of America’s First Scientists,
performed ground breaking work
in energy efficiency, electricity,
materials, climate, ocean currents,
transportation, health, medicine,
acoustics and heat transfer.
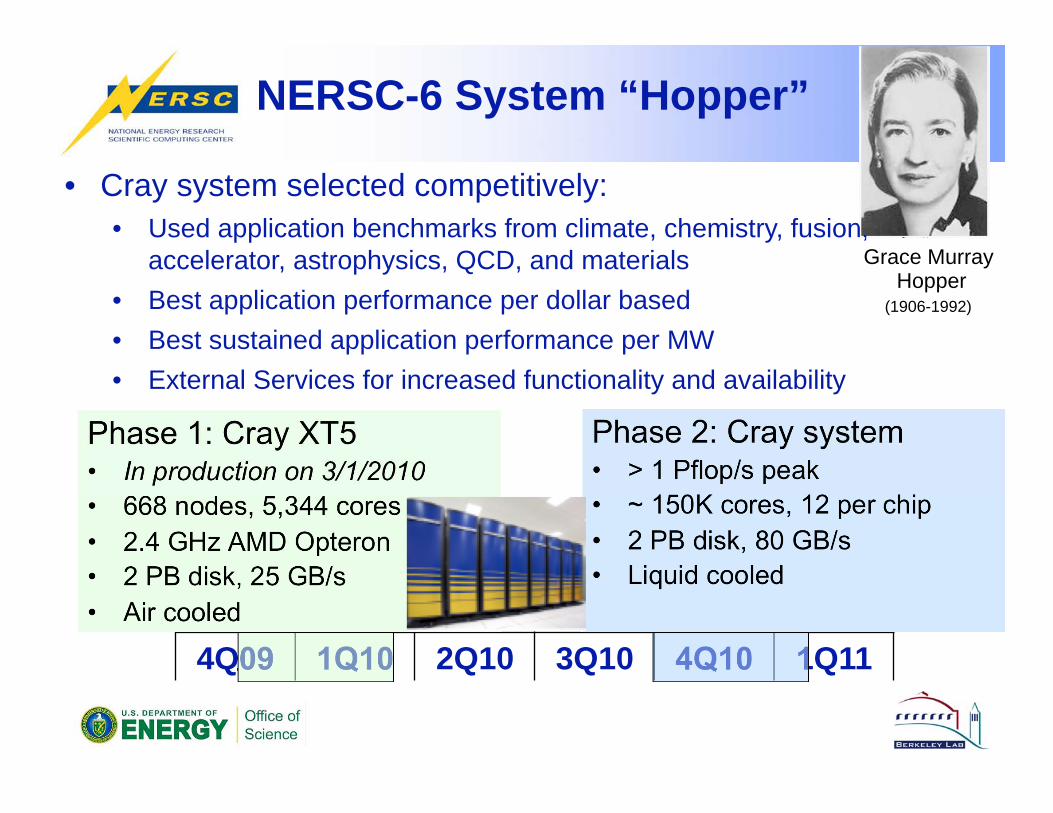
NERSC-6 System “Hopper”
Phase 1: Cray XT5 • In production on 3/1/2010
• 668 nodes, 5,344 cores
• 2.4 GHz AMD Opteron
• 2 PB disk, 25 GB/s
• Air cooled
Phase 2: Cray system • > 1 Pflop/s peak
• ~ 150K cores, 12 per chip
• 2 PB disk, 80 GB/s
• Liquid cooled
4Q09 1Q10 2Q10 3Q10 4Q10 1Q11
Grace Murray Hopper
(1906-1992)
• Cray system selected competitively:
• Used application benchmarks from climate, chemistry, fusion,
accelerator, astrophysics, QCD, and materials
• Best application performance per dollar based
• Best sustained application performance per MW
• External Services for increased functionality and availability

DOE Explores Cloud Computing
• DOE’s CS program focuses on HPC
– No coordinated plan for clusters in SC
• DOE Magellan Cloud Testbed
• Cloud questions to explore: – What are the costs (TCO) of clouds vs other systems?
– Can a cloud serve DOE’s mid-range computing needs?
– What features (hardware and software) are needed of a
“Science Cloud”? Commodity hardware?
– What requirements do the jobs have (~100 cores, I/O,…)
– How does this differ, if at all, from commercial clouds
which serve primarily independent serial jobs
• Magellan not a NERSC Program machine – Not allocated in ERCAP; testbed, not production

Cluster architecture
SU SU SU SU SU
SU SU SU SU SU
Carver Magellan
SU SU
SU SU
Load Balancer
I/O
I/O
NGF
8G FC Login Login
Login Login
IB Fabric
10G Ethernet
14 I/O nodes 28 Login/network
nodes
3200
compute cores
5760
compute cores
HPSS Internet

Reservations at NERSC
• Reservation service being tested:
– Reserve a certain date, time and duration
• Debugging at scale
• Real-time constraints in which need to analyze
data before next run, e.g., daily target selection
telescopes or genome sequencing pipelin
– At least 24 hours advanced notice
• https://www.nersc.gov/nusers/services/
reservation.php
– Successfully used for IMG run, Madcap, IO
benchmarking, etc.

Science Gateways at NERSC
• Create scientific communities around data sets – Models for sharing vs. privacy differ across communities
– Accessible by broad community for exploration, scientific discovery, and validation of results
– Value of data also varies: observations may be irreplaceable
• A science gateway is a set of hardware and software that provides data/services remotely – Deep Sky – “Google-Maps” of astronomical image data
• Discovered 140 supernovae in 60 nights (July-August 2009)
• 1 of 15 international collaborators were accessing NGF data through the SG nodes 24/7 using both the web interface and the database.
– Gauge Connection – Access QCD Lattice data sets
– Planck Portal – Access to Planck Data
• Building blocks for science on the web – Remote data analysis, databases, job submission
16

Visualization Support
17
Isocontours (a) and volume rendering
(b) of two trillion zones on 32K
cores of Franklin.
Petascale visualization: Demonstrate visualization scaling to unprecedented
concurrency levels by ingesting and processing unprecedentedly large datasets.
Implications: Visualization and analysis of
Petascale datasets requires the I/O, memory, compute, and interconnect
speeds of Petascale systems.
Accomplishments: Ran VisIt SW on 16K
and 32K cores of Franklin.
• First-ever visualization of two trillion
zone problem (TBs per scalar); data
loaded in parallel.
•Petascale visualization
b
a
Plots show ‘inverse flux factor,' the ratio
of neutrino intensity to neutrino flux,
from an ORNL 3D supernova simulation using
CHIMERA.

Requirements Drive NERSC’s
Long-Term Vision
18

NERSC System Roadmap
• Goal is two systems on the floor at all times
• Systems procured by sustained performance
107
106
105
104
103
102
10
2006 2007 2008 2009 2010 2011 2012 2013 2014 2015 2016 2017 2018 2019 2020
Franklin (N5)
19 TF Sustained
101 TF Peak
Franklin (N5) +QC
36 TF Sustained
352 TF Peak
Hopper (N6)
>1 PF Peak
NERSC-7
10 PF Peak
NERSC-8
100 PF Peak
NERSC-9
1 EF Peak
Peak T
era
flop/s

NERSC Aggressive Roadmap
• Assume machines are well-balanced so that typical DOE application
performance is 5-10% of peak
• Does DOE science justify 10x more capability by 2013? 100x by 2015?
107
106
105
104
103
102
10
2006 2007 2008 2009 2010 2011 2012 2013 2014 2015 2016 2017 2018 2019 2020
Franklin (N5)
19 TF Sustained
101 TF Peak
Franklin (N5) +QC
36 TF Sustained
352 TF Peak
Hopper (N6)
>1 PF Peak, O(100) TF Sustained
NERSC-7
10 PF Peak, 1 PF Sustained
NERSC-8
100 PF Peak, 10 PF Sustained
NERSC-9
1 EF Peak
Peak T
era
flop/s

Data Driven Science
• Scientific data sets are growing exponentially
- Ability to generate data is exceeding our ability
to store and analyze
- Simulation systems and some observational devices grow in capability with Moore’s Law
• Petabyte (PB) data sets will soon be common:
– Climate modeling: estimates of the next IPCC
data is in 10s of petabytes
– Genome: JGI alone will have .5 petabyte of
data this year and double each year
– Particle physics: LHC is projected to produce
16 petabytes of data per year
– Astrophysics: LSST and others will produce 5
petabytes/year
• Create scientific communities with
“Science Gateways” to data
21

Tape Archives: Green Storage
• Tape archives are important to efficient science
– 2-3 orders of magnitude less power than disk
– Requires specialized staff and major capital investment
– NERSC participates in development (HPSS consortium)
• Questions: What are your data sets sizes and growth rates?
Scientific data at
NERSC increases by 1.7X
per year
22
Hopper
~150,000 cores
Data
Analysis
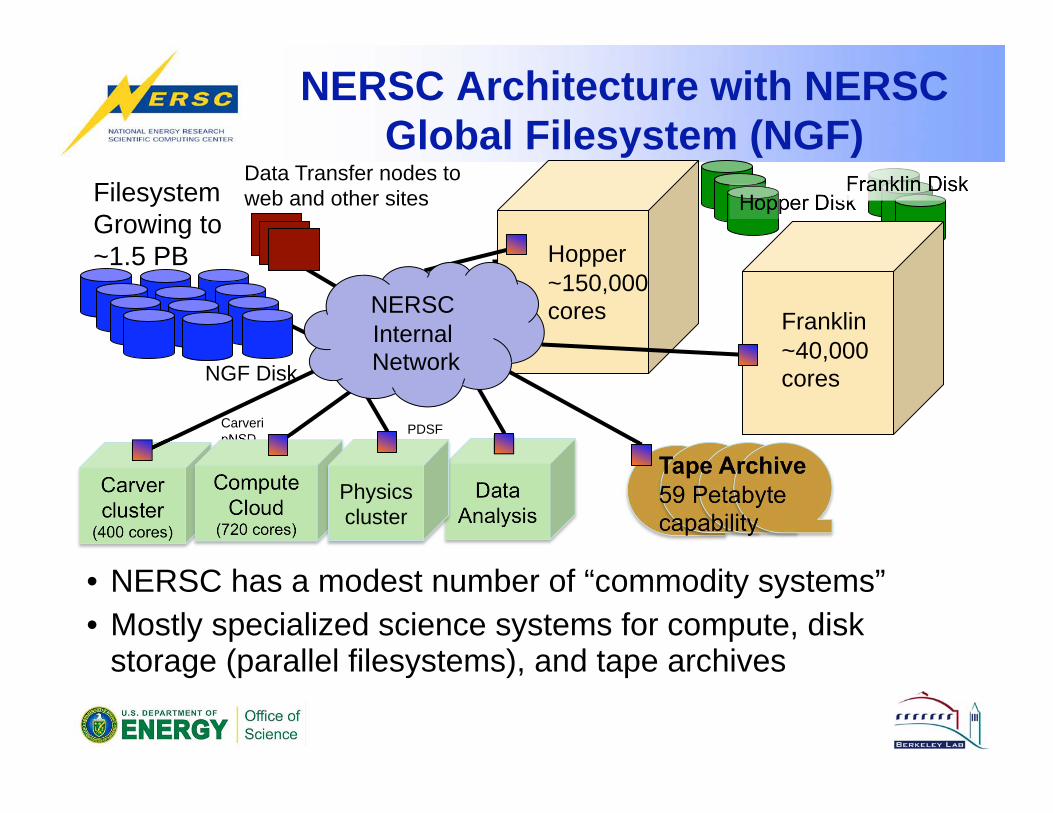
NERSC Architecture with NERSC
Global Filesystem (NGF)
• NERSC has a modest number of “commodity systems”
• Mostly specialized science systems for compute, disk storage (parallel filesystems), and tape archives
NGF Disk
Data Transfer nodes to
web and other sites
Carveri
pNSD PDSF
pNSD
Franklin
~40,000 cores
Carver
cluster (400 cores)
NERSC
Internal Network
Filesystem
Growing to
~1.5 PB
Hopper Disk Franklin Disk
Tape Archive
59 Petabyte capability
Compute
Cloud (720 cores)
Physics
cluster
Communication Services
24
Since 2007, NERSC is a net data importer. In support of our users, it is
important that we take on a lead role in improving intersite data transfers.
• Systems and software typically tuned only within a site
• Technical, social, and policy challenges abound:
– High performance transfer software has too many options hard to use.
– Systems designed for computation can have bottlenecks in data transfers
– Systems at different sites often often have incompatible versions of
transfer software.
– Trying to maintain security exceptions (firewall holes) for all the systems
and software at each site was impossible.
• … and the list goes on.
• NERSC established Data Transfer Nodes (DTNs).
– Reduced transfer time of 30 TB from 30+ days to 2 days
– We formed a working group with experts at the three labs and ESNet
http://www.nersc.gov/nusers/systems/DTN
http://fasterdata.es.net

Energy Efficiency is Necessary
for Computing
• Systems have gotten about 1000x faster over each 10 year period
• 1 petaflop (1015 ops) in 2010 will require 3MW
3 GW for 1 Exaflop (1018 ops/sec)
• DARPA committee suggested 200 MW with “usual” scaling
• Target for DOE is 20 MW in 2018
goal
usual
scaling
2005 2010 2015 2020

Moore’s Law is Alive and Well
26
1.E-01
1.E+00
1.E+01
1.E+02
1.E+03
1.E+04
1.E+05
1.E+06
1.E+07
1970 1975 1980 1985 1990 1995 2000 2005 2010
Transistors (in Thousands)
Data from Kunle Olukotun, Lance Hammond, Herb Sutter,
Burton Smith, Chris Batten, and Krste Asanoviç

But Clock Frequency Scaling
Replaced by Scaling Cores / Chip
27
1.E-01
1.E+00
1.E+01
1.E+02
1.E+03
1.E+04
1.E+05
1.E+06
1.E+07
1970 1975 1980 1985 1990 1995 2000 2005 2010
Transistors (in Thousands)
Frequency (MHz)
Cores
Slide Source: Kathy Yelick. Data from Kunle Olukotun, Lance
Hammond, Herb Sutter, Burton Smith, Chris Batten, and Krste Asanoviç

Performance Has Also Slowed,
Along with Power (Root Cause)
28
1.E-01
1.E+00
1.E+01
1.E+02
1.E+03
1.E+04
1.E+05
1.E+06
1.E+07
1970 1975 1980 1985 1990 1995 2000 2005 2010
Transistors (in Thousands)
Frequency (MHz)
Power (W)
Perf
Cores
Slide Source: Kathy Yelick. Data from Kunle Olukotun, Lance
Hammond, Herb Sutter, Burton Smith, Chris Batten, and Krste Asanoviç

NERSC Goal Usable
Exascale in 2020
• Computational scaling
changed in 2004
• Problems also for laptops,
handhelds, data centers
• Parallelism on-chip brings
algorithms, programming into question
• NERSC: Programmable,
usable systems for science
1)Energy efficient designs
2)Facilities to support scale for both
high and mid scale
29
1.E-01
1.E+00
1.E+01
1.E+02
1.E+03
1.E+04
1.E+05
1.E+06
1.E+07
1970 1975 1980 1985 1990 1995 2000 2005 2010
Transistors (in Thousands)
Frequency (MHz)
Power (W)

30
Parallelism is “Green”
• High performance serial processors waste power – Speculation, dynamic dependence checking, etc. burn power
– Implicit parallelism discovery
• Question: Can you double the concurrency in your algorithms and software every 2 years?
4004 8008
8080
8085
8086
286 386
486 Pentium® proc
P6
1
10
100
1000
10000
1970 1980 1990 2000 2010
Year
Po
wer
Den
sit
y (
W/c
m2)
Hot Plate
Nuclear Reactor
Rocket Nozzle
Sun’s Surface • Concurrent systems are more power efficient
– Dynamic power is proportional to V2fC
– Increasing frequency (f) also increases supply voltage (V) cubic effect
– Increasing cores increases capacitance (C) but only linearly

Technology Challenge
Technology trends against a constant or increasing memory per core
• Memory density is doubling every three years; processor logic is every two
• Storage costs (dollars/Mbyte) are dropping gradually compared to logic costs
Source: David Turek, IBM
Cost of Computation vs. Memory
31
Question: Can you double concurrency without doubling memory?
Source: IBM
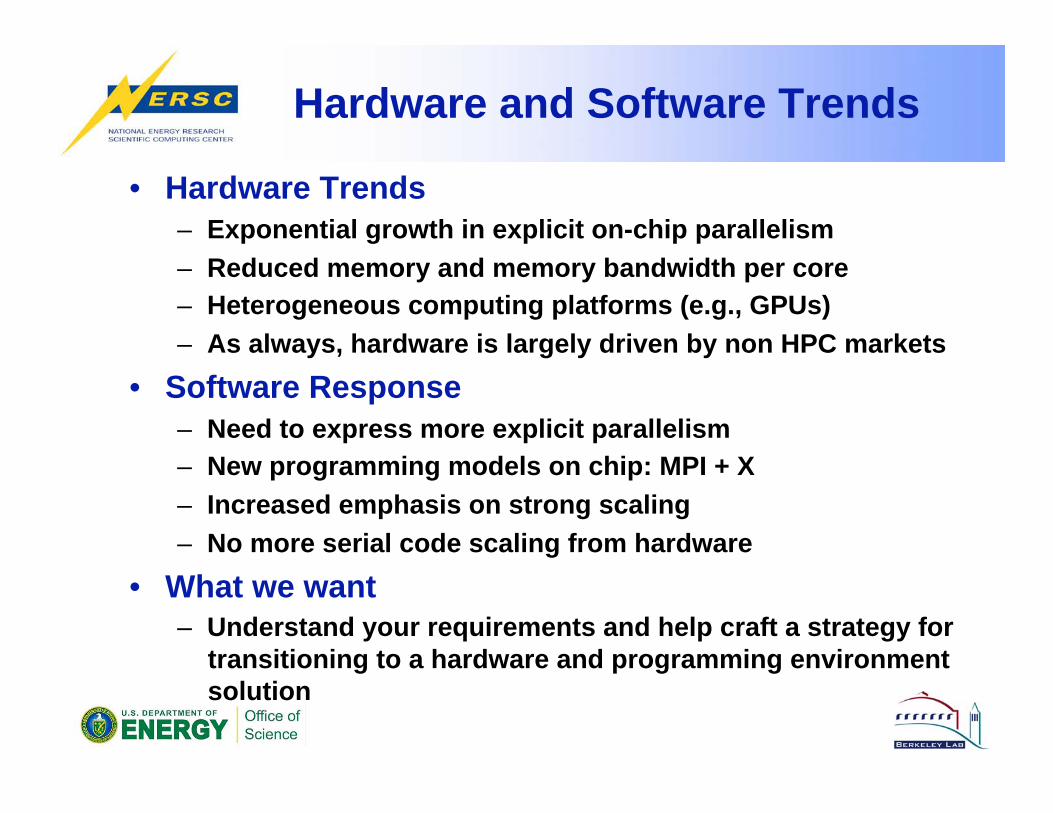
Hardware and Software Trends
• Hardware Trends
– Exponential growth in explicit on-chip parallelism
– Reduced memory and memory bandwidth per core
– Heterogeneous computing platforms (e.g., GPUs)
– As always, hardware is largely driven by non HPC markets
• Software Response
– Need to express more explicit parallelism
– New programming models on chip: MPI + X
– Increased emphasis on strong scaling
– No more serial code scaling from hardware
• What we want
– Understand your requirements and help craft a strategy for
transitioning to a hardware and programming environment
solution

Basic Energy Science
at NERSC

QMC Electronic Structure
W. Lester, UCB Objective: Develop Quantum Monte Carlo
(QMC) methods to stochastically solve
many-body electronic structure problems.
Accomplishments: Developed hybrid QMC /
Molecular Mechanics formalism.
• Obtained interaction energy of a 2-water
cluster treating one H2O quantum
mechanically and other classically;
prelude to effort to find much sought-
after electron binding energy in (H2O)n.
• Studied series of Li clusters in different
charge states to obtain energies for
cluster growth, charge, and discharge in
interactions with graphene.
• ZORI scales to 32K cores on Franklin
Implications: Accurately predict or explain
chemical phenomena where other methods
fail or aren’t applicable.
Cluster of four Li atoms and electron cloud (red)
as calculated by ZORI on NERSC’s Cray XT4
Comm Comp. Phys (2009)
BES

Chemistry: Improving Catalysis
P. Balbuena, Texas A&M
J. Phys. Chem. C, Sept, 2009 Cover Story
Simulation showing carbon atom chains (yellow)
on cobalt surfaces (blue & pink).
Objective: First-principles studies to
develop better catalytic processes.
Implications: Improved power sources
such as lithium-ion batteries, fuel cells.
Accomplishments: DFT studies of catalyzed
single-walled carbon nano-tube growth on
Cobalt nano-particles.
• Predict most stable adsorption sites.
• Carbon atoms form curved & zigzag
chains in various orientations – some
are likely precursors to graphene.
• Showed strong preference for certain
metal sites.
• Next step is to investigate growth on
chiral surfaces
• Modest parallelism
BES

Material Science: Optical Data Storage
Objective: Explore ultrafast optical
switching of nanoscale magnetic regions.
Light
Interaction
with Magnetic
Materials Accomplishments: First-principles, time- &
spin-dependent DFT study using locally-
designed code on laser-irradiated Ni.
• Discovered that light leverages the
crystal structure to transfer spin of
electrons to higher orbit.
• Study is the first to clearly demonstrate
that this phenomenon is a relativistic
effect connected with electron spin.
• Discovery matches experiment and can
guide synthesis of new materials.
• Used over 1.5M hours in 2009; 2,800 cores
J. Appl. Phys. (2008)
G. Zhang (Indiana St) Implications: Potential for laser operated
hard drives, 1000s of times faster than
today’s technology.
BES

Finding Hidden Oil / Gas Reserves
G. Newman, M. Commer (LBNL)
Objective: Apply new, highly rigorous,
massively parallel, 3-D imaging techniques
to create geophysical maps of hydrocarbon
reservoirs in unprecedented levels of detail.
Accomplishments: Has already provided
insight into complex geology of Campos
Basin, a petroleum rich area near Brazil.
NERSC: Code developed on Franklin.
• Algorithms can run on O(10,000) cores;
designed to scale well beyond. Runs on
Franklin routinely use 4,000-8,000 cores.
Implications: New detection abilities and
exploration savings by revealing where
hydrocarbon deposits reside, even when
covered by ocean over a mile deep and
several more miles of rock below the ocean.
Can also be used for locating potential sites
for CO2 sequestration.
http://escholarship.org/uc/item/0qh3p22m
Image improvement resulting from the method. Original data (a), controlled-source electromagnetic method
(CSEM) alone (b), magnetotellurics (MT) alone (c) and combined CSEM and MT (d).
BES

Graphene as the Ultimate
Membrane for Gas Separation Objective: Study permeability, selectivity
of graphene with custom sub-nanometer
pores using ab initio DFT and vdW DF.
Accomplishments: Such pores exhibit
extremely high selectivity, presenting a
formidable barrier for CH4 but easily
surmountable for H2.
• Results suggest that graphene may be
superior to traditional membranes.
• Could have widespread impact on
numerous energy and technological
applications, including carbon
sequestration, fuel cells and gas sensors.
Implications: Potentially lower energy costs
for purification and production of key
industrial gases such as H2 and methane.
.
D. Jiang (PI), V. Cooper, S. Dai (ORNL)
Nano Lett., 9, 4019 (2009)
Nitrogen-functionalized pore in graphene (a), electron density isosurface (b), and snapshots of H2 diffusing through the pore
from NERSC first principles molecular dynamics simulations.
a b
c
BES

Restructuring Catalyst Surfaces
Lin-Wang Wang (LBNL) Objective: Use simulation to understand the
ability of surfaces to restructure under the
influence of gaseous adsorbates.
Accomplishments: DFT studies at NERSC
show that CO molecules bind to small Pt
nanoclusters on the catalyst surface.
• The nanoclusters seem to maximize
bonding of more CO molecules.
• VASP reveals the stabilization energy
gained by cluster formation and suggests
the atomic arrangement.
• Formation of small metallic clusters opens
a new avenue for understanding catalytic
activity under high pressures.
Implications: Revealing the arrangement of
metal atoms that form at active sites will
yield increased understanding of
heterogeneous catalysis mechanisms.
Nano Lett., 9 (5), 2167 (2009)
(top) Starting geometry of CO and Pt atoms. (bottom) After relaxation to minimize energy in the DFT
calculation, two (3 3) clusters form. Dark blue circles represent Pt atoms in the slab layers; light blue circles
represent Pt atoms at the surface. Red and gray circles represent oxygen and carbon atoms, respectively.
BES

Chemistry: Nanoparticle Catalysis Objective: Study small metal clusters
supported on nanoparticles to understand
heterogeneous catalysis; help design
improved catalysts.
Accomplishments: DFT calculations and
state-of-the-art cluster beam studies
provide insight into the reaction
mechanism of catalytic activity of
molybdenum-sulfur clusters on gold
surfaces.
• Help identify intermediates along the
catalytic reaction pathway.
• Used over 700K hours in 2009
• Special ORNL/NERSC version of VASP
Implications: Better hydrodesulphurization
in power plants; possible conversion and
use of non-conventional fuels, e.g., MeOH.
Potential energy profile for the interaction of
CarbonylSulfide (OCS) on Mo6S8 / Au(111)
J. Phys. Chem. A (2009)
Mo6S8/Au(111) Free Mo6S8
P. Liu (BNL)
BES

Materials Science: Nanostructures
Petr Král, UIC
Phys Rev Lett., J Chem Phys,, and JACS, (2008)
Objective: design, simulate and help realize
nanoscale molecular transport systems.
Accomplishments: Simulations of
nanomotors, nanotubes, micelles, and
custom-designed nanopores using
Molecular Dynamics.
• Showed that
• Electron tunneling can drive nano-scale
motors used in nanopropellers.
• Functionalized graphene-based nano-
pores can serve as ionic sieves.
• Nanodroplets can be dragged on the
surface of carbon nanotubes.
• NAMD on Franklin; >250K hour in 2009
Implications: Possible use in drug delivery,
advanced sieves, desalination.
Left: Nanomotor rotates in presence of electric field; Right: two
example highly-selective nanosieves – only certain ions pass
across.
Click here
BES

Novel Material Simulations
W. Ching, UMKC Objective: Electronic structure studies of
complex ceramic materials with
outstanding thermal & electrical properties.
Accomplishments: VASP DFT study of
mechanical response and failure behavior
of intergranular glassy films (IGFs) in
Silicon Nitrides.
• Stress/strain relationship explained by
fundamental electronic structure of the
model.
• May be used to guide future material
designs that enhance selective
properties.
• Used >2.5M hours on Franklin in 2009
Implications: Connection of atomic-scale
characteristics with engineering mechanics
and elucidation of properties not available
by any other method.
Appl. Phys. Lett. (2009)
BES
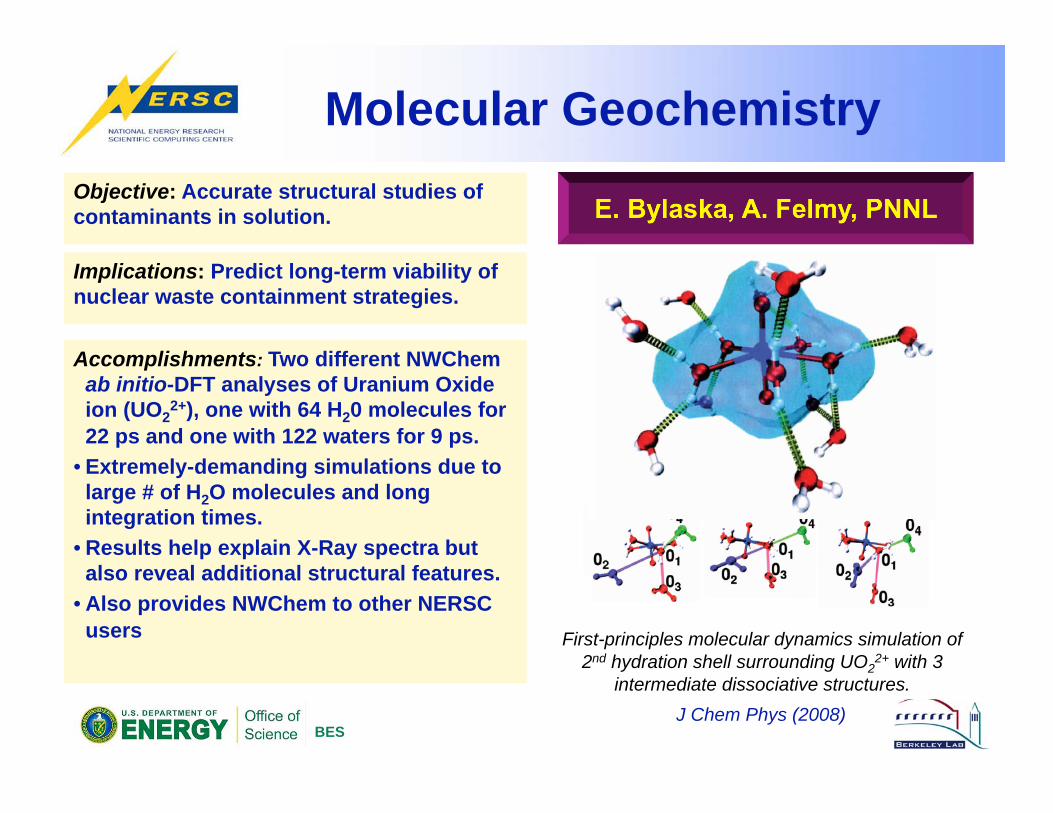
Molecular Geochemistry Objective: Accurate structural studies of
contaminants in solution.
Accomplishments: Two different NWChem
ab initio-DFT analyses of Uranium Oxide
ion (UO22+), one with 64 H20 molecules for
22 ps and one with 122 waters for 9 ps.
• Extremely-demanding simulations due to
large # of H2O molecules and long
integration times.
• Results help explain X-Ray spectra but
also reveal additional structural features.
• Also provides NWChem to other NERSC
users
E. Bylaska, A. Felmy, PNNL
First-principles molecular dynamics simulation of
2nd hydration shell surrounding UO22+ with 3
intermediate dissociative structures.
J Chem Phys (2008)
Implications: Predict long-term viability of
nuclear waste containment strategies.
BES

Catalysis for Higher Fuel Cell Efficiency
Objective: Identify and evaluate catalytic surfaces aimed at improving the efficiency of Direct Methanol Fuel Cells (DMFCs).
Accomplishments:
• Used DFT to develop an electrochemical
model to evaluate catalytic surfaces for
methanol oxidation.
• Model helps identify properties of an
‘ideal’ catalyst and allows screening of
novel systems that may be better and
cheaper than current technology.
• Significant effort by NERSC Services for
special VASP version used here
Surf Sci (2008 & 2009)
This figure shows the potential determining
steps from the DFT calculations. It helps
predict the lowest possible potential of a fuel cell, which is directly related to the efficiency of
the catalyst.
Implications: Lower power, more efficient and economical DMFCs have potential applications in powering mobile phones and laptop batteries and as an alternatives to current hydrogen fuel cell technology.
M. Mavrikakis (U.Wisc)
GOH
BES

NISE: NERSC Initiative for Scientific
Exploration
• INCITE program was created at NERSC:
– Focused computing and consulting resources
– Became the allocation mechanism for the LCFs
• NISE program at NERSC (started in 2009)
– Programming techniques for multicore and scaling in general
– Science problems near breakthrough (encourage high risk/payoff)
– http://www.nersc.gov/nusers/accounts/NISE.php
• AY09 (10/1/09 through 01/11/10) ~20M Franklin hours made
available to existing NERSC projects; ~6.9M to BES
– Elasticity of b-DNA Models; Metallic Alloy Fatigue Fracture; Minimum Free
Energy Paths/Profiles of Protein Conformational Changes; Diamondoid-
Nanoparticle Enhanced Organometallic Surfaces; Organic Photovoltaics,
AIMBPT; MeOH Reformation; Nanocluster Energy Landscape; Graphene
Bilayer Electronic Device; Sec Translocase Transmembrane Channel
• See also ASCR’s ALCC Program:
http://www.er.doe.gov/ascr/Facilities/ALCC.html
45
Conclusions
• NERSC requirements
– Qualitative requirements shape NERSC functionality
– Quantitative requirements set the performance
“What gets measure gets improved”
• Goals:
– Your goal is to make scientific discoveries
• Articulate specific scientific goals and implications for
broader community
– Our goal is to enable you to do science
• Specify resources (services, computers, storage, …) that NERSC could provide with quantities and dates
46
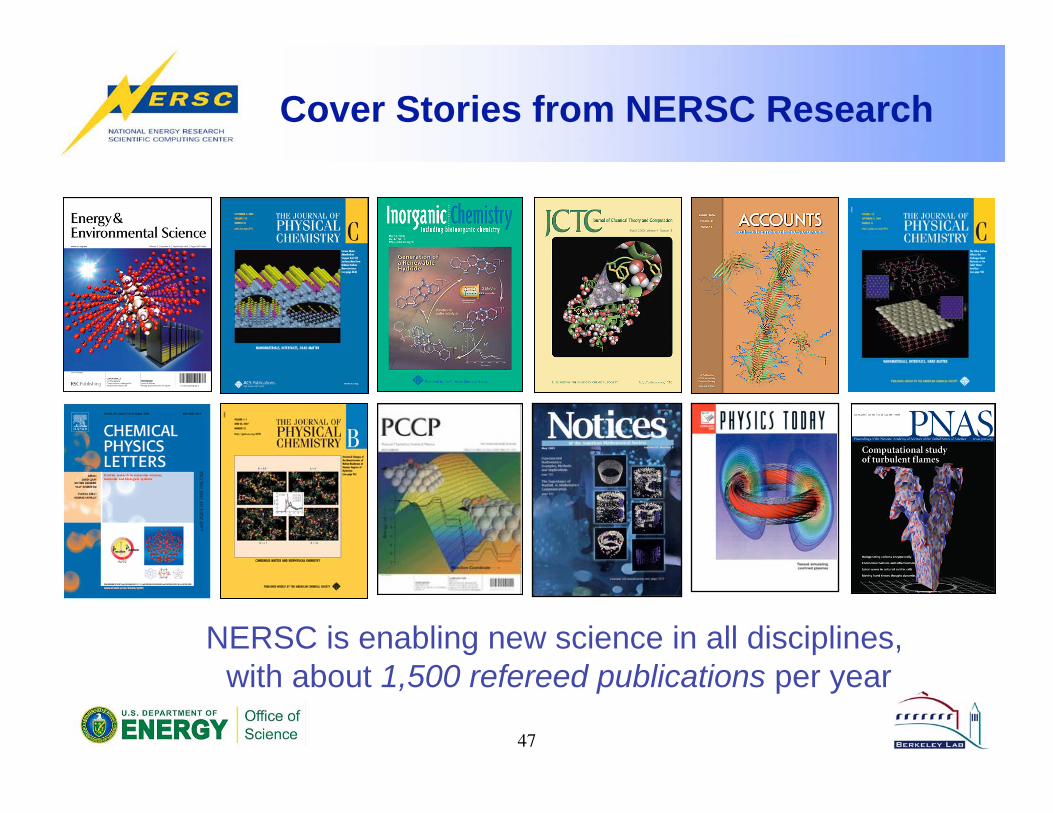
NERSC is enabling new science in all disciplines,
with about 1,500 refereed publications per year
47
Cover Stories from NERSC Research

About the Cover
48
Low swirl burner combustion simulation. Image shows flame radical, OH (purple surface and cutaway) and volume rendering (gray) of vortical structures. Red indicates vigorous burning
of lean hydrogen fuel; shows cellular burning characteristic of thermodiffusively unstable fuel. Simulated using an adaptive projection code. Image courtesy of John Bell, LBNL.
Hydrogen plasma density wake produced by an intense, right-to-left laser pulse. Volume rendering of
current density and particles (colored by momentum orange - high, cyan - low) trapped in the plasma wake
driven by laser pulse (marked by the white disk) radiation pressure. 3-D, 3,500 Franklin-core, 36-hour
LOASIS experiment simulation using VORPAL by Cameron Geddes, LBNL. Visualization: Gunther Weber,
NERSC Analytics.
False-color image of the Andromeda Galaxy created by layering 400 individual images captured by the Palomar Transient Factory (PFT) camera in February 2009. NERSC systems
analyzing the PTF data are capable of discovering cosmic transients in real time. Image courtesy of Peter Nugent, LBNL.
Numerical study of density driven flow for CO2 storage in saline aquifers. Snapshot of CO2
concentration after convection starts. Density-driven velocity field dynamics induces convective
fingers that enhance the rate by which CO2 is converted into negatively buoyant aqueous phase, thereby improving the security of CO2 storage. Image courtesy of George Pau, LBNL
Simulation of a global cloud resolving model (GCRM). This image is a composite plot showing several variables: wind velocity (surface pseudocolor plot), pressure (b/w contour lines), and a
cut-away view of the geodesic grid. Image courtesy of Professor David Randall, Colorado State University.
The exciton wave function (the white isosurface) at the interface of a ZnS/ZnO nanorod. Simulations performed on a Cray XT4 at NERSC, also shown. Image courtesy of Lin-Wang
Wang, LBNL.