NEMO 3.0 Product Description whatever the format. ... sudden call rate drop, ... to provide a...
32
NEMO 3.0 Product Description NetAxis Solutions
Transcript of NEMO 3.0 Product Description whatever the format. ... sudden call rate drop, ... to provide a...

NEMO 3.0 Product Description
NetAxis Solutions

NEMO 3.0 Product DescriptionNetAxis Solutions
Release Version 3.0Copyright © 2017 NetAxis Solutions

NEMO 3.0 Product Description
Table of Contents
Contact .................................................................................................................... 1NEMO Product Description ..................................................................................... 2
1. Overview ..................................................................................................... 21.1. Audience ........................................................................................... 21.2. Pre-requisites .................................................................................... 2
2. Essential concepts ....................................................................................... 32.1. Reference object .............................................................................. 32.2. Group ................................................................................................ 3
3. Main features .............................................................................................. 43.1. Monitoring of VoIP sessions in an IP network ................................. 53.2. Statistics and Reporting ................................................................... 53.3. Alarms definition and collection ...................................................... 53.4. Fast access to records for debugging ............................................... 53.5. Troubleshooting (only with Network probes) .................................. 53.6. Fraud detection ................................................................................ 63.7. Profiling ............................................................................................ 6
4. Documentation ............................................................................................ 75. Logical Architecture ..................................................................................... 8
5.1. Interface Layer .................................................................................. 85.2. Data Storage Layer ........................................................................... 95.3. Core Application Layer ................................................................... 10
6. Noteworthy distinctive features ................................................................ 157. Physical Architecture ................................................................................. 168. Dimensioning & Performance ................................................................... 17
8.1. Centralized server (CDR storage and statistics computation) ......... 178.2. Probes ............................................................................................. 18
9. Scalability ................................................................................................... 1910. Operations ............................................................................................... 20
10.1. Out-of-the-box data and results .................................................. 2010.2. Applications using optional modules ........................................... 21
11. Maintenance / Upgrades ......................................................................... 23A. NEMO Stats Reference List ............................................................................... 24
1. Call Statistics ............................................................................................. 242. Voice Quality Statistics .............................................................................. 263. Fraud Detection Statistics ......................................................................... 29
iii

Contact
ContactAll inquiries related to the features described in this document can be emailed [email protected].
1

NEMO Product Description
NEMO Product Description
1. OverviewThis document introduces NEMO, the Voice Over IP network reporting/monitoringtool developed by NetAxis Solutions. It intends to provide the information neededto understand the features, architecture, and operation of NEMO.
1.1. Audience
This product description is intended for the following audiences:
• network operators• large companies having their own SBCs• smaller companies using a shared VoIP network• third-party integrators• end-users.
Typical users of NEMO are usually the operators who set up and administer thesystem; on the network operator’s side, the key account managers, who access itto retrieve information about network capacity estimation, statistics and statisticalreports to use as a base for customized reports; and the PBX administrators and end-users on the customer’s side.
1.2. Pre-requisites
In order to operate, NEMO needs the following items to be available:
• an operations server, running RHEL 6.x• the MongoDB database
This NoSQL solution is preferred for its less strict, faster operationbased on “documents” instead of schema. An open source product,MongoDB involves no costs or license fees.
2

NEMO Product Description
2. Essential concepts
NEMO monitoring operations are closely related with the Reference object andGroup concepts described below. Both define the contexts and sets of data thatNEMO features are using.
2.1. Reference objectThe reference object is tightly linked to the device under monitoring. This is aconfiguration object that is used by NEMO as a reference to compute statistics.
Examples of reference objects :
• Realms for Oracle SBC, Genband SBC• Enterprise/Group for Broadsoft Application server• Trunk for Sonus• Domain for Italtel NetMatch
Note that, in case NEMO uses probes, the reference object is the combination ofVLAN + IP address + Probe ID.
2.2. GroupThe notion of group is the cornerstone of NEMO. All features and access rights arebased on group:
• NEMO users are linked to groups. Users can only visualize the statistics for thegroup they are configured for.
• Report production configuration is done on group basis.• Anomalies and threshold configuration are done on group basis.• SNMP receiver configuration is done on group basis.• …
A group can be any of the following:
• a single reference object• a set of reference objects : known as a label in NEMO terminology• a set of endpoints (IP addresses) belonging to a reference object : known as a
endpoint in NEMO terminology• a set of « number ranges » belonging to a reference object : known as a range in
NEMO terminology.
Note also that NEMO allows a mixed configuration. NEMO could, for example, havea group defined by a label that contains a single reference object and an endpoint.
3
NEMO Product Description
3. Main featuresNEMO is a monitoring and reporting platform able to reflect the usage of a VoIPnetwork. NEMO gathers network information using network probes and CDRs.
The CDR interfacing architecture is fully modular in order to further enhance NEMO’sability to interface with different network elements. This modularity is based onplugins, which are currently available for the following vendor equipments:
• Acme/Oracle Net-Net SD (1100, 3820, 4500, 4600, 6300, 9200)• Acme/Oracle SMX• Audiocodes Mediant series (800, 1000, 2000, 3000)• Genband S3• Broadsoft• Sonus• Mitel• Huawei
Thanks to its proprietary process, NetAxis Solutions can develop in no time a newplugin for any equipment not listed above. This process is based on existing CDRsanalysis, whatever the format.
By relying on existing network elements monitoring features, NEMO natively avoidsthat probes need to be installed in the network, which greatly reduces costs as wellas maintenance activities. However, when needed, the Probe module can be added:served with the call data coming from appropriate networks taps, it allows packetscapture and in-depth analysis.
NEMO is an All-In-One product for VoIP Services and Networks, covering thefollowing functions:
• Monitoring• Reporting• Troubleshooting• Alarming• Debugging• Fraud detection
4

NEMO Product Description
3.1. Monitoring of VoIP sessions in an IP network
NEMO allows monitoring the usage of the VoIP network made by the users, the calldestinations, durations,... as well as the quality of the IP network (packet loss, jitter,latency, MOS, R-Factor, codecs, media bandwidth). NEMO offers a set of very flexiblegraphs to visually inspect all aspects of the VoIP network traffic.
3.2. Statistics and Reporting
NEMO automatically compiles all the metrics consolidated by the platform intocustomized reports, generated on a regular basis and made available to Operators,Integrators, and End-Customers. This ensures that all parties get access to thestatistics they are interested in. One of the formats used for reporting is fullyeditable, allowing for a more advanced customization if needed: this is often arequirement of Key Accounts Managers.
3.3. Alarms definition and collection
3.3.1. Anomaly definition and alarm generation
Alarm types, criteria and thresholds can be easily defined and modified from a largeset of pre-defined alarms. Thanks to its traffic patterns' analysis engine, NEMO isable to detect traffic anomalies which are not usually notified via discrete alarms(such as SNMP traps): sudden call rate drop, abnormal calls duration, high error rate,and more.
3.3.2. Alarms collection
The SNMP Traps Management tool allows defining SNMP rules to raise, from traps/events selected from the vendor's MIBs, customer-defined alarms with significantname, severity, and notifications.
Upon anomalies detection, NEMO generates an alarm that can be sent using SNMP,mail or SMS.
3.4. Fast access to records for debugging
The NEMO interface provides direct access to the calls records, allowing the systemoperator to search the calls details on a reported alarm or anomaly. This makesdebugging easy and fast.
3.5. Troubleshooting (only with Network probes)
NEMO can capture both signalling and media of calls and gather this informationto provide a graphical end-to-end call flow as well as the possibility to listen to theRTP media flows (directly form the GUI) of the call to troubleshoot the voice quality.NEMO allows the retrieval and download of the call trace in .pcap format.
5

NEMO Product Description
NEMO offers also the possibility to compare two media streams using PESQstandard.
Media capture can be activated either for all monitored calls or depending on callcriteria (for example calling/called number).
3.6. Fraud detection
The ENGO module provides, besides usual protection appliances, a solution ableto analyze the voice traffic, to compute KPI and to provide tools (for example Callblocking) to fight against abuse of infrastructure, and to reduce exposure to potentialfinancial losses. This module comes with a frequently updated list of the numberranges considered as fraudulent.
3.7. Profiling
Monitoring/reporting/alarming fine-grained profiles are created for every singleentity monitored by NEMO.
The same applies for web portal user access; the rights provided to a user are fullycustomizable, allowing one user to see the whole network and another user to haverestricted access (monitored entity he can view, statistics, available reports…)
6

NEMO Product Description
4. DocumentationThis Product Description covers NEMO features, logical and physical architecture,dimensioning/scalability, performance, day-to-day operations, and maintenance /upgrade operations.
NEMO also comes with a digital User Guide, which describes in full details:
• its interface• how to use it to get the type of information desired,• how to create and give rights to users,• how to manage groups,• how to define alarms type and thresholds,• how to analyze calls, traces, and anomalies,• how to view graphs,• how to generate and view reports,• and more.
Users are invited to view it as the help system of the NEMO platform.
7

NEMO Product Description
5. Logical Architecture
NEMO logical architecture is a three-layer one: Interface Layer, Data Storage Layerand Application Layer.
NEMO has been designed to be modular: all these logical layers can either run onthe same physical entity or be spread on different physical entities.
The picture below describes the logical architecture of a NEMO platform usingProbes.
5.1. Interface Layer
This layer holds the interface between the NEMO database and the elements of thenetwork. Interface layer is made of 4 elements:
1. Plugin : the plugin acts as a mediation layer to cope with different vendor CDRformats. There is a special plugin for CDRs coming from the Orchestrator.
2. Orchestrator : the interface to NetAxis Probes. This is also the element makingcall correlation for calls captured by multiple probes.
3. SNMP listener : SNMP interface collecting SNMP traps from different networkelements.
4. Connector : the connector manages the transport protocol layer and data-modelprotocol (Radius, CSV, XML). Two transport protocols are currently supported byNEMO : (S)FTP and Radius.
8
NEMO Product Description
5.2. Data Storage Layer
NEMO uses MongoDB, a scalable, document-oriented database providing a high-performance key-value data store. This open source DB can be installed by thecustomer or by NetAxis. No costs or license is applicable to this part of the system.
MongoDB is a NoSQL database. Due to its schema-less architecture, it does notenforce strong consistency. Consistency is ensured at application-level by thedifferent modules of the NEMO platform. MongoDB can be spread over severalservers for dimensioning, redundancy or performance purposes. A single MongoDBinstance can support up to 1 billion records.
NEMO uses 7 logical databases:
1. The database calls holds the CDRs collected by the platform from the networkelements. It is composed of several collections:• The collection sbccdrs collection holds the raw CDRs, collected through the
RADIUS interface.• The collection realms holds the realms details. This collection is populated
as new realms are learned by the platform.• The collection nas holds the session border controller details.• The collection labels is used to logically group together several realms or
endpoints.
In addition to the CDRs, the database calls also holds the call traces (call datacaptured by the probes if present).
2. The database anomalies holds the historical and current anomalies detectedby the system:• The collection anomaliesProfile holds the different anomalies’ profiles
configured on the system with specific tests and threshold values.• The collection anomalies holds the anomalies detected by the Anomalies
Engine.
3. The database statistics holds the statistics computed by the Stats Engine,based on the raw CDRs present in the database calls:• The collection statistics holds the statistics computed by the Stats Engine
on a per-realm basis.• The collection statisticsPerIP holds the statistics computed by the Stats
Engine on a per-realm/IP basis.
4. The database reports holds the reports generated by the Reporting Engine:• The collection reportingTemplates holds the templates configured on
the system to generate the appropriate reports• The collection reports holds the reports generated so far. This collection
holds both the metadata and the report files (DOCX or PDF).
5. The database nemo holds the platform configuration and current status:• The collection modules holds run-time details about the different engines.• The collection settings holds the different engines' configurations.
9

NEMO Product Description
6. The database users holds the GUI users configured on the system:• The collection users holds the users’ authentication and profile details.• The collection privileges describes the access rights to the different GUI
modules.
7. The database SNMP holds the SNMP traps received by network elements.
5.3. Core Application Layer
The application layer is made of two sub-layers : a Back-end layer and a Front-end layer. Those can either run on the same physical entity or be spread over twodifferent physical entities.
5.3.1. Back-end modules (data processing)
1. The Stats Engine aggregates data from 30 different counters and feeds theStatistics database with consolidated, relevant information.
The Stats Engine runs at regular intervals and processes the CDRs inserted sinceits previous run to update the Statistics database with the metrics extracted fromthese new calls. These metrics are aggregated (summed, averaged or weighted)into fixed time slots. Several Stats Engine instances can run simultaneously onthe platform. An election mechanism is present to prevent two instances fromoperating on the same group. The statistics computed by the Stats Engine areused by the other engines and the GUI for further processing.
Important
Available Stats may differ depending on the plugin installed, which initself does not manage more than the data provided in the CDRs.
The list of all available stats is provided in Appendix A - NEMO Stats Reference List.
2. The Anomalies Engine processes statistical data to detect anomalies based onconfigurable thresholds.
The Anomalies Engine runs at regular intervals to process the statistics computedby the Stats Engine and report anomalies if present. For each group withAnomalies active, the Anomalies Engine retrieves the assigned anomalies profile.This anomalies profile describes which tests to run and which thresholds to use toconsider the test results as passed or failed. Multiple anomalies profiles can co-exist on the system. A group can be assigned one anomalies profile at the most.The results of the tests are stored in the database.
3. The Reporting Engine extracts metrics from the database and generatesconsolidated reports.
The Reporting Engine runs at regular intervals to process the statistics computedby the Stats Engine and produce downloadable reports in either Microsoft Office
10

NEMO Product Description
Word 2007 format (with .docx extension) or Adobe Acrobat format (with .pdfextension). For each reporting template, the Reporting Engine retrieves the listof realms, endpoints and labels associated with this template and produces thereports for the periods not yet processed. The frequency can either be daily,weekly or monthly.
4. The CDR-Export Engine runs at regular intervals to process the CDRs hosted inthe calls database and to generate consolidated CSV files containing a list ofCDRs. Files' content is based on CDR export templates specifying which CDRsand which CDR fields must be included. For each CDR export template, the CDR-Export Engine retrieves the list of realms, endpoints and labels associated withthis template and produces the CSV files for the periods not yet processed.
5. The Stats-Export Engine runs at regular intervals to process the statistical datahosted in the statistics database and to generate consolidated CSV filescontaining a list of stats. Files' content is based on stats export templatesspecifying which stats must be included. For each stats export template, the Stats-Export Engine retrieves the list of realms, endpoints and labels associated withthis template and produces the CSV files for the periods not yet processed.
6. NEMO 3.0 introduces a new engine on top of NEMO classical ones (StatisticsEngine, Reporting Engine, Anomalies Engine...). This Probe Engine is used tocapture packets from the network interface, to analyze them, to identify the SIPcalls among the packets, and generally speaking to trace ongoing calls. For thepackets to reach the Probe Engine and be analyzed, network taps are used. Placedat strategic network locations, the taps collect all incoming and outgoing packetsthrough "network ports", copy them, and send them to the Probe Engine through"monitoring port(s)". They become then available for inspection in the SearchTraces page.
As tracing is highly resource-consuming, especially on audio datacapture and storage, the Settings > Tracing page helps definingconditions to limit the packets capture, excluding RTP captureand setting ranges of calling/called numbers - or even a specificnumber. A typical setting would be to define two active traces:one to capture all packets except RTP for all calls, a second one tocapture all packets including RTP but for one single number. Whentracing without and with RTP capture are present together, theone with RTP capture has priority.
5.3.2. Front-end modules (Graphical User Interface)
NEMO offers a Web-based dynamic user interface, compatible with IE/Edge, Firefox,and Chrome. It is accessed through a privileges-based access control: any givencustomer has access to its own group only.
The GUI displays graphs of any statistics (sessions, packets loss, jitter, …), and allowssearching the calls database, browsing anomalies detected by the system, openingoperator and customer reports and setting up the system.
11

NEMO Product Description
The complete description of the GUI is provided in the NEMO User Guide.
1. The Call Statistics module interfaces with the Stats Engine to provideconsolidated calls information. Statistics are displayed to the end-user in anintuitive way using charts or tables.
The following charts are available:• Line/Area chart• Bar chart• PIE chart
For line charts, NEMO gives the possibility to perform a zoom on a specific areaof the graph, to display the calls involved in the displayed chart and to downloada .csv file listing these calls.
2. The Voice Quality module interfaces with the Stats Engine to present valuablevoice quality measurements (packet loss, jitter, MOS, R-Factor…) to the end-user.
The information is presented in the same way as in Call Statistics above.
3. The Calls module interfaces directly with the CDR database to perform a searchfor calls depending on various criteria, and to search and inspect traces.
The information in Search Calls comes from the collected CDRs. Next to the CallCDR tab presenting CDR data, NEMO 3.0 implements a new tab: Call Flow, whichdisplays all messages captured by NEMO sent over SIP protocol for the selectedcall. The detailed content of each SIP message is displayed when you mouse overit.
NEMO also captures audio data in both directions and converts it into mp3 so itcan be replayed.
pcap traces for the call can be downloaded from NEMO, which allows checkingevery packet in the call (signaling (SIP), audio (RTP), etc.), or filtering packets,using the new built-in Trace Analysis tool (see below) or some 3rd party softwarelike Wireshark.
NEMO can record the call data through probes (see Probe Engine above), andstores them into the calls DB.
• Search Calls queries the CDRs and returns the traces that are linked to theselected call (through the call ID present in the CDR, which allows correlatingand aggregating the traces for one call).
• Search Traces queries the traces themselves instead, and returns themirrespective of the call they belong to. Traces record pieces of information that
12

NEMO Product Description
are not present in the CDRs, e.g. REGISTER messages. Another use case is whenno SBC is present and no CDRs at all are recorded (so no calls are present inSearch Calls): in such a situation, Search Traces allows using the captured tracesfor inspection and download for further and closer examination with TraceAnalysis.
Note however that without CDRs, NEMO cannot compute any statistics (voicequality, packet loss, jitter etc.).
• Trace Analysis, another tool introduced with NEMO 3.0, allows inspectinga Wireshark/pcap trace file downloaded from the Search Traces page orcaptured with an external tool, and manually submitted to the Trace Analysisengine. It provides a Call Flow tab (similar to the one in Search Calls) where thecall is represented graphically with replay of voice data, and an RTP Analysistab showing the content of each and every packet in the trace (50 packets persecond).
4. The Anomalies module interfaces with the Anomalies Engine and exposesa browser listing the anomalies detected by NEMO based on statistics andthresholds. The list of anomalies, presented in a table, contains for each entrya time stamp, the anomaly description, the severity and the group the anomalyis related to. Anomalies Profiles, defined per group, contain a set of alarm rulesand the SNMP addresses to send messages to (+ e-mails + SMS), and more. Theanomalies themselves can be configured with severity, activation/deactivationand a powerful and flexible set of detection criteria.
The Anomalies module interfaces also with the SNMP database to implementthe SNMP Alarms feature allowing to manage SNMP traps in a customized andefficient way.
Vendor equipments (SBC) come with SNMP traps' MIBs. Traps arevendor-defined; they report events occurring during calls on theequipment(s) monitored by Nemo.
NEMO allows defining SNMP rules to raise, from traps/eventsselected from the vendor's MIBs, customer-defined alarms withsignificant names, severity, and notifications.
Trap names can be used as containers in the alarmrules, resulting in easy-to-catch alarm labels like "Authfailed from 10.0.0.195:55349" in place of "Auth failed from{{apSysMgmtAuthFailOrigin}}".
Alarms can send notifications through e-mail or SMS, and can beacknowledged.
5. The Reporting module interfaces with the Reporting Engine and exposes abrowser for the reports. The report list, displayed as a table, contains for eachentry the period covered by the report, the report template, the frequency (daily,weekly, monthly), the group the report is related to, and a Download button.
13

NEMO Product Description
Just as with the Anomalies browser, a reporting profile is defined, then appliedto a group. There is no “generic” report content: what will appear in the report isselected in the Report Elements tab. The report output format is PDF or .docx.
The current list of elements available for reports is as follows (see Appendix ANEMO Stats Reference List for a definition of each stat):• Total Capacity Usage Distribution• Traffic Intensity• Max Simultaneous Calls• Call Rate• Calls Durations• Destinations• Release Causes• RTP Packet Loss• RTCP Packet Loss• RTP Packet Jitter• RTCP Packet Jitter• RTCP Packet Latency• RTP Packet MOS Overview (simplified pie chart)• RTP Packet MOS• Anomalies
The Reporting module interfaces also with the cdr-export and stats-exportengines to expose two other browsers:
• The cdr-export list, displayed as a table, contains for each entry the creationdate, the cdr-export profile used, the number of CDR records included in the.csv file, the group the CDRs are related to, and a Download button.
• The stats-export list, displayed as a table, contains for each entry the creationdate, the stat-export profile used, the frequency, and a Download button.
14

NEMO Product Description
6. Noteworthy distinctive features• In any statistics graph, a zoom allows easy location of issues.
• The Call list button allows finding and inspecting the calls that correspond to aspecific area, zoomed or not. However, this button is not available for aggregateddisplays, as the call data from several reference objects are aggregated.
• In the stats and statistical graphs, distinction is made between incoming calls andoutgoing calls.
• Defining groups directly impacts NEMO behavior: monitoring, stats and reportsare tightly linked to groups. Groups determine the granularity of the stats andreports. Depending on what makes a group (see Essential Concepts / Groupsabove), data subsets are defined and used to provide stats and reports for thisgroup/subset. Groups can be aggregated.
• NEMO uses home-made plugins to capture and manage the data coming frommonitored equipments. It must be noted that these equipments provide differentdata and different detail level of data. This explains why all possible stats are notavailable from some equipments.
• Using probes to capture data in the monitoring overrides this limitation: alldata are captured (possibly with filtering), overcoming the limitations on theinformation provided by the equipment and managed by the plugin.
• NEMO can compute statistics on various logical entities, and these entities can begrouped in several ways: groups, labels, endpoints, ranges of numbers.
• Labels, endpoints and ranges provide for higher flexibility, for example by groupingtwo groups into one label and generating reports for the label (seen as a singleentity).
• An Endpoint is an IP address inside a group. Stats are computed for the group, butalso for each endpoint element.
• Ranges go one level down, defining a range of numbers used into one IP address.All NEMO features are applicable on ranges.
15

NEMO Product Description
7. Physical ArchitectureThe physical environment needed to install and operate NEMO platform is mainlydepending on security constraints, which are specific to the customer. NetAxisteam can assist customer’s network architects in selecting the most appropriateconfiguration. Some useful information can be found in the next section.
16

NEMO Product Description
8. Dimensioning & Performance
8.1. Centralized server (CDR storage and statisticscomputation)
Centralized server can be virtualized.
8.1.1. Performance
The table below provides typical performance values for a single-node deployment.These are strongly linked to the available hardware configuration: the referencesystem used to collect these values is a Quad-core CPU, 8 GB RAM, 500 GB HD, 2 x7200 RPM Hard Disks.
Average CDR processing performance 200 calls/sec
Peak CDR processing performance 300 calls/sec
Maximum number of realms withstatistics active
2000
Maximum number of users 5000
Maximum number of simultaneous usersessions/requests
50
Maximum number of CDRs in database 200 000 000
Further performance can be achieved in multi-nodes deployment: performancescales linearly with a number of back-end nodes.
Note that in virtualized environments, performance might degrade depending onother guest VMs running on the same host. The most important factor is I/Operformance, rather than CPU performance.
8.1.2. Dimensioning without probes, possibly with virtualization
The following data provide the dimensioning information for the elements of theNEMO platform:
• OS + Nemo: 15 GB• database filesystem:
• calls: 1.8 KB * number of CDRs to hold• statistics: 3 MB * (number of groups with stats active + number of individual
IPs with stats active) * number of days to hold• reports: 200 KB * number of reports to hold• plan 25% of free storage for database management (repair, etc...)• plan 20% of unallocated storage to snapshot the database
• raw CDRs filesystem:• uncompressed (current day and previous day): 400 MB per day + 2.2 KB *
number of CDRs
17

NEMO Product Description
• backup filesystem:• compressed CDRs: 20% original size• database: 25% original size• temporary storage of DB before compression: same as original DB
8.2. Probes
Network Probes cannot be virtualized.
Three network probes models are available: S, M and L.
Probe Model S M L
Capture Interfaces 2 x 1 Gbps 4 x 1 Gbps 4 x 1 Gbps
Power Single Redundant Redundant
Storage Single Redundant (RAID 1) Redundant (RAID 1)
Storage Type HD HD SSD
Values Unit S M L
Maximum packet rate per probe server packetsper second
800 000 1 000 000 1 200 000
Maximum bandwidth per probe server Gbps 1,6 2 2,4
Maximum call rate per probe server calls/second 200 400 600
Maximum packet rate per interface packetsper second
400 000 400 000 400 000
Maximum bandwidth per interface Gbps 0,8 0,8 0,8
Maximum call rate per interface calls/second 100 150 200
Maximum simultaneous calls SIP signaling capture calls count 2 000 3 000 4 000
Maximum simultaneous calls RTP media capture calls count 200 400 2 000
Maximum simultaneous calls RTP media stats calls count 2 000 3 000 4 000
RTP media storage capacity hours 4 000 8 000 6 000
18
NEMO Product Description
9. ScalabilityAs already mentioned, NEMO can be spread over several servers to improveperformance and security. Such a configuration would include:
• a dedicated Radius server• a replicated DB server having a slave DB replication• several replicas of the DB allowing load sharing on data access operations.
19
NEMO Product Description
10. Operations
10.1. Out-of-the-box data and results
Operator reports
Operator reports provide the following information:
• Call related info: Sessions, Calls Durations, Destinations, Release Causes• Voice Quality: Packet Loss, Packet Jitter, Packet Latency, Mean Observation Score• Anomalies
The Operator can access this report on a daily/weekly/monthly basis.
These reports can be made per:
• Business Customer (based on Realm, i.e. customer configuration)• Aggregation for the same Customer (Sip Trunk + Wireless Office Extended)• per IP Address within a Realm (e.g. for I-Office Multi product)• per group of Customers• for Residential users (based on their Realm)• per SBC…
Reports for Business Customers
The Operator defines a template of reports containing relevant/requestedinformation, for example:
• Call related info: Sessions, Calls Durations, Destinations, Release Causes• Voice Quality: Packet Loss, Packet Jitter, Packet Latency, Mean Observation Score
On a subscription base, the Business Customer can access its report on a daily/weekly/monthly basis. Access is based on privileges-based GUI: the customer hasaccess to its own data only (Realm)
Reporting tool for Corporate SBC usage
NEMO can be deployed “in the cloud” and sold as a service.
Each Business Customer having a Corporate SBC can have its own NEMO instancein the Operator Data Center (or on its premises). The NEMO instance collects CDRsfrom the Corporate SBC (via Explore or directly on the WAN/LAN) and populates theCustomer dedicated DB.
The Business Customer can generate reports as defined by the Operator:
• Traffic Statistics• Call Sessions• Calls Durations
20
NEMO Product Description
• Destinations• Release Causes• Voice Quality• Packet Loss• Packet Jitter• Packet Latency• Mean Observation Score
On a subscription base, the Business Customer can access its report on a daily/weekly/monthly basis.
Capacity Planning
NEMO can collect and aggregate information related to the Network usage (BHCA,Call Intensity, Call Rate) and instantiate this information per SBC, per group of realmsor per any relevant grouping method.
Results can be displayed as tables or as graphs. Reports can be generated per day/week/month or immediately.
10.2. Applications using optional modules
NEMO can be used as a Trending and Marketing support tool.
NEMO can generate queries across the DB’s in order to support Marketing teams inidentifying their targets and supporting their strategy. Examples of such queries are:
• size of business customer (based on BHCA)• destinations (national, mobile, international, premium, VAS numbers, …)• codec usage• call characteristics.
Based on this information, an analysis can be performed for defining better targetsand product packages.
Example: for Business Customer 50-100 users, SIP Trunk product should be offeredwith:
• Flat fee for National calls• Free for one specific Mobile Operator, XX for other Mobile’s Operator• Flat fee for some countries• …
NEMO has a complete view of the calls performed by a Business Customer.Therefore, the REVENUES additional module of NEMO can make use of TARIFF PLANSfor:
• giving an estimation of the revenues generated by the specific Business Customerduring the past periods
• producing an estimation of the future revenues based on new TARIFF PLANS
21

NEMO Product Description
• Marketing can analyze different pricing scenario’s and get an estimation of therevenue impact
• Segmentation of the Business Customers can be refined using the analysis criteriaand the REVENUES module.
22

NEMO Product Description
11. Maintenance / UpgradesNEMO is a software fully developed and owned by Netaxis Solutions.
The versioning is a formalized version number structure based on the NumVersionstructure, which specifies a one- or two-digit major version, a one-digit minorversion, a one-digit "bug" (i.e. revision) version.
Major versions contain major new features and may include a break of interfaceor data model if required by the new functionalities. However, Netaxis Solutionswill always make the maximum efforts to avoid disruptive evolution of its licensedsoftware.
Minor versions contain features evolutions and minor new functionalities. No breakof interface or data model is involved.
Revision versions contain a number of bug fixes and are released in order tocontinuously improve the licensed software.
END OF DOCUMENT
23

NEMO Stats Reference List
Appendix A. NEMO Stats Reference List
1. Call Statistics
Label Description
Sessions
Total Capacity Usage Illustrates the proportion of time where various levelsof total capacity usage have been reached.
Minutes of Usage Describes the total duration of calls in minutes, hourlyor daily, depending on the window of time selected.
Traffic Intensity Describes the average number of concurrent calls inprogress. The erlang is the unit used to represent thismeasurement.
Maximum simultaneous calls The maximum number of concurrent calls observed.
Call rate The number of call attempts (successful and failed) persecond.
Calls Durations
Connection Phase DurationDistribution
The connection phase is the period of time betweenthe moment the call is answered (connected) andthe moment the call is released (disconnected).This histogram represents the distribution of thesedurations. Each bar represents the percentage of calls(vertical axis) which have a specific duration (horizontalaxis).
Average Connection Phase Duration This chart represents the average connection phaseduration over time.
Alerting Phase Duration Distribution The alerting phase is the period of time between themoment the call is initiated (setup) and the moment thecall is answered (connected). This histogram representsthe distribution of these durations. Each bar representsthe percentage of calls (vertical axis) which have aspecific duration (horizontal axis).
Average Alerting Phase Duration This chart represents the average alerting phaseduration over time.
Calls Destinations & Sources
Destination Distribution: National vsInternational
This chart illustrates the destination distributionbetween national and international calls.
Source Distribution: National vsInternational
This chart illustrates the source distribution betweennational and international calls.
Destination Distribution: National This chart illustrates the destination distribution fornational calls.
24

NEMO Stats Reference List
Label Description
Source Distribution: National This chart illustrates the source distribution for nationalcalls.
Destination Distribution:International
This chart illustrates the destination distribution forinternational calls.
Source Distribution: International This chart illustrates the source distribution forinternational calls.
Release Causes
Ingress Calls ISDN Cause Distribution This chart illustrates the distribution of calls ISDNcauses.
Egress Calls ISDN Cause Distribution This chart illustrates the distribution of calls ISDNcauses.
Ingress Calls Disconnect CauseDistribution
This chart illustrates the distribution of calls disconnectcauses, grouped in classes.
Egress Calls Disconnect CauseDistribution
This chart illustrates the distribution of calls disconnectcauses, grouped in classes.
Ingress Calls SIP Status Distribution This chart illustrates the distribution of individual SIPerror codes.
Egress Calls SIP Status Distribution This chart illustrates the distribution of individual SIPerror codes.
Ingress Calls Termination CauseDistribution
This chart illustrates the distribution of Broadworkstermination causes.
Egress Calls Termination CauseDistribution
This chart illustrates the distribution of Broadworkstermination causes.
Session Establishment Ratio
SER (aka: ASR)
The session establishment ratio (SER, also known asanswer seizure ratio, ASR) is the percentage of callsanswered with respect to the total number of callattempts. The scale goes from 0% (no calls answered)to 100% (all calls answered).
Session Establishment EffectivenessRatio
SEER (aka: NER)
The session establishment effectiveness ratio (SEER,also known as Network Efficiency Ratio, NER) is thepercentage of calls answered with respect to the totalnumber of call attempts. Calls released because of userbusy, no answer, etc... are excluded from this metric.It is designed to eliminate user behavior as factor andbetter represent pure network performance. The scalegoes from 0% (no calls answered) to 100% (all callsanswered).
Ineffective Session Attempts Ratio
ISA
The ineffective session attempts ratio (ISA) is thepercentage of calls released with a failed or overloadcondition. The scale goes from 0% (no ineffectivesession attempts) to 100% (all session attempts areineffective).
25

NEMO Stats Reference List
Label Description
RCS Sessions Types
Ingress RCS Session TypeDistribution
This chart illustrates the distribution of RCS sessiontypes.
Egress RCS Session Type Distribution This chart illustrates the distribution of RCS sessiontypes.
User-Agent
Ingress RCS Terminal Distribution This chart illustrates the distribution of RCS terminalmodels.
Egress RCS Terminal Distribution This chart illustrates the distribution of RCS terminalmodels.
RCS File Transfers (as above)
Ingress RCS File Transfer TypeDistribution
This chart illustrates the distribution of RCS file transfertypes.
Egress RCS File Transfer TypeDistribution
This chart illustrates the distribution of RCS file transfertypes.
RCS File Transfer Bandwidth This chart illustrates the bandwidth consumed for RCSfile transfers over time.
2. Voice Quality Statistics
Label Description
Packet Loss
Packet loss occurs when one or more packets of RTP data travelling across a VoIP network failto reach their destination.
RTP Average Packet Loss Distribution This histogram represents the packet loss distribution(for each interval indicating a packets loss level on thehorizontal axis, the bar height indicates the percentageof calls affected by this packet loss level). The statisticsare measured based on the RTP flows observed by theSBC.
RTP Average Packet Loss Over Time This chart represents the measured packet loss overtime. The statistics are measured based on the RTPflows observed by the SBC.
RTCP Average Packet LossDistribution
This histogram represents the packet loss distribution(for each interval indicating a packets loss level on thehorizontal axis, the bar height indicates the percentageof calls affected by this packet loss level). The statisticsare measured based on the RTCP reports sent by bothcall endpoints. The accuracy of the RTCP reports canvary depending on the endpoint type.
26

NEMO Stats Reference List
Label Description
RTCP Average Packet Loss Over Time Packet loss occurs when one or more packets of RTPdata travelling across a VoIP network fail to reach theirdestination. This chart represents the measured packetloss over time. The statistics are measured based on theRTCP reports sent by both call endpoints. The accuracyof the RTCP reports can vary depending on the endpointtype.
Packet Jitter
Jitter is the variability over time of the packet latency across a network.
RTP Average Jitter Distribution This histogram represents the jitter distribution (foreach interval indicating a jitter level in ms, the barheight indicates the percentage of calls affected by thisjitter level). The statistics are measured based on theRTP flows observed by the SBC.
RTP Average Jitter Over Time This chart represents the measured jitter over time.The statistics are measured based on the RTP flowsobserved by the SBC.
RTCP Average Jitter Distribution This chart represents the measured jitter over time. Thestatistics are measured based on the RTCP reports sentby both call endpoints. The accuracy of the RTCP reportscan vary depending on the endpoint type.
RTCP Average Jitter Over Time This chart represents the measured jitter over time. Thestatistics are measured based on the RTCP reports sentby both call endpoints. The accuracy of the RTCP reportscan vary depending on the endpoint type.
Packet Latency
One-way packet latency is the time between the moment a voice packet is transmitted andthe moment it reaches its destination. It leads to delay and may lead to echo.
RTCP Max Latency Distribution This histogram represents the maximum latencydistribution (for each interval indicating a maximumdelay on the horizontal axis, the bar height indicates thepercentage of calls affected by this delay). The statisticsare measured based on the RTCP reports sent by bothcall endpoints. The accuracy of the RTCP reports canvary depending on the endpoint type.
RTCP Avg Latency Distribution This histogram represents the average latencydistribution (for each interval indicating an averagedelay on the horizontal axis, the bar height indicates thepercentage of calls affected by this delay). The statisticsare measured based on the RTCP reports sent by bothcall endpoints. The accuracy of the RTCP reports canvary depending on the endpoint type.
27

NEMO Stats Reference List
Label Description
MOS
(Mean Observation Score – formerly known as Mean Opinion Score for PSTN voice)
Ingress MOS Overview Mean Observation Score (MOS) is a measure (score) ofthe audio quality based on different factors. The scalegoes from 1 to 5, 1 being the worst quality and 5 beingthe best quality. This chart illustrates the percentage ofcalls with various score levels.
Egress MOS Overview
RTP MOS Distribution Mean Observation Score (MOS) is a measure (score) ofthe audio quality based on different factors. The scalegoes from 1 to 5, 1 being the worst quality and 5 beingthe best quality. This histogram represents the MOSdistribution (for each interval indicating a score on thehorizontal axis, the bar height indicates the percentageof calls with this score).
RTP MOS Over Time This chart represents the MOS over time.
R-Factor
R-Factor is a measure (score) of the audio quality based on different factors. The scale goesfrom 0 to 100, 0 being the worst quality and 100 being the best quality.
R-Factor Distribution This histogram represents the R-Factor distribution (foreach interval indicating a score on the horizontal axis,the bar height indicates the percentage of calls with thisscore).
R-Factor Over Time This chart represents the R-Factor over time.
Codecs
Ingress Calls Codecs Distribution This chart illustrates the distribution of codecs amongingress calls.
Egress Calls Codecs Distribution This chart illustrates the distribution of codecs amongegress calls.
Ingress Packetization TimeDistribution
This chart illustrates the distribution of packetizationtimes among ingress calls. The packetization time is theamount (in milliseconds) of audio data that is sent in asingle RTP packet.
Ingress Packetization TimeDistribution
This chart illustrates the distribution of packetizationtimes among egress calls. The packetization time is theamount (in milliseconds) of audio data that is sent in asingle RTP packet.
Media Bandwidth
Media Bandwidth Over Time The media bandwidth is the bandwidth (in kbit/s) usedto transport the media inside RTP packets.
28
NEMO Stats Reference List
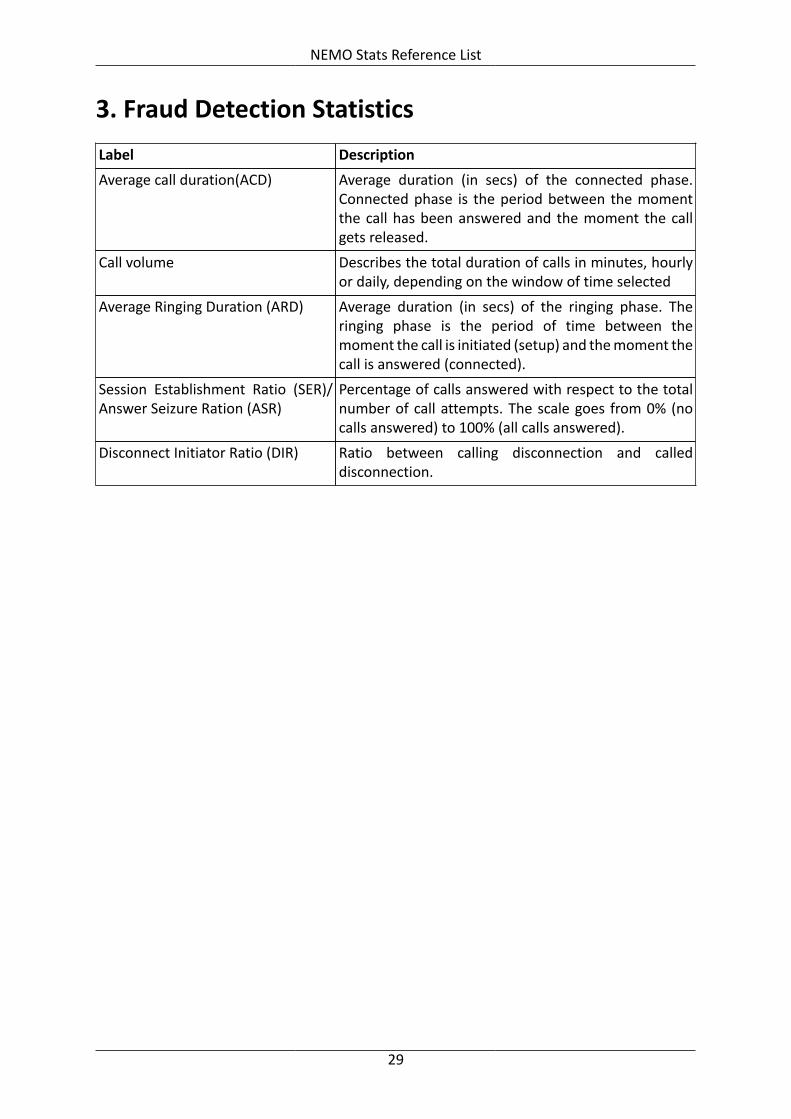
3. Fraud Detection Statistics
Label Description
Average call duration(ACD) Average duration (in secs) of the connected phase.Connected phase is the period between the momentthe call has been answered and the moment the callgets released.
Call volume Describes the total duration of calls in minutes, hourlyor daily, depending on the window of time selected
Average Ringing Duration (ARD) Average duration (in secs) of the ringing phase. Theringing phase is the period of time between themoment the call is initiated (setup) and the moment thecall is answered (connected).
Session Establishment Ratio (SER)/Answer Seizure Ration (ASR)
Percentage of calls answered with respect to the totalnumber of call attempts. The scale goes from 0% (nocalls answered) to 100% (all calls answered).
Disconnect Initiator Ratio (DIR) Ratio between calling disconnection and calleddisconnection.
29