2017 Year-end Earnings Call Presentation 14.03
22
2017 Year-end Earnings Call Presentation 14.03.2017
Transcript of 2017 Year-end Earnings Call Presentation 14.03
2017 Year-end Earnings Call
Presentation
14.03.2017

Table of Contents
1
1. Turcas: A Sustainable Investment Platform
a) Turcas at a Glance……………………………………………………………………2
b) Group Structure & Milestones……………………………………………………..3-4
c) Shareholding Structure & Stock Information……………………………………….5
d) Turcas Dividend Stream……………………………………………………………...6
2. Investments
a) Fuel Distribution : Shell & Turcas JV……………………………………...........7-12
b) Power Generation (Natural Gas Power Plant): RWE & Turcas JV…………13-15
c) Power Generation (Geothermal Power Plant): Turcas Kuyucak Geothermal…16
d) Project Pipeline / Projects Under Development…………………………………..17
3. Turcas Net Debt/Cash Projection…………………………………………………… 18
4. Turcas Financial Overview…………………………………………………………… 19
Page #
Turcas: A Sustainable Investment Platform
2
Existing Operations
Corporate Profile
Turcas
Market Position
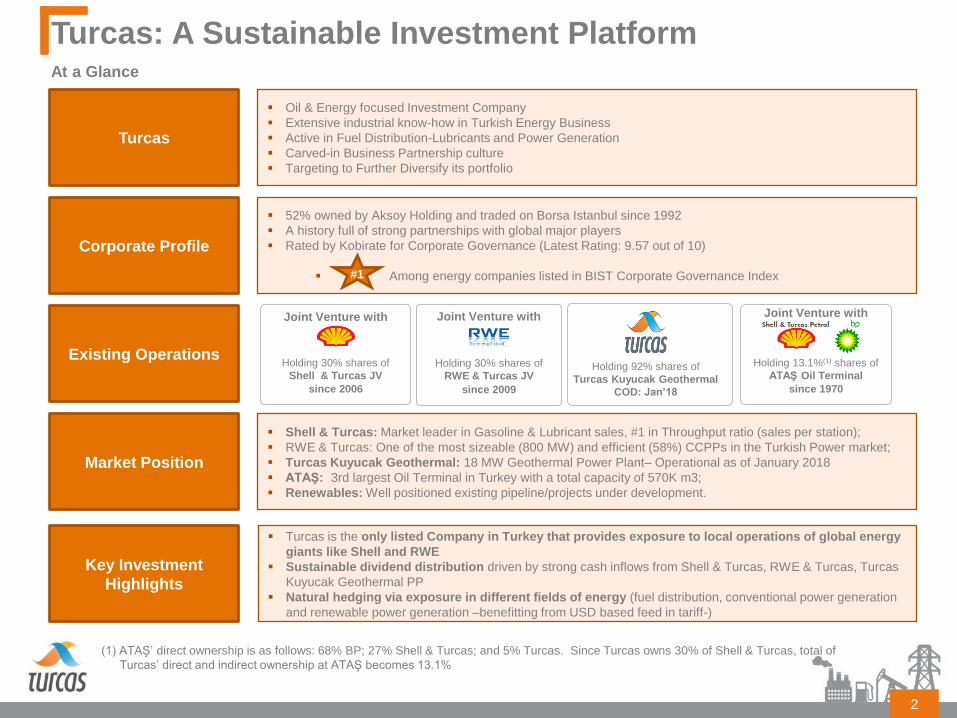
52% owned by Aksoy Holding and traded on Borsa Istanbul since 1992
A history full of strong partnerships with global major players
Rated by Kobirate for Corporate Governance (Latest Rating: 9.57 out of 10)
Among energy companies listed in BIST Corporate Governance Index
Oil & Energy focused Investment Company
Extensive industrial know-how in Turkish Energy Business
Active in Fuel Distribution-Lubricants and Power Generation
Carved-in Business Partnership culture
Targeting to Further Diversify its portfolio
Shell & Turcas: Market leader in Gasoline & Lubricant sales, #1 in Throughput ratio (sales per station);
RWE & Turcas: One of the most sizeable (800 MW) and efficient (58%) CCPPs in the Turkish Power market;
Turcas Kuyucak Geothermal: 18 MW Geothermal Power Plant– Operational as of January 2018
ATAŞ: 3rd largest Oil Terminal in Turkey with a total capacity of 570K m3;
Renewables: Well positioned existing pipeline/projects under development.
since 2009
Joint Venture with
Holding 30% shares of
RWE & Turcas JV
since 2006
Joint Venture with
Holding 30% shares of
Shell & Turcas JV Holding 92% shares of
Turcas Kuyucak Geothermal
COD: Jan’18 since 1970
Joint Venture with
Holding 13.1%(1) shares of
ATAŞ Oil Terminal
(1) ATAŞ’ direct ownership is as follows: 68% BP; 27% Shell & Turcas; and 5% Turcas. Since Turcas owns 30% of Shell & Turcas, total of
Turcas’ direct and indirect ownership at ATAŞ becomes 13.1%
#1
At a Glance
Key Investment
Highlights
Turcas is the only listed Company in Turkey that provides exposure to local operations of global energy
giants like Shell and RWE
Sustainable dividend distribution driven by strong cash inflows from Shell & Turcas, RWE & Turcas, Turcas
Kuyucak Geothermal PP
Natural hedging via exposure in different fields of energy (fuel distribution, conventional power generation
and renewable power generation –benefitting from USD based feed in tariff-)
3
30%
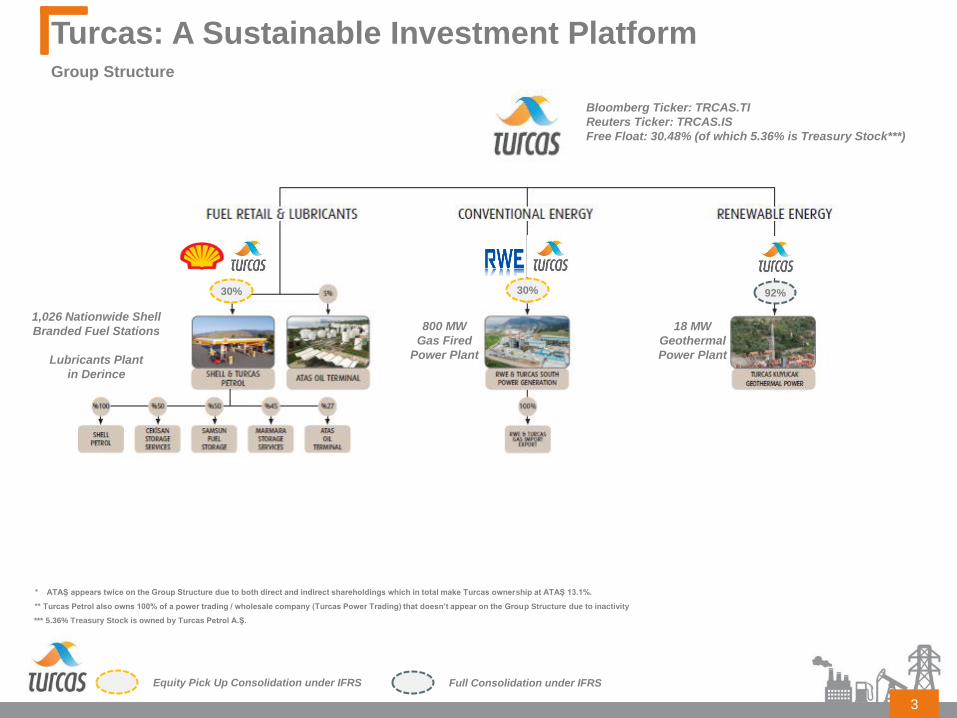
Equity Pick Up Consolidation under IFRS Full Consolidation under IFRS
Bloomberg Ticker: TRCAS.TI
Reuters Ticker: TRCAS.IS
Free Float: 30.48% (of which 5.36% is Treasury Stock***)
92% 30%
* ATAŞ appears twice on the Group Structure due to both direct and indirect shareholdings which in total make Turcas ownership at ATAŞ 13.1%.
*** 5.36% Treasury Stock is owned by Turcas Petrol A.Ş.
Turcas: A Sustainable Investment Platform Group Structure
** Turcas Petrol also owns 100% of a power trading / wholesale company (Turcas Power Trading) that doesn’t appear on the Group Structure due to inactivity
1,026 Nationwide Shell
Branded Fuel Stations
Lubricants Plant
in Derince
800 MW
Gas Fired
Power Plant
18 MW
Geothermal
Power Plant
4
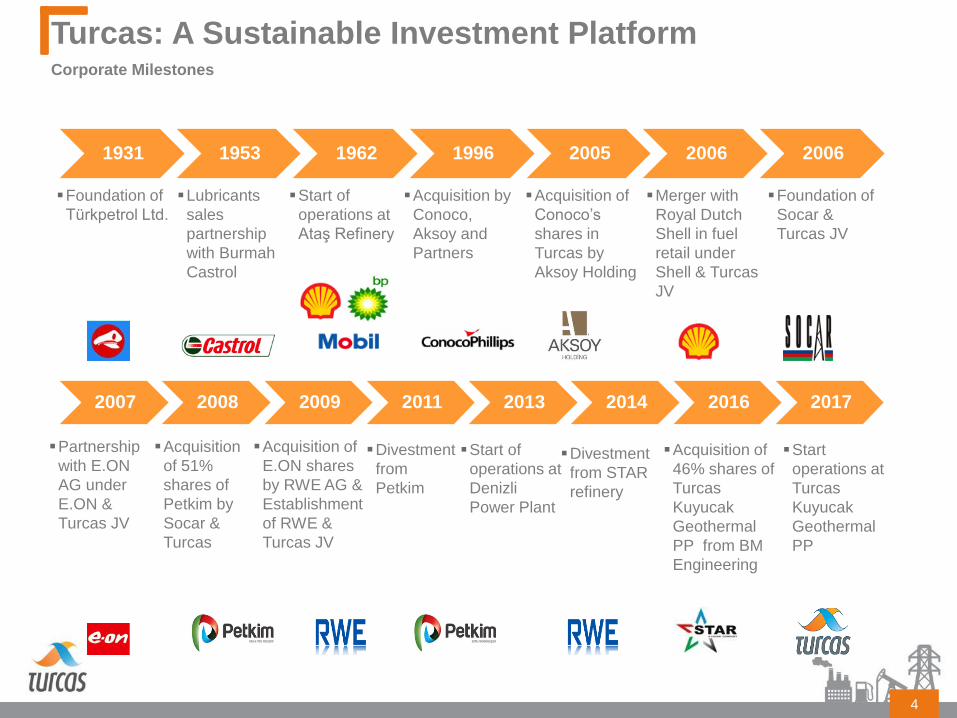
Turcas: A Sustainable Investment Platform Corporate Milestones
1931 1953 1962 1996 2005 2006 2006
2007 2008 2009 2011 2013 2014 2016 2017
Start of
operations at
Ataş Refinery
Foundation of
Türkpetrol Ltd.
Lubricants
sales
partnership
with Burmah
Castrol
Acquisition by
Conoco,
Aksoy and
Partners
Acquisition of
Conoco’s
shares in
Turcas by
Aksoy Holding
Merger with
Royal Dutch
Shell in fuel
retail under
Shell & Turcas
JV
Foundation of
Socar &
Turcas JV
Acquisition of
E.ON shares
by RWE AG &
Establishment
of RWE &
Turcas JV
Partnership
with E.ON
AG under
E.ON &
Turcas JV
Acquisition
of 51%
shares of
Petkim by
Socar &
Turcas
Start of
operations at
Denizli
Power Plant
Acquisition of
46% shares of
Turcas
Kuyucak
Geothermal
PP from BM
Engineering
Divestment
from
Petkim
Divestment
from STAR
refinery
Start
operations at
Turcas
Kuyucak
Geothermal
PP
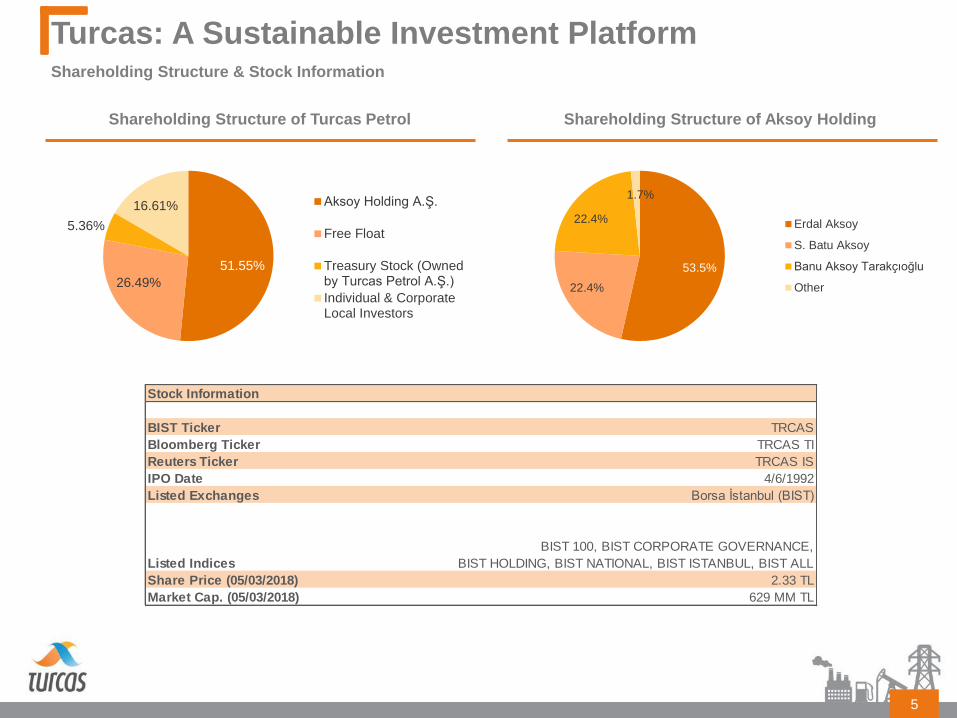
Shareholding Structure of Turcas Petrol Shareholding Structure of Aksoy Holding
5
Turcas: A Sustainable Investment Platform Shareholding Structure & Stock Information
53.5%
22.4%
22.4%
1.7%
Erdal Aksoy
S. Batu Aksoy
Banu Aksoy Tarakçıoğlu
Other
51.55%
26.49%
5.36%
16.61% Aksoy Holding A.Ş.
Free Float
Treasury Stock (Ownedby Turcas Petrol A.Ş.)
Individual & CorporateLocal Investors
Stock Information
BIST Ticker TRCAS
Bloomberg Ticker TRCAS TI
Reuters Ticker TRCAS IS
IPO Date 4/6/1992
Listed Exchanges Borsa İstanbul (BIST)
Listed Indices
BIST 100, BIST CORPORATE GOVERNANCE,
BIST HOLDING, BIST NATIONAL, BIST ISTANBUL, BIST ALL
Share Price (05/03/2018) 2.33 TL
Market Cap. (05/03/2018) 629 MM TL
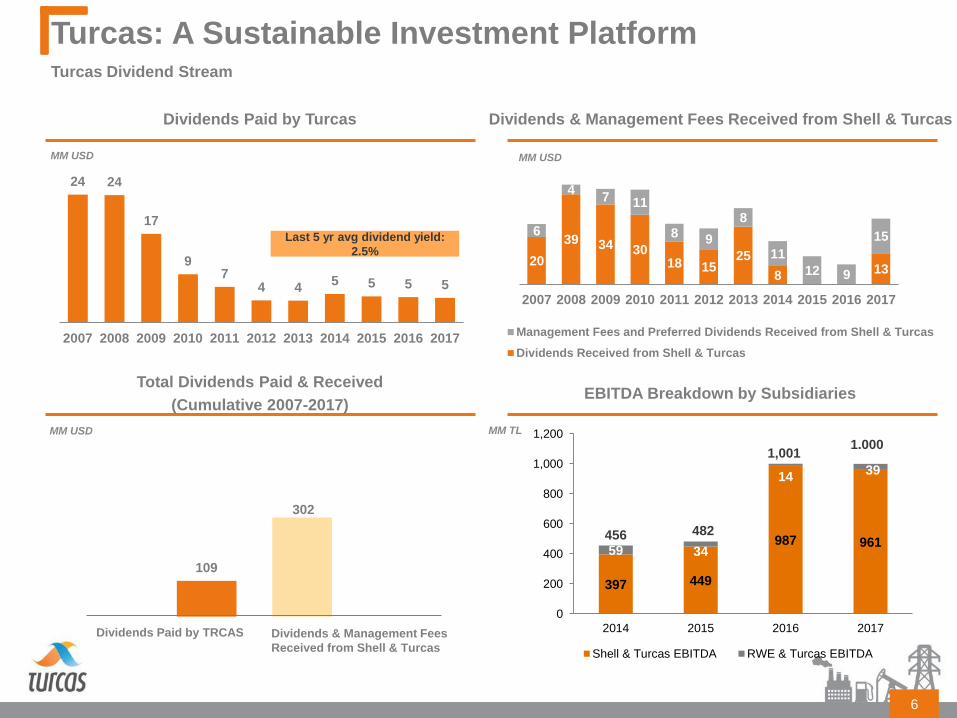
397 449
987 961 59 34
14 39
0
200
400
600
800
1,000
1,200
2014 2015 2016 2017
Shell & Turcas EBITDA RWE & Turcas EBITDA
5 5 5 5 4 4
7 9
17
24 24
20172016201520142013201220112010200920082007
Dividends Paid by Turcas Dividends & Management Fees Received from Shell & Turcas
Total Dividends Paid & Received
(Cumulative 2007-2017) EBITDA Breakdown by Subsidiaries
6
Turcas: A Sustainable Investment Platform
MM USD MM USD
MM USD MM TL
Turcas Dividend Stream
456 482
1,001 1.000
Last 5 yr avg dividend yield:
2.5%
13 8
25 15 18
30 34 39
20
15
9 12
11
8
9 8
11 7 4
6
20172016201520142013201220112010200920082007
Management Fees and Preferred Dividends Received from Shell & Turcas
Dividends Received from Shell & Turcas
302
109
Dividends Paid by TRCAS Dividends & Management Fees
Received from Shell & Turcas
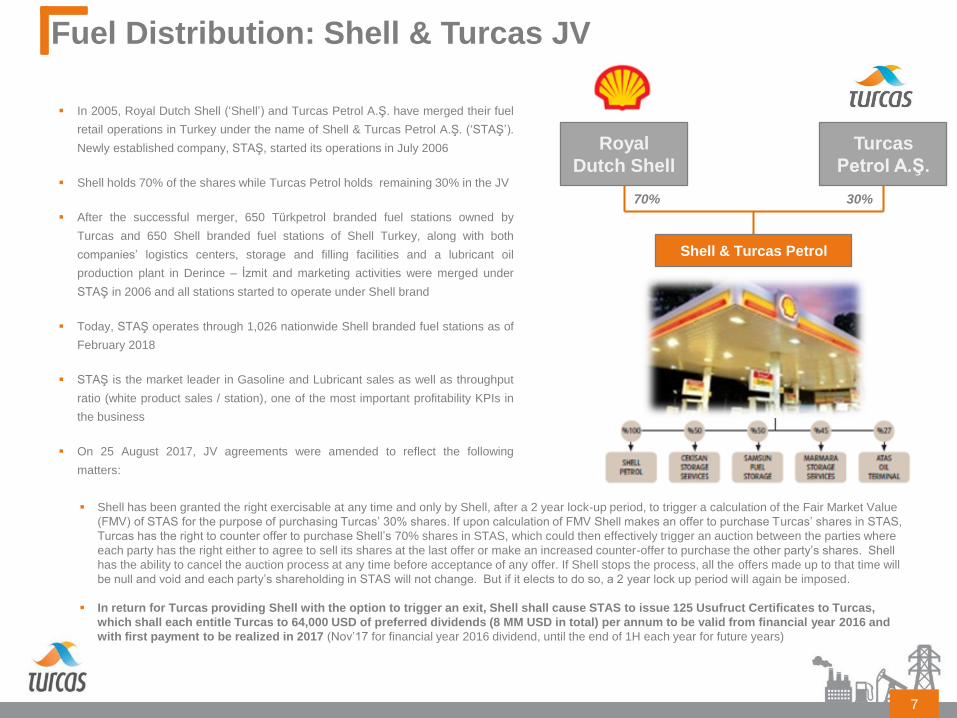
Fuel Distribution: Shell & Turcas JV
7
In 2005, Royal Dutch Shell (‘Shell’) and Turcas Petrol A.Ş. have merged their fuel
retail operations in Turkey under the name of Shell & Turcas Petrol A.Ş. (‘STAŞ’).
Newly established company, STAŞ, started its operations in July 2006
Shell holds 70% of the shares while Turcas Petrol holds remaining 30% in the JV
After the successful merger, 650 Türkpetrol branded fuel stations owned by
Turcas and 650 Shell branded fuel stations of Shell Turkey, along with both
companies’ logistics centers, storage and filling facilities and a lubricant oil
production plant in Derince – İzmit and marketing activities were merged under
STAŞ in 2006 and all stations started to operate under Shell brand
Today, STAŞ operates through 1,026 nationwide Shell branded fuel stations as of
February 2018
STAŞ is the market leader in Gasoline and Lubricant sales as well as throughput
ratio (white product sales / station), one of the most important profitability KPIs in
the business
On 25 August 2017, JV agreements were amended to reflect the following
matters:
Turcas
Petrol A.Ş.
Royal
Dutch Shell
Shell & Turcas Petrol
70% 30%
Shell has been granted the right exercisable at any time and only by Shell, after a 2 year lock-up period, to trigger a calculation of the Fair Market Value
(FMV) of STAS for the purpose of purchasing Turcas’ 30% shares. If upon calculation of FMV Shell makes an offer to purchase Turcas’ shares in STAS,
Turcas has the right to counter offer to purchase Shell’s 70% shares in STAS, which could then effectively trigger an auction between the parties where
each party has the right either to agree to sell its shares at the last offer or make an increased counter-offer to purchase the other party’s shares. Shell
has the ability to cancel the auction process at any time before acceptance of any offer. If Shell stops the process, all the offers made up to that time will
be null and void and each party’s shareholding in STAS will not change. But if it elects to do so, a 2 year lock up period will again be imposed.
In return for Turcas providing Shell with the option to trigger an exit, Shell shall cause STAS to issue 125 Usufruct Certificates to Turcas,
which shall each entitle Turcas to 64,000 USD of preferred dividends (8 MM USD in total) per annum to be valid from financial year 2016 and
with first payment to be realized in 2017 (Nov’17 for financial year 2016 dividend, until the end of 1H each year for future years)
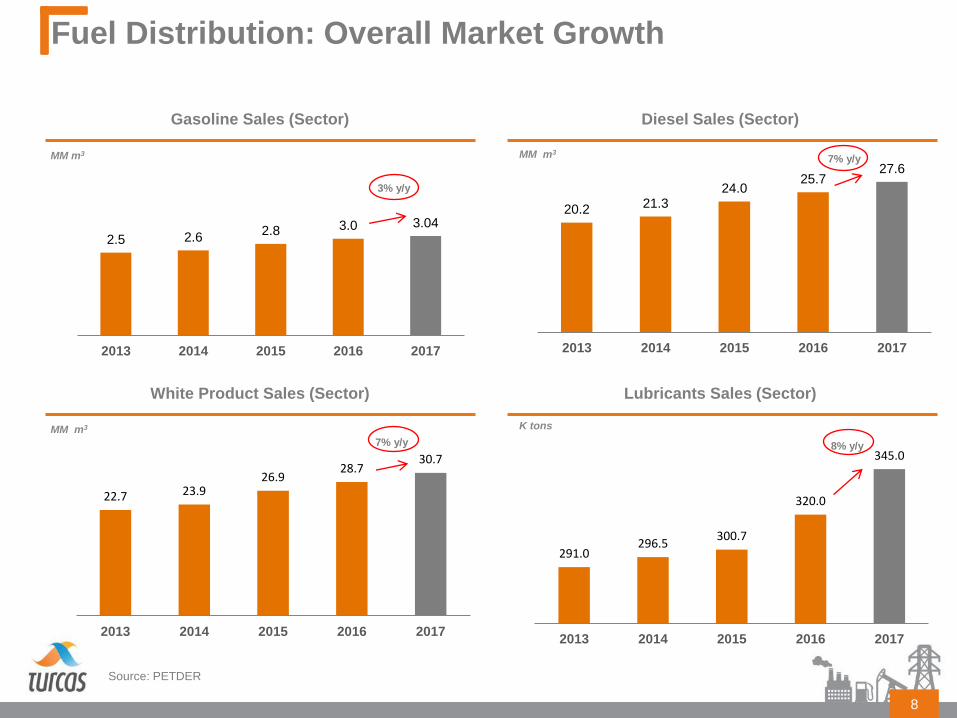
Gasoline Sales (Sector) Diesel Sales (Sector)
White Product Sales (Sector) Lubricants Sales (Sector)
8
Fuel Distribution: Overall Market Growth
Source: PETDER
MM m3
3% y/y
7% y/y MM m3
MM m3
7% y/y
K tons
8% y/y
2.5 2.6 2.8 3.0 3.04
2013 2014 2015 2016 2017
20.2 21.3 24.0
25.7 27.6
2013 2014 2015 2016 2017
22.7 23.9 26.9
28.7 30.7
2013 2014 2015 2016 2017
291.0 296.5
300.7
320.0
345.0
2013 2014 2015 2016 2017
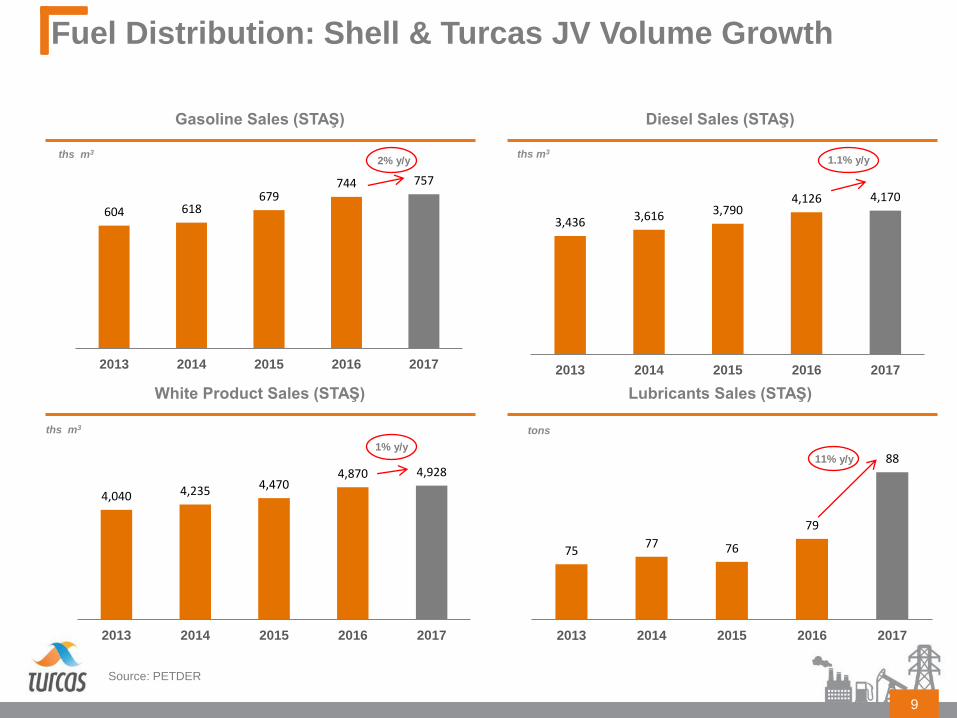
Gasoline Sales (STAŞ) Diesel Sales (STAŞ)
White Product Sales (STAŞ) Lubricants Sales (STAŞ)
9
Fuel Distribution: Shell & Turcas JV Volume Growth
Source: PETDER
ths m3
2% y/y 1.1% y/y ths m3
ths m3
1% y/y
tons
11% y/y
604 618 679
744 757
2013 2014 2015 2016 2017
3,436 3,616 3,790 4,126 4,170
2013 2014 2015 2016 2017
4,040 4,235 4,470 4,870 4,928
2013 2014 2015 2016 2017
75 77 76
79
88
2013 2014 2015 2016 2017
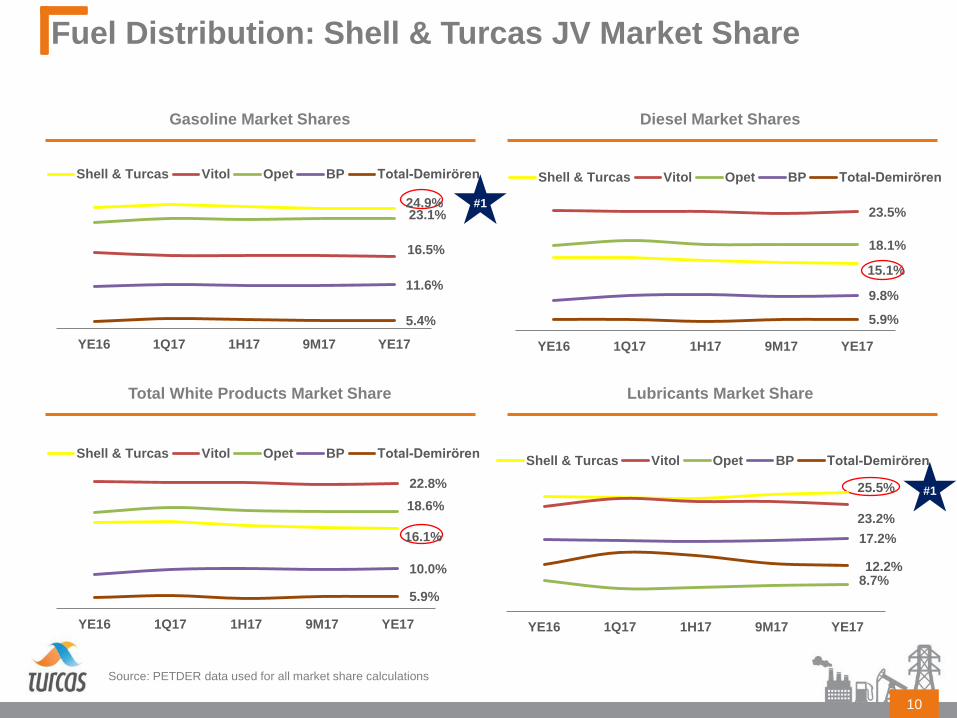
Gasoline Market Shares Diesel Market Shares
Total White Products Market Share Lubricants Market Share
Source: PETDER data used for all market share calculations
10
Fuel Distribution: Shell & Turcas JV Market Share
#1
#1
24.9%
16.5%
23.1%
11.6%
5.4%
YE16 1Q17 1H17 9M17 YE17
Shell & Turcas Vitol Opet BP Total-Demirören
15.1%
23.5%
18.1%
9.8%
5.9%
YE16 1Q17 1H17 9M17 YE17
Shell & Turcas Vitol Opet BP Total-Demirören
16.1%
22.8%
18.6%
10.0%
5.9%
YE16 1Q17 1H17 9M17 YE17
Shell & Turcas Vitol Opet BP Total-Demirören
25.5%
23.2%
8.7%
17.2%
12.2%
YE16 1Q17 1H17 9M17 YE17
Shell & Turcas Vitol Opet BP Total-Demirören
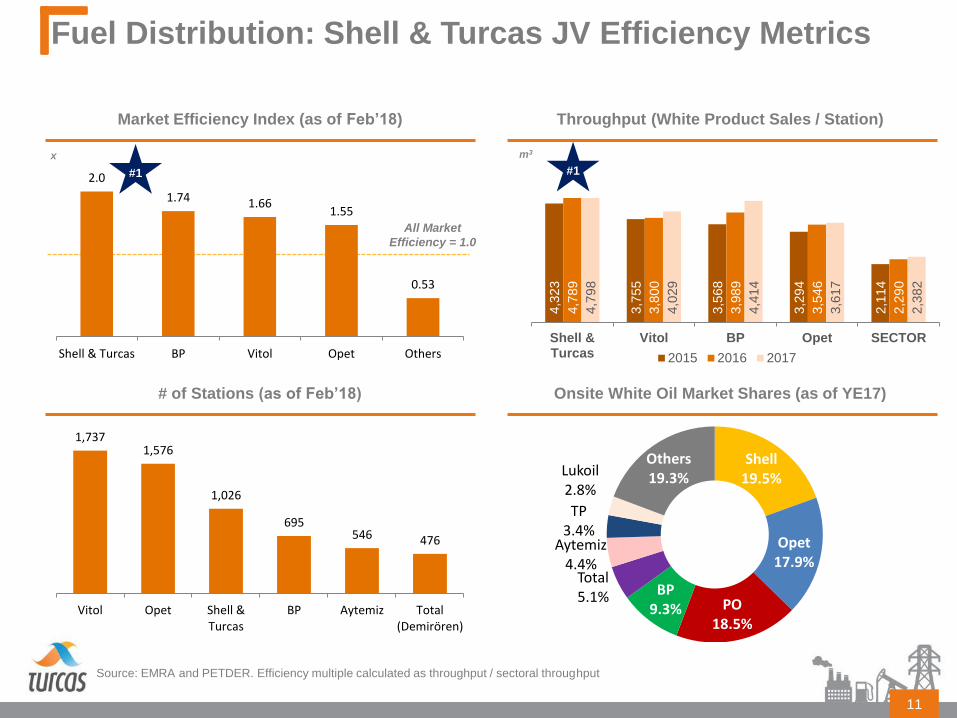
Market Efficiency Index (as of Feb’18) Throughput (White Product Sales / Station)
# of Stations (as of Feb’18) Onsite White Oil Market Shares (as of YE17)
11
Fuel Distribution: Shell & Turcas JV Efficiency Metrics
Source: EMRA and PETDER. Efficiency multiple calculated as throughput / sectoral throughput
x m3
#1
All Market
Efficiency = 1.0
#1 2.0
1.74 1.66 1.55
0.53
Shell & Turcas BP Vitol Opet Others
4,3
23
3,7
55
3,5
68
3,2
94
2,1
14
4,7
89
3,8
00
3,9
89
3,5
46
2,2
90
4,7
98
4,0
29
4,4
14
3,6
17
2,3
82
Shell &Turcas
Vitol BP Opet SECTOR
2015 2016 2017
1,737 1,576
1,026
695 546 476
Vitol Opet Shell &Turcas
BP Aytemiz Total(Demirören)
Shell 19.5%
Opet 17.9%
PO 18.5%
BP 9.3%
Total 5.1%
Aytemiz 4.4%
TP 3.4%
Lukoil 2.8%
Others 19.3%
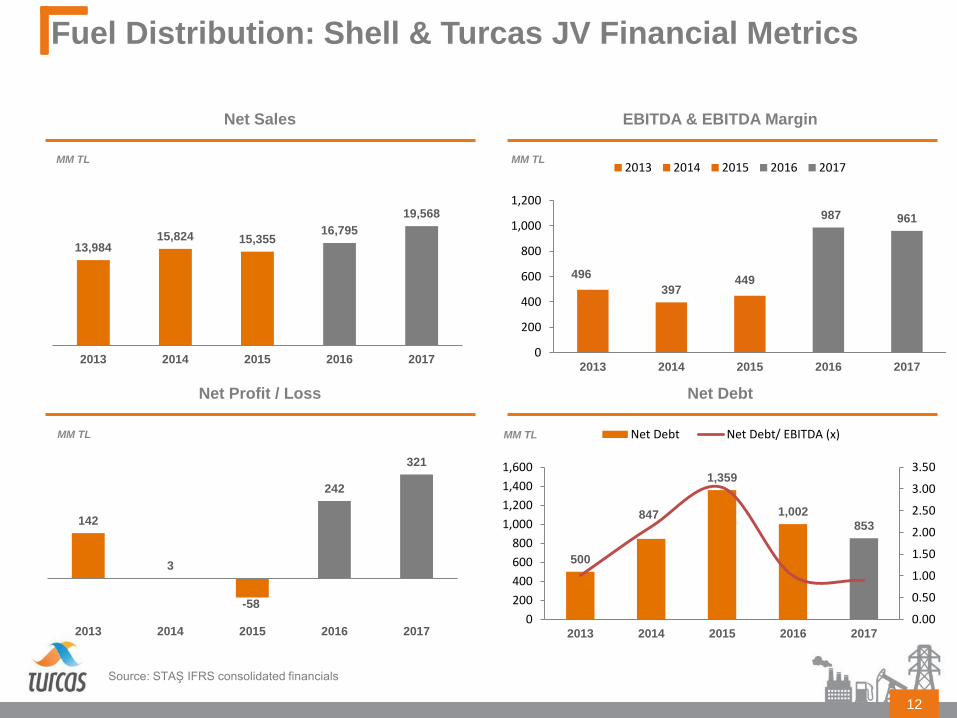
142
3
-58
242
321
2013 2014 2015 2016 2017
13,984 15,824 15,355
16,795
19,568
2013 2014 2015 2016 2017
Net Sales EBITDA & EBITDA Margin
Net Profit / Loss Net Debt
Source: STAŞ IFRS consolidated financials
12
Fuel Distribution: Shell & Turcas JV Financial Metrics
MM TL
MM TL MM TL
MM TL
496
397 449
987 961
0
200
400
600
800
1,000
1,200
2013 2014 2015 2016 2017
2013 2014 2015 2016 2017
500
847
1,359
1,002
853
0.00
0.50
1.00
1.50
2.00
2.50
3.00
3.50
0
200
400
600
800
1,000
1,200
1,400
1,600
2013 2014 2015 2016 2017
Net Debt Net Debt/ EBITDA (x)
Power Generation (Natural Gas PP): RWE & Turcas JV
13
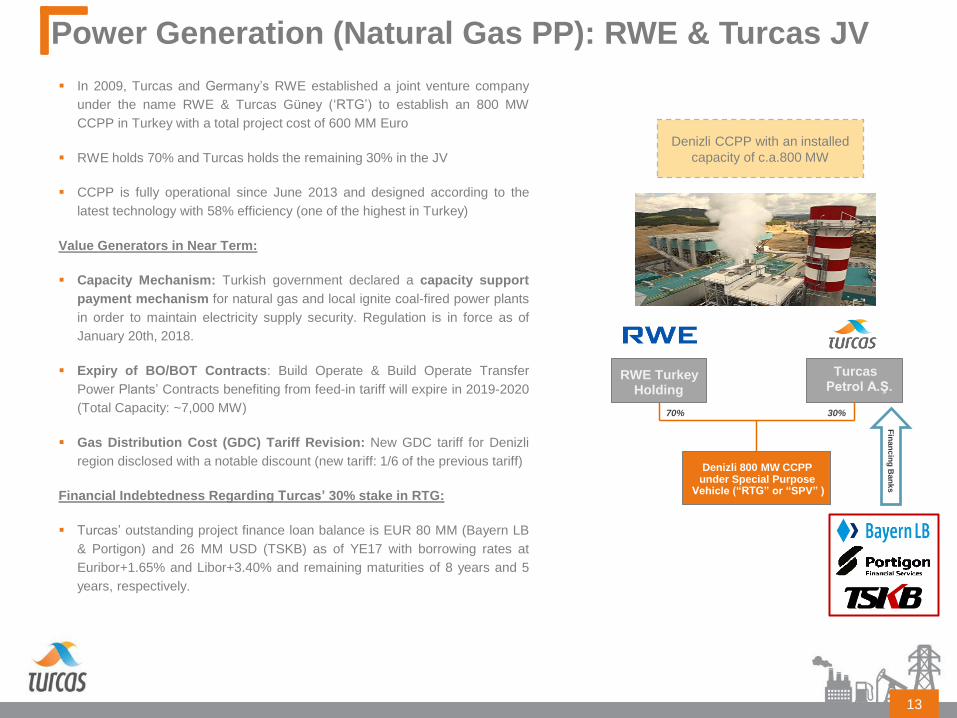
In 2009, Turcas and Germany’s RWE established a joint venture company
under the name RWE & Turcas Güney (‘RTG’) to establish an 800 MW
CCPP in Turkey with a total project cost of 600 MM Euro
RWE holds 70% and Turcas holds the remaining 30% in the JV
CCPP is fully operational since June 2013 and designed according to the
latest technology with 58% efficiency (one of the highest in Turkey)
Value Generators in Near Term:
Capacity Mechanism: Turkish government declared a capacity support
payment mechanism for natural gas and local ignite coal-fired power plants
in order to maintain electricity supply security. Regulation is in force as of
January 20th, 2018.
Expiry of BO/BOT Contracts: Build Operate & Build Operate Transfer
Power Plants’ Contracts benefiting from feed-in tariff will expire in 2019-2020
(Total Capacity: ~7,000 MW)
Gas Distribution Cost (GDC) Tariff Revision: New GDC tariff for Denizli
region disclosed with a notable discount (new tariff: 1/6 of the previous tariff)
Financial Indebtedness Regarding Turcas’ 30% stake in RTG:
Turcas’ outstanding project finance loan balance is EUR 80 MM (Bayern LB
& Portigon) and 26 MM USD (TSKB) as of YE17 with borrowing rates at
Euribor+1.65% and Libor+3.40% and remaining maturities of 8 years and 5
years, respectively.
Denizli CCPP with an installed
capacity of c.a.800 MW
Turcas Petrol A.Ş.
RWE Turkey Holding
Denizli 800 MW CCPP u nder Special Purpose
Vehicle (“RTG” or “SPV” )
70% 30%
Fin
an
cin
g B
an
ks
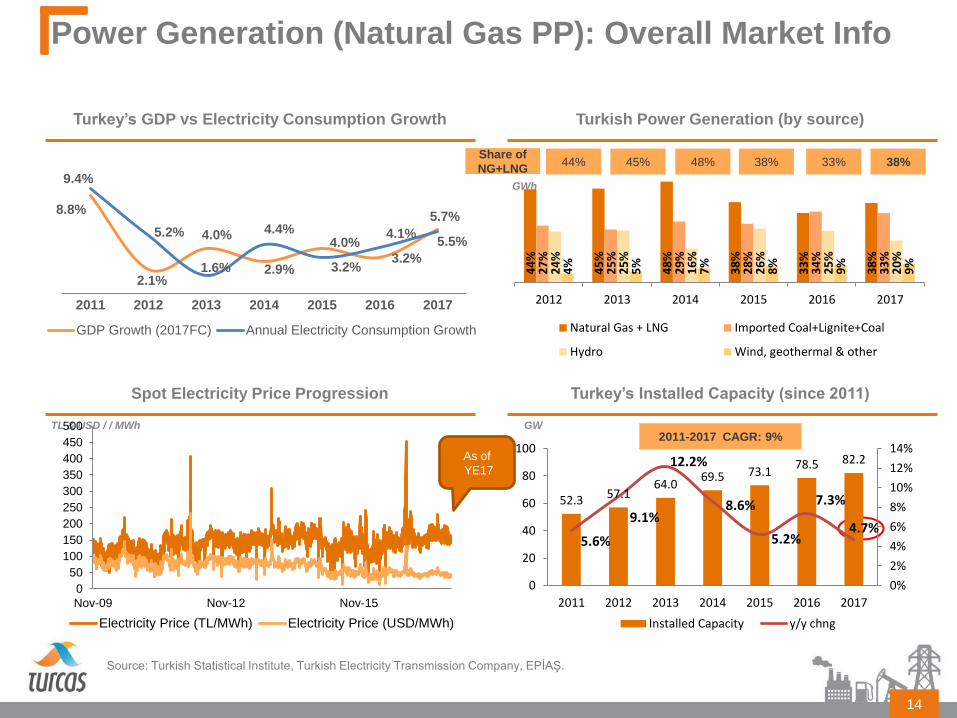
Turkey’s GDP vs Electricity Consumption Growth Turkish Power Generation (by source)
Spot Electricity Price Progression Turkey’s Installed Capacity (since 2011)
Source: Turkish Statistical Institute, Turkish Electricity Transmission Company, EPİAŞ.
14
Power Generation (Natural Gas PP): Overall Market Info
TL & USD / / MWh GW
2011-2017 CAGR: 9%
Share of
NG+LNG 44% 45% 48% 38% 33% 38%
GWh
As of
YE17
8.8%
2.1%
4.0%
2.9%
4.0%
3.2%
5.7%
9.4%
5.2%
1.6%
4.4%
3.2%
4.1% 5.5%
2011 2012 2013 2014 2015 2016 2017
GDP Growth (2017FC) Annual Electricity Consumption Growth
44
%
45
%
48
%
38
%
33
%
38
%
27
%
25
%
29
%
28
%
34
%
33
%
24
%
25
%
16
%
26
%
25
%
20
%
4%
5%
7%
8%
9%
9%
2012 2013 2014 2015 2016 2017
Natural Gas + LNG Imported Coal+Lignite+Coal
Hydro Wind, geothermal & other
0
50
100
150
200
250
300
350
400
450
500
Nov-09 Nov-12 Nov-15
Electricity Price (TL/MWh) Electricity Price (USD/MWh)
52.3 57.1 64.0
69.5 73.1 78.5 82.2
5.6%
9.1%
12.2%
8.6%
5.2%
7.3%
4.7%
0%
2%
4%
6%
8%
10%
12%
14%
0
20
40
60
80
100
2011 2012 2013 2014 2015 2016 2017
Installed Capacity y/y chng
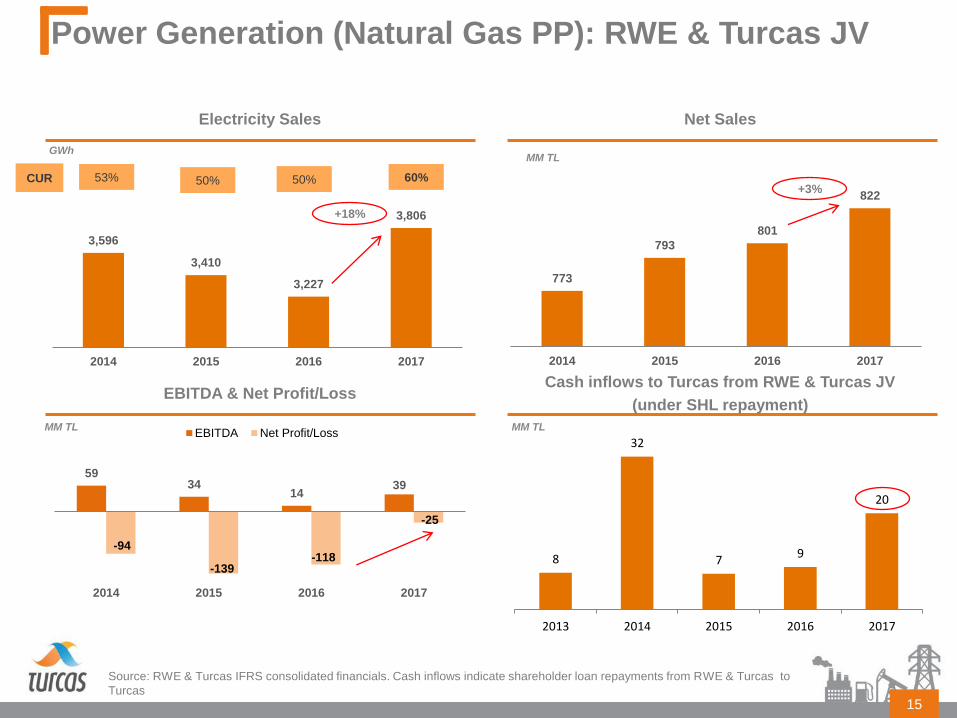
Electricity Sales Net Sales
EBITDA & Net Profit/Loss Cash inflows to Turcas from RWE & Turcas JV
(under SHL repayment)
Source: RWE & Turcas IFRS consolidated financials. Cash inflows indicate shareholder loan repayments from RWE & Turcas to
Turcas
15
Power Generation (Natural Gas PP): RWE & Turcas JV
MM TL
MM TL MM TL
GWh
+18%
+3% CUR 53% 50% 50% 60%
3,596
3,410
3,227
3,806
2014 2015 2016 2017
773
793
801
822
2014 2015 2016 2017
59 34
14 39
-94
-139 -118
-25
2014 2015 2016 2017
EBITDA Net Profit/Loss
8
32
7 9
20
2013 2014 2015 2016 2017
Power Generation (Geothermal Power Plant)- Turcas
Kuyucak Geothermal
16
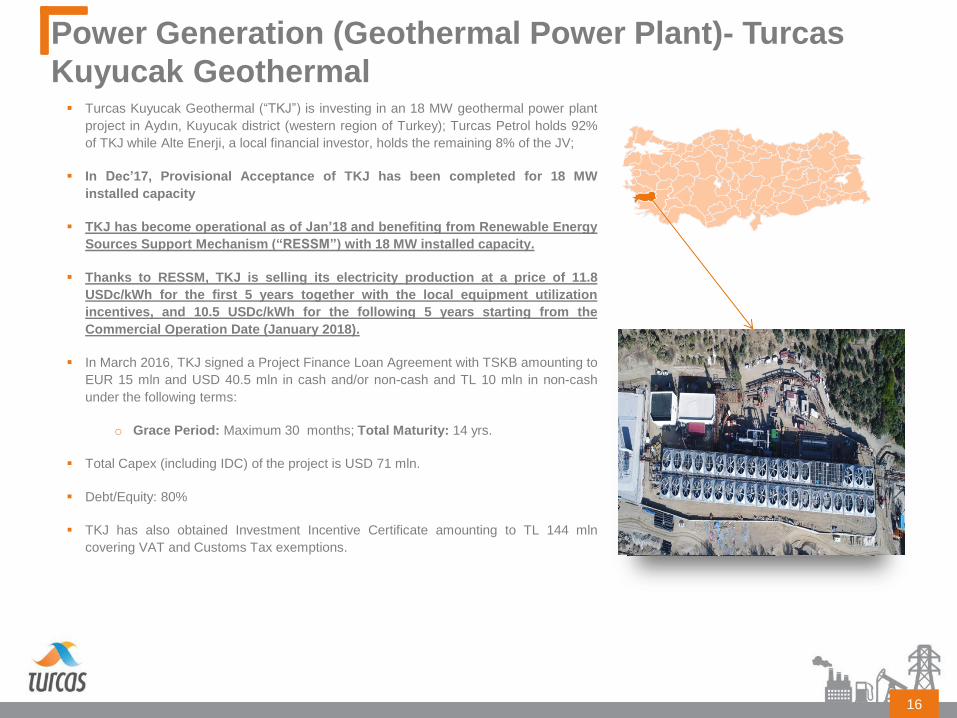
Turcas Kuyucak Geothermal (“TKJ”) is investing in an 18 MW geothermal power plant
project in Aydın, Kuyucak district (western region of Turkey); Turcas Petrol holds 92%
of TKJ while Alte Enerji, a local financial investor, holds the remaining 8% of the JV;
In Dec’17, Provisional Acceptance of TKJ has been completed for 18 MW
installed capacity
TKJ has become operational as of Jan’18 and benefiting from Renewable Energy
Sources Support Mechanism (“RESSM”) with 18 MW installed capacity.
Thanks to RESSM, TKJ is selling its electricity production at a price of 11.8
USDc/kWh for the first 5 years together with the local equipment utilization
incentives, and 10.5 USDc/kWh for the following 5 years starting from the
Commercial Operation Date (January 2018).
In March 2016, TKJ signed a Project Finance Loan Agreement with TSKB amounting to
EUR 15 mln and USD 40.5 mln in cash and/or non-cash and TL 10 mln in non-cash
under the following terms:
o Grace Period: Maximum 30 months; Total Maturity: 14 yrs.
Total Capex (including IDC) of the project is USD 71 mln.
Debt/Equity: 80%
TKJ has also obtained Investment Incentive Certificate amounting to TL 144 mln
covering VAT and Customs Tax exemptions.
Potential Project Pipeline
17
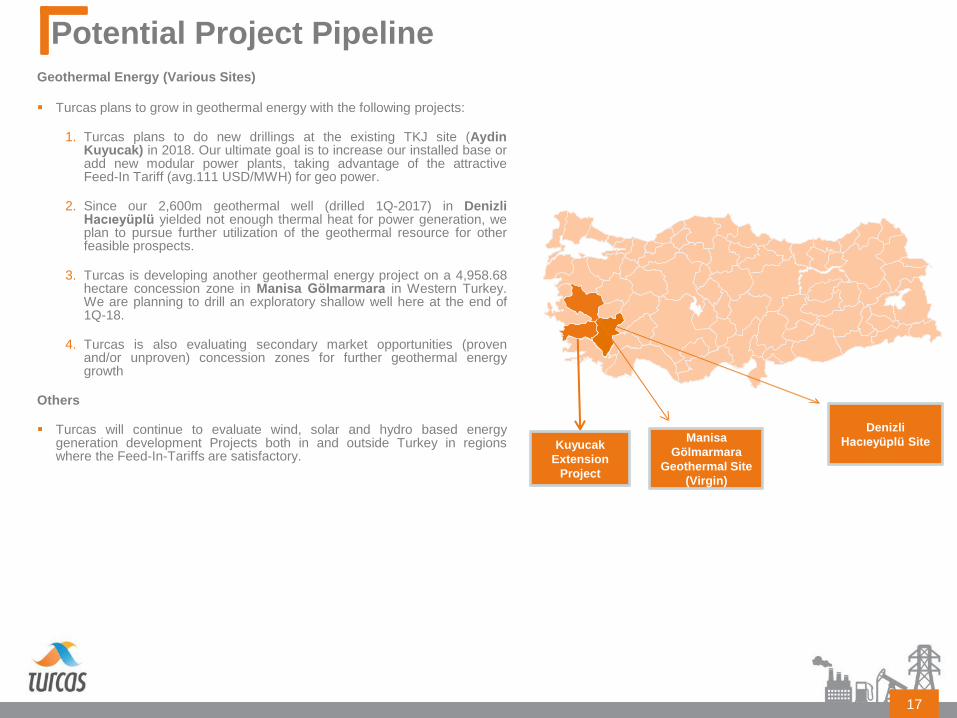
Geothermal Energy (Various Sites)
Turcas plans to grow in geothermal energy with the following projects:
1. Turcas plans to do new drillings at the existing TKJ site (Aydin Kuyucak) in 2018. Our ultimate goal is to increase our installed base or add new modular power plants, taking advantage of the attractive Feed-In Tariff (avg.111 USD/MWH) for geo power.
2. Since our 2,600m geothermal well (drilled 1Q-2017) in Denizli Hacıeyüplü yielded not enough thermal heat for power generation, we plan to pursue further utilization of the geothermal resource for other feasible prospects.
3. Turcas is developing another geothermal energy project on a 4,958.68 hectare concession zone in Manisa Gölmarmara in Western Turkey. We are planning to drill an exploratory shallow well here at the end of 1Q-18.
4. Turcas is also evaluating secondary market opportunities (proven and/or unproven) concession zones for further geothermal energy growth
Others
Turcas will continue to evaluate wind, solar and hydro based energy generation development Projects both in and outside Turkey in regions where the Feed-In-Tariffs are satisfactory.
Manisa
Gölmarmara
Geothermal Site
(Virgin)
Denizli
Hacıeyüplü Site Kuyucak
Extension
Project
Turcas Financial Overview
18
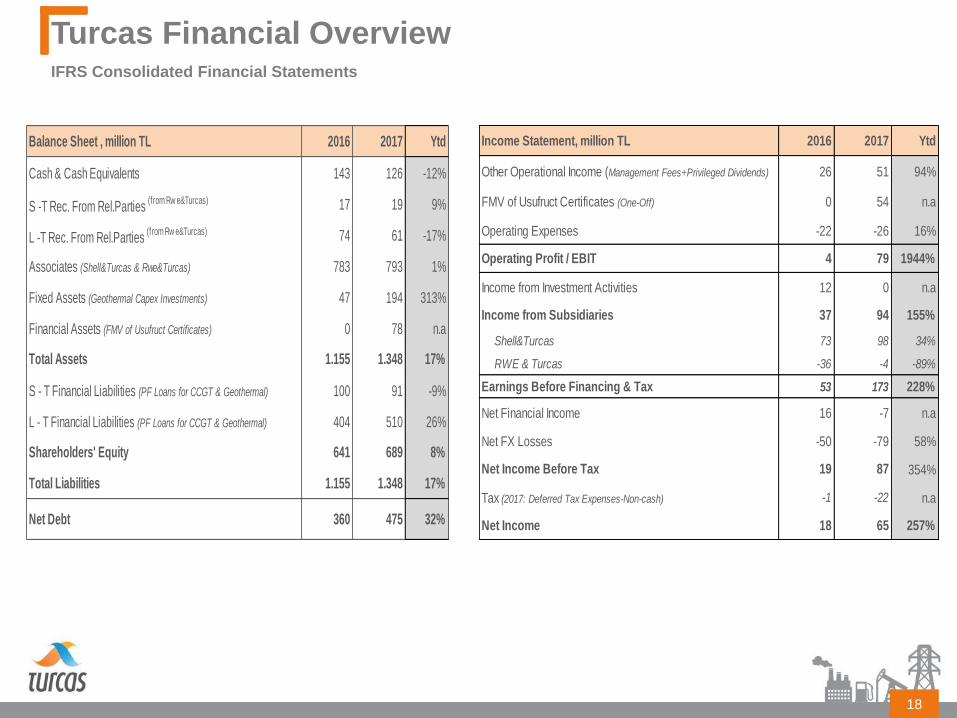
IFRS Consolidated Financial Statements
Balance Sheet , million TL 2016 2017 Ytd
Cash & Cash Equivalents 143 126 -12%
S -T Rec. From Rel.Parties (from Rw e&Turcas) 17 19 9%
L -T Rec. From Rel.Parties (from Rw e&Turcas) 74 61 -17%
Associates (Shell&Turcas & Rwe&Turcas) 783 793 1%
Fixed Assets (Geothermal Capex Investments) 47 194 313%
Financial Assets (FMV of Usufruct Certificates) 0 78 n.a
Total Assets 1.155 1.348 17%
S - T Financial Liabilities (PF Loans for CCGT & Geothermal) 100 91 -9%
L - T Financial Liabilities (PF Loans for CCGT & Geothermal) 404 510 26%
Shareholders' Equity 641 689 8%
Total Liabilities 1.155 1.348 17%
Net Debt 360 475 32%
Income Statement, million TL 2016 2017 Ytd
Other Operational Income (Management Fees+Privileged Dividends) 26 51 94%
FMV of Usufruct Certificates (One-Off) 0 54 n.a
Operating Expenses -22 -26 16%
Operating Profit / EBIT 4 79 1944%
Income from Investment Activities 12 0 n.a
Income from Subsidiaries 37 94 155%
Shell&Turcas 73 98 34%
RWE & Turcas -36 -4 -89%
Earnings Before Financing & Tax 53 173 228%
Net Financial Income 16 -7 n.a
Net FX Losses -50 -79 58%
Net Income Before Tax 19 87 354%
Tax (2017: Deferred Tax Expenses-Non-cash) -1 -22 n.a
Net Income 18 65 257%
Summary Balance Sheet Leverage & Net Leverage
Associates Accounted via Equity Pick Up Equity & Equity Financing
(1) S-T and L-T receivables from rel.parties are due from RWE & Turcas Güney.
(2) L-T Project Finance loans utilized for Denizli CCGT (Please see Pp.13) & Kuyucak Geothermal Power Plant Projects (pp 16)
19
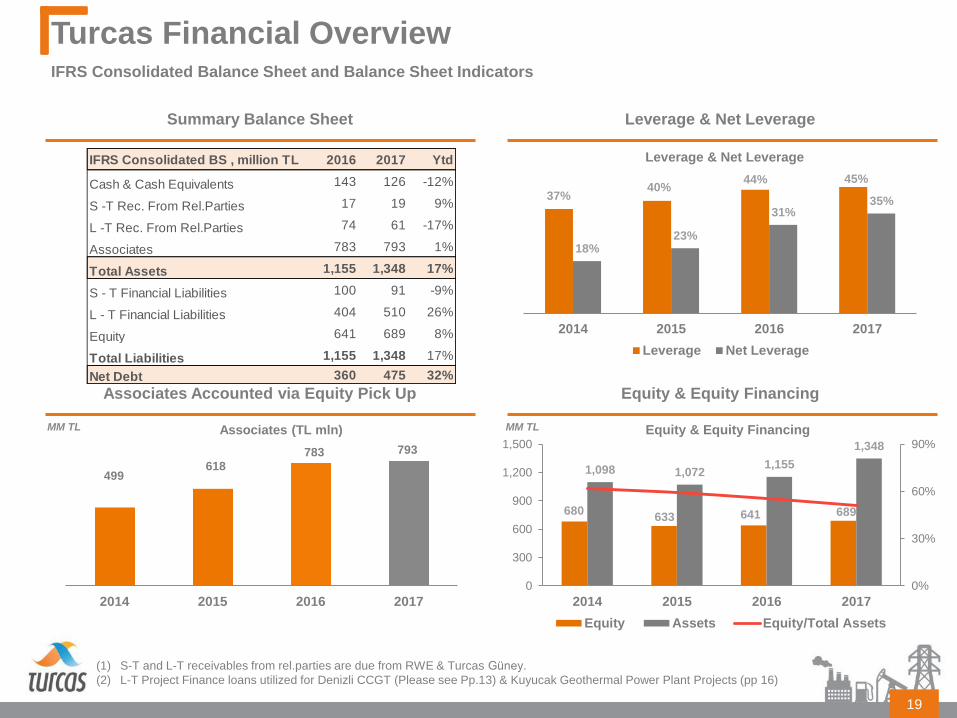
Turcas Financial Overview IFRS Consolidated Balance Sheet and Balance Sheet Indicators
MM TL MM TL
IFRS Consolidated BS , million TL 2016 2017 Ytd
Cash & Cash Equivalents 143 126 -12%
S -T Rec. From Rel.Parties 17 19 9%
L -T Rec. From Rel.Parties 74 61 -17%
Associates 783 793 1%
Total Assets 1,155 1,348 17%
S - T Financial Liabilities 100 91 -9%
L - T Financial Liabilities 404 510 26%
Equity 641 689 8%
Total Liabilities 1,155 1,348 17%
Net Debt 360 475 32%
37% 40%
44% 45%
18% 23%
31% 35%
2014 2015 2016 2017
Leverage & Net Leverage
Leverage Net Leverage
499 618
783 793
2014 2015 2016 2017
Associates (TL mln)
680 633 641 689
1,098 1,072 1,155
1,348
0%
30%
60%
90%
0
300
600
900
1,200
1,500
2014 2015 2016 2017
Equity & Equity Financing
Equity Assets Equity/Total Assets
Confidential
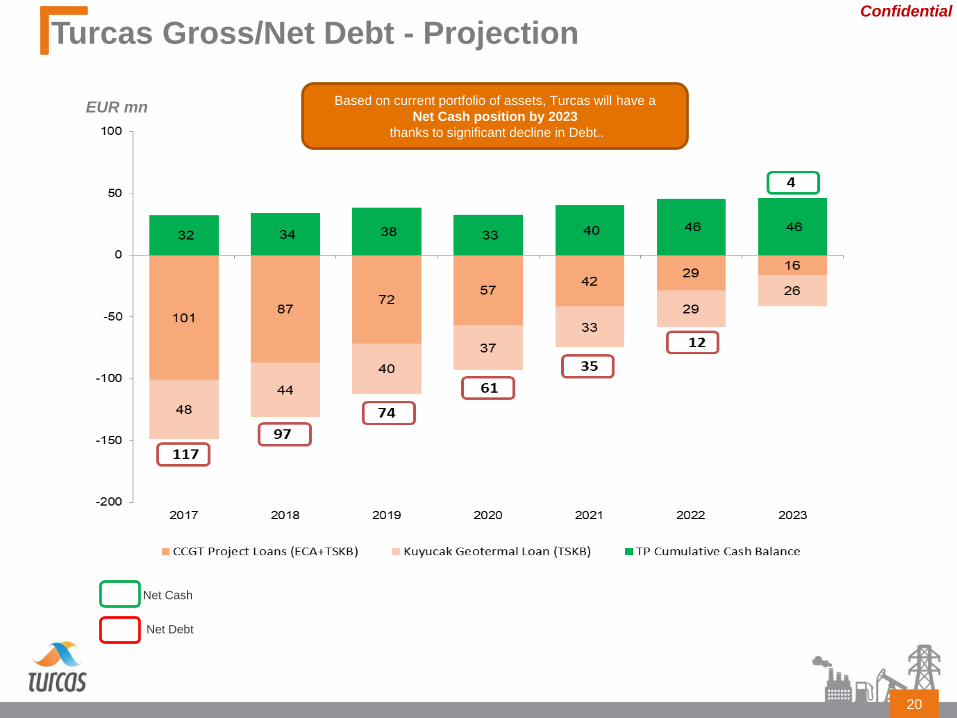
Turcas Gross/Net Debt - Projection
20
EUR mn Based on current portfolio of assets, Turcas will have a
Net Cash position by 2023
thanks to significant decline in Debt..
Net Cash
Net Debt
Thank you!
Erkan İLHANTEKİN
CFO
E-mail: [email protected]
Phone: +90 212 259 00 00 / Ext: 1270
Pınar SAATCIOĞLU
Head of Investor Relations
E-mail: [email protected]
Phone: +90 212 259 00 00 / Ext: 1287
Contact Information