
NEER Grant: DE-FG07-01ID14111
128
NEER Grant: DE-FG07-01ID14111 PROJECT TITLE: EXPERIMENTAL INVESTIGATION ON THE EFFECTS OF COOLANT CONCENTRATION ON SUB-COOLED BOILING AND CRUD DEPOSITION ON REACTOR CLADDING AT PROTOTYPICAL PWR OPERATING CONDITIONS. Covering Period: 6/4/01 to 5/31/06 Report Date: 10/20/06 Recipient: Kansas State University, Manhattan, KS 66506 Award Number: DE-FG07-01D14111 Co-Investigators: J. Kenneth Shultis, Kansas State University ([email protected] ) and Donald L. Fenton, Kansas State University ([email protected]) Proposal Objectives: (1) To obtain experimental data for subcooled pool boiling heat transfer coefficients on Zircaloy clad rods for coolants with varying concentrations of boron and lithium. The sensitivity of crud deposition on bulk subcooling, heat flux, system pressure, and coolant concentration is to be investigated. (2) To obtain a visual record of nucleation site density, bubble size, and nucleation frequency for subcooled boiling in dilute mixtures on Zr-4 clad rods. (3) To develop experimental techniques using neutron depth profiling (NDP) to measure the deposition rate of boron and lithium on Zr-4 rods.
Transcript of NEER Grant: DE-FG07-01ID14111

NEER Grant: DE-FG07-01ID14111
PROJECT TITLE: EXPERIMENTAL INVESTIGATION ON THE EFFECTS OF COOLANT CONCENTRATION ON SUB-COOLED BOILING AND CRUD DEPOSITION ON REACTOR CLADDING AT PROTOTYPICAL PWR OPERATING CONDITIONS.
Covering Period: 6/4/01 to 5/31/06
Report Date: 10/20/06
Recipient: Kansas State University, Manhattan, KS 66506
Award Number: DE-FG07-01D14111
Co-Investigators: J. Kenneth Shultis, Kansas State University ([email protected]) and Donald L. Fenton, Kansas State University ([email protected])
Proposal Objectives: (1) To obtain experimental data for subcooled pool boiling heat transfer coefficients on Zircaloy clad rods for coolants with varying concentrations of boron and lithium. The sensitivity of crud deposition on bulk subcooling, heat flux, system pressure, and coolant concentration is to be investigated. (2) To obtain a visual record of nucleation site density, bubble size, and nucleation frequency for subcooled boiling in dilute mixtures on Zr-4 clad rods. (3) To develop experimental techniques using neutron depth profiling (NDP) to measure the deposition rate of boron and lithium on Zr-4 rods.

ABSTRACT
Increasing demand for energy necessitates nuclear power units to increase power limits. This implies significant changes in the design of the core of the nuclear power units, therefore providing better performance and safety in operations. A major hindrance to the increase of nuclear reactor performance especially in Pressurized Deionized water Reactors (PWR) is Axial Offset Anomaly (AOA) - the unexpected change in the core axial power distribution during operation from the predicted distribution. This problem is thought to be occur because of precipitation and deposition of lithiated compounds like boric acid (H2BO3) and lithium metaborate (LiBO2) on the fuel rod cladding. Deposited boron absorbs neutrons thereby affecting the total power distribution inside the reactor. AOA is thought to occur when there is sufficient build-up of crud deposits on the cladding during subcooled nucleate boiling.
Predicting AOA is difficult as there is very little information regarding the heat and mass transfer during subcooled nucleate boiling. An experimental investigation was conducted to study the heat transfer characteristics during subcooled nucleate boiling at prototypical PWR conditions. Pool boiling tests were conducted with varying concentrations of lithium metaborate (LiBO2) and boric acid (H2BO3) solutions in deionized water. The experimental data collected includes the effect of coolant concentration, subcooling, system pressure and heat flux on pool the boiling heat transfer coefficient. The analysis of particulate deposits formed on the fuel cladding surface during subcooled nucleate boiling was also performed.
The results indicate that the pool boiling heat transfer coefficient degrades in the presence of boric acid and lithium metaborate compared to pure deionized water due to lesser nucleation. The pool boiling heat transfer coefficents decreased by about 24% for 5000 ppm concentrared boric acid solution and by 27% for 5000 ppm lithium metaborate solution respectively at the saturation temperature for 1000 psi (68.9 bar) coolant pressure. Boiling tests also revealed the formation of fine deposits of boron and lithium on the cladding surface which degraded the heat transfer rates. The boron and lithium metaborate precipitates after a 5 day test at 5000 ppm concentration and 1000 psi (68.9 bar) operating pressure reduced the heat transfer rate 21% and 30%, respectively for the two solutions.
ACKNOWLEDGEMENTS
The support of the United States Department of Energy (DOE) through NEER Grant DE-FG07-01ID14111 is gratefully acknowledged. Special thanks is due to Mr. Vijaya Raghava Paravastu Pattarabbiran who diligently conducted the experiments in the laboratory, made the plots, and developed the first draft of this report. Thanks is also due Dr. Larry Glasgow, Chemical Engineering, for use of the high magnification camera and to Mr. Jason Selland and Mr. Gary Thornton, Mechanical and Nuclear Engineering, for assistance with fabricating and maintaining the experimental equipment.

iii
TABLE OF CONTENTS 1 INTRODUCTION......................................................................................................1
1.1 Overview............................................................................................................. 1 1.2 Working of a PWR.............................................................................................. 2 1.3 Organization of Report ....................................................................................... 3
2 LITERATURE SURVEY..........................................................................................4 2.1 Overview............................................................................................................. 4 2.2 Pool Boiling Heat Transfer ................................................................................. 4 2.3 Boiling for Mixtures ........................................................................................... 5 2.4 Influence of Particulate Deposits ........................................................................ 6 2.5 Axial Offset Anomaly......................................................................................... 6 2.6 Objectives ........................................................................................................... 7
3 EXPERIMENTAL EQUIPMENT ...........................................................................8 3.1 Overview............................................................................................................. 8 3.2 Preliminary Pool Boiling Test Equipment.......................................................... 8 3.3 New pool Boiling Test facility.......................................................................... 10
3.3.1 Test Heater .................................................................................................... 10 3.3.2 Electrical DC Power Supply Unit ................................................................. 12
3.4 Heat Exchanger................................................................................................. 13 3.5 Bulk Heater ....................................................................................................... 17
3.5.1 Electric Circuit .............................................................................................. 18 3.5.2 High Speed Camera ...................................................................................... 18 3.5.3 Pressure Transducer ...................................................................................... 19
4 EXPERIMENTAL PROCEDURE.........................................................................21 4.1 Solution Preparation.......................................................................................... 21 4.2 Boric Acid......................................................................................................... 21 4.3 Lithium Metaborate .......................................................................................... 22 4.4 Experimental Procedure.................................................................................... 22 4.5 Equipment Maintenance .................................................................................. 23 4.6 Data Reduction.................................................................................................. 24 4.7 Uncertainity....................................................................................................... 27
5 RESULTS .................................................................................................................28 5.1 Boiling Curves .................................................................................................. 28 5.2 Tests at 100 psi (6.9 bar)................................................................................... 28 5.3 Tests with New Experimental Equipment ........................................................ 36 5.4 Tests at 200 psi Pressure ................................................................................... 36 5.5 Boiling Curves at 500 psi.................................................................................. 49
5.5.1 Tests with Boric Acid Solution..................................................................... 49 5.5.2 Tests with Lithium Metaborate..................................................................... 55
5.6 Boiling curves at 1000 psi................................................................................. 60 5.6.1 Tests with Boric Acid Soluiton..................................................................... 61

iv
5.6.2 Boiling curves for Lithium Metaborate ........................................................ 67 5.7 Formation of Deposits....................................................................................... 74
5.7.1 Test Procedure .............................................................................................. 74 5.7.2 Boric Acid Deposits...................................................................................... 75 5.7.3 Lithium Metaborate ...................................................................................... 82 5.7.4 Nucleation ..................................................................................................... 85
6 ANALYSIS OF RESULTS......................................................................................91 6.1 Effect of Coolant Concentration ....................................................................... 91
6.1.1 Effect of Boric Acid...................................................................................... 91 6.1.2 Effect of Lithium metaborate........................................................................ 93
6.2 Effect of Subcooling ......................................................................................... 93 6.3 Effect of Pressure.............................................................................................. 96 6.4 Analysis of Particulate Deposits ....................................................................... 97 6.5 Analysis of Bubble Growth behavior ............................................................... 97
7 CONCLUSIONS ......................................................................................................99 References.......................................................................................................................100 APPENDIX A.................................................................................................................102
A.1 Program for Data Reduction in FORTRAN ................................................... 102 A.2 Sample Data File............................................................................................. 117
APPENDIX B .................................................................................................................119 B.1 Product Reference........................................................................................... 119 B.2 Sample Heat Exchanger Calculations............................................................. 122

1
1 INTRODUCTION
1.1 Overview To meet the increasing demand for energy, it is essential that the electrical power
be generated at greater economy and safer conditions. Many of the existing nuclear pressurized water reactors (PWR) are planning to increase their licensed peak power limits to meet the higher demand for energy. Consequently, to provide better economy and improve the safety of operating nuclear reactors, core designs require higher peaking factors.
The higher power increases the possibility of a portion of core being subjected to subcooled nucleate boiling due to higher temperatures in the core. However, these new demands on reactors contribute to a phenomenon known as the “Axial Offset Anomaly” (AOA), which is the unexpected deviation in axial power distribution in the core from the predicted distribution. AOA is thought to occur when the crud deposits build up on the fuel rod cladding undergoing subcooled nucleate boiling [Frattini et all; 2001]. During subcooled nucleate boiling, several compounds become supersaturated near boiling sites leading to precipitation on the surface of the heater. This effect of subcooled nucleate boiling has a major consequence, especially in case of lithiated compounds of boron such as lithium metaborate (LiBO2) and boric acid (H3BO3) because of its high neutron capture cross section. The high neutron capture cross section of boron in lithiated compounds has a major effect on the local power distribution in a reactor by absorbing the neutrons in the core. The change in the neutron density in the core affects the axial power distribution in the reactor thereby causing “Axial Offset Anomaly”.
To resolve the problem of AOA, it is very important to understand the process affecting AOA. As AOA occurs during subcooled nucleate boiling upon the build up of crud deposits, it is essential to understand the phenomenon of subcooled boiling very well. The crud that builds on the Zircaloy-4 (Zr-4) clad fuel rod surface consists of corrosion products released in the reactor coolant system. The crud deposits are porous and hence affect the nucleation sites on the clad surface which in turn affect the rate of boron precipitation on the surface of fuel rod. The deposition rates are affected by several factors, which include the surface temperature, coolant concentration, and degree of subcooling of the bulk fluid. However, the information available about interactions between subcooled boiling and lithium and boron deposits is very scarce. Hence, an experimental study was conducted to understand the interaction of subcooled boiling and boron and lithium deposition on the surface of zircaloy clad rods.
The experimental study was conducted using specially designed high pressure boiling experimental equipment to measure the subcooled boiling heat transfer coefficient under varying operating conditions under varying operating conditions. The boiling tests were performed at prototypical PWR conditions with an electrical test heater simulating a fuel rod in a core of reactor. The boiling tests were conducted with varying concentrations of boric acid and lithium metaborate solutions with deionized water to measure the effect of coolant concentration on the boiling heat transfer coefficient.

2
1.2 Working of a PWR Pressurized water reactor or PWR is a nuclear reactor, where the water is used as
a primary coolant as well as secondary coolant. A schematic of working model of the pressurized water reactor is shown in Figure 1-1. The reactor vessel encloses the core, which consist of bundles of fuel rods. The purpose of the primary coolant is to remove the heat generated at the core, which is caused when the energy released in nuclear reactions is transformed by collisions into random molecular motion (heat) [Nero, 1979]. Highly pressurized deionized water is passed through the core in the reactor vessel; the deionized water is then passed through a steam generator where a secondary coolant
Figure 1-1 Schematic of working model of a pressurized water reactor (PWR) (water) is allowed to boil, producing steam to run the turbine. Using a secondary coolant helps in making the nuclear reactor safe by preventing any nuclear waste from mixing with steam supplying the turbines. The primary coolant also serves the purpose of neutron moderator by slowing down the neutrons in the reactor vessel. Boric acid is added to the primary coolant to control the power generated in the PWR, as boron is a good absorber of neutrons. The heat transfer from the fuel rods to the primary coolant (deionized water) in the reactor vessel occurs by subcooled boiling. AOA is believed to occur when there is sufficient build up of deposits on the fuel rod under subcooled boiling conditions.

3
1.3 Organization of Report This report has been primarily divided into 6 chapters. The first chapter
introduces the project. The literature concerning previous research related to AOA is discussed in Chapter 2. The experimental equipment used for obtaining the pool boiling results are explained in detail in Chapter 3 and Chapter 4 gives the procedures employed carrying out the experimental work. Chapter 5 presents the results obtained for pool boiling tests conducted at pressures of 100 psi, 200 psi, 500 psi and 1000 psi. The results of particulate boron and lithium deposits onto the Zr-4 clad are also presented in the Chapter 5. Analysis of results obtained from the pool boiling experiments are developed and presented in Chapter 6. Chapter 7 gives the conclusions generated by this investigation.

4
2 LITERATURE SURVEY
2.1 Overview This chapter discusses the previous relevant research work done regarding
subcooled pool boiling and effect of particulate deposits on heat transfer.
2.2 Pool Boiling Heat Transfer “Pool boiling is defined as boiling from heated surface submerged in a large
volume of stagnant liquid”[Collier and Thome 1994] If this liquid is at boiling point, it is called ‘saturated pool boiling’, or if the temperature of bulk liquid is below its boiling point, then it is called ‘subcooled pool boiling’. As the surface temperature of the heater exceeds the saturation temperature of the liquid, nucleation begins on heater surface.
The boiling process depends upon the nature of the surface, thermo physical properties of the fluid and vapor bubble dynamics [Sachdeva 2001].The results obtained from the boiling experiments are usually represented in the form of a “boiling curve” which is a plot of surface heat flux against the heater wall surface temperature (Tw). Boiling curves are sometimes presented with wall superheat instead of wall temperature. Wall superheat is defined as the temperature difference between the wall temperature and bulk fluid temperature (Tb). For boiling tests with coolant at saturation temperature, wall superheat (Tw-Tb) is equivalent to Tw-Ts, where Ts is the saturation temperature. Figure 2-1 shows the pool boiling curve for deionized water at atmospheric pressure. The region AB is the natural convection heat transfer region, where the temperature gradients are set up in a pool.
Figure 2-1 Pool boiling curve for water at atmospheric pressure [Source: Collier and Thome, 1999]

5
The onset of nucleate boiling (ONB) is the condition where the wall superheat temperature becomes sufficiently large to cause vapor nucleation at the heater surface. This condition usually occurs close to the meeting point of AB and B’C as shown in Figure 2-1. The B’C in Figure 2-1 indicates the nucleate boiling region where vapour nucleation occurs at the heater surface. The nucleation begins with a few individual bubbles at low heat flux and with increasing heat flux, the vapour structure changes because of bubble coalescence. With further increasing heat flux, vapour patches and columns are formed close to the surface.
The critical heat flux (CHF or point D) indicates the upper limit of nucleate boiling where the interaction between the liquid and vapour streams restrict the liquid supply to the heating surface. The transition boiling region (DE) is marked by the formation of an unstable vapour blanket over the heating surface that releases large patches of vapour at more or less regular intervals. At this point, the nucleation rate becomes so high that the flow of fresh liquid to the heater surface becomes restricted by the vapour film formed, causing a decline in the heat transfer rates. Wetting of the heating surface is only intermittent in this region. The film boiling region (EF) is characterized by formation of a stable vapor film which covers the entire heating surface and vapor is released from the film as regularly spaced bubbles. The heat transfer occurs by conduction and convection through the vapour. Heat transfer occurring through radiation becomes significant as the surface temperature of the heater increases to a very high value.
2.3 Boiling for Mixtures Kamoshida and Isshiki have investigated the pool nucleate boiling of multi
component lithium halide salt solutions at saturation under atmospheric pressure (Kamoshida and Isshiki, 1994). Kamoshida and Isshiki have performed pool boiling tests with binary system solutions of H2O/LiCl and H20/LiBr and ternary system solutions of H2O/LiCl+LiBr. It was found that the boiling curves of salt solutions, in the higher heat flux regions, have higher degree of superheat than deionized water. Their results also indicated that the mixed salt solutions have higher superheat in the transition region and therefore have lower heat transfer rates than a normal solution. The reduction in heat
transfer for mixed solutions was attributed to lower coalescence of bubbles than the other solutions.
The work done on pool boiling indicates that the heat transfer coefficients for mixtures vary significantly from their pure components. For the deionized water-ethylene glycol mixture, system reductions in heat transfer coefficients on the order of 65% were observed on both smooth and the Turbo BIII tubes at a mole fraction of 0.5 (Schnelle, 2002). These experiments were conducted at saturation temperatures near atmospheric pressures. Schnelle noted that the variation in the heat transfer coefficient depends on many factors such as concentration of the solution, level of subcooling, and surface roughness (schnelle, 2002).

6
2.4 Influence of Particulate Deposits Two studies have been found indicating that deposits and scaling generated
during boiling considerably affect the heat transfer rate. Consequently, nucleate boiling heat transfer may be reduced by scale formation even when the bulk foulant concentration is below its saturation level (Steinhagen and Jamialahmadi 1990). Steinhagen and Jamialahmadi have studied the interaction between scale formation and bubble formation and its effect on heat transfer using calcium sulphate (CaSO4) solution. It was found that the variation of heat transfer coefficient as a function of time was characterized by a sharp decrease to a minimum, followed next by an increase to a maximum and then a decrease to a asymptotic minimum. Pool boiling tests were performed using a saturated CaS04 solution over a period of 130 hours. The heat transfer coefficient decreased by nearly 30% for a constant heat flux of 38.5 kW/m2. This change in heat transfer coefficient is attributed to the dissolved and deposited CaSO4. Particulate deposition occurs due to evaporation at the base of the growing bubbles. Even though nucleation behavior has been studied for pool boiling, there is no generally accepted model to explain bubble growth behavior due to the complexity of boiling heat transfer. With addition of ethylenediaminetetraacetic acid (EDTA) to CaS04 solution, the boiling heat transfer coefficients was found higher than pool boiling heat transfer coefficient for saturated CaS04 solution under similar test conditions (Steinhagen and Jamialahmadi, 1991). The increase in pool boiling heat transfer coefficient under influence of the EDTA was explained by the decreased calcium deposits on the heater surface, indicating that the deposits of the precipate has a influence on the heat transfer rates.
Zhao and Tsuruta (2002) studied bubble growth behavior and developed the micro layer theory. The cycle of a bubble consists of two parts, one being the lifetime and other is the waiting time of nucleus activity. “The lifetime of the individual bubble consist of three durations : initial growth duration, final growth duration and the condensation duration before the individual bubble collapses”[ Zhao and Tsuruta 2002].
2.5 Axial Offset Anomaly The problem of Axial Offset Anomaly is widely reported in many of the operating
PWR’s. A report on the performance cycles of the Callaway nuclear power plant indicated an maximum axial offset of about 10% decrease and an axial offset of 6% increase in the power distribution (Konya, et all 1993). This study indicates the deviation from predicted power in cycles 4 and 5 of the Callaway power plant owned by Union Electric (St Louis, Missouri). One trend which was common in cycles 4 and 5 was that the negative deviation in the core axial offset was more significant that the positive deviation from the predicted power generation. Defloor (1993) has explained another significant AOA problem that has occurred in the DOEL Plant in Belgium (Konya, et all, 1993). During the plant’s 11th cycle of operation it was observed that there was a negative deviation from the predicted power and the maximum offset was found to be only about 4%. Further examination of AOA at the DOEL plant has revealed a thick layer of crud deposits on the surface of fuel. Investigations by Union Electric and Westinghouse into the AOA problem at Callaway plant indicated a 25 ppm increase in boron concentration after a power trip during the period when axial offset was observed. This implies that there is a relation between axial offset observed in PWR and boron concentration on the

7
fuel rod. Even though the performance reports of nuclear power plants indicate a strong relationship between the boron concentration and AOA, there is less research done detailing the how boron concentration affects the axial offset. In order to understand the interaction between coolant concentration and the total power shifts, it is very important to study how the coolant concentration affects the heat transfer rates between fuel rods and the coolant.
The main reason for the AOA problem is believed to be the effect of particulate deposits on subcooled nucleate boiling (Frattini, et.all 2001). Earlier studies indicated that subcooled nucleate boiling causes corrosion deposition in the upper spans of fuel assemblies. Although the main causes of AOA are known in general, it is still not clear how the mechanism occurs. Corrosion deposits tend to occur at the boiling regions. To understand the mechanism of deposition, it is essential to understand the relation between rate of heat transfer and deposition. Even though there have been extensive studies on the effect of some additives like CaSo4 on heat transfer rate, there has been no significant work done on the effect of boron and lithium metaborate precipitation on heat transfer rate. Hence, an experimental study was proposed to study the effect of coolant solution concentration on heat transfer characteristics at test conditions simulating the fuel rod of a PWR.
2.6 Objectives The primary objective of this project was to obtain experimental data for
subcooled pool boiling heat transfer coefficients on Zircaloy clad rods for coolants with varying concentrations of boron and lithium. The experimental data obtained will include influence of coolant concentration, bulk fluid subcooling, bulk fluid system pressure and heat flux on heat transfer rate. The project also aims at obtaining characteristic information about the deposits of boron and lithium on Zr-4 rods including a visual record of nucleation for subcooled boiling on Zr-4 clad rods.

8
3 EXPERIMENTAL EQUIPMENT
3.1 Overview This chapter presents a description of the experimental Equipment used for pool
boiling tests. The experimental test facility was designed in such a way that it would simulate the conditions of a fuel rod in the core of a Pressurized Water Reactor (PWR). This was done using a test chamber which could withstand very high pressures typical of a PWR vessel. An electrical test heater was used to simulate the fuel rod of PWR. A specially built ‘DC electrical power supply unit’ was used to power the test heater. A nitrogen cylinder and a compressed gas accumulator were used in combination to increase the coolant pressure to very high values. Pool boiling conditions were assumed for all the experimental tests conducted, because simulating the flow conditions of the primary coolant in a PWR is a very complex task requiring expensive equipment. The details of all the equipment used to perform subcooled boiling tests are discussed in this chapter. However, some subcooled boiling tests were conducted at a pressure of 100 psi, using a preliminary experimental set-up from that of the existing experimental set-up. To differentiate between the test set-up used for lower pressure (100 psi) and higher pressures, the existing pool boiling test equipment is hereafter referred to as “new pool boiling equipment” (higher pressures). This chapter primarily is divided into two parts. The first part describes the preliminary pool boiling test facility and the second part provides a detailed description of the new pool boiling test facility. As some of the equipment used in both preliminary and new pool boiling test setup is the same, they are explained in greater detail under the new experimental set up.
3.2 Preliminary Pool Boiling Test Equipment The pool-boiling test facility consisted of a high-pressure test chamber, bulk
heater, test heater, nitrogen cylinder and a hydro-pneumatic accumulator. A schematic diagram of the pool boiling test facility is shown in Figure 3-1. The experimental investigation necessitates use of a test chamber, which can operate under high pressures. Typically the pressures of the coolant in PWR range from 6.8MPa (1000psi) to 15.5MPa (2200psi) (Loftness, 1964). A unique high pressure vessel with view ports on either side of the pressure vessel was used for the pool boiling test setup.
The pressure vessel was designed and constructed by Van Vleet (1985) to investigate subcooled and saturated nucleate boiling on thin wires under transient conditions under high pressure conditions. The pressure vessel, made of 316 stainless steel, was used for conducting the experimental investigation. The test chamber (pressure vessel) was 40.64 cm in length with outer diameter of 12.065cm and inner diameter of 9.8425cm (Vleet, 1985). The test chamber had two optical ports located on the either side of the chamber facilitating the observation of the bubble formation on the test heater. The clear fused quartz windows were seated in tapered Teflon cushioning. The windows were held tight by clamping bushings with help of eight socket head screws.
The bulk heater was inserted axially at the center of a flange at one end of the test chamber. The specially built test heater was placed axially at the center of the other flange. The large diameter base and inside mounting of the bulk and test heaters

9
accommodate high pressures by a compression fiting in the holder base. Copper O-rings [Duniway, 2006] prevent leakage from the test chamber on the bulk heater end. The bulk heater’s function is to raise the temperature of the coolant in the test chamber. A 500 W immersion type cartridge heater manufactured by Watlow Inc [Watlow, 2006] was used for bulk heating of the water for pressures 100 and 200 psi.
Figure 3-1 Schematic diagram of Pool boiling test Equipment
The test heater had Zr-4 cladding and was obtained from a commercial reactor fuel supplier. Care was taken to prevent any damage to the outer surface of cladding. The heating element of the test heater was made of inconel 718. The test heater had an outer diameter of 9.5 mm (0.374 inch) and a heating element length of 2.5 cm (1 inch). The test heater simulated the conditions of a fuel rod inside a pressurized deionized water nuclear reactor. PTFE O-rings were used for effective sealing between the test heater flange and the pressure vessel. Power supplied to the test and bulk heater was manually controlled with potentiometers to regulate the amount of heat transfer to the fluid inside the test chamber. The test heater and bulk heater were operated on 115 V AC 60 hz power supply.
A combination of a nitrogen cylinder and an accumulator were used to regulate
the pressure of the fluid in the test chamber. As the water is incompressible, nitrogen gas is used to indirectly build pressure inside the testing chamber. The gas compressed hydraulic accumulator contained a bladder to prevent the nitrogen from mixing with the deionized water. A pressure regulator connected to nitrogen cylinder controled the pressure inside the test chamber. A pressure transducer connected to the test chamber

10
indicated the pressure inside the testing chamber. A relief valve was used to bleed the excessive pressure.
A T-type thermocouple was used to monitor the bulk temperature of the coolant. The voltage across the test heater was measured by a voltmeter connected in parallel. As measuring current requires placing an ammeter in series to the electrical circuit, a one ohm resistor is connected in series to the test heater. The current through the test heater was measured indirectly by monitoring the voltage drop across the resistor. The use of potentiometers helped in better control of electrical power supplied to the test heater which prevented voltage fluctuations.
3.3 New pool boiling test facility A new electrical test heater was aquired to operate at the higher pressures and
higher temperatures. A 100-ampere DC power supply already existing in the lab was used for supplying the power to the heater. Changes were made to the existing pool boiling test setup for operation of the new test heater. A schematic of the new pool boiling test facility is shown in Figure 3-2. Details of each component for the new pool boiling setup are explained later in this chapter.
3.3.1 Test Heater
The new test heater clad with zircaloy drew power from the 23 kW DC power supply unit. Stern Laboratories Inc. (Hamilton, Ontario, Canada) manufactured the heater. Figure 2 is a photograph of the test heater. A specially designed inner sleeve with holes drilled axially for four K-type thermocouples and INCONEL 718 filament was press fit into the Zr-tube. The physical parameters of the heater were not changed from that of previous heater to maintain the same heating configuration. A picture of the test heater with four thermocouples can be seen in Figure 3-3. The physical parameters of the heaters are as follows:
Zr Sheath O. D =0.374inches. Sheath Overall Length =6.75 inches. Maximum Heat Flux = 3 MW/m2. Heated Length (boiling region) = 1.0 inch.

11
Figure 3-2 Schematic of new pool boiling test facility.

12
Figure 3-3 photograph of test heater and connecting flange
3.3.2 Electrical DC Power Supply Unit
The electrical DC power supply had a combination of three 25 kVA single phase dry type distribution transformers and six silicon controlled rectifier (SCR) units to supply the required DC output from 3 phase AC input. The power supply system converted 208 Volts AC, 3 phase, 3 wire, and 60 Hz delta connected power supply into a controlled output. “The output ranged from ‘0 to 120’ VDC output at up to 180 amperes” [Hamilton, R C, 2000]. The power supply had operational limits due to the possible damage of the silicon controlled rectifiers (SCR’s) at their lower thermal limit. This unit cannot be operated beyond 130 VDC. The operating range of the power supply unit is represented in Figure 3-4 where the voltage and the current output should be within the envelope given.. The load powered by the “electrical DC power supply” was required to have a miniumum electrical resistance of 0.42Ω to prevent damage to SCR’s.

13
Figure 3-4 Operating limits of 23kW DC power supply unit
The maximum operating current to the load from the “electrical DC power supply” was 180 A. The total heat generation due to electrical losses depended upon the ‘current’ through the resistor and electrical resistance of the resistor. The electrical resistance of the test heater (0.07Ω) does not meet the minimum requirement condition for the operation of the “DC electrical power supply”. Hence, an additional load was added in series to the electrical test heater. The resistor (load) prevented damage to SCR. The power supplied by the “Electrical DC Power Supply” was controlled manually using the keys on ‘Fisher Rosemount DPR950 Controller display’.
3.4 Heat Exchanger The use of ‘electrical DC power supply unit’ was restricted by the electrical
resistance of the total load. An additional resistor was added in series to the test heater to ensure that the total electrical resistance of the load is in the operation range of the ‘electrical DC power supply unit’. Due to the high current in the resistor, the heat generated in the resistor (conduction losses) was very high. At a maximum current of 180 A, the heat generated is 18 kW for a resistor with an electrical resistance of 0.55Ω. Hence, a resistor with good heat dissipation characteristics was fabricated. As heat transfer by natural convection is not sufficient, the heat generated in the resistor must be removed by cold water. Inconel tubes served the dual purpose of acting as a resistor in the electric circuit and providing an effective means of heat dissipation. Hence, the name “heat exchanger” is used instead of the conventional ”resistor.”
Labroatory tap water was used to cool the inconel tubes. The unique property of inconel is that its electrical resistivity remains fairly constant over a broad range of temperatures. The photograph of the heat exchanger is provided in Figure 3-5

14
Figure 3-5 photograph of Inconel heat exchanger
The heat exchanger design calculations were made to determine the dimensions needed and are presented in the next paragraphs. The length of the inconel tubes was calculated from the electrical resistance required. The resistivity of inconel is known to be 1.03 μΩm at 20o C. Even at 100oC, its resistivity is 1.04 μΩm. The electrical resistance of a tube is given by the
AlR ρ
= (3.1)
where:
R = resistance of tube in ohms
A = cross-section of the tube in sq m.
ρ = electrical resistivity of material (inconel) in Ωm.
L = length of the tube in meters.
The heat generated had to be removed constantly to avoid the over heating of the inconel tubes. The minimum and maximum allowable electical resistance of the heat exchanger (resistor) was 0.41Ω and 0.71Ω, respectively. Considering an electrical resistance of 0.55Ω (average) for the heat exchanger, the maximum heat generated was 18 kW. Cold tap water was circulated through the inconel tubes to remove the generated heat.

15
Τhe design characteristics of the heat exchanger tubes were as follows:
• The total electrical resistance of the tubes should lie within the thermal limit of the ‘electrical DC power supply’. Consequently. the electrical resistance of the heater has to be greater than 0.41Ω and less than 0.71Ω.
• The rate of heat dissipation in the inconel tubes (heat exchanger) is dependent on the flow rate of the water through the inconel tubes.
Turbulent flow was maintained in the inconel tubes to ensure the maximum heat transfer between the tubes and water. Hence, the velocity of the water inside the tubes was high enough such that the Reynolds number was at least 2300 (transition for conduits). A hose of length 15 meters supplied tap water to inconel tubes. As a result, a maximum pressure drop of 40 psi was assumed over total length of hose and tubes. The flow velocity was computed from Darcy’s formula using Moody’s chart for the friction factor.
The following variables were used in the calculations:
Do = outer diameter of the tube in meters. Di = inner diameter of the tube in meters. hl = pressure difference between source and outlet of water in meters of hg. P1 = Supply pressure of water at inlet to the heat exchanger. P2 = Outlet Pressure of water in heat exchanger. f = friction factor. L = Total length of the Inconel tubing. Re = Reynolds number ρ = Density of the fluid in kg/m3 μ = Dynamic viscosity of the fluid. Nu = Nusselt Number Pr = Prandtl Number K = Thermal conductivity of the fluid in W/mk. Q = flow rate in m3/sec. A = hollow cross section of the Inconel tubes. V = velocity of the water flowing through the tube. Q = Water flow rate in heat exchanger in m3/sec Kwater = Thermal Conductivity of water at 300K =0.613 W/mk. Emax = Maximum heat generated in Inconel tubes. Ti = Inlet Temperature of water entering the heat exchanger. To = Outlet Temperature of water leaving the heat exchanger. Asurf = Surface area of the heat exchanger
The flow calculations were performed with an intial assumption of Do =.25” and L=1m. The final dimensions of the inconel tubes were obtained by iterating the initial guess values. The iterations were done with tube diameter varying from 0.25 inch to 1 inch.
21 PPP −=Δ (3.2)

16
The pressure of the tap water supply in the laboratory was 40 psig. The outlet pressure was atmospheric pressure and the pressure head was calculated from equation (3.2). The pressure head difference in metres is hl. The friction factor f was initially guessed and corrected with iterations.The velocity of the water inside the tube was calculated using Darcy’s formula using equation (3.3) .
fL
hgDV li2
= (3.3)
The Reynolds number was computed from equation (3.4) once the flow velocity and physical properties of the fluid were known.
⎟⎟⎠
⎞⎜⎜⎝
⎛=
μρiVD
Re (3.4)
If Reynolds number was greater than 2300 (critical Reynolds number for internal flow) it was turbulent flow. Moody’s chart gives a graphical relation between the Reynolds number, roughness factor, and friction factor. The roughness value for tubes was assumed as 0.004 based on the surface finish of the tubes. Hence, the friction factor was estimated from Moody’s chart.
The Dittus-Boelter equation (3.5) was used to determine the Nusselt number for turbulent flow in tubes.
nPrRe.Nu⎟⎠⎞
⎜⎝⎛
= 54
0230 (3.5) where n is 0.4 for heating (surface temperature Ts > Tb bulk temperature) and Pr for water is 5.8466. The water flow rate can be calculated from the velocity by equation (3.6)
VAQ *= (3.6) The coefficient of convective heat transfer h can be determined from Nusselt’s number using the equation (3.7)
⎟⎟⎠
⎞⎜⎜⎝
⎛=
i
water
DNuK
h (3.7)
The maximum heat generated is 18 kW. For the cooling to be efficient, the outlet temperature of water through the inconel tubes should be less than its boiling temperature. The heat lost by the inconel tubes is gained by the flowing tap water. Using the energy balance equation, the outlet temperature of water from the inconel heat exchanger was calculated using
surf
io hAE
TT max+= (3.8)
Iterations were carried out using the equations (3.1) to (3.8) until the electrical resistance of heat exchanger was higher than 0.41Ω. A sample calculation is included in the appendix. It was found that an inconel tube diameter of half inch and length of thirty feet

17
would satisfy the requirements. A tap water flow rate of 2.9gpm was found to be sufficient to cool the inconel tubing.
To fabricate the heat exchanger, the 30 ft long inconel tube was cut into 6 pieces of 5 feet each. The inconel tubes were laid parallel, ends joined by copper tube bends as seen in Figure 3.5. Wooden frames supported the tubes and two garden hoses transported the tap water flow to and from the heat exchanger. .
3.5 Bulk Heater A bulk heater was used to control the bulk temperature of the fluid. As the boiling
tests were conducted at higher pressures, the saturation temperatures are also high; hence more power was needed to raise the temperature of fluid. So the preliminary bulk heater of 500W capacity was replaced with a specially built 2 kW “Fire” rod immersion type heater (Watlow, Inc.) suitable for operation at pressures up to 2000 psi. The input power to the heater was controlled using a conventional rheostat. A photograph of test heater is given in Figure 3-6.
Figure 3-6 Bulk heater with flange and copper gasket for the preliminary test equipment.
18
3.5.5 Electric Circuit
The DC power supply supplied electrical current to the test heater and heat exchanger which were connected in series. The resistance of the test heater was very low at about 0.07Ω. The total resistance of the load was within the operational limits of the DC power supply unit. A special control unit on the DC power supply was used in metering the power input to the heater. A voltmeter in conjunction with the readout of the control unit indicated voltage across the load and total power supplied to the load. The test heater was a sheath return type heater. It is designed in such a way that only the positive terminal of power supply was connected directly to the heater. The negative terminal was connected to the test chamber. The test chamber was electrically grounded. Sheath return type heaters are more commonly used for high current applications.
3.5.2 High Speed Camera
To understand the phases of the bubble growth at the nucleation sites, a high-speed camera was used. Because the bubbles rise and collapse very quickly, it is a tough task to identify the exact growth process of bubbles rising from the heater surface. A high-speed camera can capture images at a relatively fast rate compared to a conventional movie camera. Some high speed cameras can capture images at speeds of 12,000 pictures per second (PPS) where conventional movie cameras capture images at a speed of 30 PPS.
The high-speed camera used here was a ‘HYCAM model # 41-0005’ manufactured by Redlake Corp and was used for observing the bubble growth behaviour. A photograph of the Hycam is provided in Figure 3-7 . It was a high speed 16mm motion picture camera with a rotating prism. The maximum speed of the camera was 11,000 half frames per second. The film transport had a maximum film capacity of 400 feet of standard thickness film where spools of 100’, 200’ and 400’ films can be loaded in the camera. The PPS dial in the high-speed camera was used to set the frame rates as per the requirement. The capture speed of the camera was adjusted by rotating the dial in conjunction with the multiplier switch. The minimum speed was 20 frames per second.

19
Figure 3-7 photograph of high speed camera Hycam model ‘41-0005’
3.5.3 Pressure Transducer
A pressure transducer was used to monitor the bulk fluid pressure inside the test chamber. The pressure transducer used for the preliminary pool boiling set up was replaced with a pressure transducer measuring guage pressure, Model PX35K1-3KGV (Omega Engineering, Inc.). The pressure transducer was calibrated for a range from 0 to 3000 psig and had an operating temperature range from 15 to 70oC. A stainless steel tube connects the pressure transducer and test chamber separating the transducer from the heat generation in the test chamber. A pressure transducer was preferred over a pressure gauge for better accuracy. The calibration data for transducer is provided in Table 3-1. The excitation for the transducer was 10 V DC. The accuracy of the transducer is 0.25% which includes linearity, hysteresis and repeatability. The characteristics this pressure transducer are given in Table 3-2.
The transducer was connected to a strain guage panel meter to read the pressure. The DP25-S strain guage panel meter (Omega Engineering, Inc.) used the calibrated

20
output voltage from the transducer to display the pressure in psi. The DP25-S panel meter had a digital display and its broad scaling capability allowed for the display of most engineering units (Omega Engineering 2002). The strain guage panel meter also had a facility for taring the output value.
ReadingPressure
(Psig)
Transducer Output Data
(mV DC)
1 0.0 0.000
2 1500.0 15.031
3 3000.0 30.004
4 1500.0 15.055
5 0.0 0.015
Table 3-1Calibration data for Pressure transducer (Omega Engineering Inc.) calibration sheet)
Item Parameters Value
1 Balance 0.310 mVdc
2 Sensistivity 30.004 mVdc
3 Input Resistance 350.3 ohms
4 Output Resistance 351.0 ohms
Table 3-2 Pressure transducer characteristics (Omega Engineering, Inc.)

21
4 EXPERIMENTAL PROCEDURE
4.1 Solution Preparation
Boiling tests were performed with pure deionized water, boric acid solution and lithium metaborate solution with various concentrations. PPM or parts per million is defined as the number of solute particles per million parts of solution. Consequently,
1000000×⎟⎟⎠
⎞⎜⎜⎝
⎛=
solutionofMasssoluteofMassPPM (4.1)
and so one ppm is equivalent to 1 milligram of solute per liter of deionized water (mg/l). The weight of the solute may be calculated from equation (4.1) when the parts per million and weight of the solution are known.
Boiling heat transfer experiments were conducted at 500 PPM, 1000 PPM, 2000 PPM and 5000 PPM concentration levels. Measurement of the weight of the solute (boric acid and lithium metaborate) was done using a weighing scale. This weighing scale could measure a maximum weight of 2.61 kg and had a least count of 0.1g. The boric acid solution was prepared by mixing the measured quantity of boric acid powder into the measured quantity of distilled deionized water. Typically, for every pool boiling test conducted, the coolant required was about a gallon. The weight of solute corresponding to a solvent volume of one gallon is presented in Table 4-1.
Solution no.
Coolant Concentration (PPM) Weight of the solute (g/gallon)
1 500 1.9
2 1000 3.8
3 2000 7.6
4 5000 19
Table 4-1 Coolant concentration and weight of the solute
4.2 Boric Acid Boric acid is a white powder soluble in water. The chemical properties of boric
acid are presented below obtained from its Material Safety Data Sheet (MSDS-Fisher Scientific, 2005].
Physical State: Solid (powdered) pH value: 3.6-4.0 (4% aqueous solution) Solubility: 4.9g/100g in water @ 20oC
Specific Density: 1.44 (water=1.0)
Molecular Formula: H3BO3

22
Molecular Weight: 61.83
Boric acid solution in deionized water was used as coolant to determine the pool boiling heat transfer coefficient. The boric acid solution boiling tests were performed with varying concentration of 500 ppm, 1000 ppm, 2000 ppm and 5000 ppm, respectively.
4.3 Lithium Metaborate The physical and chemical properties of lithium metaborate are presented below
obtained from its Material Safety Data Sheet (MSDS, Fischer 2005) Physical State: Crystalline Powder Density: 1.397 g/cm3 at 20o C
Molecular Formula: LiBO2
Melting Point: 845oC
Molecular Weight: 49.75
The boiling tests were performed with the same concentrations as for boric acid, namely 500 ppm, 1000 ppm, 2000 ppm and 5000 ppm lithium metaborate solution in deionized water.
4.4 Experimental Procedure
The experimental procedure to obtain the boiling heat transfer test data for the new setup is as follows:
1. The pressure vessel, test heater and bulk heater were cleaned with acetone to remove any deposits, settled due to earlier experiments. The cleaning of the surface ensures that all the boiling tests are performed at similar conditions.
2. The flanges of the pressure vessel are firmly fastened with eight bolts. Copper o-ring provides the necessary sealing arrangement. Care was taken to avoid leakage as improper fitting of the o-ring may lead to mechanical failure at high pressures.
3. The solution for the boiling test was prepared. A weight balance was used to measure the quantity of the solute in solution. The test chamber was filled with the prepared solution through the filling port.
4. Check bulk fluid temperature measurement. The temperature of the bulk fluid was measured with a T-type “quick disconnect” thermocouple (Model No. HTQIN 316G-12, Omega Engineering). The temperature reader on measurement panel indicates the temperature of the test heater.
5. Check test heater surface temperature measurement. Four K-type thermocouples, which measured the surface temperature of the electrical test heater, were connected to the thermocouple reader (DP-24 T, Omega Enginering) mounted on the measurement panel.

23
6. Check bulk fluid pressure transducer. The pressure of the coolant was measured from the transducer connected to the test chamber through a 3/16” stainless steel tube. The output from the transducer was fed into the DP-25 strain gauge panel meter.
7. The pressure of the coolant in the test chamber was then increased to the required level. The required pressure was obtained by pressurizing the gas side of accumulator from a nitrogen cylinder. The pressure was controlled by a regulatory valve on nitrogen cylinder. This results in increase of the pressure of the solution inside the test chamber.
8. After the solution was pressurized to the required pressure, the electrical bulk fluid heater was turned on to heat the solution. The amount of heat supplied to the solution was controlled by regulating the power supplied to bulk fluid heater using a rheostat. The temperature of the bulk fluid (coolant) was maintained at a constant temperature thus sustaining a specific subcooled condition. For example, a 20oC subcooled condition at 1000 psi pressure requires a temperature of 264.8oC which is 20oC below the saturation temperature of 284.8 oC .
9. Cold water was circulated through the inconel heat exchanger to remove the heat generated due to its electrical resistance.
10. Power was supplied to the electrical DC power supply by turning on the 3-phase, 240 volts, 100 Amps AC input. The power input to the test heater is slowly increased using the control unit on the DC power supply panel. As the input power to the test heater was increased, the power supply to the bulk heater was decreased keeping the bulk temperature constant.
11. Measure the voltage drop across the electrical test heater using the multimeter. The voltmeter on the ‘electrical DC power supply unit’ panel measured the voltage drop across the total load.
12. Measure the electrical current flowing through the test heater using the clamp type ammeter (Fluke 2005).
13. The power supplied to the test heater was increased in steps and the measurements mentioned in steps 4, 5, 6, 11 and 12 were recorded at each step only after the test heater temperatures reached steady state operation.
14. The test chamber was brought back to ambient conditions after the test was conducted by gradually decreasing the power supplied to the test heater and bulk heater, respectively.
15. Finally, the pressure of the coolant was decreased by bleeding off the nitrogen gas in the accululator.
4.5 Equipment Maintenance This section discusses the details concerning equipment failures that occurred
during the subcooled pool boiling tests and the precautions that need to be taken for proper functioning of pool boiling experimental equipment.

24
The test heater hook up wire was burnt causing sparks, disrupting the power circuit of the boiling set up. It was found that improper thermal insulation caused the two power supply wires to come in contact shorting the circuit. As the temperature of the pressure vessel rises to about 250oC at 1000-psi pressure, the power cables should have excellent electrical and thermal insulations. A fiberglass sleeve and high temperature resistant thermal tape was found to adequately insulate the power supply wires.
The quartz window in the optical view port, which was subjected to high pressure and high temperature, has a large thermal gradient across its thickness. The quartz window used in the pool boiling tests failed, even when the operating temperature was below the maximum working temperature of quartz window. The cracking of quartz window has been observed thrice during the operation of tests. The reason for breakage is likely due to the additional stress on the quartz window due to the unequal expansion rates of stainless steel housing and quartz. It was found that the failure could be due to improper cushioning and failure of the gasket. A new gasket (size 1.75” OD X 1.0” ID X 0.0625” thickness) made of “Non Asbestos C4401” was used to replace the failed gasket (Ernest 2005). The ”Non Asbestos C4401” material is a high temperature resistant and high pressure resistant material. These gaskets are manufactured by combining non –asbestos fiber with rubber. The non–asbestos C4401 can operate at a maximum temperature of 399oC. Replacing the gaskets has fixed this problem to a large extent. However, care should be taken to avoid sudden changes in temperatures of the test chamber as it may lead to cracking of the optical windows.
4.6 Data Reduction
The measured parameters in the pool boiling test were the bulk fluid temperature in the test chamber, surface temperatures of the test heater, the current flowing through the heater, the pressure inside the test chamber and the total voltage drop across the test heater and the heat exchanger. These measurements were used in the determination of heat flux and temperature difference between test heater surface and bulk fluid. The details of calculations for determination of heat flux are presented below. The variables and constants used in the calculations of heat flux are as follows:
RI = diameter of heater element (filament) = 0.0031111m
RCI = copper sleeve radius = 0.004178m
RO = outside diameter of heater rod (cladding) = 0.00475m
ZLB = boiling region length = 0.0254 m
ZLNC = ZLB = natural convection length =0.0254 m
ZEER = copper sleeve length = 0.0508 m
ACU = cross – sectional area of copper sleeve
V = voltage drop across heater in volts
I= electrical current flowing though the heater in amperes

25
R = resistance of the test heater = 0.07Ω
TCAVE= average temperature of heater surface which is determined from four
thermocouple temperatures TC1, TC2, TC3, TC4
TKAVE = TCAVE +273.15 K
TBAVE = bulk fluid temperature ( oC)
RC = thermal contact resistance between copper sleeve and zr-4 clad (m2 .K/W)
RTOT = total thermal resistance (m2.K/W)
Q = total input power to the test heater. (W)
q” = heat transfer flux (W/m2)
QLOSS = heat loss in cladding due to conduction in copper sleeve (W)
KCONDCU = thermal conductivity for copper = 391.0 W/ (m. K)
KCONDZR = thermal conductivity of zircalloy (W/m.K)
KCONDZR = 7.51 +0.0209TKAVE – (1.45*10-5) T2KAVE + (7.67*10-9) T3
KAVE
The electrical power input to the test heater is given by equation (4.2). The current was measured from a special ammeter, which was used to measure high currents by measuring the magnetic field intensity around the power cable.
RIQ 2= (4.2) The measurements from the four thermocouples located between the cladding
and copper sleeve of the test heater were used for computing the average surface temperature of test heater. The four thermocouples were located at a 90o angle to each other from the center of heater. The average temperature of the test heater is given by
⎟⎠⎞
⎜⎝⎛ +++
=4
4321 CCCCCAVE
TTTTT (4.3)
The actual wall temperature of the test heater was determined by applying steady state heat conduction equation. The wall temperature of heater was slightly less than average thermocouple temperature because of the thermal resistance. The wall temperature was computed using
⎟⎟⎠
⎞⎜⎜⎝
⎛ −=
TOT
CAVEWALL
RTT
Q (4.4)
TOTCAVEWALL QRTT −= (4.5) The thermal resistance was due to cladding material between the thermocouples
and outer wall of test heater. As heat transfer occurs in radial direction, the thermal resistance RTOT was calculated by using steady state heat equation for a hollow cylinder. The thermal resistance of a hollow cylinder is given by equation (4.6) (Sachdeva, 1988).

26
kL
rr
R inner
outer
thermal π2
ln ⎟⎟⎠
⎞⎜⎜⎝
⎛
= (4.6)
Rewriting equation (4.6) with test heater parameters, we obtain
CLBCONDZR
T
O
TOT RZk
RR
R +⎟⎟⎠
⎞⎜⎜⎝
⎛
=π2
ln (4.7)
where RC is thermal contact resistance which was calculated from natural convection cooling tests. The contact resistance is given by
LBT
C ZRR
π20000692.0
= (4.8)
Substituting (4.7) equation in equation (4.5) gives the wall temperature of the test heater
⎥⎥⎥⎥⎥
⎦
⎤
⎢⎢⎢⎢⎢
⎣
⎡
+⎟⎟⎠
⎞⎜⎜⎝
⎛
−= CLBCONDZR
TCAVEWALL R
ZkRR
QTTπ2
ln 0
(4.9)
The heat transfer Q was corrected for conduction loss through the copper conductor connected to test chamber. The corrected Q is given by equation (4.10) where QCORRECTED is the actual heat transfer occurring from the test heater to the bulk fluid.
LOSSCORRECTED QQQ −= (4.10) The heat loss was calculated by
EER
LCUCONDCULOSS Z
TAkQ
Δ= (4.11)
The temperature of coolant is the bulk fluid temperature. The heat transfer is directly proportional to the temperature difference between the wall temperature of test heater and the bulk fluid temperature. This temperature difference DELTΔ is defined by
BAVEWALLDEL TTT −=Δ (4.12) The heat flux across the test heater was represented as follows
LO
CORRECTEDZR
π2"= (4.13)
The coefficient of convective heat transfer was computed using
DELTqh
Δ=
" (4.14)
A FORTRAN program was used to compute the heat flux and coefficient of convective heat transfer incorporating the necessary equations. Dr. Steve Bajorek and Dr. Ken Shultis wrote this program for data reduction for pool boiling heat transfer analysis. Changes were made to the program to suit to the present test heater conditions and is noted to produce two output files. This program is given in the appendix.

27
4.7 Uncertainity
The thermocouples used to measure the surface temperatures of the electrical test heater had an accuracy of .1oC. The thermocouple used for measuring the bulk temperature of the liquid had an accuracy of 0.2oC. The thermocouple measurements influence the superheat uncertainty. The tolerance of the test heater diameter is .002 mm. The pressure transducer had an accuracy of .25%. The error percentage in the measurements of current and voltage are 3 % and 2%, respectively. The maximum deviation in the heat flux due to uncertainity in the measurements is therefore 4.5%. The maximum deviation in the superheat value is 2.5% and the uncertainity in the heat transfer coefficients due to the inaccuracies of the instrumentation is 7.2%.

28
5 RESULTS
5.1 Boiling Curves
Subcooled boiling solution tests were performed at pressures of 100 psi, 200 psi, 500 psi and 1000 psi. All the pressures indicated in the thesis are in absolute scale. The solution boiling tests were performed at subcooling temperatures of 30o C, 20o C, 10o C and at saturation temperatures. The boiling tests performed using deionized water serve as reference for comparison with the solution boiling tests of boric acid and lithium metaborate.
5.2 Tests at 100 psi (6.9 bar) Boiling tests were performed using the preliminary experimental set up (with AC
electrical power supply) at 100 psi (6.9 bar). The variation in the heat transfer characteristics are observed from boiling curves where each test is numbered for reference.
Boiling tests were conducted with pure deionized water and with varying concentrations of boric acid and lithium metaborate solution. The results for tests done with deionized water are shown in Figure 5-1 showing the variation of heat flux with superheat. The boiling curves are plotted for conditions with coolant at 30 oC subcooling, 20 oC subcooling, 10 oC subcooling, and at saturation conditions. The abscissa in Figure 5-1 represents the temperature difference between test heater surface and the bulk coolant (deionized water) which is also called superheat. The ordinate in Figure 5-1 represents the heat flux generated by the electrical test heater in kW/m2.
water, 100 psi (6.9bar)
0
50
100
150
200
250
300
0 10 20 30 40 50
Superheat (oC)
Hea
t Flu
x (k
W/m
2 )
30 Subcooling,#651 20 Subcooling,#652 10 Subcooling,#653 Saturation, #654
Figure 5-1 Boiling curve for deionized water at 100 psi pressure (6.9 bar).

29
The results of tests numbered 651 through 654 for deionized water can be seen in Figure 5-1. From Figure 5-1, observe that boiling curves for all subcooling conditions match well for lower heat flux. It can also be observed that for same heat flux, the degree of superheat is different indicating that the heat transfer coefficient decreases with increase of subcooling. The maximum heat flux is about 250 kW/m2 for all the subcooling curves, which is below the critical heat flux for deionized water. The boiling curve for test 651 increases linearly until 70 W/m2 heat flux and then rises steeply. This behavior can be explained by a change in phase of the water at surface of heater. The heat transfer between the heater and the coolant occurs by natural convection until the onset of nucleate boiling in the liquid. Beyond the saturation temperature, the heat transfer between heater and coolant occurs through nucleate boiling. The beginning of bubble formation is termed as nucleation. As the temperature of coolant is below its saturation temperature, the process is called subcooled nucleate boiling. The increase in the heat transfer rates is due to subcooled nucleate boiling. Similar phenomenon is observed for boiling curves at different subcooling rates.
500 ppm Boric Acid, 100 psi (6.9 bar)
0
50
100
150
200
250
300
0 10 20 30 40 50
Superheat(oC)
Hea
t Flu
x (k
W/m
2 ) 30 C Subcooling#661 20 C Subcooling#66210 C Subcooling #663
Saturated, #664
Figure 5-2 Boiling curve for 500 ppm boric acid solution at 100 psi pressure (6.9
bar) Figure 5-2 shows results for tests done from #661 to 664 for 500 ppm
concentrated boric acid solution. The results follow a similar trend to that of Figure 5-1 except for a small variation in superheat values. The boiling curves for 500 ppm boric acid and deionized water are compared in Figure 5-3. The boiling curves for 500 ppm boric acid tests coincide very well with that of deionized water for lower heat flux values. This indicates that addition of boron at 500ppm concentration does not have significant effect of heat transfer rates in the natural convection region. Upon keen observation, it can be found that the boiling curves for 500 ppm boric acid solution appear to have a slightly higher degree of super heat for similar heat flux values as that obtained with deionized water. The difference in boiling curves for deionized water and 500 ppm boric

30
acid is evident from Figure 5-3. It can also be noted that the change in superheat values for 500 ppm boric acid tests is small when compared to the actual superheat values for deionized water. However the small increase in superheat values is due to a change in fluid physical properties which causes less nucleation than deionized water. It can be concluded that boric acid slightly reduces the heat transfer rate at concentration level of 500 ppm and at 100 psi pressure for nucleate boiling.
Water and 500 ppm Boric Acid, 100 psi (6.9 bar)
0
50
100
150
200
250
300
0 10 20 30 40 50
Superheat(oC)
Hea
t Flu
x (k
W/m
2 )
water, 30 Subcooling,#651 water, 20 Subcooling,#652 water, 10 Subcooling,#653 water, Saturation, #654
500 ppm H3BO3, 30 CSubcooling #661500 ppm H3BO3, 20 CSubcooling #662500 ppm H3BO3, 10 CSubcooling #663500 ppm H3BO3,Saturated, #664
Figure 5-3 Comparison of boiling curves for deionized water and 500 ppm boric
acid solution at 100 psi (6.9 bar). The test results with 500 ppm lithium metaborate solution are presented in Figure
5-4. It can be observed that there is a change in the superheat values of 500 ppm lithium metaborate solution with respect to deionized water but it is not significant. However, degradation of the boiling heat transfer coefficients seems to be marginally more in the case of lithium metaborate than boric acid for the same concentration of 500ppm. This signifies that the lithium metaborate also slightly reduces the heat transfer rate at a concentration of 500 ppm at 100 psia pressure under nucleate boiling. The degradation in heat transfer due to the presence of lithium metaborate at 500 ppm concentration can be observed in Figure 5-5.
However degradation of boiling heat transfer coefficients seems to be marginally more in case of lithium metaborate than boric acid for the same concentration of coolant. For instance, at a heat flux of 164 kW/m2, the solution of 500 ppm boric acid (test #661) at 30 oC subcooling resulted in 4.5% decrease in heat transfer coefficient and a reduction of 4.8% in heat transfer coefficient case of 500 ppm lithium metaborate (test #666) at 30 oC subcooling. The reference for comparison of heat transfer coefficients is test #651 for deionized water, which has a boiling heat transfer coefficient of 39.72 kW/m2oC at a similar heat flux value and 30 oC subcooling.

31
500 ppm Lithium Metaborate, 100 psi (6.9 bar)
0
50
100
150
200
250
300
0 10 20 30 40 50
Superheat (oC)
Hea
t Flu
x (k
W/m
2 )500 ppm LiBO2, 30Subcooling, #666500 ppm LiBO2, 20Subcooling, #667500 ppm LiBO2, 10Subcooling, #668500 ppm LiBO2,Saturated, #669
Figure 5-4 Boiling curves for 500 ppm lithium Metaborate solution at 100 psi (6.9
bar)
30 C subcooling, 100 psi (6.9 bar)
100.00120.00140.00160.00180.00200.00220.00240.00
40 41 42 43 44 45
Superheat (oC)
Hea
t Flu
x (k
W/m
2 ) water, 30Subcooling, #651
500 ppm LiBO2, 30Subcooling, #666
Linear ( water, 30Subcooling, #651)
Linear (500 ppmLiBO2, 30Subcooling, #666)
Figure 5-5 Comparison of deionized water and 500 ppm concentrated lithium metaborate test results.

32
2000 ppm Boric Acid, 100 psi (6.9bar)
0
50
100
150
200
250
300
0 10 20 30 40 50
Superheat (oC)
Hea
t Flu
x (k
W/m
2 )
2000 ppm H3BO3,30 Subcooling, #6792000 ppm H3BO3,20 Subcooling, #6802000 ppm H3BO3,10 Subcooling, #6812000 ppm H3BO3,Saturation, #682
Figure 5-6 Boiling curve for 2000 ppm boric acid solution at 100 psi pressure (6.9
bar).
2000 ppm Lithium Metaborate, 100 psi (6.9bar)
0
50
100
150
200
250
300
0 10 20 30 40 50
Superheat (oC)
Hea
t Flu
x (k
W/m
2 )
2000 ppm LiBO2, 30Subcooling, #6842000 ppm LiBO2, 20Subcooling, #6852000 ppm LiBO2, 10Subcooling, #6852000 ppm LiBO2,Saturation, #686
Figure 5-7 Boiling curves for 2000 ppm lithium Metaborate solution at 100 psi (6.9 bar).

33
saturation,100 psi
0
5
10
15
20
25
100 150 200 250 300
Heat Flux (kW/m2)
Bio
ling
Hea
t Tra
nsfe
r C
oeffi
cien
ts (k
W/m
2 o C)
water,Saturated,100psi-#654
2000 ppmLiBO2,Saturated,100psi-#686
Figure 5-8 Degradation of boiling heat transfer coefficients with 2000 ppm lithium metaborate solution at 200 psi (6.9 bar).
5000 ppm Boric Acid, 100 psi (6.9bar)
0
50
100
150
200
250
300
0 10 20 30 40 50 60
Superheat (oC)
Hea
t Flu
x (k
W/m
2 ) 5000 ppm H3BO3,30 Subcooling, #6915000 ppm H3BO3,20 Subcooling, #6925000 ppm H3BO3,10 Subcooling, #6935000 ppm H3BO3,Saturation, #694
Figure 5-9 Boiling curve for 5000 ppm boric acid solution at 100 psi pressure (6.9 bar).

34
Test results with 2000 ppm boric acid solution are presented in Figure 5-6 where considerable change in pool boiling heat transfer coefficients with 2000 ppm boric acid solution occurs. Figure 5-7 shows the results of the boiling tests with 2000-ppm lithium metaborate solution and Figure 5-8 displays the same results in terms of the heat transfer coefficient. For example, with a heat flux of 250 kW/m2, the boiling heat transfer coefficient decreased by 20% when compared to deionized water at saturation temperature.
Test results for 5000 ppm boric acid solution are presented in Figure 5-9. As with the results of other boiling curves, it is observed that all four boiling curves coincide at lower heat fluxes indicating that the concentration level of coolant has no effect on the natural convective heat transfer. A comparison of the test results for test 694 and 654 is shown in Figure 5-10 at the 10 oC subcooled condition. It is clear that the temperature gradient between the heater wall and coolant solution is considerably higher in the case of 5000 ppm boric acid solution. The decrease in the heat transfer coefficient is due to the reduced nucleation which was not uniform and unlike that of deionized water leading to lower heat transfer rates.
Deionized water & 5000 ppm Boric Acid, 100 psi (6.9bar)
050
100150200250300
0 5 10 15 20
Superheat (oC)
Hea
t Flu
x (k
W/m
2 )
water, Saturation, #654
5000 ppm H3BO3,Saturation, #694
Figure 5-10 Comparison of boiling curves at saturated condition for deionized
water and 5000 ppm concentrated solution at 100 psi(6.9 bar). A reduction of 24.2% is shown in Figure 5-10 in the heat transfer coefficient for
the 5000 ppm boric acid solution (heat flux = 153 kW/m2) at saturated conditions compared to the boiling heat transfer coefficient of deionized water (13.08 kW/m2oC, heat flux = 153 kW/m2). Similarly a reduction of 25.5% is seen for the heat transfer coefficient with 5000 ppm lithium metaborate solution (heat flux = 154 kW/m2) as shown in Figure 5-12 when compared with that obtained from deionized water at a similar heat flux.. The test results for 5000 ppm lithium metaborate is shown in Figure 5-11.

35
5000 ppm Lithium Metaborate, 100 psi
0
50
100
150
200
250
300
0 20 40 60
Superheat (oC)
Hea
t Flu
x (k
W/m
2 ) 5000 ppm LiBO2,30 Subcooling,#6955000 ppm LiBO2,20 Subcooling,#6965000 ppm LiBO2,10 Subcooling,#6975000 ppm LiBO2,Saturation, #698
Figure 5-11 Boiling curves for 5000 ppm lithium Metaborate solution at 100 psi
(6.9 bar).
saturation,100 psi
0
5
10
15
20
25
100 150 200 250 300
Heat Flux (kW/m2)
Bio
ling
Hea
t Tra
nsfe
r C
oeffi
cien
ts (k
W/m
2 o C)
water,Saturated,100psi-#654
5000 ppmLiBO2,Saturated,100psi-#686
Figure 5-12 Degradation of boiling heat transfer coefficients with 5000 ppm
lithium metaborate solution (6.9 bar).

36
5.3 Tests with New Experimental Equipment
Boling tests were performed at 100 psi with the new experimental set-up (DC electrical power supply) to compare the results of the preliminary experimental set up. The new test heater has the same dimensional and material properties as the old test heater. The test results for deionized water (tests through #721 to 725) are presented in Figure 5-13. The boiling test results from the new experimental set up match very well with results from the preliminary set-up. Figure 5-13 shows the results obtained from tests through 721 to 725 (new setup) and tests 651 through 655 (preliminary set up). A similar trend was obtained for tests done with 2000 ppm boric acid and 2000 ppm lithium metaborate where the percent difference is only 1.3%. These results verify that the new experimental set-up was operating properly.
water, 100 psi (6.9bar)
0
50000
100000
150000
200000
250000
300000
0 10 20 30 40 50
Superheat (oC)
Hea
t Flu
x (W
/m2 )
30 Subcooling, #651
20 Subcooling, #652
10 Subcooling, #653
Saturation, #654
30 Subcooling, #721
20 Subcooling, #722
10 Subcooling, #723
Saturation, #724
Figure 5-13 Comparison results from old and new experimental set up (6.9 bar).
5.4 Tests at 200 psi pressure
Boiling tests performed at a pressure of 200 psi (13.3bar) showed similar results to those of tests done at lower pressure. The tests done are performed using the new experimental setup. Figure 5-14 shows results indicating boiling curves for varying degree of subcooling for deionized water. It can be clearly observed from the results that at lower heat flux, the boiling curves coincide very well. This can be explained due to lack of nucleation and this region indicates heat transfer takes place through natural convection. The boiling curves begin to rise steeply after a point indicating the onset of nucleate boiling. Because of nucleation, the rate of heat transfer increases rapidly. The boiling curves rise steadily with an increase of heat flux.

37
water 200 psi
0
50
100
150
200
250
300
0 10 20 30 40 50
superheat (oC)
Hea
t Flu
x (k
W/m
2 ) water, 30 CSubcooling, #801water, 20 CSubcooling, #802water, 10 CSubcooling, #804water, saturated, #806
Figure 5-14 Boiling curves for deionized water at 200psia (13.8 bar).
The boiling tests have revealed that the rate of heat transfer decreases with an increase of subcooling as can be seen in Figure 5-14. Also observe that the onset of nucleate boiling (ONB) is dependent on the degree of subcooling. For instance, the onset of nucleate boiling seems to occur at a heat flux of 45 kW/m2 for saturated conditions whereas ONB occurs at the heat flux of 101 kW/m2 for 30oC subcooled conditions. The maximum heat flux for all degrees of subcooling is well below the critical heat flux value of 1 MW/m2 of deionized water (Incropera,2001).
Boiling tests were performed with varying concentrations of boric acid in the coolant. Tests were performed with concentrations of 500 ppm, 1000 ppm, 2000 ppm and 5000 ppm, similar to tests at 100 psi.
Figure 5-15 shows the heat transfer coefficients for 500 ppm concentrated boric acid solution. Figure 5-20, 5-25, and 5-30 represent the results of the pool boiling tests for 1000 ppm, 2000 ppm and 5000 ppm concentrations of boric acid, respectively. Figure 5-17, Figure 5-22, Figure 5-28, and Figure 5-33 show the results of tests for 500 ppm, 1000 ppm, 2000 ppm and 5000 ppm concentration level of lithium metaborate, respectively.

38
500 ppm Boric Acid, 200 Psi (13.8 bar)
0
50
100
150
200
250
300
0 10 20 30 40 50
Superheat (oC)
Hea
t Flu
x (k
W/m
2 ) 30 C Subcooling #80720 C Subcooling#80810 C Subcooling#809Saturated #810
Figure 5-15 Boiling Curve for 500 ppm boric acid at 200 psi (13.8 bar)
Deionized Water & 500 ppm Boric Acid, 200 Psi (13.8 bar)
0
50
100
150
200
250
300
0 10 20 30 40 50
Superheat (oC)
Hea
t Flu
x (k
W/m
2 )
water, Saturated,#806
water,30 C Subcooling#801water,10 C Subcooling#804water,20C Subcooling#802500 ppm boric acid,30Subcooling #807500 ppm boric acid, 20 CSubcooling #808500 ppm boric acid,10 CSubcooling #809500 ppm boricacid,Saturated #810
Figure 5-16 Boiling curves for deionized water and 500 ppm boric acid at 200 psi (13.8 bar)

39
500 ppm Lithium Metaborate, 200 Psi (13.8 bar)
0
50
100
150
200
250
300
0 10 20 30 40 50
Superheat (oC)
Hea
t Flu
x (k
W/m
2 ) 30 C Subcooling#81120 C Subcooling #81210 C Subcooling#813saturated #814
Figure 5-17 Boiling curves for 500 ppm LiBO2 Solution, 200 psi (13.8 bar)
500 ppm Lithium Metaborate, 200 Psi (13.8 bar)
0
50
100
150
200
250
300
0 10 20 30 40 50
Superheat (oC)
Hea
t Flu
x (k
W/m
2 )
water, Saturated #806
500 ppm LiBO2,saturated #814water, 30 CSubcooling, #801water,10 CSubcooling, #804 water, 20 CSubcooling,#802500 ppm LiBo2, 30 CSubcooling #811500 ppm LiBo2, 20 CSubcooling #812500 ppm LiBo2, 10 CSubcooling #813
Figure 5-18 Boiling curves for deionized water and 500 ppm LiBO2 solution, 200 psi (13.8) bar

40
10 C Subcooling, N 804 & N813, 200 Psi (13.8 bar)
0
50
100
150
200
250
300
0 10 20 30
Superheat (oC)
Hea
t Flu
x (k
W/m
2 )
water, #804
500 ppm LiBo2 #813
Figure 5-19 Boiling curves for deionized water and 500 ppm LiBO2 solution, 10 C subcooling and 200 psi (13.8 bar)
Figure 5-21 indicates the decrease in boiling heat transfer coefficient due to the presence of boron at 1000 ppm concentration,where for a heat flux of 218 kW/m2, the heat transfer coefficient is 8.2 kW/m2oC compared to a value of 9.1 kW/m2oC for deionized water indicating - almost a 9% drop. It can be observed from Figure 5-26 and Figure 5-27 that the presence of boric acid presence has a significant effect on the heat transfer rate. Additionally, the degradation of heat transfer coefficient continues with increasing concentration of boric acid from 500 ppm to 2000 ppm and is explained by the observed change in nucleation. For deionized water, bubbles were found to rise uniformly along the heater surface. For boric acid tests 825 and 826, the bubbles departed the heated surface in irregular clumps. With increasing heat flux, it was observed that the number of bubbles increased and departed the heated surface in a sporadic manner. This variation in bubble behavior patterns shows that the presence of boron reduces nucleation consequently reducing the heat transfer coefficient.
For a 2000 ppm concentration of boric acid, the heat transfer coefficient (heat flux = 221 W/m2, saturated) decreased 19.9%. Figure 5-31 shows the variation of heat transfer coefficient in presence of boron at 5000 ppm concentration. Comparing Figure 5-31 and Figure 5-26, observe that the heat transfer coefficient does not change significantly. This indicates boric acid concentration changes from 2000 ppm to 5000 ppm decrease the heat transfer coefficient much less than occurs from 0 to 2000 ppm .
Observations from the boiling test results indicate that the boiling heat transfer rates for 200 psi (13.8 bar) follow a similar trend as the results obtained for 100 psi (6.9 bar). Observations from Figure 5-18 and Figure 5-19 indicates degradation of the boiling heat transfer coefficient for 500 ppm lithium metaborate relative to deionized water. A decrease of the heat transfer coefficient by 6.5% occurrs at 10oC subcooling. Figure 5-23,

41
Figure 5-24, Figure 5-29, Figure 5-33, and Figure 5-34 show the influence of lithium metaborate solution compared to deionized water at 200 psi (13.8 bar). Tests with lithium metaborate at a pressure of 200 psi (13.8 bar) showed a similar trend as the tests conducted with a bulk liquid pressure of 100 psi (6.9 bar). The tests results indicate a reduction of the heat transfer coefficient by 23% (heat flux = 221 kW/m2, saturated) for the 5000 ppm lithium metaborate solution. Comparing the heat transfer coefficients from Figure 5-30 and Figure 5-33, observe that lithium metaborate has greater influence than boric acid. In general, it is concluded from these boiling tests that the reduction in heat transfer coefficient is higher in presence of lithium metaborate solution than boric acid solution.
1000 ppm boric acid, 200 psi (13.8 bar)
0
50
100
150
200
250
300
0 10 20 30 40 50
Superheat (oC)
Hea
t Flu
x (k
W/m
2 ) 1000 ppm H2BO3, 30CSubcooling #8151000 ppm H2BO3, 20Csubcooling #8161000 ppm H2BO3, 10C Subcooling #8171000 ppm H2BO3,saturated #818
Figure 5-20 Boiling curves for 1000 ppm boric acid solution at 200 psi (16.9 bar).

42
variation in boiling heat transfer coefficients
0
2
4
6
8
10
12
100 150 200 250 300
Heat Flux (kW/m2)
Bio
ling
Hea
t Tra
nsfe
r C
oeffi
cien
ts (k
W/m
2 oC
)water, 10 Csubcooling,200 psi1000 ppm H3BO3, 10C subcooling, 100 psi
Figure 5-21 Degradation of boiling heat transfer coefficients due to1000 ppm
boric acid concentration at 10o C bulk fluid subcooling, 200 psi (13.8 bar).
1000 ppm lithium metaborate , 200 psi (13.8 bar)
0
50
100
150
200
250
300
0 10 20 30 40 50
Superheat (oC)
Hea
t Flu
x (k
W/m
2 )
30 C Subcooling #82120 C Subcooling #82210 C Subcooling #813saturated #824
Figure 5-22 Boiling curves for deionized water and 1000 ppm LiBO2 solution, 200 psi (13.8 bar).

43
Deionized water and 1000 ppm lithium metaborate, 200 psi
0
50
100
150
200
250
300
0 10 20 30 40 50
Superheat (oC)
Hea
t Flu
x (k
W/m
2 )
water, 30 C Subcooling,#8011000 ppm LiBO2, 30 CSubcooling #821
Figure 5-23 Effect of lithium metaborate concentration on heat transfer coefficients at 30 oC subcooling and 200 psi pressure (13.8 bar).
Deionized water and 1000 ppm lithium metaborate, 200 psi
0
50
100
150
200
250
300
0 10 20 30 40
Superheat (oC)
Hea
t Flu
x (k
W/m
2 )
water, 20 C Subcooling,#8021000 ppm LiBo2, 20 C Subcooling #822
Figure 5-24 Effect of lithium metaborate concentration on heat transfer coefficients at 20 oC subcooling and 200 psi (13.8 bar).

44
2000 ppm Boric Acid, 200 psi (13.8 bar)
0
50000
100000
150000
200000
250000
300000
0 10 20 30 40 50
Superheat (oC)
Hea
t Flu
x (W
/m2)
2000 ppm H3BO3, 30 CSubcooling # 8252000 ppm H3BO3, 20 CSubcooling #8262000 ppm H3BO3, 10 CSubcooling #8272000 ppm H3BO3,Saturated #828
Figure 5-25 Boiling curves for tests with 2000 ppm concentration boric acid
solution at 200 psi (13.8 bar).
Deionized water and 2000 ppm Boric Acid, 200 psi (13.8 bar)
0
50000
100000
150000
200000
250000
300000
0 10 20 30 40 50
Superheat (oC)
Hea
t Flu
x (W
/m2 )
water, 30 C Subcooling,#801water, 20 C Subcooling,#802water, 10 C Subcooling,#804water, saturated, #806
2000 ppm H3BO3, 30 CSubcooling # 8252000 ppm H3BO3, 20 CSubcooling #8262000 ppm H3BO3, 10 CSubcooling #8272000 ppm H3BO3,Saturated #828
Figure 5-26 Boiling curves for deionized water and 2000 ppm concentration boric
acid solution at 200 psi (13.8 bar).

45
20 C Subcooling, 200 psi (13.8 bar)
0
50
100
150
200
250
300
0 10 20 30 40
Superheat (oC)
Hea
t Flu
x (W
/m2 )
water, 20 C Subcooling,#8022000 ppm H3BO3, 20 CSubcooling #826
Figure 5-27 Effect of boric acid concentration on heat transfer at 20 C subcooling
and 200 psi pressure (13.8 bar).
2000 ppm Lithium Metaborate, 200 psi (13.8 bar)
0
50000
100000
150000
200000
250000
300000
0 10 20 30 40 50
Superheat (oC)
Hea
t Flu
x (W
/m2 )
2000 ppm LiBo2, 30 CSubcooling #8302000 ppm LiBo2, 20 CSubcooling #8222000 ppm LiBo2, 10 CSubcooling #8322000 ppm LiBo2,Saturated #833
Figure 5-28 Boiling curves for 2000 ppm LiBO2 solution, 200 psi (13.8 bar).

46
20 C Subcooling, 200 psi (13.8 bar)
0
50
100
150
200
250
300
0 10 20 30 40
Superheat (oC)
Hea
t Flu
x (k
W/m
2 )
water, 20 C Subcooling,#8022000 ppm LiBo2, 20 CSubcooling #822
Figure 5-29 Effect of lithium metaborate concentration on heat transfer at 20o C
subcooling and 200 psi pressure (13.8 bar).
5000 ppm boric Acid, 200 psi ( 13.8 bar)
0
50000
100000
150000
200000
250000
300000
0 10 20 30 40 50
Superheat (oC)
Hea
t Flu
x (W
/m2 )
5000 ppm H3BO3, 30C Subcooling # 8355000 ppm H3BO3, 20C Subcooling #8365000 ppm H3BO3, 10C Subcooling #8375000 ppm H3BO3,Saturated #838
Figure 5-30 Boiling curves for tests with 5000 ppm concentration boric acid
solution at 200 psi (13.8 bar).

47
20 C Subcooling, 200 psi ( 13.8 bar)
0
50
100
150
200
250
300
0 10 20 30 40
Superheat (oC)
Hea
t Flu
x (k
W/m
2 )
water, 20 C Subcooling,#8025000 ppm H3BO3, 20 CSubcooling #836
Figure 5-31 Effect of boric acid concentration (5000 ppm) on heat transfer at 20
C subcooling and 200 psi pressure (13.8 bar).
variation in boiling heat transfer coefficients
0
2
4
6
8
10
12
100 150 200 250 300
Heat Flux (kW/m2)
Bio
ling
Hea
t Tra
nsfe
r C
oeffi
cien
ts (k
W/m
2 oC
)
water, 10 Csubcooling,200 psi5000 ppm H3BO3, 10C subcooling,200 psi
Figure 5-32 Effect of boric acid concentration (5000 ppm) on heat transfer at 10
C subcooling and 200 psi pressure (13.8 bar).

48
5000 ppm Lithium Metaborate, 200 psi (13.8 bar)
0
50000
100000
150000
200000
250000
300000
0 10 20 30 40 50
Superheat (oC)
Hea
t Flu
x (W
/m2 )
5000 ppm LiBO2, 30 CSubcooling # 8405000 ppm LiBO2, 20 CSubcooling #8415000 ppm LiBO2, 10 CSubcooling #8425000 ppm LiBO2,Saturaterd #843
Figure 5-33 Boiling curves for 5000 ppm LiBO2 solution, 200 psi (13.8 bar).
Water and 5000 ppm Lithium Metaborate, 200 psi (13.8 bar)
0
50
100
150
200
250
300
0 10 20 30 40 50
Superheat (oC)
Hea
t Flu
x (k
W/m
2 )
water, 30 C Subcooling,#8015000 ppm LiBO2, 30 CSubcooling # 840
Figure 5-34 Effect of lithium metaborate concentration (5000 ppm) on heat transfer at 30 C subcooling and 200 psi pressure (13.8 bar).

49
variation in boiling heat transfer coefficients
0
2
4
6
8
10
12
100 150 200 250 300
Heat Flux (W/m2)
Bio
ling
Hea
t Tra
nsfe
r C
oeffi
cien
ts (W
/m2 o C
)
water, 10 Csubcooling,200 psi5000 ppm LiBO2, 10 Csubcooling,200 psi
Figure 5-35 Degradation of heat transfer coefficients due to lithium metaborate
(5000 ppm) at 10 C subcooling and 200 psi pressure (13.8 bar).
5.5 Boiling Curves at 500 psi Boiling tests were conducted at a higher pressure of 500 psi. The boiling curves
for pure deionized water at 500 psi are presented below in Figure 5-36. For lower heat fluxes, the boiling curves match well indicating that natural convection heat transfer is dominate.
5.5.1 Tests with Boric Acid Solution
Figure 5-37 shows the results with 500 ppm boric acid. The variation in heat transfer coefficient is observed in Figure 5-38. As with the lower pressures previously discussed, observe that the 500 ppm boric acid solution at pressure of 500 psi has less influence on boiling the heat transfer coefficient compared to solutions with higher concentrations of boric acid.

50
Deionized water, 500 psi (34.5 bar)
0
50
100
150
200
250
300
0 10 20 30 40 50
Superheat (oC)
Hea
t flu
x (k
W/m
2 )
water, saturated #910
water, 30C Subcooling#907water, 20 C subcooling#908water, 10C subcooling #909
Figure 5-36 Boiling curves for deionized water at 500 psi (34.5 bar).
The test results of 1000 ppm boric acid and 2000 ppm boric acid are shown in
Figure 5-39 and Figure 5-41, respectively. Figure 5-42 indicates the decrease in heat
transfer coefficient in the presence of boric acid at 2000 ppm concentration with respect
to deionized water. From Figure 5-42, the degradation in boiling heat transfer coefficient
is 21%, when compared with deionized water (tests numbered 930 and 904). Figure 5-40
shows the variation in boiling curves for the 1000 ppm boric acid solution test compared
to deionized water at subcooling 10oC (231.4oC). Figure 5-44 shows boiling tests
numbered 935 and 939 where the degree of subcooling ranges from 30 oC to 0oC with
5000 ppm concentrated boric acid solution.
Figure 5-38, Figure 5-43 and Figure 5-45 represent the change in the boiling curves for 500 ppm, 2000 ppm and 5000 ppm concentration boric acid solutions, respectively, with reference to the boiling curves of deionized water at similar subcooling conditons. From Figure 5-45, observe that the superheat for the 5000 ppm boric acid solution is considerably greater than that of deionized water at a saturation temperature of 284.4oC (34.5 bar) for subcooling temperatures of 10oC, 20oC, and 30oC. This indicates
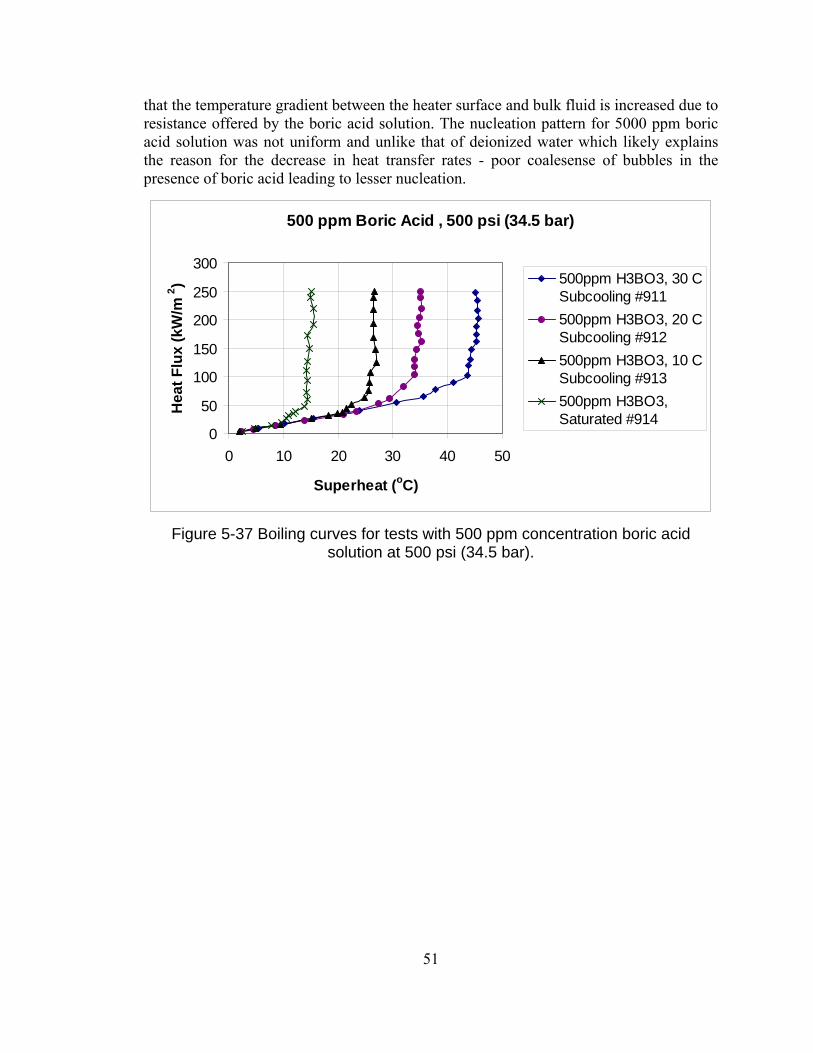
51
that the temperature gradient between the heater surface and bulk fluid is increased due to resistance offered by the boric acid solution. The nucleation pattern for 5000 ppm boric acid solution was not uniform and unlike that of deionized water which likely explains the reason for the decrease in heat transfer rates - poor coalesense of bubbles in the presence of boric acid leading to lesser nucleation.
500 ppm Boric Acid , 500 psi (34.5 bar)
0
50
100
150
200
250
300
0 10 20 30 40 50
Superheat (oC)
Hea
t Flu
x (k
W/m
2 ) 500ppm H3BO3, 30 CSubcooling #911500ppm H3BO3, 20 CSubcooling #912500ppm H3BO3, 10 CSubcooling #913500ppm H3BO3,Saturated #914
Figure 5-37 Boiling curves for tests with 500 ppm concentration boric acid
solution at 500 psi (34.5 bar).

52
Water and 500 ppm Boric Acid , 500 psi (34.5 bar)
0
50
100
150
200
250
300
0 10 20 30 40 50
Superheat (oC)
Hea
t Flu
x (k
W/m
2 )
water, saturated #910
water, 30C Subcooling#907water, 20 C subcooling#908water, 10C subcooling #909500ppm H3BO3, 30 CSubcooling #911500ppm H3BO3, 20 CSubcooling #912500ppm H3BO3, 10 CSubcooling #913500ppm H3BO3,Saturated #914
Figure 5-38 Boiling curves for deionized water and 500 ppm concentration boric acid solution at 500 psi (34.5 bar).
1000ppm Boric Acid, 500 psi (34.4 bar)
0
50
100
150
200
250
300
0 10 20 30 40 50
Superheat (oC)
Hea
t Flu
x (k
W/m
2 ) 30 C Subcooling#91920 C Subcooling#92010 C Subcooling#921Saturated #922
Figure 5-39 Boiling curves for tests with 1000 ppm concentration boric acid solution at 500 psi (34.5 bar).

53
10 C Subcooling, 500 psi (34.4 bar)
0
50
100
150
200
250
300
0 10 20 30
Superheat (oC)
Hea
t Flu
x (k
W/m
2 )
water, 10C subcooling# 909
1000 ppm H3BO3, 10C Subcooling #921
Figure 5-40 Effect of boric acid concentration on heat transfer at 10 C subcooling
and 500 psi pressure (34.5 bar).
2000 ppm Boric Acid, 500 psi (34.5 bar)
0
50
100
150
200
250
300
0 10 20 30 40 50
Superheat (oC)
Hea
t Flu
x (k
W/m
2 )
30 C Subcooling #92720 C Subcooling #92810 C Subcooling #929Saturated #930
Figure 5-41 Boiling curves for tests with 2000 ppm concentration boric acid solution at 500 psi (34.5 bar).

54
variation in boiling heat transfer coefficients
0
5
10
15
20
100 150 200 250 300
Heat Flux (kW/m2)
Bio
ling
Hea
t Tra
nsfe
r C
oeffi
cien
ts (k
W/m
2 oC
)
water, Saturated,500psi2000 ppm H3BO3,Saturated,500 psi
Figure 5-42 degradation of boiling heat transfer coefficients due to 2000 ppm
boric acid solution (test 930) at 500 psi (34.5 bar).
2000 ppm Boric Acid, 500 psi (34.5 bar)
0
50
100
150
200
250
300
0 10 20 30 40 50
Superheat (oC)
Hea
t Flu
x (k
W/m
2 )
water, saturated #910
water, 30C Subcooling#907water, 20 C subcooling#908water, 10C subcooling #9092000 ppm H3BO3, 30 CSubcooling #9272000 ppm H3BO3, 20 CSubcooling #9282000 ppm H3BO3, 10 CSubcooling #9292000 ppm H3BO3,Saturated #930
Figure 5-43 Boiling curves for deionized water and 2000 ppm concentration boric
acid solution at 500 psi (34.5 bar).

55
5000 ppm Boric Acid, 500 psi (34.5 bar)
0
50
100
150
200
250
300
0 10 20 30 40 50
Superheat (oC)
Hea
t Flu
x (k
W/m
2 )
30 C Subcooling #93520 C subcooling #93610 C Subcooling #937Saturated #938
Figure 5-44 Boiling curves for tests with 5000 ppm concentration boric acid
solution at 500 psi (34.5 bar).
5000 ppm Boric Acid, 500 psi (34.5 bar)
0
50
100
150
200
250
300
0 10 20 30 40 50
Superheat (oC)
Hea
t Flu
x (k
W/m
2 )
water, saturated #910
water, 30C Subcooling#907water, 20 C subcooling#908water, 10C subcooling #9095000 ppm H3BO3, 30 CSubcooling #9355000 ppm H3BO3, 20 Csubcooling #9365000 ppm H3BO3, 10 CSubcooling #9375000 ppm H3BO3,Saturated #938
Figure 5-45 Boiling curves for deionized water and 5000 ppm concentration boric acid solution at 500 psi (34.5 bar).
5.5.2 Tests with Lithium Metaborate
The Figure 5-46 shows the results from experiments 915 through 918 for the 500
ppm lithium metaborate concentration. The boiling curves vary in subcooling ranging
56
from 30 oC to saturation and indicate that the heat transfer coefficient is less affected for a
concentration level of 500 ppm. Figure 5-48, Figure 5-50, and Figure 5-53, show the
boiling test results with 1000 ppm, 2000 ppm, and 5000 ppm concentration of lithium
metaborate, respectively. These figures indicate that superheat is maximum for the
concentration level of 2000 ppm compared to the other concentrations. Figure 5-51
shows the variation in the boiling curve for saturated temperature compared to that of
deionized water.
Figure 5-52 shows the degradation of the heat transfer coefficient for same test. Observe that the heat transfer coefficient is reduced by 24.4% (heat flux = 169 kW/m2, saturated) in the presence of lithium metaborate at 2000 ppm concentration compared to deionized water. It is also interesting to note that at 5000 ppm concentration, the degradation of heat transfer is nearly the same as that of 2000 ppm concentration. Figure 5-54 shows the degradation in heat transfer coefficient for 5000 ppm concentrated lithium metaborate solution at saturated conditions compared to deionized water. For instance, the heat transfer coefficient is decreased by 23% for 5000 ppm concentration of lithium metaborate for test numbered 946 (heat flux = 169 kW/m2). This trend indicates that the increase of lithium in the coolant beyond a certain concentration does not have a significant effect on the heat transfer rate. This certain limiting lithium coolant concentration is 2000 ppm - beyond this concentration, the nucleation pattern is unchanged.

57
500 ppm Lithium Metaborate, 500 psi (34.5 bar)
0
50
100
150
200
250
300
0 10 20 30 40 50
Superheat (oC)
Hea
t Flu
x (k
W/m
2 )
30 C Subcooling #91520 C Subcooling #91610 C Subcooling #917Saturated #918
Figure 5-46 Boiling curves for tests with 500 ppm lithium metaborate solution at
pressure of 500 psi (34.5 bar).
500 ppm Lithium Metaborate, 500 psi (34.5 bar)
0
50
100
150
200
250
300
0 10 20 30 40
Superheat (oC)
Hea
t Flu
x (k
W/m
2 )
water, 20 C subcooling#908500 ppm LiBO2, 20 CSubcooling #916
Figure 5-47 Effect of boric acid concentration on heat transfer at 20oC
Subcooling condition and 500 psi pressure (34.5 bar).

58
1000 ppm Lithium Metaborate, 500 psi (34.5 bar)
0
50
100
150
200
250
300
0 10 20 30 40 50
Superheat (oC)
Hea
t Flu
x (k
W/m
2 )
30 C Subcooling #92320 C Subcooling #92410 C Subcooling #925Saturated #926
Figure 5-48 Boiling curves for tests with 1000 ppm lithium metaborate solution at
pressure of 500 psi (34.5 psi).
Saturated, 500 psi (34.5 bar)
0
50
100
150
200
250
300
0 5 10 15 20
Superheat (oC)
Hea
t Flu
x (k
W/m
2 )
water, saturated #910
1000 ppm LiBO2,Saturated #926
Figure 5-49 Effect of lithium metaborate concentration on heat transfer at saturated condition and 500 psi pressure (34.5 psi).

59
2000 ppm Lithium Metaborate, 500 psi (34.4 bar)
0
50
100
150
200
250
300
0 10 20 30 40 50
Superheat (oC)
Hea
t Flu
x(kW
/m2)
30 C Subcooling #93120 C Subcooling #93210 C Subcooling #933Saturated #934
Figure 5-50 Boiling curves for tests with 2000 ppm lithium metaborate solution at pressure of 500 psi (34.5 bar).
2000 ppm Lithium Metaborate, 500 psi (34.5 bar)
0
50
100
150
200
250
300
0 5 10 15 20
Superheat (oC)
Hea
t Flu
x(kW
/m2)
water, saturated #910 Saturated #934
Figure 5-51 Effect of lithium metaborate concentration on heat transfer at
saturated condition and 500 psi pressure (34.5 bar).

60
Variation in boiling heat transfer coefficients
0
5
10
15
20
100 150 200 250 300
Heat Flux (kW/m2)
Bio
ling
Hea
t Tra
nsfe
r C
oeffi
cien
ts (k
W/m
2 o C)
water, Saturated,500psi-#910
2000 ppm LiBO2,Saturated,500 psi-#934
Figure 5-52 degradation of boiling heat transfer coefficients in presence of lithium metaborate ( 2000 ppm) at 500 psi (34.5 bar).
5000 ppm Lithium Metaborate, 500 psi (34.5 bar)
0
50
100
150
200
250
300
0 10 20 30 40 50
Superheat (oC)
Hea
t Flu
x (k
W/m
2 )
30 CSubcooling#94320 CSubcooling#94410 CSubcooling#945Saturated#946
Figure 5-53 Boiling curves for tests with 5000 ppm lithium metaborate solution at pressure of 500 psi (34.5 bar).

61
variation in boiling heat transfer coefficients
0
5
10
15
20
100 150 200 250 300
Heat Flux (kW/m2)
Bio
ling
Hea
t Tra
nsfe
r C
oeffi
cien
ts (k
W/m
2 o C)
water, Saturated,500 psi#9105000 ppm LiBO2,Saturated,500 psi #946
Figure 5-54 degradation of boiling heat transfer coefficients in presence of lithium metaborate (5000 ppm) at 500 psi (34.5 bar).
5.6 Boiling Curves at 1000 psi Boiling tests done at 1000 psi are very significant as it approaches the pressure
typical of PWR conditions. Figure 5-55 shows the boiling curves for deionized water at 1000 psi for tests numbered 951 through 954. The boiling curves show a similar trend for all the subcooled conditions and saturated conditions as those of lower pressures. The boiling curves coincide well for lower heat fluxes indicating that heat transfer by natural convection at this higher is maintained. It can also be observed that the heat transfer coefficient decreases slightly when compared to tests done with deionized water at lower pressures. Marginal degradation of the heat transfer coefficients is explained by the nucleation pattern. It was observed that at higher test pressures, the nucleation was restricted. Due to higher pressures, the cavities which act as nucleation sites, are completely filled with liquid therefore causing resistance for the formation of new bubbles. It may be recalled that cavities, which are partially wetted, have more chance of being nucleation sites than cavities that are completely wetted [Collier and Thome 1994].

62
water, 1000 psi (68.9 bar)
0
50000
100000
150000
200000
250000
300000
0 10 20 30 40 50
Superheat (oC)
Hea
t Flu
x (W
/m2 )
Water, saturated # 954
Water, 30 C Subcooling # 951
Water, 20 C Subcooling # 952
Water, 10 C Subcooling #953
Figure 5-55 Boiling curves for deionized water at 1000 psi (68.9 bar).
Repeatability is an important concern during boiling tests. The reproducibility of results depends on following the same defined procedure for conducting the boiling tests. Boiling tests were performed in regular intervals for the same conditions in order to check the repeatability of results. Repeated pool boiling tests were performed with deionized water at 10o C subcooling. The results of test numbered 953, 983, 985 and 986 have a boiling heat transfer coefficient of 9.05 kW/m2oC, 9.5 kW/m2oC, 8.75 kW/m2oC, and 9.1 kW/m2oC for a heat flux of 238 kW/m2. The maximum boiling heat transfer coefficient was found to be 4.3% more than the average heat transfer coefficient, while the minimum was 3.8% less than the average boiling heat transfer coefficient. The deviation in results is due to the uncertainty in the measurements of temperature, voltage and current.
5.6.1 Tests with Boric Acid Soluiton
Figure 5-56 shows the boiling curves for tests numbered 958 through 961 for 500
ppm boric acid solution. It can be observed from Figure 5-57 that the influence of the boric acid solution at 500 ppm concentration is not significant (less than ??? percent). Figure 5-58 shows the boiling test results for all subcooled and saturated conditions with the 1000 ppm boric acid solution. Observe that the temperature difference between the wall and bulk fluid is higher than that of deionized water indicating that the nucleation affects the heat transfer coefficients. Figure 5-60 shows boiling curves obtained from tests numbered 975 through 978 for boric acid at a concentration of 2000 ppm.. Figure 5-61 and Figure 5-62 show the change in boiling curves of the above mentioned tests with that of deionized water. Note that the addition of boric acid to water has a degrading

63
effect on the heat transfer coefficient. Figure 5-63 displays the results of tests done with 5000 ppm concentrated boric acid.
Figure 5-64 shows the degradation in heat transfer coefficient for test numbered 992. The boiling heat transfer coefficient decreases by 23% (for q= 236 kW/m2) for the 5000 ppm concentrated boric acid solution at saturated temperature when compared to heat transfer coefficient for deionized water. The test results have thus indicated that the boiling heat transfer coefficient is significantly affected by the presence of boron at higher concentrations. The likely reason for the decrease in heat transfer coefficient is due to the observed decrease in nucleation sites. The boron particles in the solution seem to reduce the coalescence in the bubbles thereby reducing the heat transfer rate.
500 ppm Boric Acid, 1000 psi (68.9 bar)
0
50
100
150
200
250
300
0 20 40 60
Superheat (oC)
Hea
t Flu
x (k
W/m
2 ) 30 C Subcooling#95820 C Subcooling#95910 C Subcooling#960Saturated # 961
Figure 5-56 Boiling curves for tests with 500 ppm boric acid solution at pressure of 1000 psi (68.9 bar).

64
500 ppm Boric Acid, 1000 psi (68.9 bar)
0
50
100
150
200
250
300
0 10 20 30 40
Superheat (oC)
Hea
t Flu
x (k
W/m
2 )
Water, 20 C Subcooling # 952
500 H3BO3, 20 C Subcooling#959
Figure 5-57 Effect of boric acid concentration on heat transfer at 20oC subcooling
and 1000 psi pressure (68.9 bar).
1000 ppm Boric Acid, 1000 psi (68.9 bar)
0
50
100
150
200
250
300
0 10 20 30 40 50
Superheat (oC)
Hea
t Flu
x (k
W/m
2 )
30 C Subcooling #96720 C Subcooling #96810 C Subcooling #969Saturated #970
Figure 5-58 Boiling curves for tests with 1000 ppm boric acid solution at pressure
of 1000 psi (68.9 bar).

65
Water and 1000 ppm Boric Acid, 1000 psi (68.9 bar)
0
50
100
150
200
250
300
0 10 20 30 40 50
Superheat (oC)
Hea
t Flu
x (k
W/m
2 )
Water, 30 C Subcooling #9511000 ppm H3BO3, 30 CSubcooling #967
Figure 5-59 Effect of boric acid concentration on heat transfer at 30o C
subcooling and 1000 psi pressure (68.9 bar).
2000 ppm Boric Acid, 1000 psi (68.9 bar)
0
50
100
150
200
250
300
0 10 20 30 40 50
Superheat (oC)
Hea
t Flu
x (k
W/m
2 )
30 C Subcooling #97520 C Subcooling #97610 C Subcooling #977Saturated #978
Figure 5-60. Boiling curves for tests with 2000 ppm boric acid solution at
pressure of 1000 psi (68.9 bar).

66
Deionized Water and 2000 ppm Boric Acid, 1000 psi (68.9 bar)
0
50
100
150
200
250
300
0 10 20 30 40 50
Superheat (oC)
Heat
Flu
x (k
W/m
2 )Water, saturated # 954
Water, 30 C Subcooling # 951
Water, 20 C Subcooling # 952
Water, 10 C Subcooling #953
2000 H3BO3, 30 C Subcooling#975
2000 H3BO3, 20 C Subcooling#976
2000 H3BO3, 10 C Subcooling#977
2000 H3BO3, Saturated #978
Figure 5-61 Boiling curves for deionized water and 2000 ppm concentration boric
acid solution at 1000 psi (68.9 bar).
Deionized Water & 2000 ppm Boric Acid, 1000 psi (68.9 bar)
0
50
100
150
200
250
300
0 5 10 15 20 25 30
Superheat (oC)
Hea
t Flu
x (k
W/m
2 ) Water, saturated # 954
Water, 10 C Subcooling #953
2000 H3BO3, 10 C Subcooling#977
2000 H3BO3, Saturated #978
Figure 5-62 Effect of boric acid concentration (2000 ppm) on heat transfer coefficients at pressure of1000 psi (68.9 bar).

67
5000 ppm Boric Acid, 1000 psi (68.9 bar)
0
50000
100000
150000
200000
250000
300000
0 10 20 30 40 50
Superheat (oC)
Hea
t Flu
x (W
/m2 )
30 C Subcooling #98920 C Subcooling #99010 C Subcooling #991Saturated #992
Figure 5-63 Boiling curves for tests with 5000 ppm boric acid solution at pressure
of 1000 psi (68.9 bar).
Variation in boiling heat transfer coefficients, 1000 psi
0
4
8
12
16
20
100 150 200 250 300
Heat Flux (kW/m2)
Bio
ling
Hea
t Tra
nsfe
r C
oeffi
cien
ts (k
W/m
2 o C)
water,Saturated,1000 psi5000 ppm H3BO3,Saturated,1000 psi
Figure 5-64 Degradation of boiling heat transfer coefficients for 5000 ppm
concentrated boric acid solution at 1000 psi pressure (68.9 bar) and saturated condition.

68
5.6.2 Boiling Curves for Lithium Metaborate
Pool boiling test results for 500 ppm concentration lithium metaborate solution are presented in Figure 5-65. Figure 5-66 indicates the variation in superheat values for the 500 ppm lithium metaborate (LiBO2) solution relative to deionized water. The heat transfer coefficient is noted to decrease by 4.5% (heat flux = 176 kW/m2, saturated). Figure 5-67 shows the results of the boiling tests with 1000 ppm lithium metaborate solution (tests numbered 971 through 974). Here, the superheat values for the boiling curves are higher for tests with 1000 ppm lithium metaborate compared to that of the 500 ppm lithium metaborate solution. This denotes a decline in the boiling heat transfer rate for 1000 ppm lithium metaborate over the 500 lithium metaborate solution. For a heat flux value of 149 kW/m2, the heat transfer coefficient decreases from 5.7 kW/m2oC to 5.3 kW/m2oC indicating a decrease of about 6 % in the heat transfer coefficient for the1000 ppm lithium metaborate when compared with deionized water at 10oC the subcooled condition.
500 ppm Lithium Metaborate, 1000 psi (68.9 bar)
0
50
100
150
200
250
300
0 10 20 30 40 50
Superheat (oC)
Hea
t Flu
x ( k
W/m
2 )
30 C Subcooling #96320 C Subcooling #96410 C Subcooling #965Saturated # 966
Figure 5-65 Boiling curves for tests with 500 ppm lithium metaborate solution at
pressure of 1000 psi (68.9 bar).

69
Deionized water and 500 ppm Lithium Metaborate, 1000 psi (68.9 bar)
0
50
100
150
200
250
300
0 5 10 15 20 25 30
Superheat (oC)
Hea
t Flu
x ( W
/m2 )
Water, 10 C Subcooling #953
500 ppm LiB02, 10 CSubcooling #965
Figure 5-66 Effect of lithium metaborate concentration on heat transfer
coefficients at 10 oC subcooling and 1000 psi pressure (68.9 bar).
1000 ppm Lithium Metaborate, 1000 psi (68.9 bar)
0
50
100
150
200
250
300
0 10 20 30 40 50
Superheat (oC)
Hea
t Flu
x (k
W/m
2 )
30 C Subcooling #97120 C Subcooling #97210 C Subcooling #973Saturated #974
Figure 5-67 Boiling curves for tests with 1000 ppm lithium metaborate solution at
pressure of 1000 psi (68.9 bar).

70
Deionized water, 1000 psi (68.9 bar)
0
50
100
150
200
250
25 26 27 28 29 30
Superheat (oC)
Hea
t Flu
x (k
W/m
2 )1000 ppm LiBO2,10 CSubcooling #973
Water, 10 C Subcooling#953
Linear (1000 ppmLiBO2,10 C Subcooling#973)Linear (Water, 10 C Subcooling #953)
Figure 5-68 Degradation of boiling heat transfer coefficients due to 1000 ppm lithium metaborate at 10oC subcooling (68.9 bar).
2000 ppm Lithium Metaborate, 1000 psi (68.9 bar)
0
50
100
150
200
250
300
0 10 20 30 40 50
Superheat (oC)
Hea
t Flu
x (k
W/m
2 )
30 C Subcooling #97920 C Subcooling #98010 C Subcooling #981Saturated #982
Figure 5-69 Boiling curves for tests with 2000 ppm lithium metaborate solution at
pressure of 1000 psi (68.9 bar).

71
The boiling test results with 2000 ppm concentrated lithium metaborate solution are presented in Figure 5-69 . Figure 5-70 shows the boiling test results for the 2000 ppm lithium metaborate solution. Figure 5-70 and Figure 5-71 show the decrease in boiling heat transfer coefficients for the 2000 ppm concentration of lithium metaborate solution in comparison to the boiling heat transfer coefficient of deionized water. The increase in the superheat values is a direct indication of a decline in the heat transfer coefficient for the same value of heat flux. Figure 5-72 shows the degradation of heat transfer coefficient with the 2000 ppm lithium metaborate solution. The boiling transfer coefficient for deionized water is 9.39 kW/m2oC (heat flux =195.4 kW/m2, saturated). The boiling heat transfer coefficient is reduced by a value of 2.7 kW/m2oC for the 2000 ppm lithium metaborate solution when compared to the boiling heat transfer coefficient of deionized water at (heat flux = 167 kW/m2). The reduction in heat transfer coefficient is 20 % (heat flux =167 kW/m2, saturated).
Deionized water & 2000 ppm Lithium Metaborate, 1000 psi (68.9 bar)
0
50
100
150
200
250
300
0 10 20 30 40 50
Superheat (oC)
Hea
t Flu
x (k
W/m
2 )
Water, saturated # 954
Water, 30 C Subcooling #951Water, 20 C Subcooling #952Water, 10 C Subcooling#9532000 ppm LiBO2, 30 CSubcooling #9792000 ppm LiBO2, 20 CSubcooling #9802000 ppm LiBO2, 10 CSubcooling #9812000 ppm LiBO2,Saturated #982
Figure 5-70 Boiling curves for deionized water and 2000 ppm concentration lithium metaborate solution at 1000 psi (68.9 bar).

72
Deionized water & 2000 ppm Lithium Metaborate, 1000 psi (68.9 bar)
0
50
100
150
200
250
300
0 20 40
Superheat (oC)
Hea
t Flu
x (k
W/m
2 ) Water, saturated # 954
Water, 10 C Subcooling#9532000 ppm LiBO2, 10 CSubcooling #9812000 ppm LiBO2,Saturated #982
Figure 5-71 Effect of lithium metaborate concentration (2000 ppm) on heat transfer coefficients at 1000 psi pressure (68.9 bar).
variation in boiling heat transfer coefficients, 1000 psi
0
4
8
12
16
20
100 150 200 250 300
Heat Flux (kW/m2)
Bio
ling
Hea
t Tra
nsfe
r C
oeffi
cien
ts (k
W/m
2 o C)
water,Saturated,1000 psi2000 ppm LiBO2,Saturated,1000 psi
Figure 5-72 degradation in heat transfer coefficients with influence of 2000 ppm lithium metaborate solution at saturated temperature and 1000 psi pressure (68.9
bar).

73
Figure 5-73 shows the boiling curves for tests numbered 993 through 997 for all the subcooled conditions and the saturated condition. The boiling curves for the 5000 ppm lithium metaborate solution are shown in Figure 5-73 and the deviation between the saturated boiling curve with the 5000 ppm concentration solution in comparison to the boiling test done with saturated deionized water are given in Figure 5-74. Figure 5-75 shows the degradation of the boiling heat transfer coefficient for the 5000 ppm lithium metaborate solution at the 10 oC subcooled condition. It can be observed from Figure 5-75 that the boiling heat transfer coefficient decreases to value of 10.4 kW/m2oC for a heat flux of 210 W/m2. The corresponding heat transfer coefficient for deionized water is 13.9 kW/m2oC giving a reduction equal to 26 % when compared to the 5000 ppm lithium metaborate solution.
5000 ppm Lithium Metaborate, 1000 psi (68.9 bar)
0
50
100
150
200
250
300
0 10 20 30 40 50
Superheat (oC)
Hea
t Flu
x (k
W/m
2 )
30 C Subcooling #99320 C Subcooling #99410 C Subcooling #995Saturated #996
Figure 5-73 Boiling curves for tests with 5000 ppm lithium metaborate solution at
pressure of 1000 psi (68.9 bar).

74
Deionized water & 5000 ppm Lithium Metaborate, 1000 psi (68.9 bar)
0
50
100
150
200
250
300
0 5 10 15 20 25
Superheat (oC)
Hea
t Flu
x (k
W/m
2 )
Water, saturated # 954
5000 ppm LiBO2, Saturated#996
Figure 5-74 Effect of lithium metaborate concentration on heat transfer coefficients at saturation temperature and 1000 psi pressure (68.9 bar).
variation in boiling heat transfer coefficients, 1000 psi
0
4
8
12
16
20
100 150 200 250 300
Heat Flux (kW/m2)
Bio
ling
Hea
t Tra
nsfe
r C
oeffi
cien
ts (k
W/m
2 o C)
water, Saturated,1000 psi
5000 ppm LiBO2,Saturated,1000 psi
Figure 5-75 Degradation in heat transfer coefficients with influence of 5000 ppm lithium metaborate solution at saturated temperature and 1000 psi pressure (68.9
bar).

75
5.7 Formation of Deposits
Clearly concluded from the pool boiling test results is that the presence of boric acid and lithium metaborate in the coolant affects the heat transfer characteristics associated with subcooled nucleate boiling. As discussed earlier, the main reason for the occurrence of axial offset anomaly is subcooled nucleate boiling inside the core of a PWR and is observed in a PWR only after years of continuous operation As it is not pragmatic to run the boiling tests for such a long period of time, boiling tests were run continuously with higher concentrations of boron and lithium in the coolant for five days to simulate the conditions favorable for deposition of paticulates.
5.7.1 Test Procedure
The boiling test for deposits was conducted with 5000 ppm boric acid and lithium metaborate solutions at 1000 psi pressure and 10oC subcooling. The procedure employed for each test is described below:
1. Power was supplied to the bulk heater using a rheostat control. The coolant was heated and maintained at a steady state temperature of 274.2oC, which is 10oC below the saturation temperature at 1000 psi.
2. The power supplied to the test heater was increased until a heat flux of 250 kW/m2 was reached and maintained thereafter by adjustment.
3. The coolant pressure was recorded at 20 minute intervals.
4. The current through the test heater was recorded using a clamp-type ammeter at 20 minute intervals.
5. The temperature of the test heater from the four K-type thermocouples and the bulk coolant temperature were recorded every 20 minutes.
6. The entire experimental set up was keenly monitored for any sudden changes in temperature, pressure and for mechanical and failures.
7. After the test was run for 5 days, the heat flux to the deionized water was slowly decreased to zero by decreasing the power input to test heater.
8. Similarly the power supplied to bulk heater was decreased to zero in a steady process.
9. The test chamber was not disturbed in an manner so as to not disturb the test heater as it might have affected the particulate deposits.
10. After the coolant temperature reached the ambient temperature, the pressure in the test chamber was very gradually decreased to ambient pressure. Decreasing the pressure of coolant was done gradually to avoid sudden movement of coolant within test chamber which could have dislodged the particulate deposits.
11. After the coolant reached ambient conditions, it was discharged slowly through a bleed valve.

76
12. The test heater flange was unfastened from the test chamber for observation of the deposits. Care was to be taken while transporting the test heater as to not disturb the particulates deposited on the test heater.
13. The test heater surface and particulate deposits were then carefully observed using a microscope in conjunction with a camera to record the images.
14. After the visualization process, the deposits are then scraped into a tiny crucible for weighing. Care was taken to not damage the surface of the test heater. The net weight of deposits was calculated where the difference in weight of crucible before after collection yielded the net weight of particulate deposits. Because of the test heater surface irregularities, some particles settled in surface cavities.
15. The remaining deposits were then washed thoroughly with a measured quantity of acetone. The washed liquid was carefully collected in a small beaker. The advantage of using acetone for weight measurement was its unique volatile property. After the washed liquid was collected, it was kept open to the atmosphere. Due to its extreme volatile nature, acetone evaporated leaving behind the deposits. The beaker was then weighed. The difference in weights gave the weight of the deposits.
16. The above step was repeated until the net weight of deposits for a washing attempt was zero. This method was very effective as acetone has good cleaning characteristics.
17. The total weight of the deposits was obtained by summations of all the net weights obtained by direct measurement and by the acetone cleaning method.
5.7.2 Boric Acid Deposits
The variation of the heat transfer coefficient during the boiling test indicates that boron deposits have considerable effect on heat transfer characteristics. The boiling curve for the ”boron deposition test” is shown in Figure 5-76. The change in heat transfer coefficient with time is plotted in Figure 5-77.
The 5000 ppm boric acid deposition test was conducted with a constant heat flux of 250 W/m2. Observe from Figure 5-77 that the boiling heat transfer coefficient declines with increasing time. Initially, the heat transfer coefficient increased slightly until it reached a steady state. The heat transfer rate seemed to be constant for the first four hours of test and declined gradually thereafter over the remainder of the test. The decline in heat transfer rate is due to deposition of boric acid precipitates onto the test heater surface. For this deposition test, the boiling heat transfer coefficient decreases from 8.9 kW/m2oC to 7.0 kW/m2oC showing a reduction of 21% over a period of 136 hours. It can also be observed that after a running time of 80 hours, there is an increase in heat transfer coefficient. While this increase in boiling heat transfer coefficient is unexplained, it may be due particulate deposits being dislodged from the test heater surface.

77
Boric Acid Deposition Test,1000 psi
0
50000
100000
150000
200000
250000
300000
0 10 20 30 40
superheat (oC)
Hea
t Flu
x (W
/m2
)
5000 ppm H3BO3, 10subcooling, 1000 psi
Figure 5-76 Boiling curve for 5000 ppm boric acid solution at 1000 psi (68.9 bar).
Effect of depositon on heat transfer coefficient
60006500700075008000850090009500
0 20 40 60 80 100 120 140 160
Boiling Test Running Time (hours)
Hea
t Tra
nsfe
r Coe
ffici
ient
(W
/m2
o C)
5000 ppm boricacid,10 Csubcooling,1000 psi
Figure 5-77 Effect of boron deposits on heat transfer coefficient (68.9 bar).

78
The test heater was observed using a Canon high resolution camera with 400X magnification. This camera had an optical lens fitted to it and was mounted on a stand. As the surface of the test heater is cylindrical, only a portion of surface can be clearly viewed through the microscope at a time. Images were taken at the center of the boiling region, and at the beginning and end of the boiling region, to get information concerning the particulate deposit material density. Figure 5-78 shows a photomicrograph of test heater at the end of the boiling region on the test heater. It may be recalled that the actual length of heater filament is only one inch and away from the flange end. The boron deposits (white in color) can be clearly observed in Figure 5-78. The deposited particles seem to be scattered along the surface of the heater in the valleys on the surface. The test heater surface of the can also be observed at 400X magnification in Figure 5-78 where the imperfections of the surface are clearly visible. Figure 5-79 shows the deposited particle size distribution associated with Figure 5-78. The average size of the particle was found to be 2.62 microns (1micron =10-6m) which is based on particle area. Figure 5-80 and Figure 5-82 show the photomicrographs of the test heater at the boiling region. It is evident that the deposits are higher in concentration which confirms the reason for degradation in heat transfer rate. Figure 5-81 and Figure 5-83 show the particle size distribution characteristics associated with Figure 5-80 and Figure 5-82, respectively. It can be observed that the maximum number of particles lie in size range of 5.96 sq microns. The particle size is presented by average area covered by the particle as it affects the deposits by covering the nucleation sites. It appears that most of the particulates are separate and scattered over heater surface. However some of the particulates seem to be form clusters. The average area of the particulate is 8.2 square microns at the boiling region.
Figure 5-78 Photomicrograph of test heater adjacent to boiling region at 400X
magnification for 5000 ppm boric acid deposition test.

79
Boron deposits particle distribution at end of boiling region
0
20
40
60
80
100
2.98 5.96 8.94 11.9 14.9 17.9 20.9
Particle area (sq microns)
num
ber o
f par
ticle
s
boron deposits atend of boiling region
Figure 5-79 Particle size distribution of the deposited particles at end of
boiling region (total particle count = 260) for the 5000 ppm boric acid deposition test..
Figure 5-80 photomicrograph of boron deposits at boiling region on test heater
for the 5000 ppm boric acid deposition test.

80
Boric Acid deposits distribution
0
50
100
150
200
250
300
2.98 5.96 8.94 11.9 14.9 17.9 20.9 23.8
individual deposition particle area ( sq microns)
num
ber o
f par
ticle
s
boiling region-01
Figure 5-81 Particle size distribution for boric acid deposits for Figure 5-80, 5000
ppm boric acid deposition test (68.9 bar).
Figure 5-82 Photomicrograph of boron deposits on test heater at 400X
magnification for the 5000 ppm boric acid deposition test (68.9 bar).

81
Boric acid deposits distribution
0
50
100
150
200
250
300
2.98 5.96 8.94 11.92 14.9 17.88 20.86 23.84individual deposition particle area (sq
microns)
Num
ber o
f par
ticle
s
boiling region-02
Figure 5-83 Particle size distribution for 5000 ppm boric acid deposits for Figure
5-82 (total particle count = 723) . The previously shown photomicrographs clearly show that boron particles settled
on the surface of the test heater. Figure 5-80 shows the deposited boron particles on the surface of the test heater at the boiling region - the surface area over the 1.0 inch test heater filament. This indicates that boron deposition occurs due to subcooled nucleate boiling. It is also to be noted that the surface roughness plays a significant role in deposition of boron particles. Figure 5-82 indicates that density of deposited particulates is higher in the valleys of the surfaces. The possible reason for higher deposition in the valleys is due to higher nucleation at valleys in the surface. Previous studies have indicated that nucleation is higher in the cavities and troughs of the hot surface. The particle size of the deposits was calculated using Sigmascan. Sigmascan Pro (Systat Software) is an image analysis software tool. Using the threshold intensity feature of Sigmascan, a number of particles can be counted. This feature is based on the principle of difference in intensity of pixels in a image. The images obtained from the Canon high resolution camera setup have been calibrated and each pixel on the image corresponds to 2.98 square microns. Using this pixel conversion factor, the size of the particles and associated statistical data has been obtained.
Figure 5-84 shows a photomicrograph of the test heater surface outside the one –inch long boiling region. The numbers of deposited particulates are remarkably less than deposit rates at the boiling region. The lesser density of deposits strongly suggests that the deposition rates are directly dependent on nucleation rates. Figure 5-85 shows the particulate distribution associated with Figure 5-84. The number of particles with area in the 2.98 sq micron bracket is eighteen, whereas in Figure 5-84 there are 162 particles in the boiling region. Recapping for the 5000 ppm boric acid solution deposition test, a

82
particulate deposit weight of 12.2mg was removed from the heated test surface and that the heat transfer coefficient was degraded by 22% at 10oC subcooling
Figure 5-84 Photomicrograph of test heater outside the boiling region (400X
magnification) for the 5000 ppm boric acid deposition test (68.9 bar).
boron deposits at transistion region
0
5
10
15
20
2.98 5.96 8.94 11.92 14.9 17.88
individual Particle area (sq microns)
num
ber o
f par
ticle
s
boron depositsbeginning boiling region
Figure 5-85 particle size distribution for boric acid deposits for Figure 5-84 (total
particle count = 65) for 5000 ppm boron deposition test.

83
5.7.3 Lithium Metaborate
Boiling test for lithium metaborate deposition was conducted with a 5000 ppm concentration solution. The procedure employed was similar to that of the boric acid boiling particulate deposition test described in the previous section. The depositon test conducted with 5000 ppm lithium metaborate solution has resulted in failure of the test heater due to apparent high surface temperature achieved. Figure 5-86 Photograph of the failed test heater for the 5000 ppm lithium metaborate particulate deposition test showing the damaged Zr-4 cladding, and although not evident from the photograph, a large amount of particulate lithium deposits.
Figure 5-86 Photograph of the failed test heater for the 5000 ppm lithium
metaborate particulate deposition test (68.9 bar). The boiling test for deposition of the 5000 ppm concentration lithium metaborate
solution was conducted over a time of 5 days similar to that of the boric acid deposition test. Figure 5-87 shows the degradation of the boiling heat transfer coefficient with time where heat transfer coefficient is not affected significantly for the first 300 minutes of time but thereafter decreases at a uniform rate from 7.8 kW/m2oC to 5.5 kW/m2oC (nearly 30% reduction) over a period of 140 hours. The degradation in heat transfer coefficient is due to the apparent constant deposition rate of lithium metaborate.
The test heater was observed using a Zeiss LSM5 Pascal microscope located in the Department of Biology at Kansas State University. The LSM 5 is a laser scanning confocal microscope capable of exciting fluorescent markers with laser lines of 458/488/514/543/633 nm. Figure 5-88 shows a photomicrograph of the test heater after the boiling test with the 5000 ppm concentrated lithium metaborate solution.

84
Effect of deposition on heat transfer coefficient
5000
5500
6000
6500
7000
7500
8000
0 40 80 120 160
Boiling Test Time (hours)
Hea
t Tra
nsfe
r Coe
ffic
ient
(W
/m2o
C)
5000 ppm LithiumMetaborate, 10 Csubcooling,1000 psi
Figure 5-87 Degradation of heat transfer coefficient with boiling test time for 5000
ppm concentration Lithium Metaborate solution
Figure 5-88 Photomicrograph of test heater with deposits of precipitate of 5000
ppm lithium metaborate at 600X magnification (68.9 bar). Figure 5-88 shows the lithium metaborate deposits on the test heater surface
where the concentration of deposits is high at the center of the boiling region surface. Figure 5-89 shows a part of the image captured by the microscope of the boiling region at a magnification of 600X. The microscope scans the specimen line by line to complete an entire picture of the specimen. Figure 5-89 shows the image of test heater surface captured in one scan. The deposits appear to be clusters of tiny particulates. Unlike boron deposits, the lithium metabaorate deposits are smaller in size but higher in density.

85
Lithium metaborate particulates appear to deposit in random clumps as seen in Figure 5-91.
Figure 5-90 shows the particulate size distribution for lithium metaborate deposits. The size of the particulates was calculated by analyzing the photomicrographs in a similar method to that of the boric acid photomicrographs. The results reveal that most of the particulates lie in the size range of 0-3 sq microns. It can also be observed that the size of particles is relatively smaller than that of the boric acid deposits. The average size of particulate material was found to be 5.8 sq microns. However, particulates with area greater than 15 microns are higher when compared to boric acid deposits indicating that some of the particulates combine to form a clusters. Figure 5-91 shows another image taken from the Zeiss LSM5 Pascal microscope at the boiling region with a lesser magnification of 100X where the deposits of lithium metborate precipitate are observed to have settled on the surface of test heater. This image shows again that the deposits are formed in clusters of small individual particles. It may be recalled that the bubble formation occurred in odd clumps for the 5000 ppm lithium metaborate solution. The reason for these odd clumps in nucleation is explained by the distribution pattern for the lithium metaborate deposits.
Figure 5-89 Photomicrograph of test heater with 5000 ppm concentration solution
lithium metaborate deposits at magnification of 600X (68.9 bar).

86
Lithium metaborate deposits distribution
0
50
100
150
200
250
300
0.9 3.6 6.3 9 11.7 14.4
individual deposition particle area ( sq microns)
num
ber o
f par
ticle
s
boiling region
Figure 5-90 Particulate size distribution of lithium metaborate deposits on test
heater for total particle count of 1326. Figure 5-92 shows a photomicrograph of the test heater taken away from the
boiling surface region of the test heater. The density of deposits is less compared to the density of deposits at boiling region. However, there is minimal nucleation occurring at the transition region between the boiling and non boiling region due to heat transfer along the test heater by conduction. The reduction in heat transfer in the presence of lithium metaborate can be explained by the observed decrease in nucleation rates apparently due to the particulate deposition.
5.7.4 Nucleation
A high speed camera was used to capture the nucleation at the test heater surface. The videos were taken using 16mm Kodak Hawk Eye Surveillance film processed at the Yale film Studio in California (Yale Film and Video 2006). The boiling images were captured for tests with deionized water and different concentrations of boric acid and lithium metaborate. The processed films were later viewed using a Howell 16mm film projector Model 2580 (Howell 1985. Observations from viewing the nucleation films revealed the variation in bubble behavior. It was found that nucleation was smooth for deionized water with a significant number of bubbles. Figure 5-94 shows the bubble formation pattern for deionized water with a relatively high heat flux of 240 kW/m2. Figure 5-93 shows the image captured on the film taken for a boiling test with deionized water at 10o C subcooling, 1000 psi bulk fluid pressure, and 150 kW/m2 heat flux. It has been observed with increasing heat flux that the bubble density increases along with the combining rate of the bubbles upon leaving the heated surface. In other words, the bubbles seem to be collapsing in lesser time when compared with the bubble collapsing time for 100 psi. Figure 5-93 and Figure 5-94 were captured at a speed of 500 frames per

87
second. Figure 5-94 shows columns of bubbles indicating that the nucleation rate is very high and coalescence of the bubbles leads to the formation of columns of bubbles which appear to be leaving the heater surface uniformly in all directions.
Figure 5-91 Photomicrograph of test heater after the 5000 ppm concentyration
lithium metaborate boiling test at magnification of 100X (68.9 bar).
Figure 5-92 Photomicrograph of test heater after the 5000 ppm lithium
metaborate boiling deposition test at edge of boiling region at magnification of 600X (68.9 bar).

88
Figure 5-93 Visual image of nucleation for deionized water at 1000 psi (68.9 bar).
Figure 5-94 Image of bubbles above test heater surface at 240 kW/m2 heat flux
for deionized water at 20X magnification (pressure = ?)

89
Images were captured at a higher speed (frame rate) using the HYCAM high speed camera. Figure 5-95 shows an image taken at 6000 half frames/sec speed for a boiling test with deionized water where the heat flux is 240 kW/m2. Figure 5-95 has the same test conditions as Figure 5-94, but much higher frame rate or speed. It is observed that this higher flux, the nucleation rate is so high that at the slower frame rate, the bubbles seem to leave the surface in clusters, but in fact, they are individual bubbles leaving heater surface with an average bubble size measured to be 1/16th inch in diameter. Also, observation from Figure 5-95 reveals that the bubbles are mostly spherical in shape and seem to be nucleating uniformly.
Similar to high-speed images taken with deionized water, nucleation high-speed film images were captured for the boiling test with 5000 ppm concentration boric acid solution at 1000 psi (68.9 bar). Observations of the high-speed film reveals that bubble density is less than with deionized water. The delay time between the collapsing of an old bubble and the growth of a new bubble was found to be 0.042 seconds whereas the value for deionized water was found to be 0.036 seconds. The delay time for 5000 ppm lithium metaborate was 0.045 seconds. Figure 5-96 shows the nucleation image captured at 3000 fps for 5000 ppm concentration boric acid. Note that the number of bubbles is relatively few compared to that of deionized water at the same conditions indicating the influence of boric acid deposition on the surface of the test heater.
Figure 5-95 bubbles captured at speed of 3000 fps, 10oC subcooled and
1000 psi for at 20X magnification Figure 5-97 shows the nucleation image captured at 3000 fps for the boiling test
with 5000 ppm concentration lithium metaborate solution. It is clearly evident from the figure that the number of bubbles is less than those of deionized water showing a reduced bubble density. The bubble density for lithium metaborate can be extrapolated based on images taken at the higher frame rate speed. The bubble density for lithium metaborate solution was found to be approximately 1406 bubbles per sq cm (viewing area) based on

90
the data collected from the nucleation images. The values can be considered for comparison. Similar approximations have revealed the bubble density was 1968 per sqcm for 5000 ppm boric acid and 1406 per sq cm for deionized water. These approximations are based on a heat flux value of 200 kW/m2. The analysis of images obtained from high the speed camera indicate that nucleation is more uniform for deionized water and therefore leads to a better boiling heat transfer rate. In comparison, the bubble behavior of boric acid seems to indicate bubbles of a smaller size and less uniform indicating that boric acid deposits affect the nucleation by reducing the nucleation sites which thereby lead to a reduction in heat transfer coefficient. Results for lithium metaborate revealed a much smaller number of bubbles, but the relative size of the bubbles was bigger compared to that of deionized water. Furthermore, for the lithium metaborate solution, the generation of bubbles was random in nature and seemed to be occurring in clumps. This could be possibly be explained by behavior of lithium metaborate deposits to form clusters thereby completely covering the nucleation sites. The deposition images of lithium metaborate revealed that the deposition occurred in patches on the heater surface. Figure 5-97 shows bubbles leaving the surface of test heater for the boiling test with 5000 ppm lithium metaborate acid solution. Figure 5-97 was taken at 6000 half frames per minute speed which implies that the picture was captured in a time frame of little less than 1/100th of a second. It can be observed in Figure 5-97 that there are a fewer number of bubbles indicating that the nucleation rate has significantly degraded in the presence of lithium metaborate.
Figure 5-96 Picture of nucleation for 5000 ppm boric acid solution taken at 3000
fps and at 20X magnification.

91
Figure 5-97 Picture of nucleation for 5000 ppm lithium metaborate solution taken
at 3000 fps and at 20X magnification.

92
6 ANALYSIS OF RESULTS The factors affecting the heat transfer coefficient under the experimental nucleate
pool boiling conditions are discussed in this chapter. The boiling test results obtained are evaluated and the effect of various parameters affecting the boiling heat transfer coefficient are discussed.
6.1 Effect of Coolant Concentration Evaluation of the boiling test results have revealed that the presence of boric acid
and lithium metaborate in deionized water affect the boiling heat transfer coefficient by causing a resistance to the heat transfer between the heater and the bulk liquid. The details are discussed below.
6.1.1 Effect of Boric Acid
The evaluation of boiling tests performed at bulk fluid pressures of 100 psi, 200 psi, 500 psi and 1000 psi reveal that the boiling heat transfer coefficient decreases with increasing boric acid concentration in the bulk fluid (coolant). Increased resistance to uniform nucleation caused by the boric acid solution likely explains the decrease in heat transfer rate. The nucleation that occurs during the boiling process leads to the formation of boric acid deposits on the heater surface thereby creating a layer of resistance between the heater and bulk fluid. The photomicrographs taken after the boiling test with 5000 ppm concentration boric acid confirm the presence of boron particulates on the test heater. The effect of varying the boric acid concentration in deionized water on the heat transfer coefficient is shown in Figure 6-1 where the bulk fluid pressure is 1000 psi in conjunction with a saturation temperature of 284.4oC. Even though there is a decrease in pool boiling heat transfer coefficient for 500 ppm concentration boric acid over that of deionized water, the decrease is not significant. The heat transfer coefficient was reduced by 4.9% at a heat flux of 236 kW/m2 when compared to the pool boiling heat transfer coefficient of 14.7 kW/m2oC for deionized water. However, for 1000 ppm concentration of boric acid, the decrease in heat transfer coefficient is considerable. For a heat flux of 236 kW/m2, the heat transfer coefficient decreased by 9% to a value of 13.4 kW/m2.
The pool boiling heat transfer coefficients for 2000 ppm and 5000 ppm concentration solutions of boric acid at a heat flux of 236 kW/m2 are 11.9 kW/m2 and 11.4 kW/m2, respectively. It can be observed that the pool boiling heat transfer coefficient is lowest for coolant with a 5000 ppm concentration of boric acid. Figure 6-2 shows the degradation of the pool boiling heat transfer coefficient with increasing boric acid concentration. Also note from Figure 6-2 that the boiling heat transfer coefficient decreases steadily up to a concentration of about 2000 ppm. The rate of decrease in the heat transfer coefficient reduces with concentrations of boric acid greater than 2000 ppm indicating that further addition of boric acid to the solution does not significantly affect the heat transfer rate.

93
variation in heat transfer coefficients, 1000 psi
4000
8000
12000
16000
100000 150000 200000 250000 300000
Heat Flux (W/m2)
Bio
ling
Hea
t Tra
nsfe
r C
oeffi
cien
ts (W
/m2 o C
)
water, Saturated,1000psi-test 954
2000 ppm H3BO3,Saturated,1000 psi-978
5000 ppm H3BO3,Saturated,1000 psi-992
500 ppmH3BO3,Saturated,1000psi-9611000 ppm H3BO3,Saturated, 1000 psi-970
Figure 6-1 Degradation of pool boiling heat transfer coefficients with
variation of coolant concentration (boric acid as additive).
Effect of boric acid concentration on pool boiling heat transfer coefficients
0
5
10
15
20
25
0 1000 2000 3000 4000 5000 6000
concentration of boric acid solution in water ( ppm)
Deg
rada
tion
of p
ool
boili
ng h
eat t
rans
fer
coef
ficie
nts
(%)
for q=236 kW/m2, 1000psi , saturated
Figure 6-2 Degradation of pool boiling heat transfer coefficients of boric acid solution relative to deionized water.

94
6.1.2 Effect of Lithium Metaborate
The evaluation of the boiling curves obtained from tests with different concentrations of lithium metaborate indicates a similar trend as with boric acid. The pool boiling heat transfer coefficients decrease with increasing concentration of lithium metaborate in deionized water. However, the reduction rate of the pool boiling heat transfer coefficient for lithium metaborate is slightly different from that of boric acid. Changing the bulk fluid pressure does not have a significant effect on heat transfer rate and is shown in Figure 6-3 under different concentrations of lithium metaborate solution. Observed from Figure 6-3 that the pool boiling heat transfer coefficient decreases with increasing concentration of the lithium metaborate solution. It is also interesting to note that the change in heat transfer coefficient is not significant for those boiling tests with 2000 ppm and 5000 ppm concentrations. This indicates that upon further addition of lithium to deionized water, the variation in boiling heat transfer coefficient will not be significant.
Figure 6-4 shows the percentage change in the pool boiling heat transfer coefficient for varying concentration of lithium metaborate for the boiling tests done at a coolant pressure of 1000 psi and at asaturation temperature of 284.4 C. The boiling heat transfer coefficient for deionized water at a heat flux of 236 kW/m2 is 14.6 kW/m2oC at the saturation temperature of the bulk fluid.. The pool boiling heat transfer coefficient shows a reduction of 6.6%, 12%, 20.2% and 24.9% for 500 ppm, 1000 ppm, 2000 ppm and 5000 ppm concentration of lithium metaborate solution, respectively where the bulk fluid is saturated temperature. In comparison with boric acid, it was found that lithium metaborate has a greater influence on the pool boiling heat transfer rate than boric acid as seen from Figure 6-4 and Figure 6-2. This is consistent with the observed nucleation and deposition patterns for associated with the boric acid and lithium metaborate solutions. Recall that the lithium metaborate deposits occurred in clusters and had a higher deposition rate than the boric acid deposits which explains the higher degradation of pool boiling heat transfer. Figure 6-5 shows a comparison of the effects of boron and lithium on the pool boiling heat transfer rate where it can be observed that the addition of lithium metaborate has resulted in a higher degradation of heat transfer rate relative to the addition of boric acid.
6.2 Effect of Subcooling With increasing subcooling of bulk fluid, the pool boiling heat transfer coefficient
decrease as seen in Figure 5-1 andFigure 5-14. Additionally, Figure 5-36 and Figure 5-55 show that the boiling heat transfer coefficient decreases with increasing level of subcooling from 10 oC to 30 oC. The boiling heat transfer coefficient was higher for tests done at saturated temperature because the onset of nucleate boiling (ONB) occurs at a lower heat flux for those boiling tests conducted at saturation pressure. The evaluation of boiling the tests reveal that the pool boiling heat transfer rate are highest when the temperature gradient between hot surface and coolant is a minimum. Figure 6-7 shows the degradation in the pool boiling heat transfer coefficient with increasing the bulk fluid

95
subcooling. The ordinate in the Figure 6-7 indicates the heat transfer ratio (saturationα
α ),
which is the ratio of
variation in heat transfer coefficients, 1000 psi
4000
8000
12000
16000
100000 150000 200000 250000 300000
Heat Flux (W/m2)
Bio
ling
Hea
t Tra
nsfe
r C
oeffi
cien
ts (W
/m2 o C
)water, Saturated,1000psi-954
2000 ppm LiBO2,Saturated,1000 psi-982
5000 ppm LiBO2,Saturated,1000 psi-996
500 ppm LiBO2,Saturated,1000psi-9661000 ppm LiBO2,Saturated, 1000 psi-974
Figure 6-3 Degradation of pool boiling heat transfer coefficients with variation of
coolant concentration (lithium metaborate as additive).
Effect of lithium metaborate concentration on pool boiling heat transfer coefficients
05
1015202530
0 1000 2000 3000 4000 5000 6000
concentration of lithium metaborate solution in water
(ppm)
Deg
rada
tion
of p
ool
boili
ng h
eat t
rans
fer
coef
ficie
nts
(%)
for q=236 kW/m2, 1000psi , saturated
Figure 6-4 Degradation of pool boiling heat transfer coefficients of lithium
metaborate solution relative to deionized water.

96
Effect of coolant concentration on pool boiling heat transfer coefficients
0
5
10
15
20
25
30
0 1000 2000 3000 4000 5000 6000
concentration of coolant ( ppm)
Deg
rada
tion
of p
ool
boili
ng h
eat t
rans
fer
coef
ficie
nts
(%)
Boric acid, 1000 psi ,saturated Lithium metaborate, 1000psi , saturated
Figure 6-5 Comparison of the effect of boron and lithium concentration on pool
boiling heat transfer rates.
Effect of bulk subcooling on pool boiling heat transfer (1000 psi)
0
0.2
0.4
0.6
0.8
1
0 10 20 30 40
bulk subcooling (Tsat- Twall) (oC)
Hea
t Tra
nsfe
r Rat
io
(hsu
bcoo
led/
h sat
urat
ion)
water5000 boron
Figure 6-6 Effect of bulk subcooling on pool boiling heat transfer.

97
the boiling heat transfer coefficient at any subcooling to the boiling heat transfer coefficient at saturation temperature. Observe that with increasing degree of subcooling, the heat transfer coefficient decreases.
6.3 Effect of Pressure
The increase of pressure does not have a significant effect on the heat transfer coefficient. However, note from Figure 6-7 that increasing bulk fluid pressure, while maintaining a fixed heat flux, reduces the nucleation rate consequently decreasing the pool boiling heat transfer rate. This is due to the greater external fluid pressure on the bubbles rising from the heater surface. In other words, the heat flux required for nucleation to occur increases with increasing pressure. The reduction in heat transfer coefficient can be also be explained by the possibility of active nucleation cavities being completely filled with coolant thereby limiting bubble formation in the cavity. The lukelyhood of a new bubble nucleating is high in semi –wet cavities and low in fully–wet cavities. Tests with varying concentrations of boric acid and lithium metaborate solutions show slight degradation of the heat transfer coefficient with increasing pressure. For a change in system pressure from 200 psi to 1000 psi, the boiling heat transfer coefficient decreases slightly from 4.7 kW/m2C to 4.3 kW/m2C for a 5000 ppm concentration boric acid solution. For boiling tests with a 5000 ppm concentration of lithium metaborate, the heat transfer coefficient showed a slight degradation from 4.6 kW/m2C to 4.1 kW/m2C for a change of coolant fluid pressure from 200 psi to 1000 psi, respectively.
Effect of bulk fluid pressure
2000
2500
3000
3500
4000
4500
5000
100000 125000 150000 175000 200000 225000 250000
Heat Flux (W/m2)
Boi
ling
Hea
t Tra
nsfe
r C
oeffi
cien
t W/m
2oC
)
water, 30 subcooling, 1000psi-951
water, 30 subcooling,500 psi-901water, 30 subcooling,200 psi-801water, 30 subcooling,100 psi-705
Figure 6-7 Effect of pressure on pool boiling heat transfer coefficient.

98
6.4 Analysis of Particulate Deposits
The photomicrographs of the boric acid deposits reveal that the particulate deposits were scattered over the entire surface above the heating element (nucleation region of the test heater). The total weight of the boric acid deposits was found to be 12mg for a boiling test with 5000 ppm boric acid solution at 1000 psi pressure and 10oC bulk subcooling. The analysis of this boric acid deposition test indicates that significant deposits are formed on the test heater which leads to a decrease in heat transfer coefficient over time. The average number of deposition particles was found to be 742 per sq mm for the 5000 ppm boric acid solution test. The increase in pool boiling heat transfer coefficient during the first few hours of the test (Figure 5-77) result from the deposits serving as heat transfer “fins” augmenting the heat transfer. Afterwards, the heat transfer coefficient decreases uniformly with the exception of 80 hours where a fraction of the boron deposits have been apparently dislodged from the heater surface. The deposition rate however may have reached a saturation or steady state condition after 100 hours as the change in the pool boiling heat transfer coefficient appears insignificant after a time of 110 hours.
Deposits of lithium metaborate reveal that deposits of this material are more dense in particle number than that of lithium metaborate where the deposits seem to form clusters of cohesive particles. The total weight of the deposits from the lithium metaborate test was found to be 22mg for 5000 ppm lithium metaborate concentration at 1000 psi and 10oC subcooling. As seen in Figure 5-91 the lithium metaborate deposits occur in patches which leads to irregular nucleation patterns. The average number of deposition particles was found to be 1021 particles per sq. mm. From the test results, it appears that the lithium metoborate enhances the deposition rate of boron onto the Zr-clad test heater. The degradation of heat transfer coefficient in the presence of lithium metaborate is significantly higher than that of boric acid. It can be concluded that the higher deposition rate in the presence of lithium metaborate is cause for greater reduction of heat transfer rates.
6.5 Analysis of Bubble Growth Behavior
Observations from the visual recordings reveal that nucleation occurs in a uniform manner for deionized water. The bubble size obtained from nucleation images varied from 0.8mm to 2.5mm in diameter for a heat flux of 150 kW/m2. The visual recordings of the nucleation obtained for boric acid solution reveal that nucleation is less uniform. The bubble size for boiling tests with 5000 ppm boric acid solution obtained from the nucleation images varied from 0.6mm to 2mm in diameter for a heat flux of 150 kW/m2. The analysis of nucleation recordings for tests with lithium metaborate revealed that the nucleation occurred in a non-uniform and sporadic manner. The bubbles occurred in odd clumps indicating a strong presence of lithium metaborate deposits on the test heater surface. The bubble size varied from 0.6mm to 3mm for a heat flux of 150 kW/m2. The larger size of bubbles in the case of lithium metaborate is due to the bubbles combining with each other. However, as explained in nucleation results section of this report, the nucleation density is lower with both the boric acid and lithium metaborate coolant solutions than deionized water accounting for degradation of boiling heat transfer rates. It is the variation in nucleation patterns that explains the change in heat transfer rate for

99
the boric acid and lithium metaborate solutions. As explained in nucleation results, the coolant concentration affects the nucleation process by decreasing the nucleation densities. For 5000 ppm boric acid, the nucleation densities decreased by 20% when compared with deionized water and in presence of 5000 ppm lithium metaborate solution, the number of bubbles decreased by 38%.

100
7 CONCLUSIONS This experimental investigation generated a data base for subcooled pool boiling
heat transfer coefficients on Zr-4 clad heater rods for coolants with varying concentration of boron and lithium. The generated empirical data includes the effect of bulk subcooling, bulk fluid pressure, heat flux and coolant concentration and is useful for better understanding of axial offset anomaly (AOA) phenomenon in PWR power nuclear reactors.
Analysis of the results obtained from the investigation reveal that the increase of boric acid and lithium metaborate solution concentration results in the degradation of the boiling heat transfer coefficient. The boiling heat transfer coefficient was found to be slightly lower in the presence of lithium than with boron. The degradation in the heat transfer coefficient, relative to that of deionized water, was about 24% for boron and about 27% for lithium at a coolant concentration of 5000 ppm, respectively. The pool boiling tests showed a consistent decline in boiling heat transfer rate with increasing degree of subcooling. The experimental investigation revealed that the system pressure did not have a significant effect on the pool boiling heat transfer coefficient.
The inspection of the electrical test heater clad with Zr-4, revealed the formation of particulate deposits on the surface after undergoing subcooled nucleate boiling for five days with 5000 ppm concentrations of boric acid and lithium metaborate. The formation of deposits on the heater surface confirms that the precipitation of lithiated compunds like lithium metaborate on the test heater occurs during subcooled nucleate boiling. A visual recording of the nucleation was obtained at subcooled boiling conditions with varying concentrations of boron and lithium. The image analysis of the deposits reveal that the boron deposits are scattered and less dense than the deposits of lithium. The greater deposition quantity of lithium also explains the reason for its greater effect on the boiling heat transfer coefficient. The experimental data generated in this investigation contributes to the understanding of AOA.revealing that the deposition of boron and lithium precipates is a factor in determining the heat transfer rate from the surface of a Zr-4 clad fuel element. The influence that the particulate boron and lithium metaborate precipitates have after a 5 day test at 5000 ppm concentration and 1000 psi operating pressure are 21% and 30%, respectively.

101
REFERENCES 1. Collier, John G; Thome, John R., 1994, ’Convective Boiling and Condensation’,
Oxford University Press, ISBN-0-19-856282-9
2. Fenton, Donald: Shultis, J. Kenneth, 2003, Annual Technical Progress Report, NEER Grant: DE-FG07-01lD14111, US Dept. of Energy, Idaho Falls, ID.
3. Kamoshida, Junji; Isshiki, Naotsugu, 1994, ‘Heat transfer to deionized water and deionized water/lithium halide salt solutions in nucleate pool boiling,’ Proceedings of the International Absorption Heat Pump Conference: p 501-507.
4. Muller-Steinhagen, H; Jamialahmadi, M, 1990, ‘Scale formation during boiling. The effects of heat flux and CaSO4 concentration,’ Proceedings of ASME Winter Annual Meeting, Paper 90-WA/HT-3.
5. Zhao,Yaohua; Tsuruta, Takaharu, 2002,’Prediction of bubble behavior in subcooled pool boiling based on microlayer model,’ JSME international journal, series B, vol 45, 2002.
6. Schnelle, Jay, 2002; ‘Experimental investigation of aqueous glycol mixtures in pool boiling on smooth and enhanced surfaces,’ MS Thesis, KSU.
7. Vleet, R J Van, 1985, ‘A Study of the initiation of subcooled boiling during power transients,’ PhD Dissertation, KSU.
8. Sachdeva, R.C, 2001, ‘Fundamentals of Engineering Heat and Mass Transfer,’ New Age international Publishers, ISBN:81-224-0076-0.
9. Loftness, Robert L., 1964, ‘Nuclear Power Plants,’ D Van Nostrand Company Publications. pp: 127-128.
10. Konya, Mark J; Bryant, Kenneth R;Kock, Keith P;Hopkins, David L; Hughes, Garry A;Irwin, Randall J., 1993, ‘Power distribution changes brought by subcooled nucleate pool boiling at callaway power plant,’ Proceedings of ASME/JSME Nuclear Engineering Joint Conference, pp: 281-287.
11. Frattini, P.L; Blok, J.;Chauffriat,S.; Sawicki,J. and Riddle,J., 2001, ‘Axial offset anomaly:coupling PWR primary chemistry with core design,’ Journal of Nuclear Energy, Volume 40, pp: 123-135.
12. Nero, Anthony V., 1979, ‘A Guidebook to Nuclear Reactors,’ University of California Press, ISBN 0-520-03482-1
13. Visual Instrumentation Corporation, 2003, ‘Hycam Instruction Manual for 16mm High Speed Motion Picture Camera Model 41-0005,’ Redlake Corp., Lancaster, CA.
14. Incropera, Frank P.; Dewitt, David P, 2001 ‘Fundamentals of Heat and Mass Transfer,’ John Wiley Publications, ISBN-9814-12-666-7
15. Jamialahmadi, M.; Mueller –Steinhagen, H.;1991, “Reduction of calcium sulfate scale formation during nucleate boiling addition of EDTA”, Journal of Heat Transfer Engineering, Volume 12, Issue 4 , pp: 19-26

102
16. Hamilton, R.C, 2000, ’Operation and Maintenance Manual 23 kW DC Power Supply’, Stern Laboratories Inc., Ontario, Canada.
17. Tong, L.S.; Weisman, J; 1970, ’Thermal Analysis of Pressurized Water Reactors,’ American Nuclear Society, La Grange Park, IL.
18. Omega, “User’s guide to DP25-S Strain Gage Panel Meter”, Omega Technology Company, Stamford, CT.

103
APPENDIX A
A.1 Program for Data Reduction in FORTRAN PROGRAM PBDATA PARAMETER (pi=3.141593) PARAMETER (twopi=2*pi) COMMON/XDATA/idnum,idate,isurf,icomp(5),frac(5),npts,iunits, & volts(40),amps(40),P(40),Tb(2,40),Tc(4,40),Te(4,40) COMMON/XOUTP/delt(40),Qloss(40),alpha(40),Twall(40),flux(40), & TCvar1(40),TCvar2(40) CHARACTER*20 inpfil, datfil, sdffil DATA jin/1/,jinp/2/,jdat/3/,jsdf/4/,jban/5/ OPEN(jin,FILE='test.inp',STATUS='OLD') OPEN(jban,FILE='pbdata.txt',STATUS='UNKNOWN') C--- Read number of data files to be procesed READ(jin,10) 10 FORMAT( ) READ(jin,10) READ(jin,15) nfiles 15 FORMAT(3X,I3) READ(jin,10) C*************** Begin BIG loop to process each data file DO 900 IFILE=1,nfiles READ(jin,20) inpfil, datfil, sdffil 20 FORMAT(3A20) WRITE(*,25) inpfil 25 FORMAT(/,10X,'Begin data reduction for file ',A20) C--- open output files OPEN(jinp,FILE=inpfil,STATUS='OLD') OPEN(jdat,FILE=datfil,STATUS='UNKNOWN') OPEN(jsdf,FILE=sdffil,STATUS='UNKNOWN') C--- read in the data from one file CALL INPUT(jinp) C C----------------process the data -- many possible cases IF (idnum.GE.1000) THEN C************************************************ C FLAT DISK TEST SECTIONS C************************************************ condcu = 391.0 ri = 0.0127 ro = 0.0159 AI = 0.507E-03 AO = 0.792E-03 thick = 0.8E-03 perim = 2. * twopi * ri + 2. * thick AX = twopi * ri * thick zlb = ro - ri zlnc = 5. zl = zlnc * perim / condcu / AX D1 = 0.001 D2 = 0.005

104
D3 = 0.009 DO 1050 I = 1, npts STC = Tc(1,I) + Tc(2,I) + Tc(3,I) SX2 = D1*D1 + D2*D2 + D3*D3 SX = D1 + D2 + D3 STCX= Tc(1,I)*D1 + Tc(2,I)*D2 + Tc(3,I)*D3 S2X = SX * SX Twall(I) = (STC*SX2 - SX*STCX) / (3.*SX2 - S2X) TBave = (Tb(1,I) + Tb(2,I))/2. delt(I) = Twall(I) - TBave watts = volts(I) * amps(I) Qloss(I) = SQrt(zlnc*perim*condcu*AX)*delt(I)*TANH(zl) flux(I) = (watts - Qloss(I)) / AI alpha(I)= flux(I)/delt(I) Qloss(I)= 100.*Qloss(I)/watts TCvar1(I) = 0. TCvar2(I) = 0. 1050 CONTINUE ELSEIF ((isurf.EQ.1).OR.(isurf.EQ.7).OR.(isurf.EQ.8)) THEN C********************************************************** C isurf = 1,7,8 C Smooth Tube - See section B.2, pg. 101 Shakir C********************************************************** ri= 0.00630 rt= 0.00870 ro= 0.01110 C-- This heater had a 3 inch boiling length zlb= 0.07620 zlnc=0.01270 zl = zlb + zlnc condcu= 391.0 C DO 135 I=1,npts watts = volts(I)*amps(I) Q = watts TCave=(Tc(1,I)+Tc(2,I)+Tc(3,I)+Tc(4,I))/4. TBave=(Tb(1,I)+Tb(2,I))/2. TLave=(Te(1,I)+Te(2,I))/2. Tvar = 0. DO 133 J=1,4 Tvar = Tvar + (TCave - Tc(J,I))**2 133 CONTINUE TCvar1(I)= SQrt(Tvar) TCvar2(I)= 100.*TCvar1(I)/(TCave-TBave) Twall(I)= TCave - Q*(1./(twopi*condcu*zlb))*ALOG(ro/rt) delt(I)= Twall(I) - TBave flux(I)= Q/(twopi*ro*zl) alpha(I)= flux(I)/delt(I) deltL= TCave - TLave deltM= TLave - TBave Qloss(I)= condcu*pi*(ro*ro-ri*ri)*deltL/(0.5*zl) + & alpha(I)*twopi*ro*zlnc*deltM Q = Q - Qloss(I) Qloss(I)= 100.*Qloss(I)/watts Twall(I)= TCave - Q*(1./(twopi*condcu*zlb))*ALOG(ro/rt)

105
delt(I)= Twall(I) - TBave flux(I)= Q/(twopi*ro*zlb) alpha(I)= flux(I)/delt(I) 135 CONTINUE ELSEIF (isurf.EQ.2) THEN C************************************************** C isurf = 2, High Flux (Bajorek) C************************************************** ro= 0.009335 RC= 0.008382 rt= 0.007798 ri= 0.004763 zlb= 0.0508 zlnc= 0.041625 zl= zlb + zlnc CONDHF= 242.0 C DO 145 I=1,npts watts = volts(I)*amps(I) Q = watts TCave=(Tc(1,I)+Tc(2,I)+Tc(3,I)+Tc(4,I)+2.*(Te(2,I)+ & Te(4,I)))/8. TBave=(Tb(1,I)+Tb(2,I))/2. TLave=(Te(1,I)+Te(3,I))/2. Tvar = 0. DO 143 J=1,4 Tvar = Tvar + (TCave - Tc(J,I))**2 143 CONTINUE TCvar1(I)= SQrt(Tvar) TCvar2(I)= 100.*TCvar1(I)/(TCave-TBave) Twall(I)= TCave - Q*(1./(twopi*CONDHF*zlb))*ALOG(ro/rt) delt(I)= Twall(I) - TBave flux(I)= Q/(twopi*ro*zl) alpha(I)= flux(I)/delt(I) deltL= (Te(2,I)+Te(4,I))/2. - TLave deltM= TLave - TBave Qloss(I)= CONDHF*pi*(ro*ro-ri*ri)*deltL/(0.5*zlnc) + & alpha(I)*twopi*ro*zlnc*deltM Q = Q - Qloss(I) Qloss(I)= 100.*Qloss(I)/watts Twall(I)= TCave - Q*(1./(twopi*CONDHF*zlb))*ALOG(ro/rt) delt(I)= Twall(I) - TBave flux(I)= Q/(twopi*ro*zlb) alpha(I)= flux(I)/delt(I) 145 CONTINUE ELSEIF (isurf.EQ.3) THEN C************************************************************ C isurf = 3, Finned Tube, 19 Fins per Inch (Bajorek) C************************************************************ ri = 0.00470 rt = 0.00591 ro = 0.00800 RFIN = 0.009535 zlb = 0.0508 zlnc = 0.03175

106
zl = zlb + zlnc condcu = 391.0 DO 155 I=1,npts watts = volts(I)*amps(I) Q = watts TCave=(Tc(1,I)+Tc(2,I)+Tc(3,I)+Tc(4,I))/4. TBave=(Tb(1,I)+Tb(2,I))/2. Tvar = 0. DO 153 J=1,4 Tvar = Tvar + (TCave - Tc(J,I))**2 153 CONTINUE TCvar1(I)= SQrt(Tvar) TCvar2(I)= 100.*TCvar1(I)/(TCave-TBave) Twall(I)= TCave - Q*(1./(twopi*condcu*zlb))*ALOG(ro/rt) delt(I)= Twall(I) - TBave flux(I)= Q/(twopi*RFIN*zl) alpha(I)= flux(I)/delt(I) deltM= 0.5 * delt(I) Qloss(I)= alpha(I)*twopi*ro*zlnc*deltM Q = Q - Qloss(I) Qloss(I)= 100.*Qloss(I)/watts Twall(I)= TCave - Q*(1./(twopi*condcu*zlb))*ALOG(ro/rt) delt(I)= Twall(I) - TBave flux(I)= Q/(twopi*RFIN*zlb) alpha(I)= flux(I)/delt(I) 155 CONTINUE ELSEIF (isurf.EQ.4) THEN C**************************************************************** C isurf = 4 (Schnelle) C Smooth surface, 0.75 inch diameter, 2.5 inch boiling length C Four thermocouples at midpoint of heated length. C**************************************************************** ri= 0.47625E-02 rt= 0.71438E-02 ro= 0.95250E-02 zlb= 0.0635 C-- The length for natural convection is 1/2 + 7/8 in. zlnc=0.0349 zl = zlnc + zlb C-- zlOSS = 0.675 in. = 0.017145 m zlOSS = 0.017145 C condcu= 391.0 condcu = 339. C DO 165 I=1,npts watts = volts(I)*amps(I) Q = watts TCave=(Tc(1,I)+Tc(2,I)+Tc(3,I)+Tc(4,I))/4. TBave=(Tb(1,I)+Tb(2,I))/2. C-- TLave=(Te(1,I)+Te(2,I)+Te(3,I)+Te(4,I))/4. Tvar = 0. DO 163 J=1,4 Tvar = Tvar + (TCave - Tc(J,I))**2 163 CONTINUE TCvar1(I)= SQrt(Tvar)

107
TCvar2(I)= 100.*TCvar1(I)/(TCave-TBave) Twall(I)= TCave - Q*(1./(twopi*condcu*zlb))*ALOG(ro/rt) delt(I)= Twall(I) - TBave flux(I)= Q/(twopi*ro*zl) alpha(I)= flux(I)/delt(I) deltL= (Te(3,I)+Te(4,I))/2. - (Te(1,I)+Te(2,I))/2. deltM= ((Te(1,I)+Te(2,I))/2. + TLave)/2. - TBave Qloss(I)= condcu*pi*(rt*rt-ri*ri)*deltL/zlOSS Q = Q - Qloss(I) Qloss(I)= 100.*Qloss(I)/watts Twall(I)= TCave - Q*(1./(twopi*condcu*zlb))*ALOG(ro/rt) delt(I)= Twall(I) - TBave flux(I)= Q/(twopi*ro*zlb) alpha(I)= flux(I)/delt(I) 165 CONTINUE ELSEIF (isurf.EQ.5) THEN C***************************************************************** C isurf = 5 Smooth Tube - 0.75 in. OD (Bajorek) C Three valid thermocouples at center of tube. C***************************************************************** ri= 0.47625E-02 rt= 0.71438E-02 ro= 0.95250E-02 zlb= 0.05080 zlnc=0.01905 zl = 0.03810 + 0.05080 condcu= 391.0 DO 575 I=1,npts watts = volts(I)*amps(I) Q = watts TCave=(Tc(1,I)+Tc(2,I)+Tc(3,I))/3. TBave=(Tb(1,I)+Tb(2,I))/2. TLave=(Te(1,I)+Te(2,I)+Te(3,I)+Te(4,I))/4. Tvar = 0. DO 573 J=1,4 Tvar = Tvar + (TCave - Tc(J,I))**2 573 CONTINUE TCvar1(I)= SQrt(Tvar) TCvar2(I)= 100.*TCvar1(I)/(TCave-TBave) Twall(I)= TCave - Q*(1./(twopi*condcu*zlb))*ALOG(ro/rt) delt(I)= Twall(I) - TBave flux(I)= Q/(twopi*ro*zl) alpha(I)= flux(I)/delt(I) deltL= TCave - (Te(1,I)+Te(2,I))/2. deltM= ((Te(1,I)+Te(2,I))/2. + TLave)/2. - TBave Qloss(I)= condcu*pi*(ro*ro-ri*ri)*deltL/(0.00635) + & alpha(I)*twopi*ro*zlnc*deltM Qloss1 = condcu*pi*(ro*ro-ri*ri)*deltL/(0.00635) Qloss2 = alpha(I)*twopi*ro*zlnc*deltM Qloss(I) = Qloss2 Q = Q - Qloss(I) Qloss(I)= 100.*Qloss(I)/watts Twall(I)= TCave - Q*(1./(twopi*condcu*zlb))*ALOG(ro/rt) delt(I)= Twall(I) - TBave flux(I)= Q/(twopi*ro*zlb)

108
alpha(I)= flux(I)/delt(I) 575 CONTINUE ELSEIF (isurf.EQ.6) THEN C**************************************************************** C isurf = 6 Smooth Tube - 0.75 in. OD (Bajorek) C Four valid thermocouples at center of tube. C**************************************************************** ri= 0.47625E-02 rt= 0.71438E-02 ro= 0.95250E-02 zlb= 0.05080 zlnc=0.01905 zl = 0.03810 + 0.05080 condcu= 391.0 C DO 175 I=1,npts watts = volts(I)*amps(I) Q = watts TCave=(Tc(1,I)+Tc(2,I)+Tc(3,I)+Tc(4,I))/4. TBave=(Tb(1,I)+Tb(2,I))/2. TLave=(Te(3,I)+Te(4,I))/2. Tvar = 0. DO 173 J=1,4 Tvar = Tvar + (TCave - Tc(J,I))**2 173 CONTINUE TCvar1(I)= SQrt(Tvar) TCvar2(I)= 100.*TCvar1(I)/(TCave-TBave) Twall(I)= TCave - Q*(1./(twopi*condcu*zlb))*ALOG(ro/rt) delt(I)= Twall(I) - TBave flux(I)= Q/(twopi*ro*zl) alpha(I)= flux(I)/delt(I) deltL= TCave - (Te(1,I)+Te(2,I))/2. deltM= ((Te(1,I)+Te(2,I))/2. + TLave)/2. - TBave Qloss(I)= condcu*pi*(ro*ro-ri*ri)*deltL/(0.00635) + & alpha(I)*twopi*ro*zlnc*deltM Q = Q - Qloss(I) Qloss(I)= 100.*Qloss(I)/watts Twall(I)= TCave - Q*(1./(twopi*condcu*zlb))*ALOG(ro/rt) delt(I)= Twall(I) - TBave flux(I)= Q/(twopi*ro*zlb) alpha(I)= flux(I)/delt(I) 175 CONTINUE ELSEIF (isurf.EQ.9) THEN C**************************************************************** C isurf = 9 C Nuclear clad heater - 17x17 Vantage 5A clad with C 2-inch long cartridge heater. C The heater diameter after press fit is 0.245 in. C**************************************************************** ri= 0.003111 C-- The thermocouples are on a 0.329 in diameter circle. rt= 0.004178 C-- The outside diameter is 0.374 in ro= 0.00475

109
C-- The length of the boiling region is 2.0 in. zlb= 0.0508 C-- Assume the length of tube in natural convection is 2 in zlnc=0.0508 zl = zlb + zlnc C-- Thermal conductivities for copper and zircalloy condcu= 391.0 CONDZR= 7.51 DO 185 I=1,npts watts = volts(I)*amps(I) Q = watts TCave=(Tc(1,I)+Tc(2,I)+Tc(3,I))/3. TBave=(Tb(1,I)+Tb(2,I))/2. C Since this heater lacks error TCs, assume that TLave C is equal to TBave. TLave=(Te(1,I)+Te(2,I))/2. Tvar = 0. DO 183 J=1,3 Tvar = Tvar + (TCave - Tc(J,I))**2 183 CONTINUE TCvar1(I)= SQrt(Tvar) TCvar2(I)= 100.*TCvar1(I)/(TCave-TBave) C Twall(I)= TCave - Q*(1./(twopi*condcu*zlb))*ALOG(ro/rt) RC = 0.0002/(twopi*rt*zlb) Twall(I) = TCave - Q*(ALOG(ro/rt)/(twopi*CONDZR*zlb)+RC) delt(I)= Twall(I) - TBave flux(I)= Q/(twopi*ro*zl) alpha(I)= flux(I)/delt(I) deltL= TCave - TLave deltM= TLave - TBave Qloss(I)= CONDZR*pi*(ro*ro-ri*ri)*deltL/(0.5*zl) + & alpha(I)*twopi*ro*zlnc*deltM Q = Q - Qloss(I) Qloss(I)= 100.*Qloss(I)/watts Twall(I)= TCave - Q*(1./(twopi*CONDZR*zlb))*ALOG(ro/rt) delt(I)= Twall(I) - TBave flux(I)= Q/(twopi*ro*zlb) alpha(I)= flux(I)/delt(I) 185 CONTINUE ELSEIF (isurf.EQ.10) THEN C********************************************************** C isurf = 10 C Nuclear clad heater - 17x17 Vantage 5A clad with C 1-inch long cartridge heater. C The heater diameter after press fit is 0.245 in. C**************************************************************** ri= 0.003111 C The copper sleeve has radius: RCI= 0.004178 C The thermocouples are on a 0.329 in diameter circle. C rt= 0.004178 C Assume the TCs are centrally located between the sleeve C and the heating element. rt= 0.003645

110
C The outside diameter is 0.374 in ro= 0.00475 C The length of the boiling region is 1.0 in. zlb= 0.0254 C Assume the length of tube in natural convection is 1 in zlnc=0.0254 zl = zlb + zlnc C Thermal conductivities for copper and zircalloy condcu= 391.0 C RES =0.07 C RES is the electrical resistance of test heater C DO 195 I=1,npts watts = amps(I)*volts(I) Q = watts TCave=(Tc(1,I)+Tc(2,I)+Tc(3,I)+Tc(4,I))/4. TKAVE= TCave + 273.15 CONDZR = 7.51 + 0.0209*TKAVE - 1.45E-5*TKAVE**2 + & 7.67E-9*TKAVE**3 C CONDZR = 10.0 C TBave=Tb(1,I) TLave= TBave Tvar = 0. DO 193 J=1,4 Tvar = Tvar + (TCave - Tc(J,I))**2 193 CONTINUE TCvar1(I)= SQrt(Tvar) TCvar2(I)= 100.*TCvar1(I)/(TCave-TBave) C Twall(I)= TCave - Q*(1./(twopi*condcu*zlb))*ALOG(ro/rt) C RC is the contact resistance between the copper sleeve and C the Zr clad. Based on natural conv. cooling tests. RC = 0.0002/(twopi*rt*zlb) C RC = 1.4516E-4/(twopi*rt*zlb) RC = 0.00069/(twopi*rt*zlb) Twall(I) = TCave-Q*(ALOG(ro/rt)/(twopi*CONDZR*zlb)+RC) delt(I)= Twall(I) - TBave flux(I)= Q/(twopi*ro*zl) alpha(I)= flux(I)/delt(I) deltL= TCave - TLave deltM= TLave - TBave C FMIN = 0.1 FMAX = 1.0 TSAT = 100.0 C RC = max((1.0+(FMIN-FMAX)*(TCave-TSAT)/100.),FMIN)*RC FRC = (TSAT-TCave)/50. C TCHF = TSAT+75. C FRC = ((TCHF-TCave)/(TCHF-70.))**3 FRC = min(FMAX,max(FRC,FMIN)) RC = FRC*RC C FRC = max((1.0+(FMIN-FMAX)*(TCave-TSAT)/100.),FMIN) C Heat loss in the nuclear clad heater is assumed to be due to C conduction through the copper sleeve.

111
DTC = 0.0015875 ACU = pi*(RCI*RCI-ri*ri) - pi*DTC**2 C The low TC is assumed to be pulled out 2.54 cm based on C conditions at nucleation. ZERR = 2.00*0.0254 Qloss(I) = condcu*ACU*deltL/ZERR C Qloss(I) = 0. C Qloss(I)= CONDZR*pi*(ro*ro-ri*ri)*deltL/(0.5*zl) + C & alpha(I)*twopi*ro*zlnc*deltM Q = Q - Qloss(I) C PriNT *,' I=',I,' TCave=',TCave,' TLave=',TLave C PriNT *,' POWER=',watts,' Q=',Q,' Qloss=',Qloss(I) C PriNT *,' DTGAP =',Q*RC,' RC=',RC RCLAD = ALOG(ro/RCI)/(twopi*CONDZR*zlb) C PriNT *,' DTCLAD=',Q*RCLAD,' RCLAD=',RCLAD WRITE(jdat,800) I, TCave,TLave,TBave 800 FORMAT(1X,'I =',I3,' TC=',F8.2,' TL=',F8.2,' TB=',F8.2) WRITE(jdat,801) Q, watts, Qloss(I) 801 FORMAT(1X,'Q=',F8.3,' POWER=',F8.3,' Qloss=',F8.3) WRITE(jdat,802) Q*RC, RC 802 FORMAT(1X,'DTgap =',F8.2,' RC=',F10.5) WRITE(jdat,803) Q*RCLAD, RCLAD, CONDZR 803 FORMAT(1X,'DTclad=',F8.2,' RCLAD=',F9.5,' CONDZR=',F8.3) Qloss(I)= 100.*Qloss(I)/watts C Twall(I)= TCave - Q*(1./(twopi*CONDZR*zlb))*ALOG(ro/rt) Twall(I) = TCave - Q*(ALOG(ro/RCI)/(twopi*CONDZR*zlb)+RC) delt(I)= Twall(I) - TBave flux(I)= Q/(twopi*ro*zlb) alpha(I)= flux(I)/delt(I) RCONV = 1./((alpha(I)*twopi*ro*zlb)) PriNT *,' Twall=',Twall(I),' alpha=',alpha(I),' flux=', & flux(I) WRITE(jdat,804) Q*RCONV, RCONV, Twall(I) 804 FORMAT(1X,'DTwall=',F8.3,' RCONV=',F10.5,' Twall=',F8.3) WRITE(jdat,805) FRC 805 FORMAT(1X,' FRC=',F10.5) 195 CONTINUE ELSEIF (isurf.EQ.11) THEN C ***************************************************************** C *** isurf = 11 ****** Turbo-BIII Enhanced Tube C isurf = 11 Turbo-III Tube - 0.740 in. OD (Schnelle) C Four valid thermocouples at center of tube. C Two thermocouples are assumed for estimating heat loss. C The loss TCs are located at the heater edge, and C 0.675 inch (0.017145 m) inside the heated region. C ***************************************************************** C *** The heater diameter is 0.372 in (0.0094488 m) ri= 0.47244E-02 C-- The thermocouple dia. is (0.372+0.630)/2 = 0.501in = 0.0127254m rt= 0.63627E-02 C-- The copper sleeve OD is 0.630 in. (0.016002 m) RSDO = 0.008001 C-- The outside diameter of the tube is 0.740 in. = 0.018796 m

112
ro= 0.93980E-02 C-- The heater has a heated length of 2.5 in = 0.0635 m zlb= 0.06350 zlnc=0.02530 zl = zlb + zlnc C-- The error TCs are located 0.25 in off of the heater zlOSS = 0.039065 C-- The thermal conductivity of Alloy C12200 (ASTM B359) C-- is k = 196 Btu/ft2-hr-F = 339.2 W/m2-K condcu= 339.2 RC = 0.03 DO 585 I=1,npts watts = volts(I)*amps(I) Q = watts TCave=(Tc(1,I)+Tc(2,I)+Tc(3,I)+Tc(4,I))/4. TBave=(Tb(1,I)+Tb(2,I))/2. TLave=(Te(1,I)+Te(2,I))/2. Tvar = 0. DO 583 J=1,4 Tvar = Tvar + (TCave - Tc(J,I))**2 583 CONTINUE TCvar1(I)= SQrt(Tvar) TCvar2(I)= 100.*TCvar1(I)/(TCave-TBave) C Twall(I)= TCave - Q*(1./(twopi*condcu*zlb))*ALOG(ro/rt) Twall(I)= TCave - Q*(ALOG(ro/rt)/(twopi*condcu*zlb) + RC) delt(I)= Twall(I) - TBave flux(I)= Q/(twopi*ro*zl) alpha(I)= flux(I)/delt(I) deltL= TCave - TLave C deltM= ((Te(1,I)+Te(2,I))/2. + TLave)/2. - TBave Qloss(I)= condcu*pi*(RSDO*RSDO-ri*ri)*deltL/zlOSS Q = Q - Qloss(I) Qloss(I)= 100.*Qloss(I)/watts C Twall(I)= TCave - Q*(1./(twopi*condcu*zlb))*ALOG(ro/rt) Twall(I)= TCave-Q*(ALOG(ro/rt)/(twopi*condcu*zlb)+RC) delt(I)= Twall(I) - TBave flux(I)= Q/(twopi*ro*zlb) alpha(I)= flux(I)/delt(I) 585 CONTINUE ELSEIF (isurf.EQ.12) THEN C ***************************************************************** C *** isurf = 12 ****** Turbo-BIII Enhanced Tube C isurf = 12 Turbo-III Tube - 0.740 in. OD (Schnelle) C Four valid thermocouples at center of tube inserted thru C sleeve to obtain contact with Turbo-III inner surface. C Two thermocouples are assumed for estimating heat loss. C The loss TCs are located at the heater edge, and C 0.675 inch (0.017145 m) inside the heated region. C ***************************************************************** C *** The heater diameter is 0.372 in (0.0094488 m) ri= 0.47244E-02 C-- The thermocouple dia. is (0.559+0.035)=0.594in = 0.0150876m rt= 0.75438E-02 C-- The copper sleeve OD is 0.630 in. (0.016002 m)

113
RSDO = 0.8001E-02 C-- The outside diameter of the tube is 0.740 in. = 0.018796 m ro= 0.93980E-02 C-- The heater has a heated length of 2.0 in = 0.0508 m zlb= 0.05080 zlnc=0.02530 zl = zlb + zlnc C-- The error TCs are located 0.25 in off of the heater zlOSS = 0.00635 C-- The thermal conductivity of Alloy C12200 (ASTM B359) C-- is k = 196 Btu/ft2-hr-F = 339.2 W/m2-K condcu= 339.2 DO 595 I=1,npts watts = volts(I)*amps(I) Q = watts TCave=(Tc(1,I)+Tc(2,I)+Tc(3,I)+Tc(4,I))/4. TBave=(Tb(1,I)+Tb(2,I))/2. TLave=(Te(1,I)+Te(2,I))/2. deltL= TCave - TLave Tvar = 0. DO 593 J=1,4 Tvar = Tvar + (TCave - Tc(J,I))**2 593 CONTINUE TCvar1(I)= SQrt(Tvar) TCvar2(I)= 100.*TCvar1(I)/(TCave-TBave) Qloss(I)= condcu*pi*(RSDO*RSDO-ri*ri)*deltL/zlOSS Q = Q - Qloss(I) Qloss(I)= 100.*Qloss(I)/watts C Twall(I)= TCave - Q*(1./(twopi*condcu*zlb))*ALOG(ro/rt) Twall(I)= TCave - Q*(ALOG(ro/rt)/(twopi*condcu*zlb)) delt(I)= Twall(I) - TBave flux(I)= Q/(twopi*ro*zlb) alpha(I)= flux(I)/delt(I) 595 CONTINUE ELSE C**************************************************** C ERROR: not valid surface C**************************************************** WRITE(*,*) '****ERROR: invalid surface number', isurf STOP ENDIF C****************** Print out results CALL OUTPUT(jdat) CALL SDFOUT(jsdf) WRITE(*,225) datfil 225 FORMAT(10X,'OUTPUT FILE IS ',A20) WRITE(*,226) sdffil 226 FORMAT(10X,'PLOT FILE IS ',A20) IF(IFILE.EQ.nfiles) CALL BANNER(jban) CLOSE(jinp) CLOSE(jdat) CLOSE(jsdf) 900 CONTINUE CLOSE(jban)

114
WRITE(*,950) 950 FORMAT(/,1X,'Normal termination of Program PBDATA') STOP END SUBROUTINE BANNER(N) C ******************************************************************* C Prints out a banner and ids of surfaces and substances C ******************************************************************* WRITE(N,10) 10 FORMAT(/15X, &'PPPPPP',3X,'BBBBBB',3X,'DDDDDD',4X,'AAA',4X,'TTTTTTTT',5X,'AAA',/ &15X,'PP PP',2X,'BB BB',2X,'DD DD',3X,'AA AA',3X,'T TT T', & 3X,'AA AA',/ &15X,'PP PP',2X,'BB BB',2X,'DD DD',2X,'AA AA',2X, & 'T TT T',2X,'AA AA',/ &15X,'PPPPPP',3X,'BBBBBB',3X,'DD DD',2X,'AAAAAAA',5X,'TT', & 5X,'AAAAAAA',/ &15X,'PP',7X,'BB BB',2X,'DD DD',2X,'AA AA',5X,'TT', & 5X,'AA AA',/ &15X,'PP',7X,'BBBBBB',3X,'DDDDDD',3X,'AA AA',4X,'TTTT', & 4X,'AA AA',// &15X,'ProGRAM PBDATA Version 06-Revised: February 20, 2001',/ &30X,' --- Written by S. M. Bajorek',//) WRITE(N,200) 200 FORMAT(15X,'COMPONENT INDEX:',/15X,' 1 = acetone',/ & 15X,' 2 = 2-butanone',/15X,' 3 = Methanol',/ & 15X,' 4 = ethanol',/15X,' 5 = benzene',/15X,' 6 = water',/ & 15X,' 7 = 1-propanol',/15X,' 8 = 2-Propanol',/ & 15X,' 9 = ethylene glycol',/15X,'10 = cyclohexane',/ & 15X,'11 = Propylene glycol',/15X,'12 = methyl acetate',/ & 15X,'13 = ethyl acetate',/15X,'14 = diethylene glycol',/ & 15X,'15 = AMMONIA') WRITE(N,500) 500 FORMAT(/15X,'SURFACE INDEX:',/ & 15X,' 1 = smooth tube Shakir',/ & 15X,' 2 = high flux tube Bajorek',/ & 15X,' 3 = finned tube Bajorek',/ & 15X,' 4 = smooth tube Schnelle',/ & 15X,' 5 = smooth tube Bajorek',/ & 15X,' 6 = smooth tube Bajorek',/ & 15X,' 7 = smooth tube Shakir',/ & 15X,' 8 = smooth tube Shakir',/ & 15X,' 9 = nuclear clad Schnelle',/ & 15X,'10 = nuclear clad Schnelle',/ & 15X,'11 = TURBO-IIIB Schnelle',/ & 15X,'12 = TURBO-IIIB Schnelle',// & 14X,'101 = smooth Cu flat disk',/ & 14X,'102 = smooth Cu flat disk',/ & 14X,'103 = 1.25 in Si wafer') RETURN END SUBROUTINE INPUT(jin) C *******************************************************************

115
C Reads in an input file C ******************************************************************* COMMON/XDATA/idnum,idate,isurf,icomp(5),frac(5),npts,iunits, & volts(40),amps(40),P(40),Tb(2,40),Tc(4,40),Te(4,40) COMMON/SOLUTE/ ppmB, ppmLi C-- Function to convert degF to degC FtoC(x)= (x-32.)*(5./9.) C C--- READ(jin,1) is a header line that is ignored WRITE(*,*) 'TEST input subroutine start' READ(jin,1) READ(jin,10) idnum,idate,isurf,iunits C READ(jin,*) idnum,idate,isurf,iunits READ(jin,1) READ(jin,20) (icomp(i),i=1,5) READ(jin,1) READ(jin,30) (frac(i),i=1,5) READ(jin,1) READ(jin,40) npts,ppmB,ppmLi READ(jin,1) C-- readin temperatures READ(jin,60) (volts(n),amps(n),(Tc(i,n),i=1,4),Tb(1,n),Tb(2,n), & (Te(i,n),i=1,4),P(n),n=1,npts) C-- change temps in degF (iunits=1) to degC(iunits=2) (if necessary) IF (iunits.EQ.1) THEN DO 55 n=1,npts DO 56 i=1,4 Tc(i,n) = FtoC(Tc(i,n)) Te(i,n) = FtoC(Te(i,n)) 56 CONTINUE Tc(1,n) = FtoC(Tb(1,n)) Tc(2,n) = FtoC(Tb(2,n)) 55 CONTINUE ENDIF 1 FORMAT( ) 10 FORMAT(10X,I5,9X,I6,10X,I5,10X,I5) 20 FORMAT(5I15) 30 FORMAT(5E15.5) WRITE(*,*) 'TEST 09' 40 FORMAT(10X,I5,5X,F10.1,5X,F10.1) 60 FORMAT(F5.1,1X,F5.2,10F6.1,1X,F6.1) RETURN END SUBROUTINE OUTPUT(J) C ****************************************************************** C Produces output data files C ****************************************************************** COMMON/XDATA/idnum,idate,isurf,icomp(5),frac(5),npts,iunits, & volts(40),amps(40),P(40),Tb(2,40),Tc(4,40),Te(4,40) COMMON/XOUTP/delt(40),Qloss(40),alpha(40),Twall(40),flux(40), & TCvar1(40),TCvar2(40) COMMON/SOLUTE/ ppmB, ppmLi
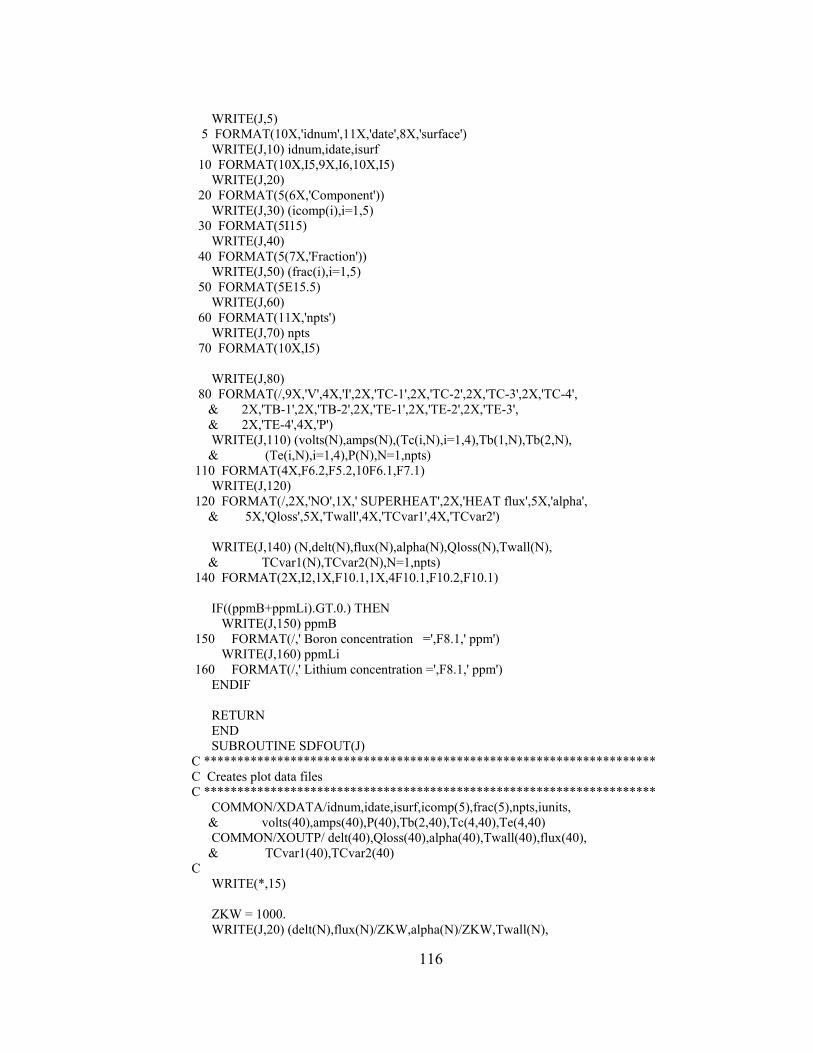
116
WRITE(J,5) 5 FORMAT(10X,'idnum',11X,'date',8X,'surface') WRITE(J,10) idnum,idate,isurf 10 FORMAT(10X,I5,9X,I6,10X,I5) WRITE(J,20) 20 FORMAT(5(6X,'Component')) WRITE(J,30) (icomp(i),i=1,5) 30 FORMAT(5I15) WRITE(J,40) 40 FORMAT(5(7X,'Fraction')) WRITE(J,50) (frac(i),i=1,5) 50 FORMAT(5E15.5) WRITE(J,60) 60 FORMAT(11X,'npts') WRITE(J,70) npts 70 FORMAT(10X,I5) WRITE(J,80) 80 FORMAT(/,9X,'V',4X,'I',2X,'TC-1',2X,'TC-2',2X,'TC-3',2X,'TC-4', & 2X,'TB-1',2X,'TB-2',2X,'TE-1',2X,'TE-2',2X,'TE-3', & 2X,'TE-4',4X,'P') WRITE(J,110) (volts(N),amps(N),(Tc(i,N),i=1,4),Tb(1,N),Tb(2,N), & (Te(i,N),i=1,4),P(N),N=1,npts) 110 FORMAT(4X,F6.2,F5.2,10F6.1,F7.1) WRITE(J,120) 120 FORMAT(/,2X,'NO',1X,' SUPERHEAT',2X,'HEAT flux',5X,'alpha', & 5X,'Qloss',5X,'Twall',4X,'TCvar1',4X,'TCvar2') WRITE(J,140) (N,delt(N),flux(N),alpha(N),Qloss(N),Twall(N), & TCvar1(N),TCvar2(N),N=1,npts) 140 FORMAT(2X,I2,1X,F10.1,1X,4F10.1,F10.2,F10.1) IF((ppmB+ppmLi).GT.0.) THEN WRITE(J,150) ppmB 150 FORMAT(/,' Boron concentration =',F8.1,' ppm') WRITE(J,160) ppmLi 160 FORMAT(/,' Lithium concentration =',F8.1,' ppm') ENDIF RETURN END SUBROUTINE SDFOUT(J) C ******************************************************************** C Creates plot data files C ******************************************************************** COMMON/XDATA/idnum,idate,isurf,icomp(5),frac(5),npts,iunits, & volts(40),amps(40),P(40),Tb(2,40),Tc(4,40),Te(4,40) COMMON/XOUTP/ delt(40),Qloss(40),alpha(40),Twall(40),flux(40), & TCvar1(40),TCvar2(40) C WRITE(*,15) ZKW = 1000. WRITE(J,20) (delt(N),flux(N)/ZKW,alpha(N)/ZKW,Twall(N),

117
& Tb(1,N),P(N),N=1,npts) WRITE(*,20) (delt(N),flux(N)/ZKW,alpha(N)/ZKW,Twall(N), & Tb(1,N),P(N),N=1,npts) 15 FORMAT(' Delt(n) flux/1000 alpha/1000', & ' Twall Tb P') 20 FORMAT(5X,F10.4,5X,F10.2,5X,F10.1,3F10.1) C RETURN END

118
A.2 Sample Data File.
Input file with data for pool boiling test at 1000 psi pressure for ionized water at 30 subcooling.
IDNUM DATE SURFACE
953 041406 10
COMPONENT COMPONENT COMPONENT COMPONENT COMPONENT
6 0 0 0 0
FRACTION FRACTION FRACTION FRACTION FRACTION
0.10000E+01 0.00000E+00 0.00000E+00 0.00000E+00 0.00000E+00
NPTS PPMBN PPMLI
20 0.0 0.0
V I TC-1 TC-2 TC-3 TC-4 TB-1 TB-2 TE-1 TE-2 TE-3 TE-4 P
0.47 6.30 258.6 257.5 256.9 257.5 254.6 0.0 0.0 0.0 0.0 0.0 1000.0 0.73 9.60 263.1 262.5 261.0 262.1 255.6 0.0 0.0 0.0 0.0 0.0 1001.0 1.05 13.60 269.4 267.9 267.6 267.8 255.4 0.0 0.0 0.0 0.0 0.0 1001.0 1.27 18.00 276.0 275.4 273.7 275.7 255.6 0.0 0.0 0.0 0.0 0.0 1000.0 1.55 21.90 287.7 284.0 282.9 284.5 255.6 0.0 0.0 0.0 0.0 0.0 1000.0 1.80 25.40 297.2 294.6 293.6 293.9 255.6 0.0 0.0 0.0 0.0 0.0 1001.0 1.97 27.80 301.2 300.4 300.7 300.6 255.8 0.0 0.0 0.0 0.0 0.0 1000.0 2.14 30.10 305.7 305.1 304.5 304.6 255.6 0.0 0.0 0.0 0.0 0.0 1000.0 2.30 32.50 309.2 310.0 309.4 310.2 255.6 0.0 0.0 0.0 0.0 0.0 1001.0 2.43 34.40 312.3 312.8 312.4 312.8 255.8 0.0 0.0 0.0 0.0 0.0 1002.0 2.60 36.40 314.8 315.0 314.7 315.0 256.0 0.0 0.0 0.0 0.0 0.0 1000.0 2.72 38.90 316.1 317.1 316.1 317.1 255.8 0.0 0.0 0.0 0.0 0.0 1000.0 2.91 41.40 318.5 319.7 318.9 319.4 255.4 0.0 0.0 0.0 0.0 0.0 1000.0 3.02 43.10 320.3 322.2 320.6 321.1 255.8 0.0 0.0 0.0 0.0 0.0 1001.0 3.13 44.60 322.6 324.0 322.4 322.8 255.8 0.0 0.0 0.0 0.0 0.0 1003.0 3.27 46.70 324.5 325.9 325.0 325.1 255.8 0.0 0.0 0.0 0.0 0.0 1002.0 3.37 48.00 326.6 327.5 326.2 327.1 255.8 0.0 0.0 0.0 0.0 0.0 1000.0 3.47 49.70 328.0 328.8 328.0 328.5 256.0 0.0 0.0 0.0 0.0 0.0 1001.0 3.61 51.70 330.2 330.5 330.0 331.6 256.0 0.0 0.0 0.0 0.0 0.0 1000.0 3.75 52.90 332.3 331.6 332.2 332.8 255.8 0.0 0.0 0.0 0.0 0.0 1000.0
Output file from the program ‘pbdata’
V I TC-1 TC-2 TC-3 TC-4 TB-1 TB-2 TE-1 TE-2 TE-3 TE-4 P
.47 6.30 258.6 257.5 256.9 257.5 254.6 .0 .0 .0 .0 .0 1000.0 .73 9.60 263.1 262.5 261.0 262.1 255.6 .0 .0 .0 .0 .0 1001.0 1.05 13.60 269.4 267.9 267.6 267.8 255.4 .0 .0 .0 .0 .0 1001.0 1.27 18.00 276.0 275.4 273.7 275.7 255.6 .0 .0 .0 .0 .0 1000.0 1.55 21.90 287.7 284.0 282.9 284.5 255.6 .0 .0 .0 .0 .0 1000.0 1.80 25.40 297.2 294.6 293.6 293.9 255.6 .0 .0 .0 .0 .0 1001.0

119
1.97 27.80 301.2 300.4 300.7 300.6 255.8 .0 .0 .0 .0 .0 1000.0 2.14 30.10 305.7 305.1 304.5 304.6 255.6 .0 .0 .0 .0 .0 1000.0 2.30 32.50 309.2 310.0 309.4 310.2 255.6 .0 .0 .0 .0 .0 1001.0 2.43 34.40 312.3 312.8 312.4 312.8 255.8 .0 .0 .0 .0 .0 1002.0 2.60 36.40 314.8 315.0 314.7 315.0 256.0 .0 .0 .0 .0 .0 1000.0 2.72 38.90 316.1 317.1 316.1 317.1 255.8 .0 .0 .0 .0 .0 1000.0 2.91 41.40 318.5 319.7 318.9 319.4 255.4 .0 .0 .0 .0 .0 1000.0 3.02 43.10 320.3 322.2 320.6 321.1 255.8 .0 .0 .0 .0 .0 1001.0 3.13 44.60 322.6 324.0 322.4 322.8 255.8 .0 .0 .0 .0 .0 1003.0 3.27 46.70 324.5 325.9 325.0 325.1 255.8 .0 .0 .0 .0 .0 1002.0 3.37 48.00 326.6 327.5 326.2 327.1 255.8 .0 .0 .0 .0 .0 1000.0 3.47 49.70 328.0 328.8 328.0 328.5 256.0 .0 .0 .0 .0 .0 1001.0 3.61 51.70 330.2 330.5 330.0 331.6 256.0 .0 .0 .0 .0 .0 1000.0 3.75 52.90 332.3 331.6 332.2 332.8 255.8 .0 .0 .0 .0 .0 1000.0
NO SUPERHEAT HEAT flux alpha Qloss Twall TCvar1 TCvar2
1 2.6 3398.7 1314.1 13.0 257.2 1.23 40.6 2 5.5 8142.0 1473.7 11.9 261.1 1.53 23.3 3 10.6 16695.1 1571.3 11.4 266.0 1.43 11.2 4 16.1 26868.9 1664.2 10.9 271.7 1.78 9.1 5 24.1 39886.0 1657.9 10.9 279.7 3.57 12.2 6 32.3 53733.6 1661.2 10.9 287.9 2.84 7.2 7 36.7 64710.8 1765.6 10.4 292.5 .59 1.3 8 39.6 76691.7 1937.7 9.7 295.2 .95 1.9 9 42.7 89534.0 2098.0 9.2 298.3 .82 1.5 10 43.9 100749.4 2293.6 8.6 299.7 .46 .8 11 44.2 114971.1 2600.0 7.9 300.2 .26 .4 12 44.3 129380.5 2919.6 7.3 300.1 1.00 1.6 13 44.8 148236.6 3305.4 6.7 300.2 .92 1.4 14 44.8 160760.8 3589.6 6.4 300.6 1.45 2.2 15 45.1 172889.6 3829.2 6.1 300.9 1.24 1.9 16 45.2 189820.2 4201.3 5.8 301.0 1.00 1.4 17 45.4 201470.5 4434.4 5.6 301.2 .98 1.4 18 44.9 215370.3 4791.3 5.3 300.9 .68 .9 19 44.9 233695.8 5206.6 5.1 300.9 1.24 1.7 20 44.8 248869.7 5553.0 4.9 300.6 .85 1.1

120
APPENDIX B
B.1 Product Reference 1. Duniway Stockroom Corporation Product: Copper –O rings, 2006, Code: SG-600 Details: Duniway Stockroom Corporation 1305 Space Park Way Mountain View, CA 94043 Ph :800-446-8811
2. Richard Greene Company Product: electrical test heater, Code: SN6N-3206 Manufacturer Details: Watlow 12001 Lackland Road St louis, MO 63146-41001 Ph: 314-878-4600, fax: 314-878-6814
3. McMaster-Carr Product : Ptfe O-rings Manufacturer details: McMaster-Carr Supply Company P.O. Box 4355
Chicago, IL 60680-4355 Ph: 630-833-0300 fax: 530-834-9427
4. Omega Engineering Inc Product: Pressure Transducer, Model: PX35k1-3kGV Product: Pressure Transmitter, Model: DP-25S T-type thermocouple, Model : HTQIN 316G-12 Details: Omega Engineering Inc One Omega drive, PO Box 4047 Stamford, CT 06907-0047 Ph: 203-359-1660 fax- 203-359-7700
5. Microgroup Product : Inconel Tubes, Grade : 600 Manufcturer Details: Microgroup Inc. 7 Industrial Park Road Medway, MA 02053-1732

121
Ph 508-533-4925 fax 508-533-5691
6. Linweld Product: Nitrogen cylinder, Type: Industrial Details: Linweld Inc. PO Box 682 Manhattan, KS 66505 Ph: 785-537-0395
7. Yale Film and Video Product: 16mm film processing, Model: Hawkeye Surveillance Film Details: Yale Film and Video 10555 Victory Blvd, North Hollywood, CA 91606 Ph 818-508-9253, fax 818-762-0688
8. Machined Glass Specialists Inc Product: Fused Quartz Window, Model: custom order. Dimensions : 1.75” Dia x 0.75”thick Details: Machined Glass Specialists, Inc. 245 Hiawatha Trail Springboro, Ohio 45066 Ph: 937-743-6166, fax 937-743-6168
9. John C Ernest Co Inc Product: Gaskets for fused quartz, Model: 583 1.75-1.00-0.0625 Details: John C. Ernest Co. Inc 21 Gail Ct. Sparta, NJ 07871 Ph: 973-940-1600. www.sightglass.com
10. Visual Instrumentation Corporation Product: high speed camera (purchased 1984), Model: Hycam: 41-0005 Details: Visual Instrumentation Corporation 1110 West Avenue L-12, Unit 2, Lancaster, CA, USA 93534-7039 Ph: 661-945-7999 fax 661-723-5667

122
11. Stern Laboratories Inc Product: electrical test heater Solid-state electrical DC power supply Details: Stern Laboratories, Inc. 1590 Burlington Street East, Hamilton, Ontario, Canada L8H 3L3 Ph 905-548-5300 fax 905-545-5399
12. Alfa Aesar Product : Lithium metaborate puratonic Boric Acid Details: www.alfaaesar.com
13. Swagelock Product: union tube fittings Details: Kansas City Valve & Fitting Co. 4707 Roe Parkway Roeland Park, Kansas 66205 14. Fluke Product : Clamp Ammeter, Model : i-410
Details: www.fluke.com
15. Systat Inc. Product : Sigmascan- Image Analysis Software. Details: http://www.systat.com/products/SigmaScan/

123
B.2 Sample Heat Exchanger Calculations
Assuming ΔP = 40 psi. Assuming internal diameter of inconel tube is 0.5”, Di= 0.01021m Do = Outer diameter of inconel tubing = 0.127 m ΔP = 28122.6 N/m2.
Head loss hL= ⎟⎟⎠
⎞⎜⎜⎝
⎛ ΔgρP =2.87m
ρ = density of the fluid =996 kg/m3
g = acceleration due to gravity = 9.81 m/sec2
Using equation (3.3) with intial guess f = 0.02 and assuming the length of the tube = 8.5 m, we have
Solid cross-section of the inconel tubing = 4
)(* 22io DD −Π
= 0.0000158 sq m.
Resistance of the inconel tubes is AlR ρ
= equation (3.1)
Total Electrical resistance of the inconel tubing = 0000158.0
5.8*03.1 =0.553 Ω.
Using Darcy’s formula equation (3.3) gives
sec/m.fL
hgDV li 298651
2==
Viscosity of the fluid = μ = 0.000855 N/m2
Reynolds number = ⎟⎟⎠
⎞⎜⎜⎝
⎛=
μρiVD
Re = 27492
Reynolds number is greater than 2300, indicating that the flow is turbulent. Surface area of the inconel tubes = (π )*Di*L = 0.317238 sqm Corrected friction factor f (from Moody chart) = 0.027 Prandtl number = 5.846 and n = 4. From equation (3.5) the Nusselt number is
91650230 54
.PrRe.Nu n ==⎟⎠⎞
⎜⎝⎛
Required flow rate of water to remove the heat generated in the inconel tubes is
Q (flow rate) =A*V
where A is the area of tube cross section and V is the velocity of the fluid.
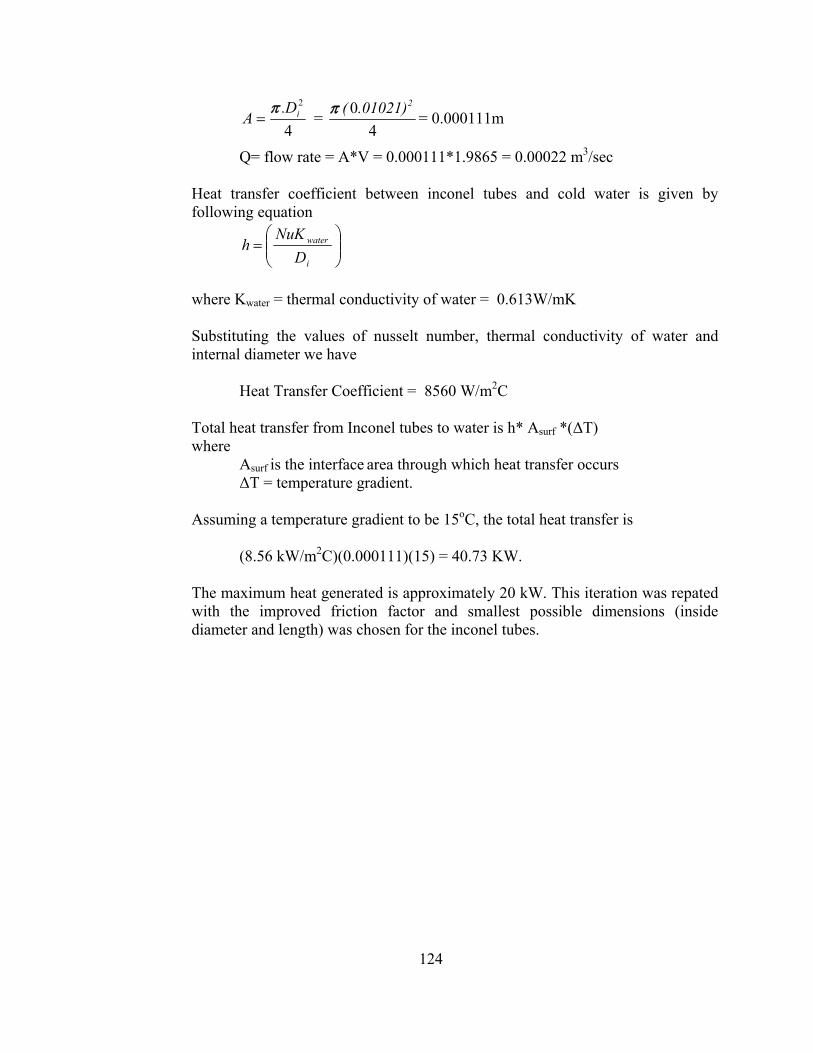
124
4
2iD.
Aπ
= = 4
0 201021).(π = 0.000111m
Q= flow rate = A*V = 0.000111*1.9865 = 0.00022 m3/sec
Heat transfer coefficient between inconel tubes and cold water is given by following equation
⎟⎟⎠
⎞⎜⎜⎝
⎛=
i
water
DNuK
h
where Kwater = thermal conductivity of water = 0.613W/mK
Substituting the values of nusselt number, thermal conductivity of water and internal diameter we have
Heat Transfer Coefficient = 8560 W/m2C
Total heat transfer from Inconel tubes to water is h* Asurf *(ΔT) where
Asurf is the interface area through which heat transfer occurs ΔT = temperature gradient.
Assuming a temperature gradient to be 15oC, the total heat transfer is
(8.56 kW/m2C)(0.000111)(15) = 40.73 KW. The maximum heat generated is approximately 20 kW. This iteration was repated with the improved friction factor and smallest possible dimensions (inside diameter and length) was chosen for the inconel tubes.