Needle Exchange Surveillance Initiative (NESI) · The Needle Exchange Surveillance Initiative...
40
Needle Exchange Surveillance Initiative (NESI): Prevalence of HCV and injecting risk behaviours among injecting drug users attending needle exchanges in Scotland, 2008/2009
Transcript of Needle Exchange Surveillance Initiative (NESI) · The Needle Exchange Surveillance Initiative...

Needle Exchange SurveillanceInitiative (NESI):
Prevalence of HCV and injectingrisk behaviours among injectingdrug users attending needleexchanges in Scotland, 2008/2009

The Needle Exchange Surveillance Initiative (NESI): Prevalence of HCV and injecting risk behaviours among injecting drug users attending needle exchanges in Scotland, 2008/2009.
University of the West of Scotland
Health Protection Scotland, NHS National Services Scotland
West of Scotland Specialist Virology Centre
Report written & prepared by:
Elizabeth Allen, Avril Taylor, Norah Palmateer, Sharon Hutchinson, Cheryl Rees, Lauren Johnston,Germana Vitrano, Sheila Cameron and David Goldberg.
University of the West of Scotland,Institute for Applied Social & Health Research,Faculty of Education, Health & Social Sciences,Paisley Campus, PA1 2BE.
First published in April 2010
For all enquiries please contact:
Elizabeth Allen
[email protected]: 0141 848 3899Fax: 0141 8494264
This report is available at: www.hepcscotland.co.uk
Suggested citation: University of the West of Scotland, Health Protection Scotland and West of Scotland Specialist Virology Centre. The Needle Exchange Surveillance Initiative (NESI): Prevalence of HCV and injecting risk behaviours among injecting drug users attending needle exchanges in Scotland, 2008/2009. University of the West of Scotland, April 2010.

Contents
Introduction 1
Overview of Methods 1
Results 1
Summary and Conclusions 5
Tables
Table 1. Sample characteristics 7
Table 2. Self-reported injecting risk behaviour 8
Table 3. Imprisonment and injecting in prison 10
Table 4. Uptake of harm reduction services 11
Table 5. Blood-borne virus testing and referral 13
Table 6. Prevalence of HCV infection 14
Acknowledgements 15
Appendices
Appendix 1: Survey methods 17
Appendix 2: Survey questionnaire 19
Appendix 3: Participating needle exchange sites 31
References 34


1Needle Exchange Surveillance Initiative (NESI) 2008/2009 Report
Introduction
The aim of the Needle Exchange Surveillance Initiative (NESI) is to measure and monitor the prevalence of the Hepatitis C virus (HCV) and injecting risk behaviours among injecting drug users (IDUs) in Scotland. The initiative is funded by the Scottish Government as part of the Hepatitis C Action Plan, which stated that efforts to prevent HCV in Scotland must focus on preventing transmission of the virus among IDUs(1). NESI will provide us with information to evaluate and better target interventions aimed at reducing the spread of infection among this population group. This report presents the results for the data collection period from June 2008 to June 2009, which covered the 11 mainland Scottish NHS Boards: these included Ayrshire & Arran (AA), Borders (BR), Dumfries & Galloway (DG), Fife (FF), Forth Valley (FV), Grampian (GR), Greater Glasgow & Clyde (GGC), Highland (HG), Lanarkshire (LN), Lothian (LO) and Tayside (TY). Data from Borders and Highland NHS Boards have been combined in this report due to the small numbers involved.
Overview of methods
A cross-sectional voluntary anonymous survey approach was used to recruit and interview IDUs. Trained interviewers recruited participants from selected needle exchange services and pharmacies that provide injecting equipment; these settings may also provide other harm reduction services, such as prescribed methadone. Clients attending these services were invited to take part if they had ever injected drugs and if it was the first time they had participated in the current survey (June 2008 - June 2009). After providing informed consent, participants completed a short interviewer-administered questionnaire (see Appendix 2) and then provided a voluntary blood spot sample for anonymous testing for HCV antibodies and RNA. IDUs who wished to know their HCV status were directed to the appropriate services. More detailed methods are provided in Appendix 1.
Results
Sample characteristics (Table 1)
• A total of 2563 participants completed the survey during June 2008 through to June 2009, comprising 947 from GGC (37%), 472 from GR (18%), 311 from LO (12%), 200 from LN (8%), 192 from TY (7.5%), 138 from AA (5%), 104 from FF (4%), 89 from FV (3.5%), 67 from DG (3%), and 43 from HG/BR (2%) NHS Boards. The distribution of participants by NHS Board is by enlarge comparable to the estimated number of IDUs in mainland Scotland(2), in 2006 (with 37% in GGC, 14% in LO, 13% in GR, 10% in AA, 7% in LN, 5% in FF and TY and 9% in the other NHS Boards).
• Almost three quarters (72%) of participants were male.
• The overall mean age of respondents was 33 years, with 14% aged 16-25 years, 24% aged 26-30 years, 28% aged 31-35 years and 34% aged over 35 years. Respondents from GGC and AA were the oldest (both with a mean age of 35) and those from HG/BR were the youngest (mean age 30).
• Overall 27% of respondents reported being homeless (defined as living in a hostel for the homeless, having no fixed abode or living on the streets) in the last six months; this proportion ranged from 20% in DG to 37% in HG/BR.
• The mean age at which respondents reported first injecting ranged from approximately 21 to 24 years across the 11 NHS Boards. In LN, LO, AA and FF, the sample included proportionally more IDUs who had commenced at the older end of the spectrum (22 years and above), which was reflected in a slightly higher mean and median age of commencement of injecting.

2 Needle Exchange Surveillance Initiative (NESI) 2008/2009 Report
• Overall a third of respondents were recent initiates to injecting drug use (i.e. they had commenced injecting within the previous five years). Larger proportions of recent initiates to injecting drug use were recruited in LO, TY and HG/BR (44%-55%) compared with GGC, FV, DG and GR (20%-29%).
A considerable proportion (25%) of GGC IDUs had been injecting for more than 15 years.
• Overall, 80% of respondents were current IDUs (i.e. reported having injected in the six months prior to interview).
• The vast majority of current IDUs reported injecting heroin in the last six months. In GGC, 31% of respondents reported injecting cocaine within the last six months, compared with 6% to 15% in other NHS Boards. Notably, more respondents reported injecting amphetamines in FF and FV (15% and 19%, respectively) than in other NHS Boards (2%-8%). Similarly, more respondents in GR (16%) reported injecting crack than in other Boards (2%-7%). Injection of Performance and Image Enhancing drugs was reported by 2% of the overall sample†.
• Overall 63% of current IDUs reported injecting at least daily in the last six months; this proportion ranged from 54% to 72% across NHS Boards.
Injecting risk behaviour (Table 2)
• Overall 9% of current IDUs reported sharing a needle/syringe (i.e. injecting with a needle/syringe that had previously been used by someone else) in the four weeks prior to interview; 15% reported sharing of needles/syringes in the six months prior to interview. Sharing of needles/syringes in the six months before interview among current IDUs ranged from 9% to 20% across NHS Boards.
• The proportion of current IDUs who reported using a new needle/syringe for all injections in the last six months was 42% for the overall sample and ranged from 28% to 54% across NHS Boards.
• Twenty percent of current IDUs had passed on used needles/syringes to others in the six months prior to interview; this proportion ranged from 6% to 34% across NHS Boards. Overall 10% of current IDUs had passed on used needles/syringes to one other person, 9% to between two and five people and 2% to more than five people.
• Sharing of injecting equipment other than needles/syringes (i.e. spoons/cookers, filters and water) was more common: 36% of current IDUs reported sharing of such equipment in the last four weeks and 48% reported sharing such equipment in the last six months. The latter proportion ranged from 34% to 56% across NHS Boards.
• Comparatively lower rates of sharing of other injecting equipment (i.e. spoons/cookers, filters and water) were reported among current IDUs who had never injected with used needles/syringes although these were still high (overall 36% in the last six months).
• Overall 17% of current IDUs reported having shared any injecting equipment (needles/syringes, spoons/cookers, filters or water) with a known HCV-positive individual; 9% and 6% reported having shared with a known HCV-positive individual in the last six months and the last month, respectively.
• Forty percent of current IDUs reported reusing their own needles/syringes on average once or twice in the last six months; this proportion ranged from 26% to 50% across NHS Boards. A further 15% and 8% of current IDUs reused their own needles/syringe on average between three and five times and more than five times, respectively.
• Seventeen percent of current IDUs reported that in the last six months they had been injected by someone else (after that person had injected themselves or others); this proportion ranged from 14% to 31% across NHS Boards.
† Data not shown in tables due to potential risk of disclosure

3Needle Exchange Surveillance Initiative (NESI) 2008/2009 Report
Imprisonment and injecting in prison (Table 3)
• Of the overall sample, 59% reported having been in prison since commencing injecting drug use and 17% had been imprisoned in the last six months; this latter proportion ranged from 10% to 23% across NHS Boards.
• Among respondents who had been imprisoned in the last six months, 19 (4%) indicated that they had injected while inside. This proportion was highest (at 8%) among respondents from GR. Among those who had injected in prison in the last six months, half (9/19) reported using a needle/syringe that had been previously used by someone else†.
Uptake of services (Table 4)
• Sixty-eight percent of participants reported that they had received vaccination for Hepatitis B (at least one dose of); this proportion ranged from 36% to 81% across NHS Boards. Of those who had received Hepatitis B vaccination, 77% reported that they had received three or more doses of the vaccine.
• Approximately three quarters of the overall sample reported having ever been tested for HCV; this proportion ranged from 59% to 88% across NHS Boards. Thirty-five percent of all participants had been tested in the last year; this proportion ranged considerably from 26% to 60% across NHS Boards. When those who were diagnosed positive from a past test (prior to 12 months ago) were excluded, the overall percentage of respondents who had been tested for HCV in the last year increased to 49%*.
• There was considerable variation between NHS Boards as to where participants received their last HCV test, with the majority of tests undertaken in general practices (29%), hospital (24%), drug treatment centres (21%) and prison (17%).
• Across all NHS Boards, 68% of respondents reported having ever been tested for HIV; this proportion ranged from 45% to 81% across NHS Boards. Only 30% of all participants had been tested in the last year; this proportion ranged from 23% to 49% across NHS Boards.
• Seventy-two percent of respondents reported receiving prescribed methadone in the last six months; this proportion ranged from 49% to 93% across NHS Boards. When only current IDUs were considered, 67% reported receiving prescribed methadone in the last six months; this proportion ranged from 49% to 90% across NHS Boards. When those who had attended the needle exchange site for methadone on the day of interview were excluded, the proportion of current IDUs who reported receiving prescribed methadone in the last 6 months reduced to 52%; this proportion ranged from 26% to 71% across NHS boards*.
• Approximately 60% of respondents had received other forms of drug treatment (includes opiate substitute treatment excluding methadone, drug counselling, detox and residential rehabilitation) in the last six months; this proportion ranged from 24% to 90% across NHS Boards.
• Eight percent of current IDUs (and 13% of those who attended the needle exchange site for methadone on the day of the interview*) had not obtained any needles/syringes directly from a needle exchange in the last six months; of these respondents, 98% had obtained sterile needles/syringes from other people†.
• The average number of sterile needles/syringes obtained by current IDUs in a week from either exchanges or other people were 21 per week; this number ranged from 18 to 39 across NHS Boards. Current IDUs reported obtaining the majority of their needles/syringes from either fixed site specialist exchanges (overall mean of 10 needles/syringes per week) or pharmacies (overall mean of 9 needles/syringes per week), however there was variation across NHS Boards with regard to location where current IDUs obtained their needles/syringes.
† Data not shown in tables due to potential risk of disclosure
* Data not shown

4 Needle Exchange Surveillance Initiative (NESI) 2008/2009 Report
• Seventeen percent of current IDUs reported that they had received sterile needles/syringes from someone else in the last six months. The mean number of sterile needles/syringes obtained this way was 1 per week.
• In terms of injecting equipment other than needles/syringes, acidifiers, wipes/swabs and sharps bins had been obtained by the majority (overall 86%-89%) of current IDUs; respondents from FV NHS Board were the exception with only 29% and 26% reporting that they had obtained wipes/swabs and acidifiers in the last six months, respectively.
Diagnosis and referral for HCV infection (Table 5)
• Approximately a quarter of all respondents reported themselves to be HCV positive; this proportion ranged from 9% to 39% across NHS Boards.
• Sixty percent of those respondents who reported their most recent HCV test as positive were referred to hospital. Of those who were referred to hospital, a high proportion (70%) attended their appointment.
Prevalence of HCV infection (Table 6)
• A total of 2513 participants (98%) voluntarily provided a blood spot sample for testing for HCV antibodies. The overall prevalence of antibodies to HCV (hereafter referred to as HCV prevalence) for all mainland NHS boards in Scotland was 55%; the prevalence of HCV ranged from 31% in LO to 70% in GGC NHS Board.
• Overall, HCV prevalence was slightly lower among male (53%) compared to female (58%) participants.
• The prevalence of HCV among those aged under 25 years was 36% overall; this figure ranged from 14% to 60% across NHS Boards*.
• Across all the NHS Boards, 24% of respondents who had commenced injecting within 3 years prior to interview had antibodies to HCV; the prevalence in this group ranged from 8% to 40% across NHS Boards*. The prevalence of HCV increased to 32% among respondents who had commenced injecting within the last 5 years; this figure ranged from 11% to 44% across NHS Boards*.
• Less than half (46%) of participants who tested HCV-antibody positive on dried blood spot were aware of their infection. The remaining HCV-antibody positive respondents had either never been
tested, had not received their test result, or incorrectly reported their status as HCV-negative. The proportion who were unaware of their infection ranged from 40% to 59% across NHS Boards*.
Incidence of HCV infection
• In the very early stages of HCV infection, individuals have high levels of viraemia prior to developing antibodies (seroconverting); this is often referred to as the viraemic pre-seroconversion window period. During this relatively short period, individuals will test HCV antibody negative and HCV RNA positive.
• Of the 1140 respondents who tested HCV antibody negative, 1115 had a sufficient sample remaining for RNA testing; 21 of the 1115 (1.9%) were found to be HCV RNA positive. Assuming a viraemic pre-seroconversion window period of 51 days(3, 4), the estimated incidence was 12 HCV infections per 100 person years across Scotland**.
* Data have been aggregated in tables due to potential risk of disclosure
** The incidence of HCV was calculated using the formula I = [(365/T) x n] / [ (N-n) + ((365/T) x n)], where T = length of the window period in days, N = number of susceptibles (HCV antibody negatives), and n = number of recent HCV infections (HCV antibody negative and HCV RNA positive).

5Needle Exchange Surveillance Initiative (NESI) 2008/2009 Report
Summary and Conclusions
1. Respondents from all eleven NHS boards were predominately male. GGC and AA respondents were on average older than those from other NHS Boards. GGC and LO respondents were more likely to
report recent homelessness than other NHS Board respondents. The average age at initiation of injecting was similar across NHS boards. The sample recruited in GGC had been injecting for the longest on
average; while those recruited in LO and TY had been injecting for the least time on average. While heroin was injected by the large majority of respondents from all eleven NHS Boards, a larger proportion of those in GGC and GR reported recent injection of cocaine and crack, respectively. A higher percentage of respondents in FV and FF reported recent injection of amphetamines than in other areas.
2. Survey participants reported relatively low rates of sharing needles/syringes in most NHS Boards. These rates are similar to those reported for three NHS Boards (GGC, LO and LN) in the 2007 NESI survey(5) and are also consistent with those reported by IDUs in the rest of the UK(6). The sharing of other injecting equipment, other than needles/syringes, however, remains highly prevalent across all NHS Boards, even among those respondents who report never having shared needles/syringes.
3. HCV prevalence remains high among IDUs across Scotland: overall, over half of the IDUs surveyed had been infected with HCV. There was, however, substantial geographical variation in prevalence, ranging from 31% in LO to 70% in GGC. In order to estimate the rate of new infections, the prevalence of HCV among young and recent onset IDUs can be used, since these individuals are more likely to represent recent exposure to infection. These indicators suggest that the rates of new HCV infection in Scotland are considerable, but, similarly, are subject to regional variation. IDUs aged <25 years in GGC, FV, DG, LN and GR were approximately twice as likely to be HCV-infected than young IDUs in the other board areas. Almost half of respondents in GGC and AA had acquired infection within 5 years of having commencing injecting drug use; this compares with only around 20% of participants in LO and TY who had acquired infection within 5 years. The survey suggests gender differences in HCV prevalence, with a slightly higher rate among female respondents compared to males.
4. Incidence of HCV infection in the past has been estimated mainly through cohort studies where individuals are followed up over a period of time and serial samples are tested. This method can be costly and individuals can be lost to follow up. The Dried Blood Spot (DBS) testing approach to determine incidence, as applied here, only requires a sample at a single point in time, and thus is potentially more cost effective.
This survey found a total of 21 respondents to be HCV antibody negative and RNA positive, indicating recently acquired HCV infection. Based on these data, we estimate that the incidence of HCV infection was 12 per 100 person years among respondents. Similar rates have been estimated among IDUs in England, with an incidence of 12.9 per 100 person years(7). Previously estimated rates in Scotland ranged from 11.9 per 100 person years among a prison population(8) to 29 per 100 person years among recent onset injectors in Glasgow(9).
5. The high prevalence of undiagnosed HCV infection in all NHS Boards remains a concern; those who perceive themselves to be HCV-negative and those who have never been tested account for a large proportion of the undiagnosed individuals. With respect to the latter, approximately one in five respondents overall had never been tested for HCV. With respect to the former, only around a third of respondents reported having been recently tested for HCV (in the past year); it is likely that many undiagnosed IDUs acquired their infection subsequent to the past HCV-negative test. The locations where most respondents report being tested for HCV were general practices, hospitals, drug treatment centres and prison.
6. Among those who reported a past diagnosis of HCV, overall 60% had been referred to hospital for their infection, consistent with rates reported by IDUs surveyed in 2007. Among those referred to hospital, overall 70% reported attending the appointment which is higher than the proportion previously reported (53%)(5).
7. Consistent with the low reported rates of sharing needles/syringes, there was a reasonably high reported uptake of sterile needles/syringes from needle exchanges. The majority of these needles/syringes

6 Needle Exchange Surveillance Initiative (NESI) 2008/2009 Report
were obtained from either a fixed site exchange or pharmacy exchange, with the minority of needles/syringes obtained either through an outreach service or a secondary source. Although the numbers of needles/syringes obtained from other people were small, it highlights the role of peers in the distribution of needles/syringes.
A large proportion of respondents reported obtaining acidifiers, wipes/swabs, and sharps bins; consistent with previous data collected in the 2007 NESI survey(5). Recent uptake of other injecting paraphernalia from needle exchanges, however, varied; in particular, high uptake of filters and cookers/spoons was achieved in TY, DG and LO NHS Boards. This likely reflects the availability of the items at needle exchange facilities in different NHS Boards during June 2008 to June 2009.
8. Uptake of other harm reduction services among the IDUs interviewed was generally high. A large proportion of respondents had been in contact with drug services in the past; 72% of the total sample and 67% of current IDUs reported being prescribed methadone in the last six months. This finding suggests that a substantial proportion of injectors continue to inject while on opiate substitution treatment (OST), and has implications for services that provide both OST and injecting equipment. Hepatitis B vaccine coverage (at least one dose) was 68% overall, but ranged from just over one third to three quarters of respondents; this is consistent with earlier surveys of IDUs in Scotland(5) and is similar to the rates reported elsewhere in the United Kingdom(6).
9. Although nearly one in five respondents had been imprisoned in the last six months, only 4% of these individuals, overall, reported having injected while in prison. This may be attributable to the limited availability of drugs in prison and/or the uptake of treatment for drug addiction whilst in prison. Due to the lack of availability of sterile injecting equipment (particularly needles/syringes), injecting events in prison would likely involve shared equipment; however, the data presented
here are based on very small numbers of injecting events in prison and should therefore be treated with caution.

7Needle Exchange Surveillance Initiative (NESI) 2008/2009 Report
Table 1. Sample cha
racteristics
a defi
ned
as liv
ing in a hostel for the homeless, having no fixed abode, or liv
ing on the streets
b among injectors who rep
orted
injecting drugs in
the last six m
onths
c percentage
s will add up to m
ore than
100% as individuals may
have reported
use of more than
one drug
d Other in
cludes Perform
ance and Im
age En
han
cing drugs, A
ntihistamines, K
etam
ine an
d Ecstasy
e during the months when
injecting
Number of respondents
NHS Board
Scotland
overall total
N = 2563
GGC
GR
LOLN
TY
AA
FFFV
DG
HG/BR
N = 947
N = 472
N = 311
N = 200
N = 192
N = 138
N = 104
N = 89
N = 67
N = 43
Gen
der
Male
681 (72%)
361 (77%
)234 (75
%)
137 (69%)
136 (71%)
86 (62%)
69 (66%)
58 (65%)
43 (64%)
32 (74
%)
1837 (72%)
Female
261 (28%)
104 (22%)
76 (25%)
63 (32%)
56 (29%)
52 (38%)
35 (34%)
31 (35%)
24 (36%)
11 (26%)
713 (28%)
No response
5 (1%
)7 (2%)
1 (0%)
0 (0%)
0 (0%)
0 (0%)
0 (0%)
0 (0%)
0 (0%)
0 (0%)
13 (1%
)
Age
(ye
ars)
Mea
n/m
edian
34.9/34.6
32.4/31.9
32.3/31.5
33.2/33.0
31.3/30.6
34.5/33.8
33.1/31.6
33.5/32.3
31.4/30.1
29.7/28.8
33.4/32.9
Age
group
16-25 yrs
89 (9%)
73 (15%)
61 (20%)
25 (13
%)
50 (25%)
15 (11%)
14 (13
%)
10 (11%)
14 (21%
)17 (40%)
368 (14
%)
26-30 yrs
159 (17%)
136 (29%)
89 (29%)
52 (26%)
51 (27%
)27 (19%)
34 (33%)
29 (33%)
28 (42%)
6 (14
%)
611 (24
%)
31-35 yrs
301 (32%)
135 (29%)
70 (23%)
60 (30%)
40 (21%
)45 (33%)
19 (18
%)
24 (27%
)15 (22%)
12 (28%)
721 (28%)
>35 yrs
398 (42%)
128 (27%
)91 (29%)
63 (32%)
51 ( 27%
)51 (37%
)37 (36%)
26 (29%)
10 (15%)
8 (19
%)
863 (34%)
Homeless in the last 6 m
onthsa
Yes
303 (32%)
98 (21%
)96 (31%
) 41 (21%
) 48 (25%)
36 (26%)
23 (22%)
19 (21%
) 13 (19
%)
16 (37%
) 693 (27%
)
No
643 (68%)
374
(79
%)
215 (69%)
159 (80%)
144 (75
%)
102 (74
%)
81 (78%)
70 (79
%)
53 (79
%)
27 (63%)
1868 (73
%)
No response
1 (0%)
0 (0%)
0 (0%)
0 (0%)
0 (0%)
0 (0%)
0 (0%)
0 (0%)
1 (2%)
0 (0%)
2 (0%)
Age
first injected
(ye
ars)
Mea
n/m
edian
22.8/21.0
21.7/21.0
23.3/22.0
23.7/22.5
22.2/21.0
24.4/23.0
23.3/22.5
22.8/22.0
21.0/20.0
22.4/19.0
22.7/21.0
Age
first injected
8-15 yrs
99 (10
%)
35 (7%
)20 (6%)
10 (5%)
19 (10
%)
9 (7%
)4 (4%)
5 (6%)
6 (9%)
4 (9%)
211 (8%)
16-18 yrs
186 (20%)
133 (28%)
64 (21%
)35 (18
%)
43 (22%)
24 (17%)
29 (28%)
19 (21%
)22 (33%)
13 (30%)
568 (22%)
19-21 yrs
193 (20%)
111 (24%)
56 (18
%)
40 (20%)
40 (21%
)17 (12%)
13 (12%)
19 (21%
)12 (18
%)
6 (14
%)
507 (20%)
22-25 yrs
195 (21%
)87 (18%)
72 (23%)
44 (22%)
41 (21%
)34 (25%)
24 (23%)
24 (27%
)15 (22%)
5 (12%)
541 (21%
)
>25 yrs
274
(29%)
106 (23%)
99 (32%)
71 (36%)
49 (26%)
54 (39%)
34 (33%)
22 (25%)
12 (18
%)
15 (35%)
736 (29%)
Tim
e since onset of injecting (yea
rs)
Mea
n/m
edian
11.6/10.4
10.2/9.8
8.6/7
9.1/8.4
8.6/6.1
9.6/8.5
9.3/8.6
10.2/9.9
9.9/9.3
6.8/5.3
10.2/9
Tim
e since onset of injecting
<2 yrs
96 (10
%)
39 (8%)
46 (15%)
18 (9%)
37 (19%)
19 (14
%)
11 (11%)
7 (8%)
7 (10%)
8 (19
%)
288 (11%)
2-5 yrs
152 (16
%)
101 (21%
)91 (29%)
45 (23%)
57 (30%)
24 (17%)
22 (21%
)12 (13
%)
10 (14
%)
16 (37%
)530 (21%
)
6-10 yrs
256 (27%
)131 (28%)
97 (31%
)71 (36%)
42 (22%)
39 (28%)
37 (36%)
37 (42%)
28 (42%)
11 (26%)
749 (29%)
11-15 yrs
205 (22%)
125 (27%
)31 (10%)
49 (25%)
20 (10
%)
33 (24
%)
26 (25%)
20 (22%)
14 (21%
)5 (12%)
528 (21%
)
>15 yrs
236 (25%)
76 (16
%)
46 (15%)
17 (9%)
36 (19
%)
23 (17%)
8 (8%)
13 (15%)
8 (12%)
3 (7%
)466 (18
%)
No response
2 (0%)
0 (0%)
0 (0%)
0 (0%)
0 (0%)
0 (0%)
0 (0%)
0 (0%)
0 (0%)
0 (0%)
2 (0%)
Injected in the last 6 months
N = 704 (74%)
N = 421 (89%)
N = 275 (88%)
N = 149 (75%)
N = 162 (84%)
N = 110 (80%)
N = 81 (78%)
N = 65 (73%)
N = 52 (78%)
N = 41 (95%)
N = 2060 (80%)
Drugs in
jected
in the last 6 m
onthsb
,cHeroin
660 (94%)
413
(98%)
267 (97%
) 147 (99%)
155 (96%)
107 (97%
) 79 (98%)
64 (99%)
52 (10
0%)
41 (100%)
1985 (96%)
Cocaine
220 (31%
) 25 (6%)
16 (6%)
17 (11%
)12 (7%
) 12 (11%)
11 (14%)
6 (9%)
8 (15%)
6 (15%)
333 (16
%)
Crack
31 (4%)
66 (16
%)
6 (2%)
2 (1%
) 3 (2%)
3 (3%)
2 (3%)
1 (2%)
0 (0%)
3 (7%
)117 (6%)
Amphetam
ines
24 (3%)
10 (2%)
10 (4%)
7 (5%)
13 (8%)
4 (4%)
12 (15%)
12 (19
%)
2 (4%)
3 (7%
) 97 (5%)
Temazep
am/ Diazepam
12 (2%)
8 (2%)
2 (1%
) 0 (0%)
4 (3%)
1 (1%)
2 (3%)
0 (0%)
1 (2%)
1 (2%)
31 (2%)
Other
d25 (4%)
11 (3%)
8 (3%)
1 (1%
)11 (7%
)3 (3%)
6 (7%
)2 (3%)
1 (2%)
2 (5%)
70 (3%)
Average
frequen
cy of injecting in the last 6 m
onthsb
,eLess than
wee
kly
120 (17%)
58 (14
%)
41 (15%)
29 (20%)
40 (25%)
11 (10%)
23 (29%)
16 (25%)
10 (19
%)
9 (22%)
357 (17%
)
Wee
kly not daily
155 (22%)
71 (17%)
66 (24
%)
28 (19
%)
26 (16
%)
20 (18
%)
14 (17%)
13 (20%)
12 (23%)
9 (22%)
414
(20%)
Daily or more
429 (61%
) 292 (69%)
168 (61%
)92 (62%)
96 (59%)
79 (72
%)
44 (54%)
36 (55%)
30 (58%)
23 (56%)
1289 (63%)

8 Needle Exchange Surveillance Initiative (NESI) 2008/2009 Report
Table 2. Se
lf-rep
orted
injecting risk beh
aviour
Number of respondents who injected in the last six months
NHS Board
Scotland
overall total
N = 2060
GGC
GR
LOLN
TY
AA
FFFV
DG
HG/BR
N = 704
N = 421
N = 275
N = 149
N = 162
N = 110
N = 81
N = 65
N = 52
N = 41
Injected
with a nee
dle/syringe
that had
bee
n
previously used by someo
ne else a
In the last m
onth
57 (8%)
45 (11%)
15 (6%)
7 (5%)
17 (11%)
13 (12%)
8 (10
%)
10 (15%)
2 (4%)
3 (7%
)177 (9%)
In the last six m
onths but not in the last m
onth
36 (5%)
38 (9%)
9 (3%)
7 (5%)
13 (8%)
7 (6%)
6 (7%
)2 (3%)
3 (6%)
1 (2%)
122 (6%)
In the past but not in the last six m
onths
216
(31%
)132 (32%)
77 (28%)
41 (28%)
54 (33%)
29 (26%)
25 (31%
)25 (39%)
23 (44%)
13 (32%)
635 (31%
)
Never
388 (55%)
202 (48%)
171 (62%)
91 (61%
)78
(48%)
61 (56%)
42 (52%)
28 (43%)
24 (46%)
23 (56%)
1108 (54%)
No response
7 (1%)
4 (1%
)3 (1%
)3 (2%)
0 (0%)
0 (0%)
0 (0%)
0 (0%)
0 (0%)
1 (2%)
18 (1%
)
How often
used a new
nee
dle/syringe
in the last six
months a
For all injections
378
(54%)
120 (28%)
92 (34%)
55 (37%
)72
(44%)
33 (30%)
40 (49%)
27 (42%)
22 (42%)
19 (46%)
858 (42%)
Most in
jections
247 (35%)
209 (50%)
146 (53%)
78 (52%)
81 (50%)
61 (56%)
33 (41%
)29 (45%)
24 (46%)
12 (29%)
920 (45%)
Half of injections
43 (6%)
60 (14
%)
24 (9%)
9 (6%)
4 (3%)
10 (9%)
5 (6%)
6 (9%)
3 (6%)
8 (20%)
172 (8%)
Some injections
31 (4%)
30 (7%
)13
(5%)
7 (5%)
5 (3%)
6 (6%)
3 (4%)
2 (3%)
3 (6%)
2 (5%)
102 (5%)
Never
4 (1%
)2 (1%
)0 (0%)
0 (0%)
0 (0%)
0 (0%)
0 (0%)
1 (2%)
0 (0%)
0 (0%)
7 (0%)
No response
1 (0%)
0 (0%)
0 (0%)
0 (0%)
0 (0%)
0 (0%)
0 (0%)
0 (0%)
0 (0%)
0 (0%)
1 (0%)
Number of different peo
ple used nee
dles/syringe
s were received
from in
the last six m
onths a
More than
five
5 (1%
)1 (0%)
0 (0%)
0 (0%)
0 (0%)
1 (1%)
1 (1%
)0 (0%)
1 (2%)
0 (0%)
9 (0%)
Two to five
25 (4%)
32 (8%)
4 (2%)
2 (1%
)8 (5%)
5 (5%)
3 (4%)
4 (6%)
2 (4%)
2 (5%)
87 (4%)
One
59 (8%)
51 (12%)
18 (7%
)12 (8%)
22 (14
%)
13 (12%)
10 (12%)
8 (12%)
2 (4%)
3 (7%
)19
8 (10
%)
None
594 (84%)
336 (80%)
249 (91%
)132 (89%)
132 (82%)
90 (82%)
67 (83%)
53 (82%)
47 (90%)
36 (88%)
1736 (84%)
No response
21 (3%)
1 (0%)
4 (2%)
3 (2%)
0 (0%)
1 (1% )
0 (0%)
0 (0%)
0 (0%)
0 (0%)
30 (2%)
Number of different peo
ple used nee
dles/syringe
s were passed on to in
the last six m
onths a
More than
five
19 (3%)
12 (3%)
2 (1%
)0 (0%)
3 (2%)
2 (2%)
0 (0%)
2 (3%)
0 (0%)
1 (2%)
41 (2%)
Two to five
44 (6%)
64 (15%)
8 (3%)
6 (4%)
26 (16
%)
6 (5%)
5 (6%)
12 (19
%)
0 (0%)
5 (12%)
176 (9%)
One
54 (8%)
46 (11%)
32 (12%)
15 (10
%)
19 (12%)
17 (16
%)
11 (14
%)
8 (12%)
3 (6%)
3 (7%
)208 (10
%)
None
573
(81%
)299 (71%)
232 (84%)
128 (86%)
114 (70
%)
85 (77
%)
65 (80%)
43 (66%)
49 (94%)
32 (78
%)
1620 (79
%)
No response
14 (2%)
0 (0%)
1 (0%)
0 (0%)
0 (0%)
0 (0%)
0 (0%)
0 (0%)
0 (0%)
0 (0%)
15 (1%
)
Used other in
jecting eq
uipmen
t that had
previously
bee
n used by someo
ne else a,b
In the last m
onth
245 (35%)
182 (43%)
80 (29%)
47 (32%)
51 (32%)
55 (50%)
31 (38%)
27 (42%)
14 (27%
)9 (22%)
741 (36%)
In the last six m
onths but not in the last m
onth
89 (13
%)
53 (13
%)
32 (12%)
19 (13
%)
16 (10
%)
6 (6%)
13 (16
%)
8 (12%)
6 (11%)
5 (12%)
247 (12%)
In the past but not in the last six m
onths
180 (26%)
88 (21%
)59 (22%)
36 (24
%)
33 (20%)
17 (16
%)
14 (17%)
14 (22%)
16 (31%
)10
(24
%)
467 (23%)
Never
179 (25%)
98 (23%)
103 (38%)
45 (30%)
62 (38%)
32 (29%)
23 (28%)
16 (25%)
16 (31%
)16
(39%)
590 (29%)
No response
11 (2%)
0 (0%)
1 (0%)
2 (1%
)0 (0%)
0 (0%)
0 (0%)
0 (0%)
0 (0%)
1 (2%)
15 (1%
)
Used other in
jecting eq
uipmen
t that had
bee
n
previously used by someo
ne else, among those who
had
never shared
nee
dles/syringe
s a,b
N = 388
N = 202
N = 171
N = 91
N = 78
N = 61
N = 42
N = 28
N = 24
N = 23
N = 1108
In the last m
onth
117 (30%)
61 (30%)
31 (18%)
25 (28%)
16 (21%
)23 (38%)
12 (29%)
5 (18
%)
3 (13
%)
7 (30%)
300 (27%
)
In the last six m
onths but not in the last m
onth
32 (8%)
27 (13%)
18 (11%)
9 (10
%)
6 (8%)
2 (3%)
5 (12%)
3 (10
%)
2 (8%)
0 (0%)
104 (9%)
In the past but not in the last six m
onths
70 (18
%)
34 (17%)
34 (20%)
17 (19
%)
11 (14
%)
8 (13
%)
6 (14
%)
5 (18
%)
5 (21%
)2 (9%)
192 (17%)
Never
161 (42%)
80 (40%)
87 (51%
)40 (44%)
45 (58%)
28 (46%)
19 (45%)
15 (54%)
14 (58%)
14 (61%
)503 (45%)
No response
8 (2%)
0 (0%)
1 (1%)
0 (0%)
0 (0%)
0 (0%)
0 (0%)
0 (0%)
0 (0%)
0 (0%)
9 (1%
)
Used a spoon or co
ntainer for mixing which had
bee
n
previously used by someo
ne else a,c
In the last m
onth
90 (23%)
52 (26%)
27 (16%)
24 (26%)
11 (14
%)
18 (30%)
10 (24
%)
4 (14
%)
2 (8%)
5 (22%)
243 (22%)
In the last six m
onths but not in the last m
onth
26 (7%
)29 (14
%)
15 (9%)
8 (9%)
5 (6%)
4 (7%
)5 (12%)
3 (11%)
2 (8%)
0 (0%)
97 (9%)
In the past but not in the last six m
onths
72 (19
%)
30 (15%)
34 (20%)
17 (19
%)
10 (13
%)
9 (15%)
7 (17%
)6 (21%
)6 (25%)
2 (9%)
193 (17%)
Never
195 (50%)
91 (45%)
95 (56%)
42 (46%)
52 (67%
)30 (49%)
20 (48%)
15 (54%)
14 (58%)
16 (70
%)
570
(51%)
No response
5 (1%
)0 (0%)
0 (0%)
0 (0%)
0 (0%)
0 (0%)
0 (0%)
0 (0%)
0 (0%)
0 (0%)
5 (0%)
Used a filter which had
bee
n previously used by
someo
ne else a,c
In the last m
onth
71 (18
%)
37 (18%)
15 (9%)
13 (14
%)
12 (15%)
13 (21%
)7 (17%
)3 (11%)
1 (4%)
5 (22%)
177 (16%)
In the last six m
onths but not in the last m
onth
20 (5%)
18 (9%)
8 (5%)
4 (4%)
3 (4%)
1 (2%)
3 (7%
)0 (0%)
1 (4%)
0 (0%)
58 (5%)
In the past but not in the last six m
onths
53 (14
%)
23 (11%)
23 (14
%)
8 (9%)
7 (9%)
2 (3%)
7 (17%
)3 (11%)
2 (8%)
1 (4%)
129 (12%)
Never
241 (62%)
124 (61%
)125 (73
%)
66 (73
%)
56 (72
%)
45 (74
%)
25 (60%)
22 (79
%)
20 (83%)
17 (74
%)
741 (67%
)
No response
3 (1%
)0 (0%)
0 (0%)
0 (0%)
0 (0%)
0 (0%)
0 (0%)
0 (0%)
0 (0%)
0 (0%)
3 (0%)
Prepared
drugs or rinsed nee
dles/syringe
s with water
that had
alrea
dy bee
n used by someo
ne else a,c
In the last m
onth
79 (20%)
29 (14
%)
18 (11%)
13 (14
%)
10 (13
%)
14 (23%)
6 (14
%)
4 (14
%)
1 (4%)
4 (17%)
178 (16
%)
In the last six m
onths but not in the last m
onth
18 (5%)
4 (2%)
13 (8%)
5 (6%)
3 (4%)
1 (2%)
3 (7%
)2 (7%
)1 (4%)
0 (0%)
50 (5%)
In the past but not in the last six m
onths
46 (12%)
20 (10
%)
18 (11%)
7 (8%)
6 (8%)
4 (7%
)2 (5%)
4 (14
%)
2 (8%)
0 (0%)
109 (10
%)
Never
237 (61%
)14
9 (74
%)
121 (71%
)66 (73
%)
59 (76
%)
42 (69%)
31 (74%)
18 (64%)
20 (83%)
19 (83%)
762 (69%)
No response
8 (2%)
0 (0%)
1 (1%)
0 (0%)
0 (0%)
0 (0%)
0 (0%)
0 (0%)
0 (0%)
0 (0%)
9 (1%
)

9Needle Exchange Surveillance Initiative (NESI) 2008/2009 Report
Table 2. continue
d
a am
ong injectors who rep
orted
injecting drugs in
the last six m
onths
b other in
jecting eq
uipmen
t may
include spoons/co
okers, fi
lters or water
c among those who had
never shared
nee
dle/syringe
sd any injecting eq
uipmen
t includes nee
dles/syringe
s, spoons/co
okers, fi
lters or water
Number of respondents who injected in the last six months
NHS Board
Scotland
overall total
N = 2060
GGC
GR
LOLN
TY
AA
FFFV
DG
HG/BR
N = 704
N = 421
N = 275
N =149
N = 162
N = 110
N = 81
N = 65
N = 52
N = 41
Shared
any injecting eq
uipmen
t with a known HCV-
positive person a,d
In the last m
onth
In the last six m
onths but not in the last m
onth
In the past but not in the last six m
onths
Never
No response
57 (8%)
19 (3%)
57 (8%)
548 (78
%)
23 (3%)
32 (8%)
17 (4%)
41 (10%)
325 (77
%)
6 (1%
)
10 (4%)
3 (1%
)18
(7%
)24
1 (88%)
3 (1%
)
8 (5%)
2 (1%
)11 (7%
)122 (82%)
6 (4%)
8 (5%)
4 (3%)
8 (5%)
142 (88%)
0 (0%)
4 (4%)
0 (0%)
3 (3%)
103 (94%)
0 (0%)
6 (7%
)3 (4%)
3 (4%)
69 (85%)
0 (0%)
6 (9%)
2 (3%)
10 (15%)
47 (72%)
0 (0%)
0 (0%)
1 (2%)
4 (8%)
46 (89%)
1 (2%)
0 (0%)
0 (0%)
1 (2%)
40 (98%)
0 (0%)
131 (6%)
51 (3%)
156 (8%)
1683 (82%)
39 (2%)
Injected
with a nee
dle/syringe
that were not sure was
own a
In the last six m
onths
76 (11%)
50 (12%)
35 (13
%)
14 (9%)
24 (15%)
15 (14
%)
14 (17%)
13 (20%)
5 (10
%)
4 (10
%)
250 (12%)
In the past but not in the last six m
onths
108 (15%)
75 (18
%)
35 (13
%)
16 (11%)
25 (15%)
15 (14
%)
9 (11%)
16 (25%)
8 (15%)
6 (15%)
313
(15%)
Never
495 (70
%)
286 (68%)
199 (72
%)
115 (77
%)
109 (67%
)79
(72
%)
55 (68%)
36 (55%)
38 (73
%)
29 (71%)
1441 (70%)
No response
25 (4%)
10 (2%)
6 (2%)
4 (3%)
4 (3%)
1 (1%)
3 (4%)
0 (0%)
1 (2%)
2 (5%)
56 (3%)
Number of times on average
reu
sed the same
nee
dle/syringe
before discarding it in
the last six
months a
Once or tw
ice
233 (33%)
208 (49%)
126 (46%)
75 (50%)
57 (35%)
38 (35%)
21 (26%)
25 (38%)
19 (39%)
17 (42%)
819
(40%)
Three to five tim
es93 (13
%)
80 (19
%)
44 (16
%)
17 (11%)
23 (14
%)
20 (18
%)
13 (16
%)
8 (12%)
9 (17%)
5 (12%)
312 (15%)
More than
five tim
es93 (13
%)
21 (5%)
10 (4%)
4 (3%)
9 (6%)
16 (15%)
5 (6%)
5 (8%)
2 (4%)
0 (0%)
165 (8%)
Never
278
(40%)
108 (26%)
93 (34%)
53 (36%)
73 (45%)
36 (33%)
42 (52%)
27 (42%)
22 (42%)
19 (46%)
751 (37%
)
Don’t Know/N
o response
7 (1%)
4 (1%
)2 (1%
)0 (0%)
0 (0%)
0 (0%)
0 (0%)
0 (0%)
0 (0%)
0 (0%)
13 (0%)
Injected
by someo
ne else after they
had
injected
them
selves or others, in
the last six m
onths a
Yes
113 (16
%)
72 (17%)
39 (14
%)
24 (16
%)
35 (22%)
15 (14
%)
17 (21%
)14
(22%)
16 (31%
)6 (15%)
351 (17%)
No
589 (84%)
344 (82%)
235 (86%)
125 (84%)
127 (78%)
95 (86%)
64 (79
%)
51 (79
%)
36 (69%)
35 (85%)
1701 (83%)
No response
2 (0%)
5 (1%
)1 (0%)
0 (0%)
0 (0%)
0 (0%)
0 (0%)
0 (0%)
0 (0%)
0 (0%)
8 (0%)

10 Needle Exchange Surveillance Initiative (NESI) 2008/2009 Report
Table 3. Im
prisonm
ent a
nd injecting in prison
a since commen
cing injecting drug use
b among those who were in prison in
the last six m
onths
* indicates values that have bee
n suppressed
due to potential risk of disclosure
Number of respondents
NHS Board
Scotland
overall total
N = 2563
GGC
GR
LOLN
TY
AA
FFFV
DG
HG/BR
N = 947
N = 472
N = 311
N = 200
N = 192
N = 138
N = 104
N = 89
N = 67
N = 43
Last in
Prisona
In the last six m
onths
165 (17%)
80 (17%)
42 (14
%)
30 (15%)
38 (20%)
32 (23%)
10 (10
%)
9 (10
%)
12 (18
%)
9 (21%
)427 (17%
)
In the past but not in the last 6 m
onths
449 (47%
)171 (36%)
125 (40%)
76 (38%)
70 (36%)
57 (41%
)46 (44%)
46 (52%)
27 (40%)
12 (28%)
1079
(42%)
Never im
prisoned
332 (35%)
221 (47%
)14
4 (46%)
94 (47%
)84 (44%)
48 (35%)
48 (46%)
33 (37%
)28 (42%)
22 (51%)
1054 (41%
)
Don’t Know/N
o Response
1 (0%)
0 (0%)
0 (0%)
0 (0%)
0 (0%)
1 (1%)
0 (0%)
1 (1%)
0 (0%)
0 (0%)
3 (0%)
Injected
in prison in
the last 6 m
onthsb
N = 427
Yes
**
**
**
**
**
19 (4%)
No
**
**
**
**
**
408 (96%)

11Needle Exchange Surveillance Initiative (NESI) 2008/2009 Report
Table 4. Uptake of h
arm red
uction services
Number of respondents
NHS Board
Scotland
overall total
N = 2563
GGC
GR
LOLN
TY
AA
FFFV
DG
HG/BR
N = 947
N = 472
N = 311
N = 200
N = 192
N = 138
N = 104
N = 89
N = 67
N = 43
Hep
atitis B vaccination uptake
3+ doses
493 (52%)
230 (49%)
196 (63%)
149 (75
%)
75 (39%)
37 (27%
)38 (37%
)53 (60%)
45 (67%
)19
(44%)
1335 (52%)
2 doses
86 (9%)
62 (13
%)
32 (10
%)
8 (4%)
19 (10
%)
10 (7%
)14
(14
%)
8 (9%)
3 (5%)
4 (9%)
246 (10
%)
1 dose
52 (6%)
33 (7%
)16
(5%)
4 (2%)
15 (8%)
3 (2%)
12 (12%)
5 (6%)
3 (5%)
3 (7%
)14
6 (6%)
Never vaccinated
246 (26%)
136 (29%)
54 (17%)
28 (14
%)
81 (42%)
75 (54%)
38 (37%
)22 (25%)
12 (18
%)
17 (40%)
709 (28%)
Don’t Know/N
o Response
70 (7%
)11 (2%)
13 (4%)
11 (6%)
2 (1%
)13
(9%)
2 (2%)
1 (1%)
4 (6%)
0 (0%)
127 (5%)
Tested
for HCV
In the last 12 m
onths
243 (26%)
146 (31%
)16
0 (51%)
77 (39%)
70 (37%
)38 (28%)
52 (50%)
43 (48%)
40 (60%)
23 (54%)
892 (35%)
In the past but not in the last 12 m
onths
435 (46%)
200 (42%)
92 (30%)
73 (37%
)68 (35%)
43 (31%
)39 (38%)
27 (30%)
19 (28%)
12 (28%)
1008 (39%)
Never tested
225 (24
%)
107 (23%)
46 (15%)
40 (20%)
51 (27%
)44 (32%)
13 (13
%)
18 (20%)
6 (9%)
7 (16%)
557 (22%)
Don’t Know/N
o Response
44 (5%)
19 (4%)
13 (4%)
10 (4%)
3 (2%)
13 (9%)
0 (0%)
1 (1%)
2 (3%)
1 (2%)
106 (4%)
Where last tested for HCV
N = 678
N = 346
N = 252
N = 150
N = 138
N = 81
N = 91
N = 70
N = 59
N = 35
N = 1900
GP
164 (24
%)
122 (35%)
114 (45%)
26 (17%)
50 (36%)
16 (20%)
16 (18
%)
12 (17%)
13 (22%)
13 (37%
)546 (29%)
Hospital
195 (29%)
75 (22%)
37 (15%)
39 (26%)
33 (24
%)
27 (33%)
18 (20%)
18 (26%)
16 (27%
)6 (17%)
464 (24
%)
Drug Trea
tmen
t 13
8 (20%)
34 (10
%)
48 (19
%)
60 (40%)
13 (9%)
14 (17%)
27 (30%)
33 (47%
)22 (37%
)7 (20%)
396 (21%
)
Prison
140 (21%
)64 (19
%)
22 (9%)
23 (15%)
22 (16
%)
17 (21%
)16
(18
%)
7 (10%)
8 (14
%)
8 (23%)
327 (17%
)
Other
39 (6%)
51 (15%)
31 (12%)
2 (1%
)20 (15%)
7 (5%)
14 (15%)
0 (0%)
0 (0%)
1 (3%)
165 (9%)
Don’t Know/N
o Response
2 (0%)
0 (0%)
0 (0%)
0 (0%)
0 (0%)
0 (0%)
0 (0%)
0 (0%)
0 (0%)
0 (0%)
2 (0%)
Tested
for HIV
N = 947
N = 472
N = 311
N = 200
N = 192
N = 138
N = 104
N = 89
N = 67
N = 43
N = 2563
In the last 12 m
onths
222 (23%)
120 (25%)
147 (47%
)71 (36%)
54 (28%)
32 (23%)
36 (35%)
31 (35%)
33 (49%)
20 (47%
)76
6 (30%)
In the past but not in the last 12 m
onths
389 (41%
)18
7 (40%)
107 (34%)
75 (38%)
81 (42%)
30 (22%)
39 (38%)
32 (36%)
21 (31%
)10
(23%)
971 (38%)
Never tested
299 (32%)
161 (34%)
47 (15%)
44 (22%)
57 (30%)
58 (42%)
27 (26%)
25 (28%)
10 (15%)
11 (26%)
739 (29%)
Don’t Know/N
o Response
37 (4%)
4 (1%
) 10 (3%)
10 (5%)
0 (0%)
18 (13
%)
2 (2%)
1 (1%)
3 (5%)
2 (5%)
87 (3%)
Received prescribed
methad
one
In the last six m
onths
759 (80%)
259 (55%)
215 (69%)
170 (85%)
115 (60%)
89 (65%)
86 (83%)
59 (66%)
62 (93%)
21 (49%)
1835 (72
%)
In the past but not in the last six m
onths
112 (12%)
109 (23%)
55 (18
%)
22 (11%)
25 (13
%)
15 (11%)
11 (11%)
15 (17%)
3 (5%)
6 (14
%)
373
(15%)
Never prescribed
76 (8%)
104 (22%)
41 (13%)
8 (4%)
52 (27%
)34 (25%)
7 (7%)
15 (17%)
2 (3%)
16 (37%
)355 (14
%)
Received prescribed
methad
one (curren
t IDUs only)
N = 704
N = 421
N = 275
N = 149
N = 162
N = 110
N = 81
N = 65
N = 52
N = 41
N = 2060
In the last six m
onths
538 (76
%)
217 (52%)
183 (67%
)123 (83%)
86 (53%)
62 (56%)
64 (79
%)
38 (59%)
47 (90%)
20 (49%)
1378
(67%
)
In the past but not in the last six m
onths
99 (14
%)
104 (25%)
52 (19
%)
20 (13
%)
25 (15%)
14 (13
%)
11 (14
%)
13 (20%)
3 (6%)
6 (15%)
347 (17%
)
Never prescribed
67 (10%)
100 (24
%)
40 (15%)
6 (4%)
51 (32%)
34 (31%
)6 (7%
)14
(22%)
2 (4%)
15 (37%
)335 (16
%)
Received drug trea
tmen
t other than
methad
onea
N = 947
N = 472
N = 311
N = 200
N = 192
N = 138
N = 104
N = 89
N = 67
N = 43
N = 2563
In the last six m
onths
574
(61%
)114 (24
%)
198 (64%)
180 (90%)
127 (66%)
86 (62%)
78 (75
%)
75 (84%)
58 (87%
)21 (49%)
1511 (59%)
In the past but not in the last six m
onths
157 (17%
)153 (32%)
57 (18%)
14 (7%
)35 (18
%)
8 (6%)
13 (13
%)
5 (6%)
8 (12%)
6 (14
%)
456 (18
%)
Never received treatmen
t213
(23%)
204 (43%)
56 (18
%)
6 (3%)
30 (16
%)
44 (32%)
13 (13
%)
9 (10
%)
1 (1%)
16 (37%
)592 (23%)
No Response
3 (0%)
1 (0%)
0 (0%)
0 (0%)
0 (0%)
0 (0%)
0 (0%)
0 (0%)
0 (0%)
0 (0%)
4 (0%)
Number of sterile nee
dles/syringe
s obtained
per wee
k from a nee
dle exchan
ge in
the last
six monthsb
,c
N = 704
N = 421
N = 275
N = 149
N = 162
N = 110
N = 81
N = 65
N = 52
N = 41
N = 2060
35+ per wee
k10
9 (16
%)
79 (19
%)
40 (15%)
19 (13
%)
16 (10
%)
31 (28%)
16 (20%)
12 (19
%)
7 (13%)
8 (20%)
337 (16%)
21-34 per wee
k75
(11%)
53 (13
%)
33 (12%)
18 (12%)
30 (19
%)
29 (26%)
4 (5%)
7 (11%
)4 (8%)
6 (15%)
259 (13
%)
14-20 per wee
k16
4 (23%)
95 (23%)
78 (28%)
29 (20%)
32 (20%)
19 (17%)
20 (25%)
16 (25%)
11 (21%
)11 (27%
)475
(23%)
7-13
per wee
k14
6 (21%
)79
(19
%)
38 (14
%)
33 (22%)
29 (18
%)
6 (6%)
12 (15%)
2 (3%)
12 (23%)
5 (12%)
362 (18
%)
1- 6 per wee
k 14
1 (20%)
79 (19
%)
73 (27%
)39 (26%)
46 (28%)
17 (16
%)
23 (28%)
22 (34%)
15 (29%)
8 (20%)
463 (23%)
None
69 (10
%)
36 (9%)
13 (5%)
11 (7%
)9 (6%)
8 (7%
)6 (7%
)6 (9%)
3 (6%)
3 (7%
)16
4 (8%)

12 Needle Exchange Surveillance Initiative (NESI) 2008/2009 Report
Table 4. continue
d
Number of respondents
NHS Board
Scotland
overall total
N = 2060
GGC
GR
LOLN
TY
AA
FFFV
DG
HG/BR
N = 704
N = 421
N = 275
N = 149
N = 162
N = 110
N = 81
N = 65
N = 52
N = 41
Number of sterile
nee
dles/syringe
s obtained
per wee
kin the last six m
onths from other peo
ple
b, c
35+ p
er wee
k1 (0%)
0 (0%)
0 (0%)
0 (0%)
0 (0%)
2 (2%)
0 (0%)
0 (0%)
0 (0%)
0 (0%)
3 (0%)
21 to 34 per wee
k0 (0%)
2 (1%
)0 (0%)
1 (1%)
1 (1%)
1 (1%)
1 (1%)
1 (2%)
0 (0%)
0 (0%)
7 (0%)
14 – 20 per wee
k 10
(1%
)8 (2%)
1 (1%)
1 (1%)
0 (0%)
1 (1%)
0 (0%)
1 (2%)
1 (2%)
1 (2%)
24 (1%
)
7 – 13
per wee
k 11 (2%)
19 (5%)
1 (1%)
2 (1%
)2 (1%
)0 (0%)
2 (3%)
0 (0%)
2 (4%)
2 (5%)
41 (2%)
1-6 per wee
k 92 (13
%)
108 (26%)
14 (5%)
9 (6%)
23 (14
%)
6 (6%)
13 (16
%)
9 (14
%)
3 (6%)
12 (29%)
289 (14
%)
None
590 (84%)
284 (68%)
259 (94%)
136 (91%
)13
6 (84%)
100 (91%
)65 (80%)
54 (83%)
46 (89%)
26 (63%)
1696 (82%)
Average
number of sterile nee
dles/syringe
sobtained
per wee
k in the last six m
onths from
b, c
All , Mea
n (SD
)20 (26)
23 (23)
19 (20)
19 (24
) 18
(21)
30 (25)
23 (31)
20 (24
)21 (30)
39 (84)
21 (27)
Fixed site exch
ange
, Mea
n (SD
)7 (19)
15 (19
)10
(17)
7 (22)
5 (18
)13
(19
)11 (30)
7 (16)
3 (8)
23 (70
)10
(22)
Pharmacy exch
ange
, Mea
n (SD
)13
(17)
4 (9)
7 (14)
9 (13
)12 (15)
6 (13
)11 (17)
12 (20)
10 (17)
14 (21)
9 (15)
Outrea
ch/m
obile
exchan
ge, M
ean (SD
)1 (6)
2 (10
)1 (7)
1 (7)
1 (3)
10 (22)
0 (0)
1 (6)
8 (23)
0 (1)
2 (9)
Obtained
from other peo
ple, M
ean (SD
)1 (3)
2 (4)
0 (1)
1 (3)
1 (2)
1 (8)
1 (4)
1 (4)
1 (3)
2 (4)
1 (4)
Uptake of sterile
injecting eq
uipmen
t from a nee
dle
exch
ange
in the last six m
onths b, c, d
Acidifier (e.g. citric acid, V
it C)
609 (87%
)368 (87%
)254 (92%)
138 (93%)
146 (90%)
79 (72
%)
72 (89%)
17 (26%)
49 (94%)
38 (93%)
1770
(86%)
Wipes/swab
s624
(89%)
379
(90%)
259 (94%)
138 (93%)
153 (94%)
101 (92%)
75 (93%)
19 (29%)
49 (94%)
38 (93%)
1835 (89%)
Sharps bins
615 (87%
)373
(89%)
254 (92%)
137 (92%)
147 (91%
)99 (90%)
74 (91%
)57 (88%)
46 (89%)
38 (93%)
1840 (89%)
Filters
117 (17%
)9 (2%)
199 (72
%)
40 (27%
)14
4 (89%)
68 (62%)
39 (48%)
4 (6%)
48 (92%)
36 (88%)
704 (34%)
Cookers/spoons
109 (16
%)
14 (3%)
199 (72
%)
39 (26%)
144 (89%)
0 (0%)
41 (51%
)4 (6%)
48 (92%)
36 (88%)
634 (31%
)
Sterile
Water
36 (5%)
2 (1%
)6 (2%)
1 (1%)
0 (0%)
0 (0%)
0 (0%)
0 (0%)
46 (89%)
30 (73
%)
121 (6%)
Tourniquets
10 (1%
)2 (1%
)1 (0%)
0 (0%)
0 (0%)
48 (44%)
0 (0%)
0 (0%)
3 (6%)
0 (0%)
64 (3%)
Colour co
ded
syringe
s 4
7 (7%)
28 (7%
)3 (1%
)6 (4%)
7 (4%)
0 (0%)
13 (16
%)
1 (2%)
0 (0%)
13 (32%)
118 (6%)
Average
numbers of sterile
injecting eq
uipmen
t obtained
per wee
k in the last six m
onths
from an exchan
geb, c
Filters, M
ean (SD
)4 (12)
0 (3)
15 (19
)9 (23)
16 (16
)24
(25)
9 (18
)0.5 (3)
21 (29)
38 (88)
8 (21)
Cookers/spoons, M
ean (SD
)3 (10
)0 (3)
15 (19
)9 (23)
16 (16
)0 (0)
10 (21)
0.5 (3)
22 (31)
38 (88)
7 (20)
Sterile
water, M
ean (SD
)1 (8)
0 (0.5)
1 (10)
0 (1)
0 (0)
0 (0)
0 (0)
0 (0)
21 (31)
33 (89)
2 (16
)
a drug trea
tmen
t includes opiate substitute treatmen
t (excluding methad
one), d
rug co
unselling (including ad
diction worker), detox an
d residen
tial reh
abilitation
b among injectors who rep
orted
injecting drugs in
the last six m
onths
c in a typ
ical in
jecting wee
k during the last six m
onths
d percentage
s may
add up to m
ore than
100% as individuals may
have reported
obtaining more than
one item

13Needle Exchange Surveillance Initiative (NESI) 2008/2009 Report
Table 5. HCV testing
and
referral
Number of respondents
NHS Board
Scotland
overall total
N = 2563
GGC
GR
LOLN
TY
AA
FFFV
DG
HG/BR
N = 947
N = 472
N = 311
N = 200
N = 192
N = 138
N = 104
N = 89
N = 67
N = 43
Tested
for HCV (self-rep
ort of result)
Positive
296 (31%
)10
4 (22%)
64 (21%
)44 (22%)
39 (20%)
33 (24
%)
26 (25%)
23 (26%)
26 (39%)
4 (9%)
659 (26%)
Neg
ative
332 (35%)
222 (47%
)16
3 (52%)
98 (49%)
90 (47%
)43 (31%
)47 (45%)
41 (46%)
30 (45%)
29 (67%
)10
95 (43%)
Awaiting result
16 (2%)
9 (2%)
14 (5%)
2 (1%
)4 (2%)
1 (1%)
6 (6%)
4 (5%)
1 (2%)
2 (5%)
59 (2%)
Did not ge
t result
32 (3%)
11 (2%)
9 (3%)
5 (2%)
5 (3%)
6 (4%)
9 (9%)
2 (2%)
2 (3%)
0 (0%)
81 (3%)
Don’t Know/N
o response
5 (1%
)2 (1%
)2 (1%
)2 (1%
)0 (0%)
0 (0%)
3 (3%)
1 (1%)
1 (2%)
0 (0%)
16 (1%
)
Never tested
266 (28%)
124 (26%)
59 (19
%)
49 (25%)
54 (28%)
55 (40%)
13 (13
%)
18 (20%)
7 (10%)
8 (19
%)
653 (25%)
Referred to hospital for HCVa
N = 296
N = 104
N = 64
N = 44
N = 39
N = 33
N = 26
N = 23
N = 26
N = 4
N = 659
Yes
185 (63%)
50 (48%)
40 (63%)
24 (55%)
24 (62%)
20 (61%
)14
(54%)
17 (74
%)
18 (69%)
3 (75
%)
395 (60%)
No
99 (33%)
51 (49%)
20 (31%
)19
(43%)
14 (36%)
12 (36%)
11 (42%)
6 (26%)
8 (31%
)1 (25%)
241 (36%)
Don’t Know /No response
12 (4%)
3 (3%)
4 (6%)
1 (2%)
1 (3%)
1 (3%)
1 (4%)
0 (0%)
0 (0%)
0 (0%)
23 (4%)
Atten
ded
hospital appointm
entb
N = 185
N = 50
N = 40
N = 24
N = 24
N = 20
N = 14
N = 17
N = 18
N = 3
N = 395
Yes
124 (67%
)38 (76
%)
30 (75
%)
18 (75
%)
13 (54%)
15 (75
%)
10 (71%)
13 (76
%)
13 (72
%)
1 (33%)
275
(70
%)
No
57 (31%
)12 (24
%)
10 (25%)
5 (21%
)11 (46%)
5 (25%)
4 (29%)
4 (24
%)
5 (28%)
2 (67)
115 (29%)
No response
4 (2%)
0 (0%)
0 (0%)
1 (4%)
0 (0%)
0 (0%)
0 (0%)
0 (0%)
0 (0%)
0 (0%)
5 (1%
)
a am
ong participan
ts who rep
orted
they
were positive for HCV
b among participan
ts who received a referral

14 Needle Exchange Surveillance Initiative (NESI) 2008/2009 Report
Table 6. Prevalence of H
CV infection
NHS Board
Scotland
overall total
GGC
GR
LOLN
TY
AA
FFFV
DG
HG/BR
HCV-antibody prevalence
HCV-positive
N = 928
N = 469
N = 295
N = 195
N = 189
N = 135
N = 104
N = 89
N = 66
N = 43
N = 2513
651 (70
%)
241 (51%
)90 (31%
)95 (49%)
62 (33%)
79 (59%)
55 (53%)
48 (54%)
43 (65%)
9 (21%
)13
73 (55%)
HCV-antibody prevalence by ge
nder
Male
N = 667
N = 359
N = 220
N = 134
N = 135
N = 286*
N = 1801
HCV-positive
463 (69%)
180 (50%)
69 (31%
)56 (42%)
44 (33%)
151 (53%)
963 (53%)
Female
N = 256
N = 103
N = 74
N = 61
N = 54
N = 151*
N = 699
HCV-positive
186 (73
%)
56 (54%)
21 (28%)
39 (64%)
18 (33%)
83 (55%)
403 (58%)
HCV-antibody prevalence by ag
e group
Age
d <25 yea
rsN = 52
N = 58
N = 44
N = 19
N = 39
N = 46*
N = 258
HCV-positive
31 (60%)
22 (38%)
10 (23%)
9 (47%
)8 (21%
)13
(28%)
93 (36%)
Age
d 25+ yea
rsN = 876
N = 411
N = 251
N = 176
N = 150
N = 391*
N = 2255
HCV-positive
620 (71%)
219
(53%)
80 (32%)
86 (49%)
54 (36%)
221 (57%
)1280 (57%
)
HCV-antibody prevalence by time since onset of
injecting
<3.0 yea
rsN = 124
N = 56
N = 68
*N = 58
N = 94*
N = 400
HCV-positive
40 (32%)
14 (25%)
13 (19
%)
*6 (10
%)
24 (26%)
97 (24%)
<5.0 yea
rsN = 200
N = 109
N = 108
*N = 82
N = 161*
N = 659
HCV-positive
87 (44%)
37 (34%)
23 (21%
)*
14 (17%)
47 (29%)
208 (32%)
Diagn
osed and undiagn
osed HCV in
fectiona
N = 651
N = 241
N =90
N = 95
N = 62
N = 234*
N = 1373
Self-rep
orted
HCV-positive
287 (44%)
100 (41%
)54 (60%)
43 (45%)
34 (55%)
109 (47%
)627 (46%)
Self-rep
orted
HCV-neg
ative
170 (26% )
87 (36%)
21 (23%)
31 (33%)
17 (27%
)63 (27%
)389 (28%)
Self-rep
orted
unaw
are
194 (30%)
54 (22%)
15 (17%)
21 (22%)
11 (18
%)
62 (26%)
357 (26%)
a am
ong those who tested positive for HCV antibodies
* Data have bee
n agg
rega
ted due to the potential risk of disclosure; d
ata on HCV-antibody prevalence by the time since onset of injecting for Lanarkshire (LN) have bee
n combined
with those from other N
HS Boards (AA, FF, FV, D
G, H
G and BR).

15Needle Exchange Surveillance Initiative (NESI) 2008/2009 Report
Acknowledgements:
We would like to thank the following people for their support and assistance in carrying out this survey:
NHS Board Hepatitis C Prevention/Executive Leads;
Tony Bimpson and Linda MacDonald at the West of Scotland Specialist Virology Centre;
Vivian Hope at the Health Protection Agency and the Centre for Research on Drugs & Health Behaviour, London School of Hygiene & Tropical Medicine;
Ayrshire & Arran
Marie Foye and staff at the Bentinck Centre, Kilmarnock;
Staff at all participating Ayrshire pharmacies and health centres;
Borders
Pat Joyce and staff at Turning Point, Big River Project, Galashiels;
Dumfries & Galloway
Lynda Tweddle, Blood Borne Virus Health Improvement and Training Officer;
Staff at Turning Point, Stranraer;
Staff at all participating Dumfries & Galloway pharmacies;
Fife
Liz Hutchings, Specialist Pharmacist in Substance Misuse;
Roslyn Blair, Senior Addictions Care Manager & Norma Westland, Senior Addiction Nurse;
Staff at the West Fife Community Drugs Team;
Staff at Frontline Fife/Homes4Good, Leven;
Staff at all participating Fife pharmacies;
Forth Valley
Jean Logan, Specialist Pharmacist in Substance Misuse;
Karen Prentice & Lorraine Moffat, Hepatitis Nurse Specialists;
Staff at Signpost Forth Valley Voluntary Sector;
Staff at Locals Against Drug Abuse (LADA);
Staff at Salvation Army Corps, Stirling;
Staff at all participating Forth Valley pharmacies;
Grampian
Fiona Stuart and Lucy Skea, Substance Misuse Pharmacists, Aberdeen;
Fiona Aitken, Public Health Blood-borne Virus Nurse Specialist, Aberdeen;
Staff at Drugs Action, Aberdeen;
Staff at Turning Point, Peterhead;
Staff at Turning Point, Banff;
Staff at Substance Misuse Service, Fraserburgh;
Staff at all participating Grampian pharmacies;

16 Needle Exchange Surveillance Initiative (NESI) 2008/2009 Report
Greater Glasgow & Clyde
Carole Hunter, Lead Pharmacist, Glasgow Addiction Services;
Duncan Hill, Marie-Claire Madden & Jennifer Kelly, Pharmacists, Glasgow Addiction Services;
Staff at Turning Point, Glasgow Drug Crisis Centre;
Staff at Lennox Service, Dumbarton;
Staff at Renfrewshire Drug Service, Paisley;
Staff at participating Glasgow and Clyde pharmacies;
Highlands
John Glenday, Harm Reduction Co-ordinator;
Staff at Terrence Higgins Trust, Inverness;
Staff at Boots pharmacy, Inverness;
Lanarkshire
Maureen Woods and the Harm Reduction Team;
Willie Kirk, Blood-borne Virus Risk Reduction Nurse;
Staff at all participating Lanarkshire pharmacies and health centres;
Lothian
Jim Shanley and the Harm Reduction Teams at the Spittal Street Centre and Lady Lawson Street Exchange;
Staff at NEDAC;
Staff at Turning Point, Leith;
Staff at all participating Lothian pharmacies;
Tayside
Richard McIntosh, Senior Specialist Blood-borne Virus & Sexual Health;
Karen Melville, Specialist Pharmacist in Substance Misuse;
Angela Guild, Charge Nurse at the Drug Problem Centre;
Staff at Cairn Centre, Dundee;
Staff at the Montrose Minor Injury Unit, Montrose;
Staff at all participating Tayside pharmacies;
The researchers and interviewers who collected the data and everyone who participated in the survey;
Finally, we are grateful to the Scottish Government for funding and supporting this initiative.
17Needle Exchange Surveillance Initiative (NESI) 2008/2009 Report
Appendix 1: Survey methods
Participants, eligibility and setting
Participants were recruited from selected needle exchanges and pharmacies that provide a needle exchange service. Clients attending the needle exchanges were approached by trained interviewers and assessed for eligibility: participants were eligible if they had injected drugs on at least one occasion and if it was the first time that they had participated in the current survey (June 2008-June 2009). All eligible participants were invited to take part in the survey: the interviewers first informed them about the purpose of the survey and explained that it is voluntary, anonymous and confidential. Upon giving informed consent, participants were then asked to complete a short questionnaire to elicit key demographic and behavioural information and to supply a blood spot sample to be tested anonymously for HCV and other blood-borne viruses. An individual’s blood spot sample was linked to the corresponding questionnaire through an assigned study number. Participants who wished to find out their HCV status were referred to the appropriate services. Ethics approval for the survey was obtained from the West Glasgow Ethics Committee. Research & Development approval was obtained from all participating NHS Boards.
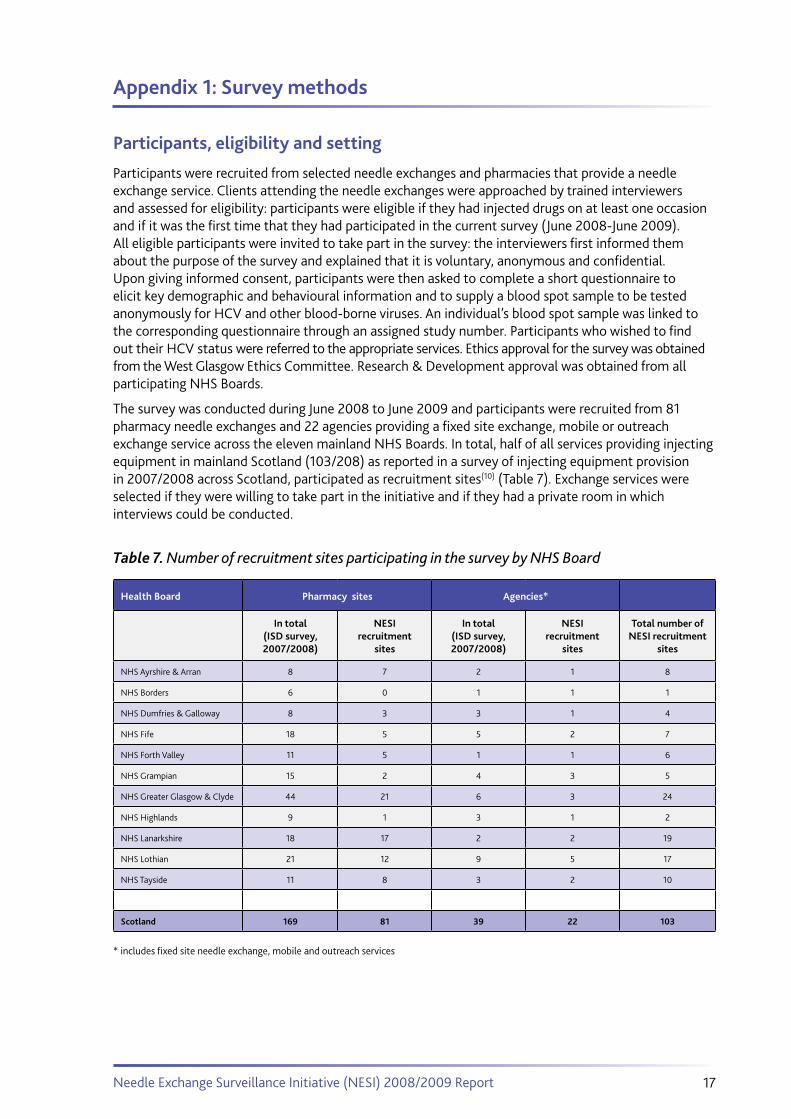
The survey was conducted during June 2008 to June 2009 and participants were recruited from 81 pharmacy needle exchanges and 22 agencies providing a fixed site exchange, mobile or outreach exchange service across the eleven mainland NHS Boards. In total, half of all services providing injecting equipment in mainland Scotland (103/208) as reported in a survey of injecting equipment provision in 2007/2008 across Scotland, participated as recruitment sites(10) (Table 7). Exchange services were selected if they were willing to take part in the initiative and if they had a private room in which interviews could be conducted.
Table 7. Number of recruitment sites participating in the survey by NHS Board
Health Board Pharmacy sites Agencies*
In total(ISD survey,2007/2008)
NESI recruitment
sites
In total(ISD survey,2007/2008)
NESIrecruitment
sites
Total number of NESI recruitment
sites
NHS Ayrshire & Arran 8 7 2 1 8
NHS Borders 6 0 1 1 1
NHS Dumfries & Galloway 8 3 3 1 4
NHS Fife 18 5 5 2 7
NHS Forth Valley 11 5 1 1 6
NHS Grampian 15 2 4 3 5
NHS Greater Glasgow & Clyde 44 21 6 3 24
NHS Highlands 9 1 3 1 2
NHS Lanarkshire 18 17 2 2 19
NHS Lothian 21 12 9 5 17
NHS Tayside 11 8 3 2 10
Scotland 169 81 39 22 103
* includes fixed site needle exchange, mobile and outreach services
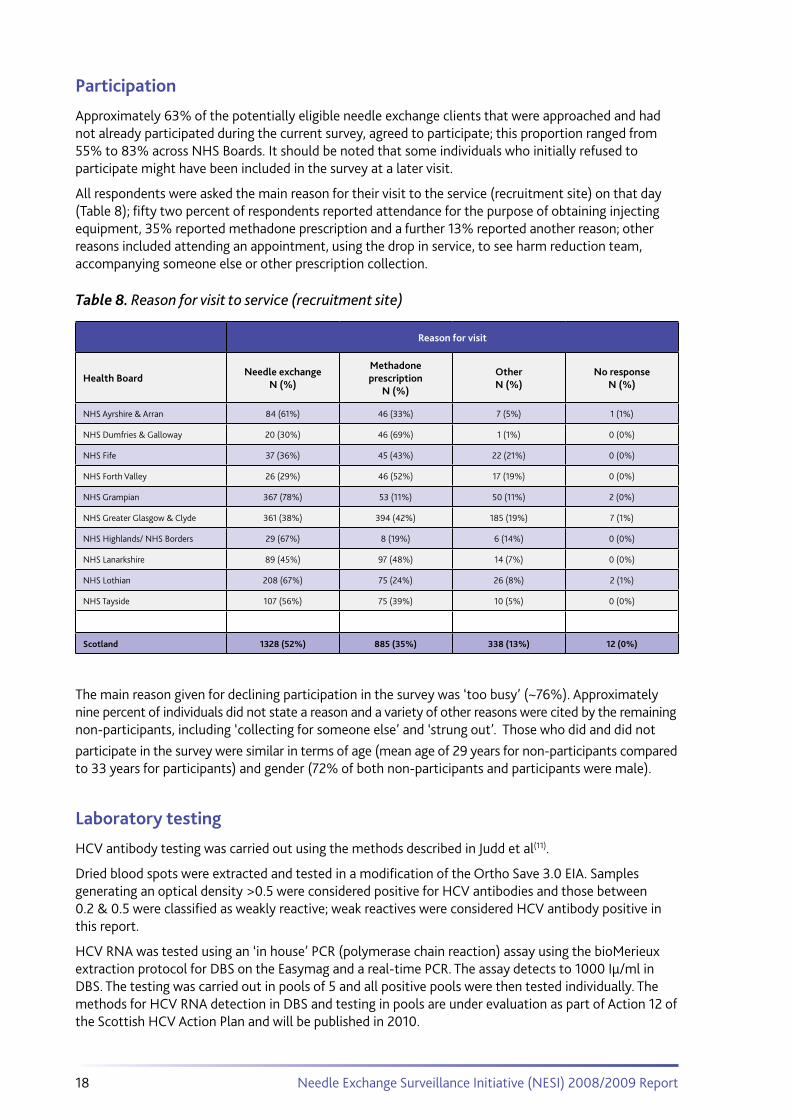
18 Needle Exchange Surveillance Initiative (NESI) 2008/2009 Report
Participation
Approximately 63% of the potentially eligible needle exchange clients that were approached and had not already participated during the current survey, agreed to participate; this proportion ranged from 55% to 83% across NHS Boards. It should be noted that some individuals who initially refused to participate might have been included in the survey at a later visit.
All respondents were asked the main reason for their visit to the service (recruitment site) on that day (Table 8); fifty two percent of respondents reported attendance for the purpose of obtaining injecting equipment, 35% reported methadone prescription and a further 13% reported another reason; other reasons included attending an appointment, using the drop in service, to see harm reduction team, accompanying someone else or other prescription collection.
Table 8. Reason for visit to service (recruitment site)
Reason for visit
Health BoardNeedle exchange
N (%)
Methadone prescription
N (%)
OtherN (%)
No responseN (%)
NHS Ayrshire & Arran 84 (61%) 46 (33%) 7 (5%) 1 (1%)
NHS Dumfries & Galloway 20 (30%) 46 (69%) 1 (1%) 0 (0%)
NHS Fife 37 (36%) 45 (43%) 22 (21%) 0 (0%)
NHS Forth Valley 26 (29%) 46 (52%) 17 (19%) 0 (0%)
NHS Grampian 367 (78%) 53 (11%) 50 (11%) 2 (0%)
NHS Greater Glasgow & Clyde 361 (38%) 394 (42%) 185 (19%) 7 (1%)
NHS Highlands/ NHS Borders 29 (67%) 8 (19%) 6 (14%) 0 (0%)
NHS Lanarkshire 89 (45%) 97 (48%) 14 (7%) 0 (0%)
NHS Lothian 208 (67%) 75 (24%) 26 (8%) 2 (1%)
NHS Tayside 107 (56%) 75 (39%) 10 (5%) 0 (0%)
Scotland 1328 (52%) 885 (35%) 338 (13%) 12 (0%)
The main reason given for declining participation in the survey was ‘too busy’ (~76%). Approximately nine percent of individuals did not state a reason and a variety of other reasons were cited by the remaining non-participants, including ‘collecting for someone else’ and ‘strung out’. Those who did and did not
participate in the survey were similar in terms of age (mean age of 29 years for non-participants compared to 33 years for participants) and gender (72% of both non-participants and participants were male).
Laboratory testing
HCV antibody testing was carried out using the methods described in Judd et al(11).
Dried blood spots were extracted and tested in a modification of the Ortho Save 3.0 EIA. Samples generating an optical density >0.5 were considered positive for HCV antibodies and those between 0.2 & 0.5 were classified as weakly reactive; weak reactives were considered HCV antibody positive in this report.
HCV RNA was tested using an ‘in house’ PCR (polymerase chain reaction) assay using the bioMerieux extraction protocol for DBS on the Easymag and a real-time PCR. The assay detects to 1000 Iµ/ml in DBS. The testing was carried out in pools of 5 and all positive pools were then tested individually. The methods for HCV RNA detection in DBS and testing in pools are under evaluation as part of Action 12 of the Scottish HCV Action Plan and will be published in 2010.

19Needle Exchange Surveillance Initiative (NESI) 2008/2009 Report
Appendix 2: Survey questionnaire
Needle Exchange Surveillance Initiative
NESI 2008/09
Site No: Interviewer code: Date: D D M M Y Y
V04/12/08
E1 Have you ever injected drugs?Yes
1
No2 ? If no, REJECT
E2 Have you participated in this
study before? Yes1
No2
? If yes when was the last time you participated in this study?
M M Y Y Y YIf interviewed during June 2008 - March 2009 REJECT
E3 What is the reason for your
visit today?(Please tick all that apply)
Needle exchange1
Methadone1
Other1 ? Please specify
Time interview started: H H:M MAttach sticker here

20 Needle Exchange Surveillance Initiative (NESI) 2008/2009 Report
I am first going to start by asking you some general questions about you
1 What are your initials?
2 SexMale
1
Female2
3 What is your date of birth? D D M M Y Y
4In which area are you living at the
moment?
5What is the first part of your post
code?
6 a) Have you ever lived in a hostel
for the homeless, had no fixed
abode or lived on the streets?
Yes1
No2 ? If no, go to Q7
b) Has this been in the last 6
months?Yes
1
No2
I am now going to ask you about drug services and healthcare you may have received

21Needle Exchange Surveillance Initiative (NESI) 2008/2009 Report
7 Have you ever been vaccinated for
Hepatitis B (Hep B jag)?Yes
1
No2
DK8888
? If no/don’t know, go to Q10
8 How many Hep B jags have you
had?1
1
22
3+3
DK8888
9 Where did you receive the
vaccinations for Hepatitis B?
(tick all that apply)
GP1
Drug treatment centre/Counselling service1
GUM clinic1
Hospital1
In prison1
Needle exchange1
Other (please specify below)1
10 a) Have you ever been prescribed
methadone?Yes
1
No2 ? If no, go to Q11
b) Are you currently on
methadone?Yes
1
No2
c) For how many of the last 6
months have you been prescribed
methadone?months
11 a) Have you ever received any
other drug treatment (excluding
methadone)?
(Show prompt card)
Yes1
No2 ? If no, go to Q12
b) In the last 6 months, have you
received any other drug treatment
(excluding methadone)?
Yes1
No2 ? If no, go to Q12
c) What treatment have you
received (excluding methadone)?
(Show prompt card)

22 Needle Exchange Surveillance Initiative (NESI) 2008/2009 Report
I would now like to ask you some questions about your alcohol and drug use.The first few
questions are about alcohol
12 In the past 12 months, how often
did you have drink containing
alcohol?
(Show prompt card)
Never0
Once a month or less1
Twice a month2
Once a week3
2 - 3 times a week4
4 - 5 times a week5
6 - 7 times a week6
? If never go to Q15
13 On a typical day when you drink, what do you drink?
Drink Size and Number Units*
A Beer/lager/cider/shandy
B Strong beer/lager/cider (>6%)
C Wine
D Strong wine (>15%) e.g. Buckfast
E Spirits and liqueurs
F Alcopops
G Other
14Total number of Units
*To be completed by interviewer after the interview

23Needle Exchange Surveillance Initiative (NESI) 2008/2009 Report
I am now going to ask you about your injecting drug use
15 How old were you when you first
injected drugs? years
16 When did you last inject drugs? M M Y Y Y Y
17 Was this in the last 4 weeks?Yes
1
No2
? If yes, go to Q19
18 Have you injected in the last 6
months?Yes
1
No2 ? If no, go to Q25
19 In the last 6 months, which of the
following drugs have you injected?
(tick all that apply)
Heroin1
Cocaine1
Crack1
Speed1
Temazepam or Valium1
Bodybuilding drugs e.g. steroids, HCG1
Other (please specify below)1
20 In the last 6 months, which drug
have you injected most often?
21 In how many of the last 6 months
did you inject drugs?
Please fill in the number of monthsmonths

24 Needle Exchange Surveillance Initiative (NESI) 2008/2009 Report
22 In the months when you injected
drugs how often on average did you
inject them?
1 to 3 times a month1
About once a week2
2 to 6 times a week3
Once a day4
2 to 3 times a day5
4 or more times a day6
23 Of all the needles and syringes
that you have used to inject in the
last 6 months, how many were new
and unused (i.e. from a packet) on
a scale of 0 to 10 (where 0 is none
and 10 is all) (tick one box)
0 1 2 3 4 5 6 7 8 9 10
24 In the last 6 months, did someone
inject you after injecting themselves
or others?
Yes1
No2

25Needle Exchange Surveillance Initiative (NESI) 2008/2009 Report
Reminder to the interviewer: Complete using
the respondent’s answers to Q17 and Q18.
Has the respondent injected in the…
last 6 months? (see Q18)
Yes1
No2
last 4 weeks? (see Q17)
Yes1
No2
If no skip column B ? If no skip column C ?
A - Ever B - In the last 6 Months C - In the last 4 weeks
25 Have you ever injected with a needle/
syringe that had already been used by
someone else (including your partner)?
How many times have you injected with
a needle/syringe that had already been
used by someone else (including your
partner)?
(Ask about the last 6 months and the last
4 weeks)
a)
Yes1
No2
If no, go to Q28b ?
b)
Never0
Once or twice1
3 to 5 times2
5 to 19 times3
20+ times4
c)
Never0
Once or twice1
3 to 5 times2
5 to 19 times3
20+ times4
26 Have you shared needle/syringes with
someone you knew had Hepatitis C?
If yes, was this in the last 6 months/last
4 weeks?
a)
Yes1
No2
If no, go to Q27?
b)
Yes1
No2
If no, go to Q27?
c)
Yes1
No2
27 From how many different people, in
total, have you received used needles/
syringes (including your partner)?
b)
people
If 0, go to Q28
c)
people
28 To how many different people, in total,
have you passed on used needles/
syringes (including your partner)?
b)
people
If 0, go to Q29
c)
people
29 Have you ever injected with the same
needle/syringe more than once before
discarding it?
In the last 6 months, how many times, on
average, did you use the same needle/
syringe before discarding it?
a)
Yes1
No2
If no, go to Q30 ?
b)
Never0
Once or twice1
3 to 5 times2
5+ times3
30 Have you ever injected with a used
needle/syringe that you were not sure
was your own?
In the last 6 months, how many times did
you inject with a used needle/syringe that
you were not sure was your own?
a)
Yes1
No2
DK8888
If no, go to Q31 ?
b)
Never0
Once or twice1
3 to 5 times2
5 to 19 times3
20+ times4

26 Needle Exchange Surveillance Initiative (NESI) 2008/2009 Report
A - Ever B - In the last 6 Months C - In the last month
Have you:
31 Used spoons or containers for mixing
which had previously been used by
someone else?
Yes1
No2
If no, go to Q32 ?
Yes1
No2
If no, go to Q32 ?
Yes1
No2
32 Used filters or cottons which had
previously been used by someone
else?
Yes1
No2
If no, go to Q33 ?
Yes1
No2
If no, go to Q33 ?
Yes1
No2
33 Prepared drugs or rinsed your works
with water that had already been used
by someone else?
Yes1
No2
If no, go to Q34 ?
Yes1
No2
If no, go to Q34 ?
Yes1
No2
34 Shared filters, spoons, cookers or
water with someone who you knew had
Hepatitis C?
Yes1
No2
If no, go to Q35 ?
Yes1
No2
If no, go to Q35 ?
Yes1
No2
35 a) In the last year, how many occasions
were you present when someone
injected for the first time?
? If 0, go to Q36
b) On the last occasion, how many
other injectors were present (not
including yourself or the first time
injector)?

27Needle Exchange Surveillance Initiative (NESI) 2008/2009 Report
I would now like to ask you some questions about Hepatitis C and HIV
36 a) Have you ever had a hepatitis C
test?Yes
1
No2
DK8888
? If no/don’t know, go to Q41
b) In which year did you last have a
hepatitis C test?Y Y Y Y
c)Was that test in the last 12
months?Yes
1
No2
37 Where were you last tested for
hepatitis C?GP
1
Drug treatment centre/counselling service2
GUM clinic3
Hospital4
Prison5
Needle exchange6
Other (please specify below)7
38 Would you mind telling me the result
of your last test?Have hep C
1
Did not have hep C2
Awaiting result3
Did not get result4
Do not want to say5
DK8888
? go to Q41
39 Did you get a letter asking you to
attend a hospital appointment for
your hepatitis C?
Yes1
No2
DK8888
? If no/don’t know, go to Q41
40 a) Did you attend the appointment?Yes
1
No2
? If yes, go to Q41
b)Why not?

28 Needle Exchange Surveillance Initiative (NESI) 2008/2009 Report
41 a) Have you ever had an HIV test?Yes
1
No2
DK8888
? If no/don’t know, go to Q43
b) In which year did you last have an
HIV test? Y Y Y Y
c) was that test in the last 12 months?Yes 1
No 2
42 Would you mind telling me the result
of your last test?Have HIV
1
Did not have HIV2
Awaiting results3
Did not get result4
Do not want to say5
DK8888
I would like to now ask about any time you may have spent in prison or a young offenders’institution
43 Howmany times have you been in
prison (or a young offenders’ institution)
since you first injected drugs?
? If 0, go to Q49
44 a)When was the last time you were
in prison? (Date of release) M M Y Y Y Y
b)Was this in the last 6 months?Yes
1
No2
45 Did you ever inject drugs when you
were in prison (or a young offenders’
institution)?
Yes1
No2
? If no, go to Q49
46 When you ever injected in prison (or
a young offenders’ institution), did
you ever use a needle and/or syringe
that had already been used by a
fellow prisoner?
Yes1
No2
DK8888
47 Did you inject drugs in prison in the
last 6 months?Yes
1
No2
N/A
? If no, go to Q49

29Needle Exchange Surveillance Initiative (NESI) 2008/2009 Report
48 When you injected in prison (or a
young offenders’ institution) in the
last 6 months did you use a needle
and/or syringe that had already been
used by a fellow prisoner?
Yes1
No2
DK8888
N/A
Reminder to the interviewer:
Has the respondent injected in the last 6
months
Yes1
No2 ? If no, go to end of
questionnaire
And finally I would like to finish by asking a few quick questions about needle exchanges
49 In an average week during the last 6 months, how many new and unused needles and syringes did you obtain for
yourself from….
a) A pharmacy exchange
b) A fixed site, specialist needle exchange
c) A mobile/outreach/other exchange
d) Other people (e.g. friends, acquaintances, partners)
50 In an average week, during the last 6 months, how many of the following did you obtain from an exchange?
a) Filters
If 0, were they available at an
exchange that you attended??
Available1
Not available2
DK8888
b) Stericups
If 0, were they available at an
exchange that you attended??
Available1
Not available2
DK8888
c) Water ampoules
If 0, were they available at an
exchange that you attended??
Available1
Not available2
DK8888
In an average week, during the last 6 months, did you obtain any of the following from an exchange?
d) Citric acid or vit C sachetsYes
1
No2
If no, were they available at an
exchange that you attended??
Available1
Not available2
DK8888
e) Wipes/swabsYes
1
No2
If no, were they available at an
exchange that you attended??
Available1
Not available2
DK8888
Q50 cont. overleaf, PTO.

30 Needle Exchange Surveillance Initiative (NESI) 2008/2009 Report
f) Sharps binsYes
1
No2
If no, were they available at an
exchange that you attended? ?
Available1
Not available2
DK8888
g) TourniquetsYes
1
No2
If no, were they available at an
exchange that you attended? ?
Available1
Not available2
DK8888
h) Crack pipesYes
1
No2
If no, were they available at an
exchange that you attended? ?
Available1
Not available2
DK8888
i) Coloured (nevershare) syringesYes
1
No2
If no, were they available at an
exchange that you attended? ?
Available1
Not available2
DK8888
Time interview finished: H H :M M
When we began this questionnaire, I asked if you would give a dried blood spot sample. Is
that still OK with you?
Thank the respondent for their time and give them the Voucher envelope
Dried blood spot sample
Taken Sample labelled
Refused ? offer saliva sample
Saliva sample
Taken Sample labelled
Refused
N/A
Questionnaire labelled

31Needle Exchange Surveillance Initiative (NESI) 2008/2009 Report
Appendix 3: Participating needle exchange sites
Ayrshire & Arran NHS BoardAlliance/Boots Pharmacy, Ayr
Alliance/Boots Pharmacy, Girvan
Alliance/Boots Pharmacy, Irvine
Lloyds Pharmacy, Ayr
Lloyds Pharmacy, Kilwinning
McCormick Pharmacy, Drongan
Bentinck Centre, Kilmarnock
Needle Exchange Outreach Network – Stevenson
Needle Exchange Outreach Network – Irvine
Needle Exchange Outreach Network – Ayr
Needle Exchange Outreach Network – Cumnock
Toll Pharmacy, Prestwick
Borders NHS BoardThe Big River Project, Galashiels
Dumfries & Galloway NHS BoardAlliance/Boots Pharmacy, Castle Douglas
Alliance/Boots Pharmacy, Newton Stewart
Turning Point, Stranraer
William Murray Pharmacy, Dumfries
Fife NHS BoardAlliance/Boots Pharmacy, St Andrews
Frontline Fife/Homes4Good, Leven
Gordons Pharmacy, Cowdenbeath
Lloyds Pharmacy, Methil
Rowlands Pharmacy, Cupar
St Clair Pharmacy, Kirkcaldy
West Fife Community Drugs Team, Dunfermline
Forth Valley NHS BoardAlliance Pharmacy, Tullibody
Cornton Pharmacy, Stirling
Lloyds Pharmacy, Grahams Road, Falkirk
Lloyds Pharmacy, Marshill, Alloa
Signpost, Denny
Signpost, Grahams Road, Falkirk,
Signpost, Locals Against Drug Abuse (LADA), Alloa
Signpost, Salvation Army, Stirling
Superdrug, Thistle Centre, Stirling
Grampian NHS BoardDrugs Action (Centre & Outreach), Aberdeen
Douglas Dickie Pharmacy, Aberdeen
Substance Misuse Service, Fraserburgh

32 Needle Exchange Surveillance Initiative (NESI) 2008/2009 Report
Tillydrone Pharmacy, Aberdeen
Turning Point, Banff
Turning Point, Peterhead
Turning Point, Elgin
Greater Glasgow & Clyde NHS BoardAbbey Chemist, Trongate
Alliance/Boots Pharmacy, Alexandria
Alliance/Boots Pharmacy, Crown Street
Alliance/Boots Pharmacy, Johnstone
Alliance/Boots Pharmacy, Queen Margaret Drive
Alliance/Boots Pharmacy, Victoria Road
Alliance/Boots Pharmacy, Renfrew
Alliance/Boots Pharmacy, Shettleston
Apple Pharmacy, Craigend
Alliance/Boots Pharmacy, Barrhead
Alliance/Boots Pharmacy, Clydebank
Alliance/Boots Pharmacy, Kirkintilloch
Denis Houlihan Pharmacy, Possilpark
Dickson’s Pharmacy, Tollcross
Glasgow Drug Crisis Centre
Glenburn Pharmacy, Paisley
Harmony Row Pharmacist, Govan
Hughes Pharmacy, Admiral Street
J. Gilbride Pharmacy, Ibrox
Lennox Service, Dumbarton Joint Hospital
Lloyds Pharmacy, Bridgeton
Lloyds Pharmacy, Maryhill
Red Road Pharmacy, Glasgow
Renfrewshire Drug Service, Paisley
Highlands NHS BoardAlliance/Boots Pharmacy, Inverness
Terrence Higgins Trust, Inverness
Lanarkshire NHS BoardA&A Gilbride Pharmacy, High Blantyre
Alliance/Boots Pharmacy, Airdrie
Alliance/Boots Pharmacy, Coatbridge
Alliance/Boots Pharmacy, East Kilbride
Alliance/Boots Pharmacy, Hamilton
Alliance/Boots Pharmacy, Larkhall
Alliance/Boots Pharmacy, Strathaven
Crawford Pharmacy, Shotts
Dickson Chemist Ltd Pharmacies, Uddingston
DJ Coleman Pharmacy, Carnwath
Lloyds Pharmacy, Chapelhall
Lloyds Pharmacy, Coatbridge
Lloyds Pharmacy, Motherwell
Lloyds Pharmacy, Wishaw

33Needle Exchange Surveillance Initiative (NESI) 2008/2009 Report
McIntyre & Cairns Chemists, Wishaw
New Stevenston Pharmacy, Motherwell
Outreach Team: North – Central Health Centre, Cumbernauld
Outreach Team: South – A73 Project, Lanark
Sinclair Pharmacy, Coatbridge
Lothian NHS BoardAlliance/Boots Pharmacy, Shandwick Place
D&A McKinnon Pharmacy, Calder Road
Deans Pharmacy, Livingston
Ferguson Pharmacy, North Berwick
Gordons Pharmacy, Gracemount Drive
Lindsay & Gilmour, Leith Walk
Lindsay & Gilmour, West Calder
Lloyds Pharmacy, Livingston
Lloyds Pharmacy, Wester Hailes Centre
Mid & East Lothian Drugs Service (MELD)
National Co-operative Chemists, Prestonpans
Needle Exchange Outreach Network – Armadale
Needle Exchange Outreach Network – Bathgate
Needle Exchange Outreach Network – Howden
Needle Exchange Outreach Network – Musselburgh
North Edinburgh Drug Advice Centre (NEDAC)
Rowlands Pharmacy, Loanhead
Rowlands Pharmacy, Penicuik
The Exchange – Lady Lawson Street
Turning Point, Leith
Tayside NHS BoardCairns Centre, Dundee
Co-operative Pharmacy, Fisheracre, Arbroath
Co-operative Pharmacy, High Street, Arbroath
Davidson’s Chemist Pharmacy, Blairgowrie
Davidson’s Chemist Pharmacy, Forfar
Davidson’s Chemist, Perth
Lloyds Pharmacy, Albert Street, Dundee
Lloyds Pharmacy, Macalpine Road, Ardler, Dundee
Lloyds Pharmacy, Whitfield Drive, Dundee
Montrose Minor Injury Unit, Montrose

34 Needle Exchange Surveillance Initiative (NESI) 2008/2009 Report
References
1. Scottish Government., 2008, Hepatitis C Action Plan for Scotland: Phase II May 2008-March 2011, Edinburgh: Scottish Government.
2. Hay, G., Gannon, M., Casey, J. and McKeganey, N.P., 2009. Estimating the National and Local Prevalence of Problem Drug Misuse in Scotland, Executive Report. University of Glasgow. [Online] Available at: www.drugmisuse.isdscotland.org/publications/local/Prevalence_2009.pdf
3. Page-Shafer, K., Pappalardo, B.L., Tobler, L.H., et al., 2008. Testing strategy to identify cases of acute hepatitis C virus (HCV) infection and to project HCV incidence rates. Journal of Clinical Microbiology, 46, pp.499-506.
4. Busch, M.P., 2001. Insights into the epidemiology, natural history and pathogenesis of hepatitis C virus infection from studies of infected donors and blood product recipients. Transfusion Clinique et Biologique, 8, pp.200-206.
5. Health Protection Scotland and the University of the West of Scotland. 2008. The Needle Exchange Surveillance Initiative (NESI): Prevalence of HCV, HIV and injecting risk behaviours among injecting drug users attending needle exchanges in Scotland, 2007.
6. Health Protection Agency, Health Protection Scotland, National Public Health Service for Wales, CDSC Northern Ireland, CRDHB. 2009. Shooting Up: Infections among injecting drug users in the United Kingdom 2008.
7. Brant, L.J., Ramsay, M.E., Balogun, M.A., et al., 2008. Diagnosis of acute hepatitis C virus infection and estimated incidence in low- and high-risk English populations. Journal of Viral Hepatitis, 15,
pp. 871-877.
8. Champion, J.K., Taylor, A., Hutchinson, S., et al., 2004.Incidence of Hepatitis C virus infection and associated risk factors among Scottish prison inmates: a cohort study. American Journal of Epidemiology, 159(5), pp.514-519.
9. Roy, K.M., Hutchinson, S.J., Wadd, S., et al., 2007. Hepatitis C virus infection among injecting drug users in Scotland: a review of prevalence and incidence data and the methods used to generate them. Epidemiology and Infection, 135(3), pp.433-442.
10. Information Services Division Scotland., 2009. Provision of injecting equipment in Scotland, 2007/08. [Online Edinburgh]. Available at: www.drugmisuse.isdscotland.org/publications/local/injecting_provision.pdf
11. Judd, A., Parry, J., Hickman, M., et al., 2003. Evaluation of a modified commercial assay in detecting antibody to hepatitis C virus in oral fluids and dried blood spots. Journal of Medical Virology, 71, pp.49-55.


University of the West of Scotland
Paisley PA1 2BE
Scotland
tel: 0141 848 3000
web: www.uws.ac.uk
University of the West of Scotland is a registered Scottish charity.
Charity number SC002520.