Needham Growth Conference - January 2016
16
Germain Lamonde Chairman, President & CEO January 12, 2016 NEEDHAM GROWTH CONFERENCE
-
Upload
exfo-inc -
Category
Investor Relations
-
view
915 -
download
0
Transcript of Needham Growth Conference - January 2016
Germain Lamonde Chairman, President & CEO January 12, 2016
NEEDHAM GROWTH CONFERENCE

2 © 2016 EXFO Inc. All rights reserved.
Certain statements in this presentation, or given in response to your questions, may constitute
forward-looking statements within the meaning of the Securities Act of 1934. The Private
Securities Litigation Reform Act of 1995 provides “safe-harbors” for such forward-looking
statements and we intend that any forward-looking statements made today be subject to the
safe harbors. We caution you that any forward-looking statements are just predictions. They are not guarantees of future performance and involve risks and uncertainties. Actual results may
differ materially from those projected in forward-looking statements and we invite you to review
the company’s most recent filings with the Securities and Exchange Commission or Canadian
securities commissions for a discussion of the factors at risk. These forward-looking statements
speak only as of the date of this presentation and, unless required by law or applicable
regulations, we will not be reviewing or updating the material that is contained herein.
For a reconciliation of adjusted EBITDA to net earnings, refer to the Q1 2016 press release or
the “Non-IFRS Measures” section on EXFO’s website.
All amounts in millions of US dollars, except otherwise noted.
FORWARD-‐LOOKING STATEMENTS

3 © 2015 EXFO Inc. All rights reserved.
EXFO BY NUMBERS
IN PORTABLE OPTICAL TESTING
LEADER
FY 2015 SALES OF $222.1 M (GLOBAL NO.2 PLAYER)
SCALE
GEOGRAPHICAL SALES FOR FY 2015
DIVERSIFIED
1500 EMPLOYEES
IN 25 COUNTRIES
GLOBAL
OF TOTAL BOOKINGS IN FY 2015
WIRELESS
30%%
CASH RETURNED TO SHAREHOLDERS VIA SHARE
REPURCHASE PLANS
SHAREHOLDER VALUE

4 © 2016 EXFO Inc. All rights reserved.
-‐ MULTI-‐TECHNOLOGY PLATFORMS -‐ WORLD NO. 1 IN OPTICAL TEST -‐ SIMPLIFICATION & AUTOMATION
LEADER IN PORTABLE TEST

5 © 2016 EXFO Inc. All rights reserved..
LEADER IN SERVICE ASSURANCE
-‐ FULL END-‐TO-‐END SOLUTION PORTFOLIO -‐ CONVERGED & VIRTUALIZED IP SERVICES -‐ OVER 100 DEPLOYMENTS WORLDWIDE
6 © 2016 EXFO Inc. All rights reserved..© 2016 EXFO Inc. All rights reserve
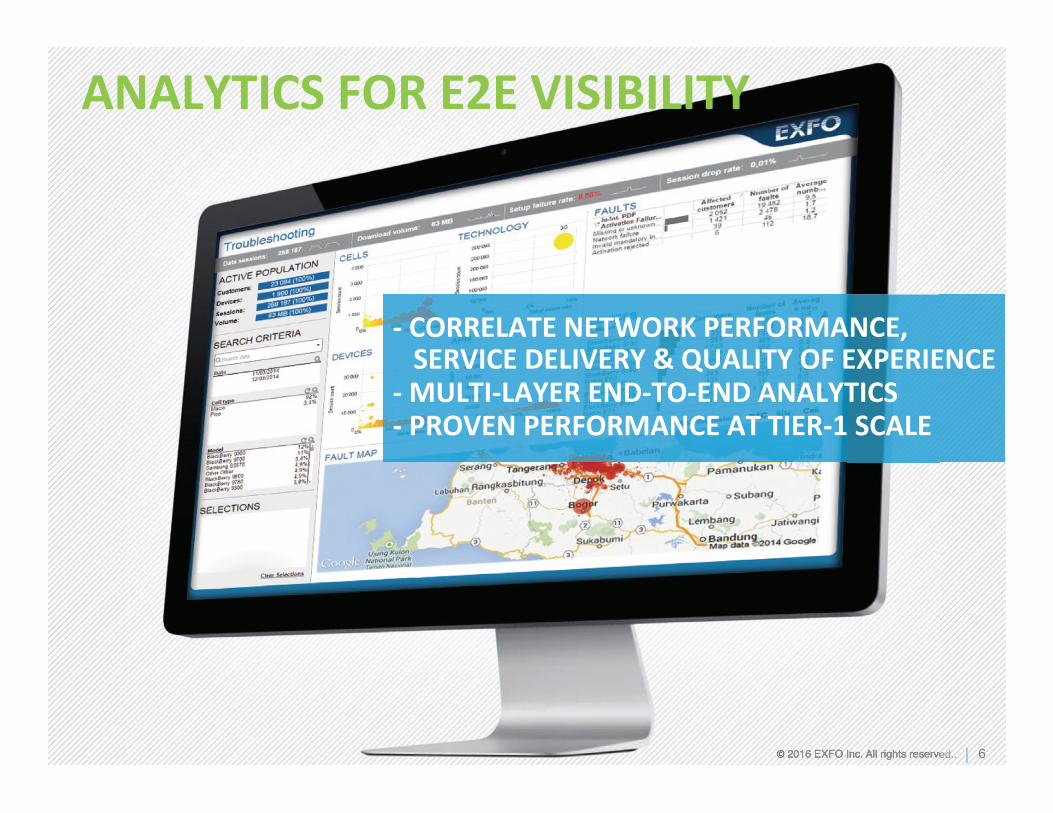
ANALYTICS FOR E2E VISIBILITY
-‐ CORRELATE NETWORK PERFORMANCE, SERVICE DELIVERY & QUALITY OF EXPERIENCE -‐ MULTI-‐LAYER END-‐TO-‐END ANALYTICS -‐ PROVEN PERFORMANCE AT TIER-‐1 SCALE
7 © 2016 EXFO Inc. All rights reserved.
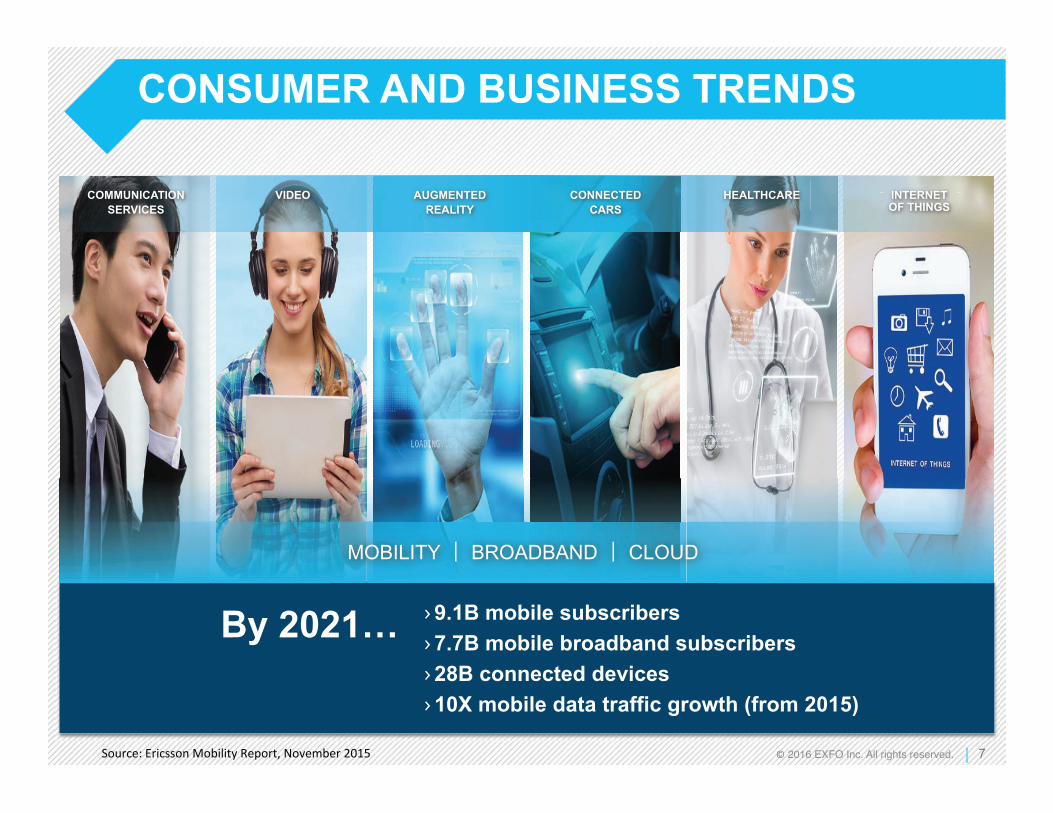
CONSUMER AND BUSINESS TRENDS
By 2021…
COMMUNICATION SERVICES
VIDEO AUGMENTED REALITY
CONNECTED CARS
HEALTHCARE INTERNET OF THINGS
MOBILITY | BROADBAND | CLOUD
Source: Ericsson Mobility Report, November 2015
› 9.1B mobile subscribers
› 7.7B mobile broadband subscribers
› 28B connected devices
› 10X mobile data traffic growth (from 2015)
8 © 2016 EXFO Inc. All rights reserved.
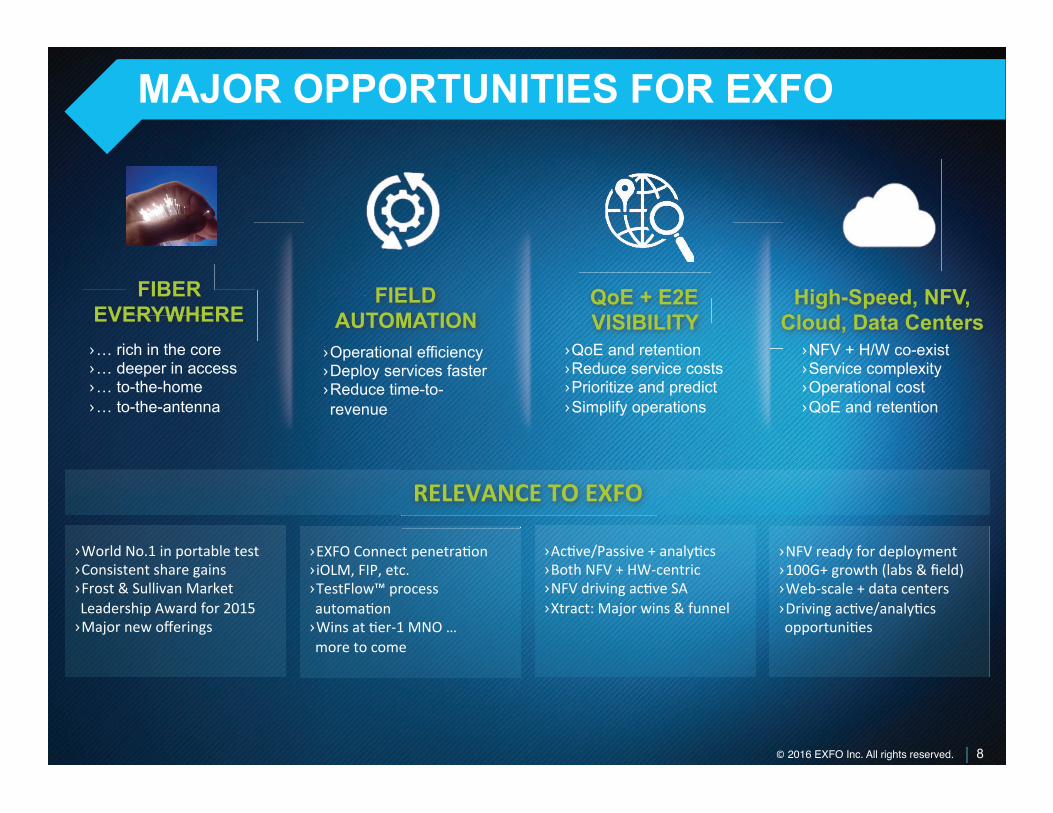
MAJOR OPPORTUNITIES FOR EXFO
FIELD AUTOMATION › Operational efficiency › Deploy services faster › Reduce time-to-revenue
QoE + E2E VISIBILITY
› QoE and retention › Reduce service costs › Prioritize and predict › Simplify operations
FIBER EVERYWHERE
› … rich in the core › … deeper in access › … to-the-home › … to-the-antenna
High-Speed, NFV, Cloud, Data Centers › NFV + H/W co-exist › Service complexity › Operational cost › QoE and retention
› World No.1 in portable test › Consistent share gains › Frost & Sullivan Market Leadership Award for 2015 › Major new offerings
› EXFO Connect penetraPon › iOLM, FIP, etc. › TestFlow™ process automaPon › Wins at Per-‐1 MNO … more to come
› AcPve/Passive + analyPcs › Both NFV + HW-‐centric › NFV driving acPve SA › Xtract: Major wins & funnel
› NFV ready for deployment › 100G+ growth (labs & field) › Web-‐scale + data centers › Driving acPve/analyPcs opportuniPes
RELEVANCE TO EXFO

9 © 2016 EXFO Inc. All rights reserved.
GROWTH STRATEGY TOP-LINE DRIVEN: BOLSTER SALES AND GROSS MARGIN
TRANSFORM Into a solutions partner. Customers seeking E2E solutions to enhance network performance and service experience quality.
EXPAND Share of wallet with tier-1 network operators. Top-15 operators account for lion’s share of capital spending.
ACCELERATE Penetration of data center, Cloud and web-scale operator markets. Web-scale operators spending at a faster rate than network operators.
INCREASE Wireless presence. Bookings to wireless customers reached 30-32% of total bookings in FY 2015.

10 © 2016 EXFO Inc. All rights reserved.
PROFITABILITY TARGET
1 Adjusted EBITDA represents net earnings before interest, income taxes, deprecia<on and amor<za<on, stock-‐based compensa<on costs and foreign exchange gain or loss.
REDUCED OPEX FROM RESTRUCTURING AND CURRENCY TRENDS
$3.5M
BETTER PRODUCT AND GEOGRAPHICAL MIX
ADJUSTED EBITDA1
>40% Growth YoY
$20M
FY 2016
REQUIRES ~3% YoY REVENUE GROWTH
GOOD START IN Q1/16. ADJ. EBITDA TYPICALLY STRONGER IN H2.
$5.3M

11 © 2016 EXFO Inc. All rights reserved.
PROTOCOL (Wireless, T&D, SA, AnalyZcs)
PHYSICAL (OpZcal & Access)
TELECOM MARKET
TAM
SAM
Major competitors
Market growth rate
Sales ―― FY 2015
Gross margin profile
$815 M
$495 M
Viavi, Anritsu
0-5%
$144.1 M
55-60%
$4.3 B
$2.4 B
Viavi, IXIA, Netscout
10-15%
$80.6 M
70-75%
PROTOCOL TO DRIVE REVENUE AND EARNINGS GROWTH
*Excludes losses on FX contracts.
$5.1 B
$2.9 B
Single-digit
$224.7 M*
63%-65%
TOTAL

12 © 2016 EXFO Inc. All rights reserved.
PHYSICAL-LAYER SOLUTIONS
COPPER ACCESS › Most advanced product portfolio for
high-speed copper links › MaxTester secured contract wins
with several tier-1 operators › Supports pair bonding, vectoring
and G.fast (up to 1 Gbit/s)
PORTABLE OPTICAL
› No. 1 player with >34% market share
› Market dominance in OTDR testing
› Key differentiator: iOLM software
› Market leader in dispersion testing
› Unmatched product breadth & depth

13 © 2016 EXFO Inc. All rights reserved.
PROTOCOL-LAYER SOLUTIONS
SERVICE ASSURANCE & ANALYTICS SOFTWARE
› Probe-based systems targeted at medium to large network operators
› E2E solutions with fully integrated active/passive monitoring and infrastructure polling to assure SLAs
› Real-time analytics for unmatched network performance and service experience visibility
WIRELESS › Network simulators: Large-scale
emulation of IMS, WebRTC subscriber sessions to test routers, gateways and session border controllers
› Protocol analyzers: 4G/LTE and 3G test solutions for deployment and troubleshooting applications
TRANSPORT AND DATACOM › Multi-service analyzers for SONET/
SDH, OTN and Ethernet rates from 10M to 100G
› Comprehensive portfolio for wireless backhaul and fronthaul
› Pioneered new standard for Ethernet testing (EtherSam)

14 © 2016 EXFO Inc. All rights reserved.
Q1 2016 HIGHLIGHTS
› Sales reached $55.2 M
› Bookings attained $58.5 M (B/B ratio of 1.06)
› Robust bookings across Physical and Protocol lines
› Strong results in North America
› Gross margin1 improved to 63.5%
› IFRS net earnings amounted to $1.8 M
› Adjusted EBITDA2 totaled $5.3 M (9.6% of sales)
1Gross margin before depreciation and amortization is a non-IFRS measure and represents sales less cost of sales, excluding depreciation and amortization. 2Adjusted EBITDA represents net earnings before interest, income taxes, depreciation and amortization, stock-based compensation costs and foreign exchange gain.
15 © 2016 EXFO Inc. All rights reserved.
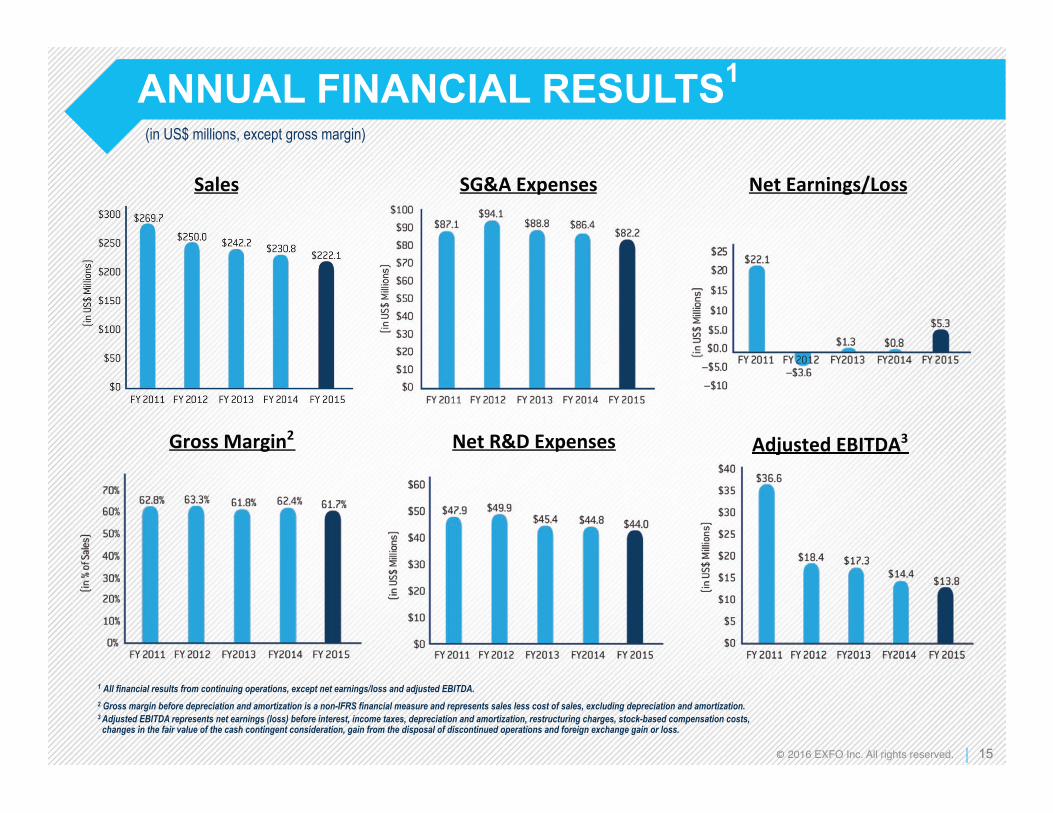
ANNUAL FINANCIAL RESULTS1 (in US$ millions, except gross margin)
1 All financial results from continuing operations, except net earnings/loss and adjusted EBITDA. 2 Gross margin before depreciation and amortization is a non-IFRS financial measure and represents sales less cost of sales, excluding depreciation and amortization. 3 Adjusted EBITDA represents net earnings (loss) before interest, income taxes, depreciation and amortization, restructuring charges, stock-based compensation costs, changes in the fair value of the cash contingent consideration, gain from the disposal of discontinued operations and foreign exchange gain or loss.
Sales
Gross Margin2 Net R&D Expenses Adjusted EBITDA3
Net Earnings/Loss SG&A Expenses
j

16 © 2016 EXFO Inc. All rights reserved.
STRONG VALUE PROPOSITION WHY INVEST?
1. History of market-share gains Captured market share in growth and downward markets
2. Well positioned for key growth drivers 3G, 4G/LTE, wireless backhaul, small cells, DAS, RRH, FTTx, 100G
3. Balancing sales growth and profitability Targeting Adj. EBITDA of $20 M at a revenue level of about $230 M for FY 2016
4. Solid balance sheet Cash position of $29.4 M and no debt — as at Nov. 30, 2015
5. Experienced and disciplined management team Averaging >15 years of experience in sales, marketing, R&D, manufacturing, finance, HR
1Adjusted EBITDA represents net earnings before interest, income taxes, depreciation and amortization, stock-based compensation costs and foreign exchange gain or loss.