Needham 11 th Annual Growth Conference January 6, 2009 NASDAQ: BBOX.
22
Needham 11 th Annual Growth Conference January 6, 2009 NASDAQ: BBOX
-
Upload
winfred-simmons -
Category
Documents
-
view
213 -
download
0
Transcript of Needham 11 th Annual Growth Conference January 6, 2009 NASDAQ: BBOX.
Needham 11th Annual Growth Conference
January 6, 2009
NASDAQ: BBOX
Company Confidential
2
Black Box Network Services
• Forward-Looking Statements - Any forward-looking statements contained in this presentation are made pursuant to the safe harbor provisions of the Private Securities Litigation Reform Act of 1995 and speak only as of the date of this presentation. You can identify these forward-looking statements by the fact that they use words such as "should," "anticipate," "estimate," "approximate," "expect," "target," "may," "will," "project," "intend," "plan," "believe" and other words of similar meaning and expression in connection with any discussion of future operating or financial performance. Forward-looking statements are inherently subject to a variety of risks and uncertainties that could cause actual results to differ materially from those projected. Risk factors are included in our Annual Report on Form 10-K for the fiscal year ended March 31, 2008 and our other filings with the Securities and Exchange Commission (the “SEC”). We can give no assurance that any goal, plan or target set forth in forward-looking statements can be achieved and readers are cautioned not to place undue reliance on such statements, which speak only as of the date made. We undertake no obligation to release publicly any revisions to forward-looking statements as a result of future events or developments.
• GAAP Reconciliation -This presentation also includes, as a supplement to United States Generally Accepted Accounting Principles (“GAAP”), certain non-GAAP financial measures. These non-GAAP financial measures exclude the impact of certain items and, therefore, have not been calculated in accordance with GAAP. Pursuant to the requirements of the SEC’s Regulation G, we provide in our SEC filings additional information regarding these non-GAAP financial measures, including a reconciliation of them to their most comparable GAAP financial measures, management’s explanations regarding the use and usefulness of non-GAAP financial measures and the limitations associated with the use of non-GAAP financial measures. The Company's non-GAAP financial measures are not meant to be considered in isolation or as a substitute for comparable GAAP financial measurements, and should be read only in conjunction with the Company's consolidated financial statements prepared in accordance with GAAP.
Terry Blakemore
President and CEO
Company Confidential
4
Black Box Network Services
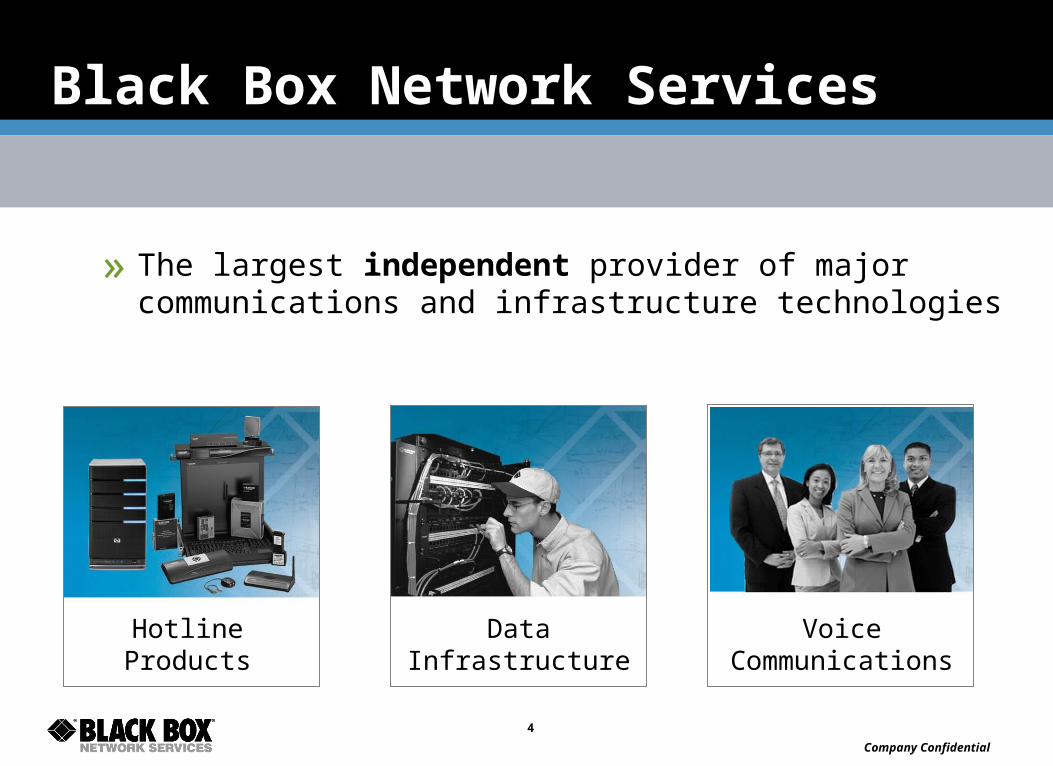
» The largest independent provider of major communications and infrastructure technologies
HotlineProducts
DataInfrastructure
VoiceCommunications
Company Confidential
5
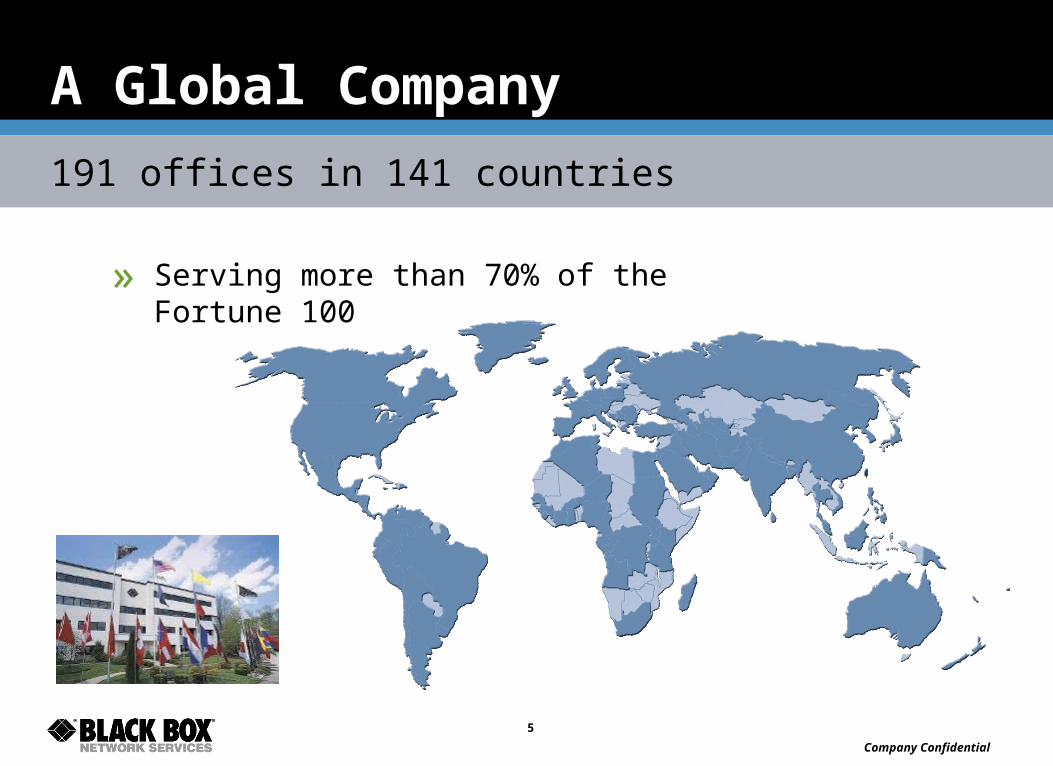
A Global Company
191 offices in 141 countries
» Serving more than 70% of the Fortune 100
Company Confidential
6
Key Objectives
• Deliver the highest quality technical support services and products to our clients around the world.
• Achieve operating margin and cash flow targets.
• Supplement organic growth with high quality M&A activities.
Company Confidential
7
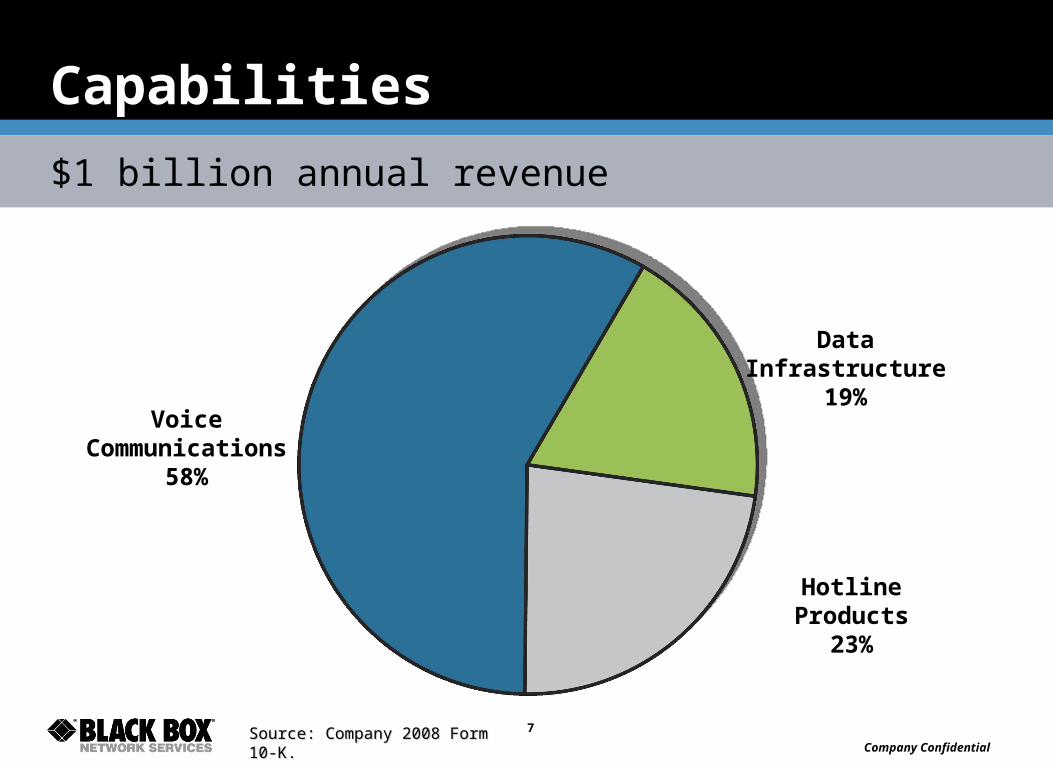
Capabilities
$1 billion annual revenue
VoiceCommunications
58%
DataInfrastructure
19%
HotlineProducts
23%
Source: Company 2008 Form 10-K.Source: Company 2008 Form 10-K.
Company Confidential
8
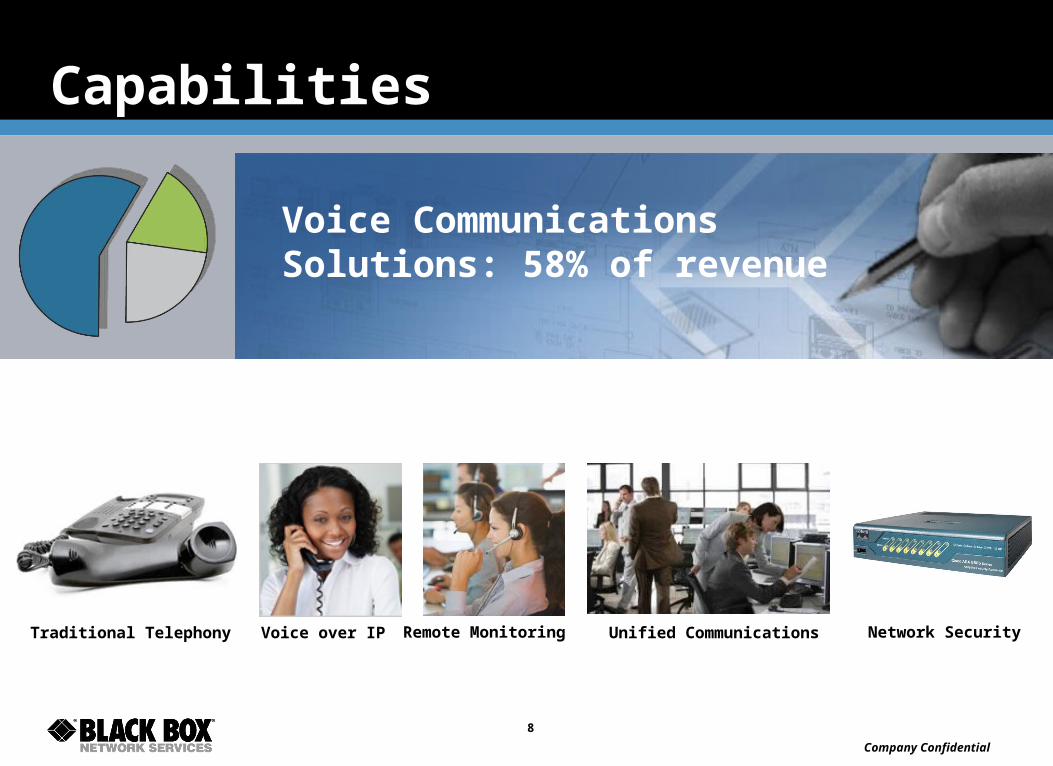
Capabilities
Remote Monitoring Network SecurityVoice over IP Unified CommunicationsTraditional Telephony
Voice Communications Solutions: 58% of revenue
Company Confidential
9
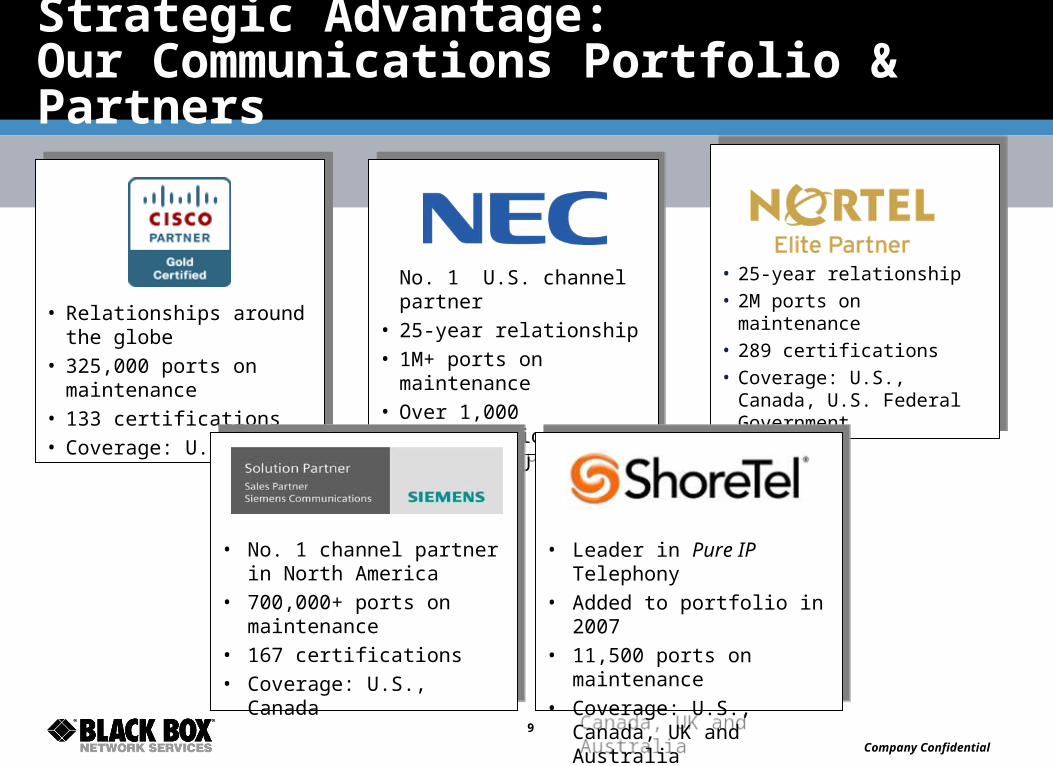
Strategic Advantage: Our Communications Portfolio & Partners
• 25-year relationship• 2M ports on maintenance • 289 certifications• Coverage: U.S., Canada,
U.S. Federal Government
• 25-year relationship• 2M ports on maintenance • 289 certifications• Coverage: U.S., Canada,
U.S. Federal Government
• Relationships around the globe
• 325,000 ports on maintenance
• 133 certifications• Coverage: U.S.
• Relationships around the globe
• 325,000 ports on maintenance
• 133 certifications• Coverage: U.S.
No. 1 U.S. channel partner• 25-year relationship• 1M+ ports on maintenance• Over 1,000 certifications• Coverage: U.S.
No. 1 U.S. channel partner• 25-year relationship• 1M+ ports on maintenance• Over 1,000 certifications• Coverage: U.S.
• Leader in Pure IP Telephony• Added to portfolio in 2007• 11,500 ports on maintenance• Coverage: U.S., Canada, UK
and Australia
• Leader in Pure IP Telephony• Added to portfolio in 2007• 11,500 ports on maintenance• Coverage: U.S., Canada, UK
and Australia
• No. 1 channel partner in North America
• 700,000+ ports on maintenance
• 167 certifications• Coverage: U.S., Canada
• No. 1 channel partner in North America
• 700,000+ ports on maintenance
• 167 certifications• Coverage: U.S., Canada
Company Confidential
10
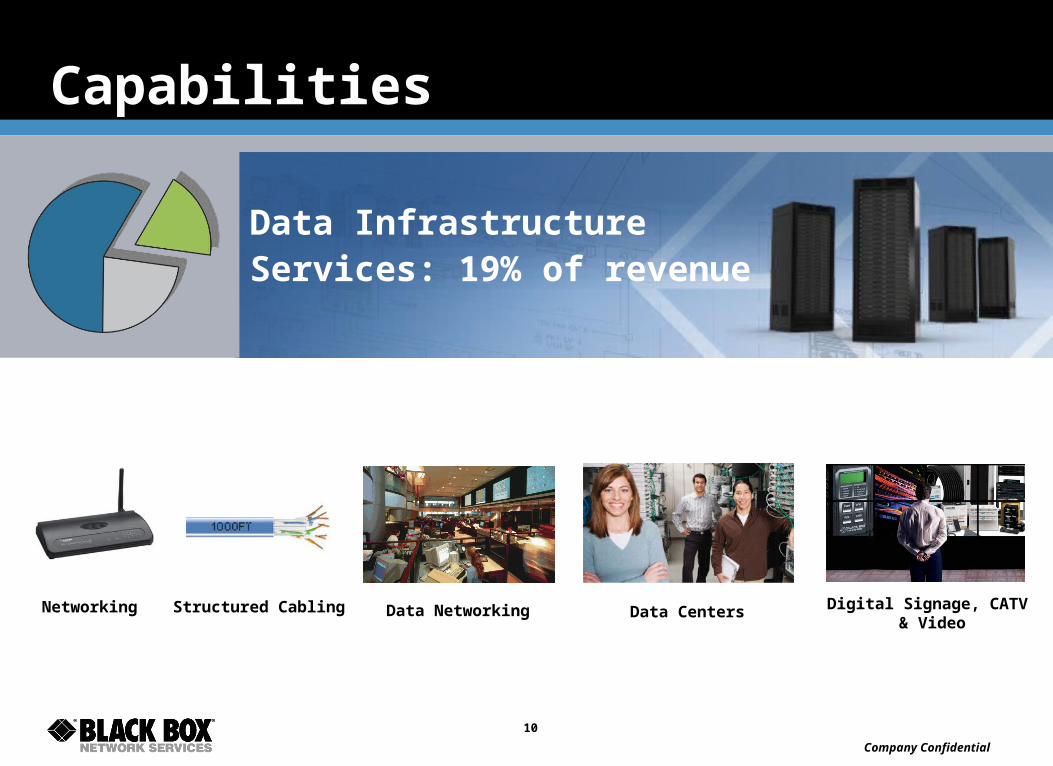
Capabilities
Networking Data CentersData NetworkingStructured Cabling Digital Signage, CATV & Video
Data Infrastructure Services: 19% of revenue
Company Confidential
11
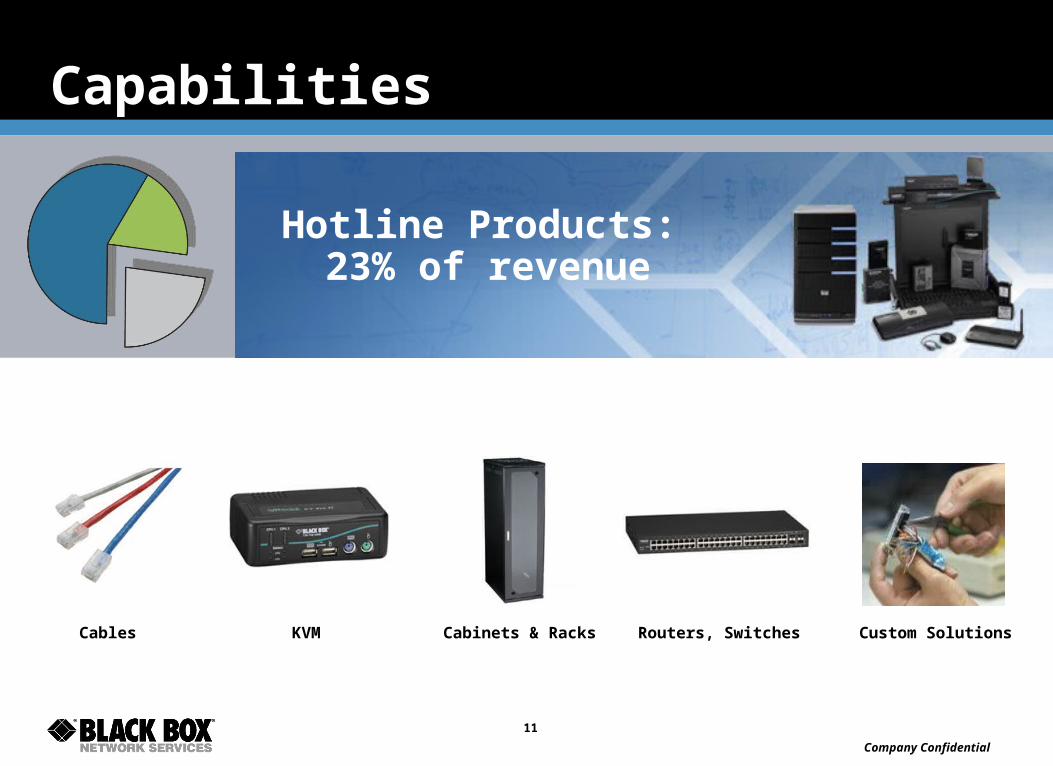
Capabilities
Custom Solutions
Hotline Products: 23% of revenue
Cables Cabinets & RacksKVM Routers, Switches
Company Confidential
12
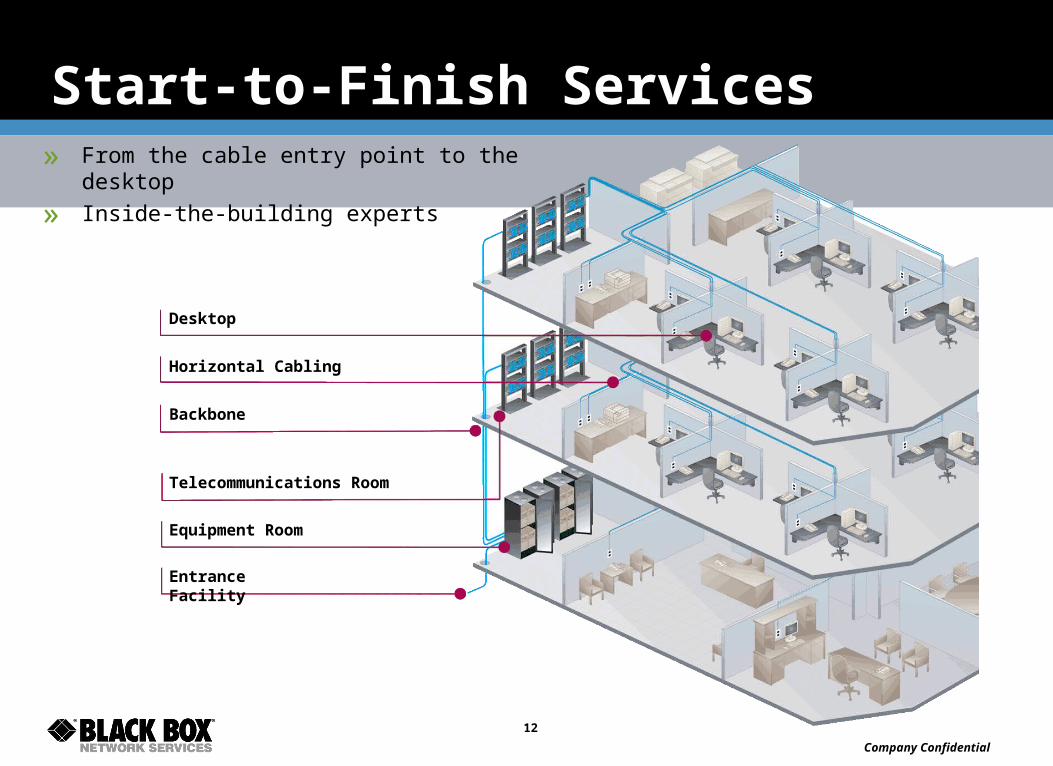
Start-to-Finish Services
Entrance Facility
Equipment Room
Telecommunications Room
Backbone
Desktop
Horizontal Cabling
» From the cable entry point to the desktop
» Inside-the-building experts
Company Confidential
13
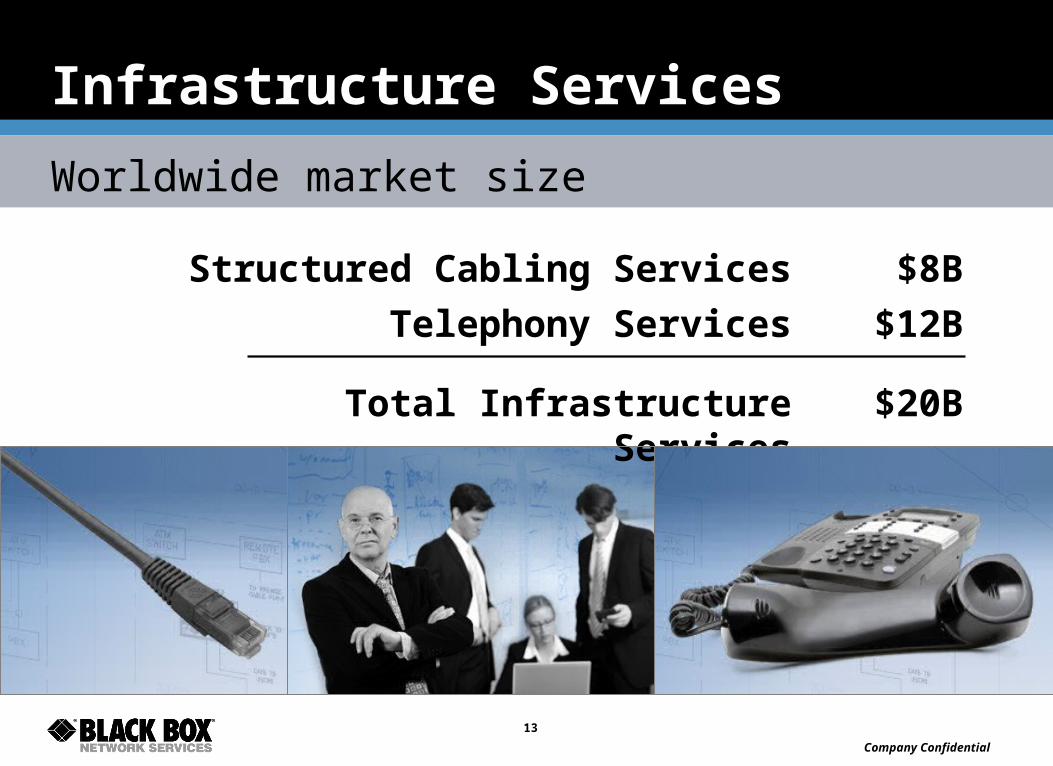
Infrastructure Services
Worldwide market size
Structured Cabling Services $8B
Telephony Services $12B
Total Infrastructure Services $20B
Company Confidential
14
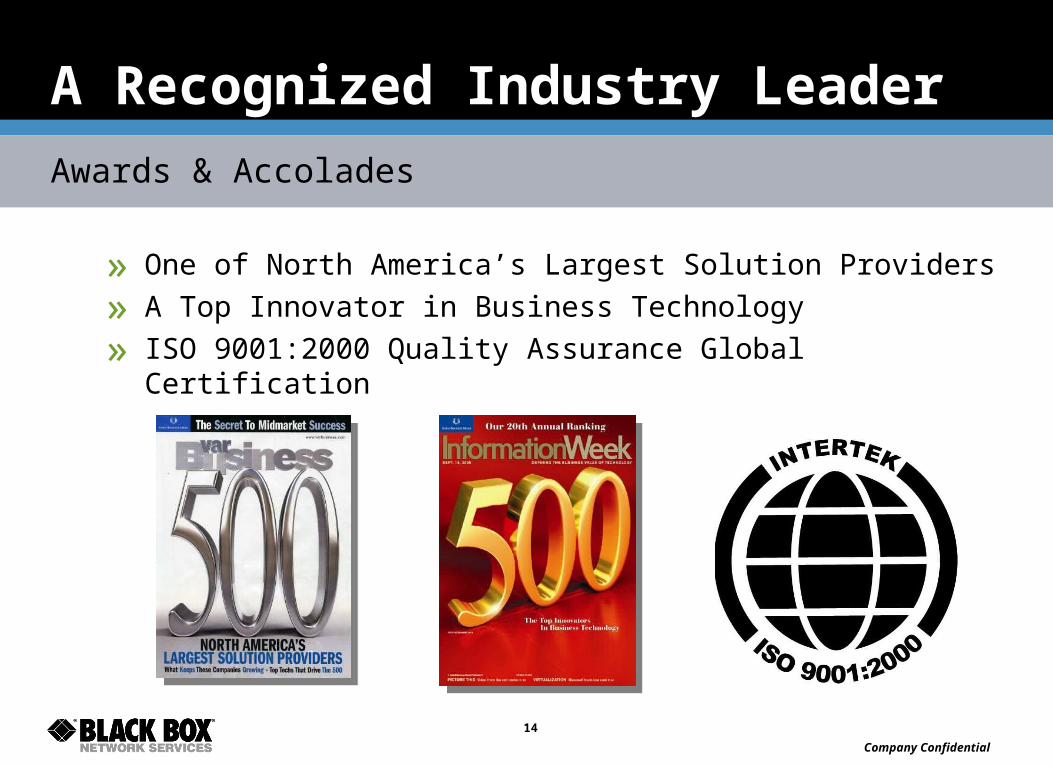
A Recognized Industry Leader
Awards & Accolades
» One of North America’s Largest Solution Providers
» A Top Innovator in Business Technology
» ISO 9001:2000 Quality Assurance Global Certification
Mike McAndrew
Chief Financial Officer
Company Confidential
16
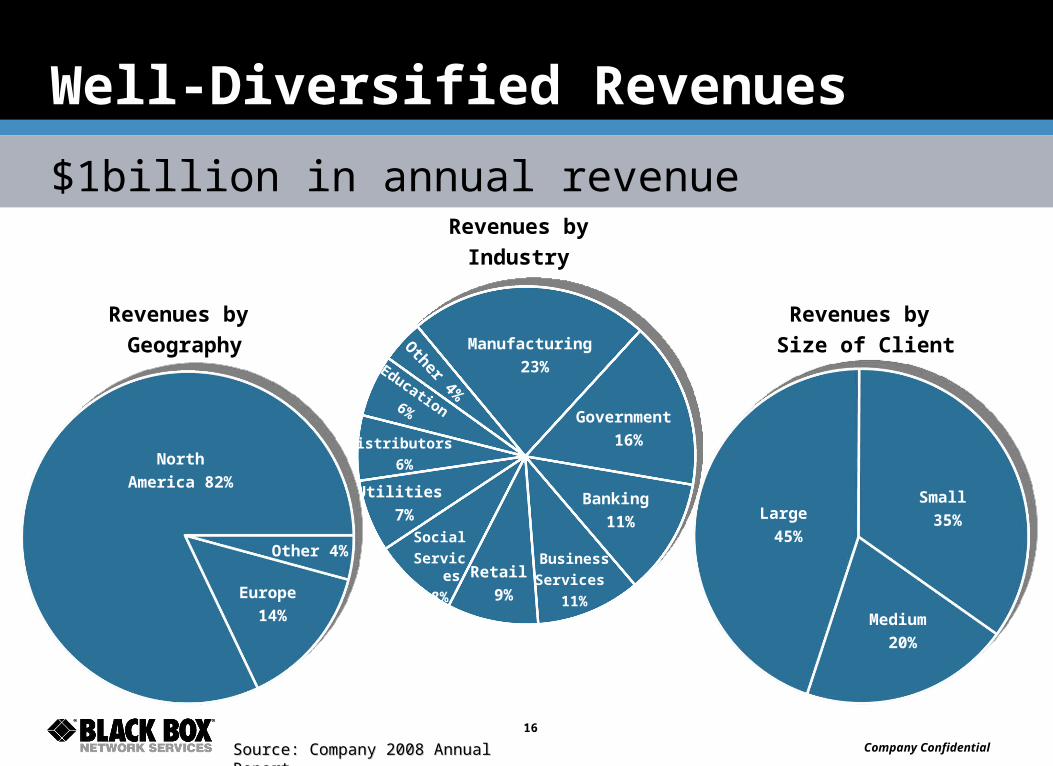
Well-Diversified Revenues
$1billion in annual revenueRevenues by
Industry
Revenues by
Size of Client
Revenues by
Geography
Large
45%
Medium
20%
Small
35%
Manufacturing
23%
Government
16%
Banking
11%
Business
Services
11%
Retail
9%
Utilities
7%
Distributors
6%
Education 6%
Other 4%
Social
Services
8%
North
America 82%
Europe
14%
Other 4%
Source: Company 2008 Annual Report.Source: Company 2008 Annual Report.
Company Confidential
17
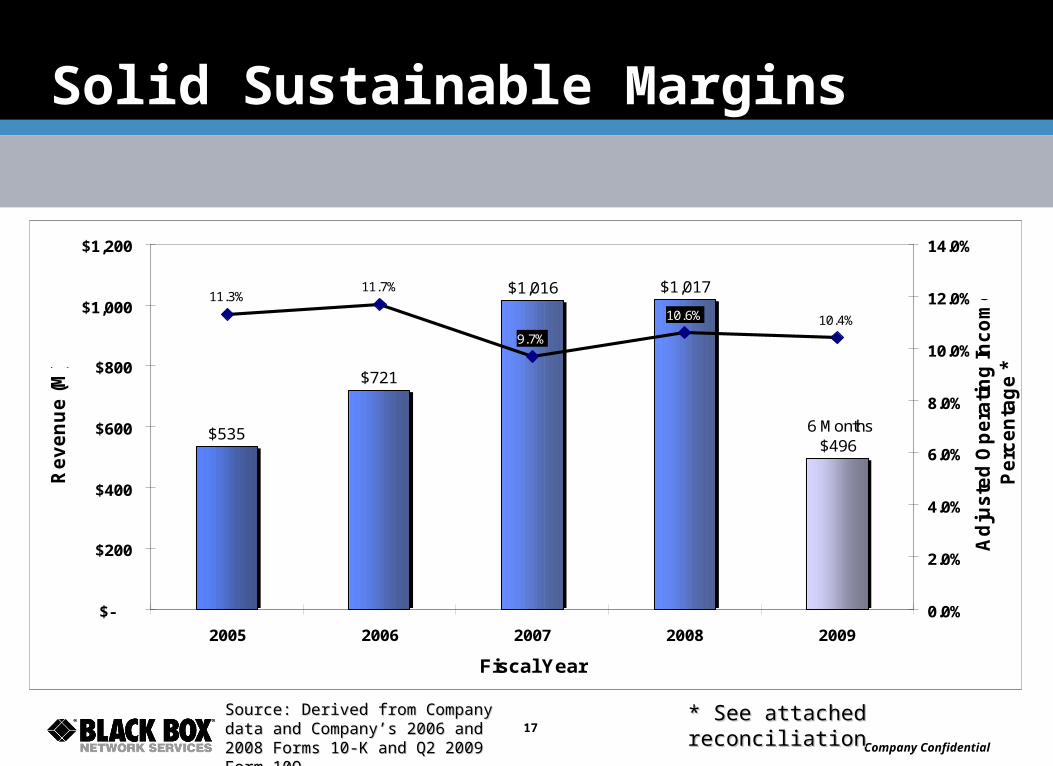
Solid Sustainable Margins
$535
$721
$1,016 $1,017
6 Months$496
11.3%11.7%
10.4%10.6%
9.7%
$-
$200
$400
$600
$800
$1,000
$1,200
2005 2006 2007 2008 2009
Fiscal Year
Re
ve
nu
e (
M)
0.0%
2.0%
4.0%
6.0%
8.0%
10.0%
12.0%
14.0%
Ad
jus
ted
Op
era
tin
g In
co
me
P
erc
en
tag
e *
* See attached reconciliation* See attached reconciliationSource: Derived from Company data Source: Derived from Company data and Company’s 2006 and 2008 Forms and Company’s 2006 and 2008 Forms 10-K and Q2 2009 Form 10Q.10-K and Q2 2009 Form 10Q.
Company Confidential
18
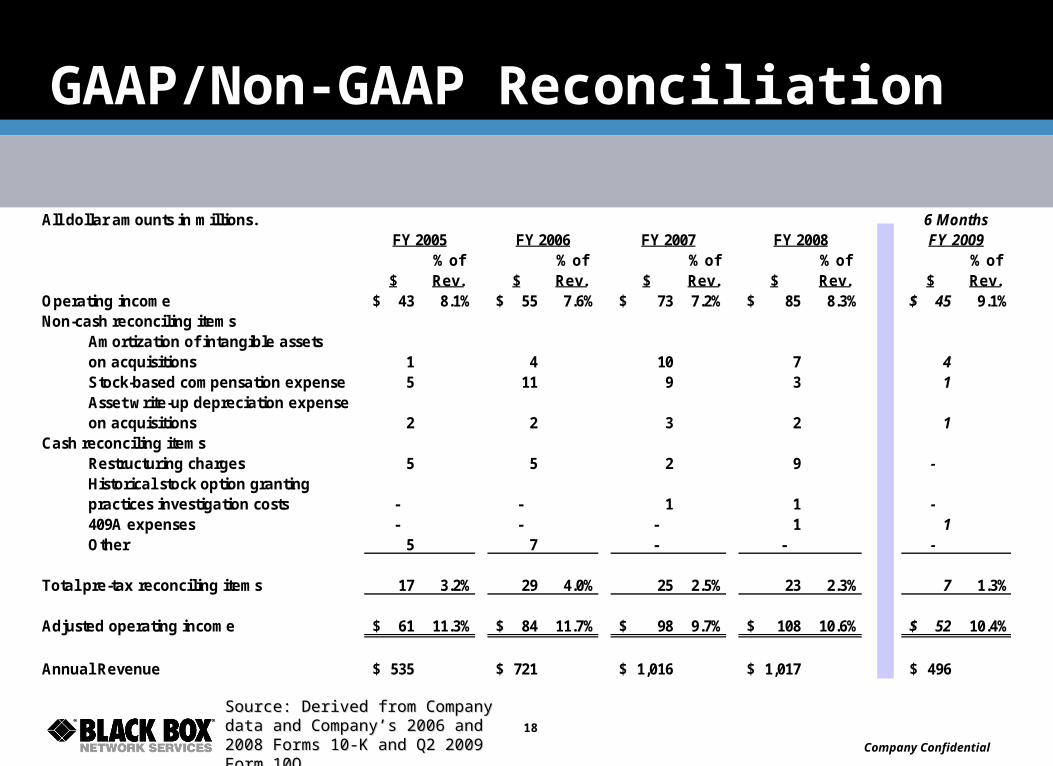
GAAP/Non-GAAP Reconciliation
All dollar amounts in millions.
% of % of % of % of % of$ Rev. $ Rev. $ Rev. $ Rev. $ Rev.
Operating income 43$ 8.1% 55$ 7.6% 73$ 7.2% 85$ 8.3% 45$ 9.1%Non-cash reconciling items
Amortization of intangible assetson acquisitions 1 4 10 7 4 Stock-based compensation expense 5 11 9 3 1 Asset write-up depreciation expenseon acquisitions 2 2 3 2 1
Cash reconciling itemsRestructuring charges 5 5 2 9 - Historical stock option grantingpractices investigation costs - - 1 1 - 409A expenses - - - 1 1 Other 5 7 - - -
Total pre-tax reconciling items 17 3.2% 29 4.0% 25 2.5% 23 2.3% 7 1.3%
Adjusted operating income 61$ 11.3% 84$ 11.7% 98$ 9.7% 108$ 10.6% 52$ 10.4%
Annual Revenue 535$ 721$ 1,016$ 1,017$ 496$
6 MonthsFY 2009FY 2005 FY 2006 FY 2007 FY 2008
Source: Derived from Company data Source: Derived from Company data and Company’s 2006 and 2008 Forms and Company’s 2006 and 2008 Forms 10-K and Q2 2009 Form 10Q.10-K and Q2 2009 Form 10Q.
Company Confidential
19
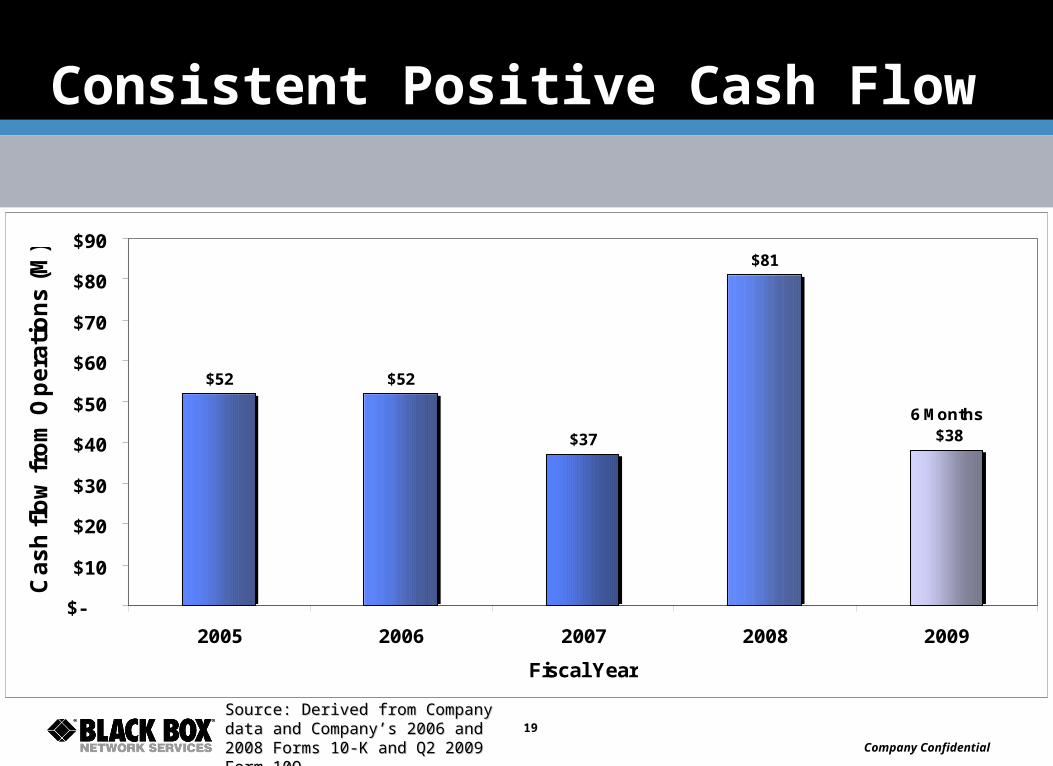
Consistent Positive Cash Flow
$52 $52
$37
$81
6 Months $38
$-
$10
$20
$30
$40
$50
$60
$70
$80
$90
2005 2006 2007 2008 2009
Fiscal Year
Ca
sh
flo
w f
rom
Op
era
tio
ns
(M
)
Source: Derived from Company data Source: Derived from Company data and Company’s 2006 and 2008 Forms and Company’s 2006 and 2008 Forms 10-K and Q2 2009 Form 10Q.10-K and Q2 2009 Form 10Q.
Company Confidential
20
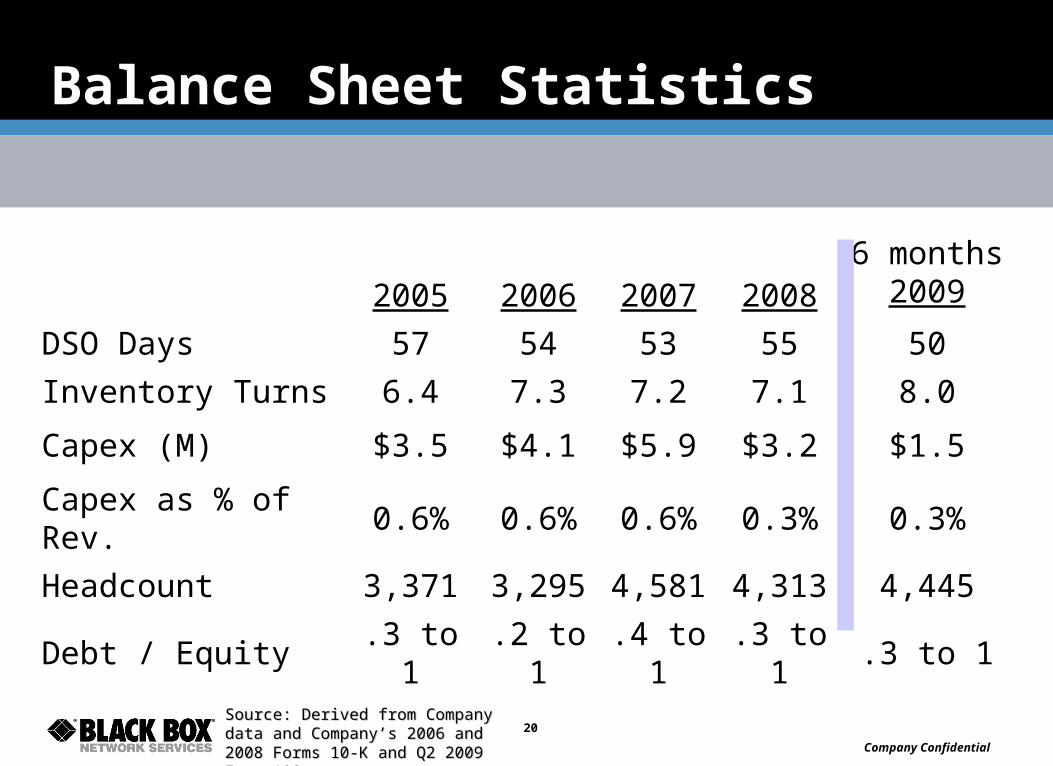
Balance Sheet Statistics
2005 2006 2007 20086 months
2009
DSO Days 57 54 53 55 50
Inventory Turns 6.4 7.3 7.2 7.1 8.0
Capex (M) $3.5 $4.1 $5.9 $3.2 $1.5
Capex as % of Rev. 0.6% 0.6% 0.6% 0.3% 0.3%
Headcount 3,371 3,295 4,581 4,313 4,445
Debt / Equity .3 to 1 .2 to 1 .4 to 1 .3 to 1 .3 to 1
Source: Derived from Company data Source: Derived from Company data and Company’s 2006 and 2008 and Company’s 2006 and 2008 Forms 10-K and Q2 2009 Form 10Q.Forms 10-K and Q2 2009 Form 10Q.
Company Confidential
21
Black Box Network Services (BBOX)
» Well-Diversified Revenues
» Solid, Sustainable Margins
» Consistent, Positive Cash Flow
NASDAQ: BBOX