Nedim Baruh
20
Framework Nedim Baruh Director
Transcript of Nedim Baruh

7/28/2019 Nedim Baruh
http://slidepdf.com/reader/full/nedim-baruh 1/20
Framework
Nedim Baruh
Director

7/28/2019 Nedim Baruh
http://slidepdf.com/reader/full/nedim-baruh 2/20
Agenda
¾ Operational Risk Elements
Strengths & Weaknesses
¾ External Data 101 Types of External Data
Key Considerations
Case Study
¾ Approaches to Uses
Inclusion into Capital Model
Direct & Indirect
¾ Conclusion
©2010 Algorithmics Incorporated. All rights reserved. 2

7/28/2019 Nedim Baruh
http://slidepdf.com/reader/full/nedim-baruh 3/20
Pillar 1 AMA Requirements
Capital model must consider the four data elements
,
The Chief Executive must sign off on a comprehensive waiver application
Internal Loss Data¾ Losses arising from operational
risk events
¾ Collected via an
External Loss Data¾ Losses arising from operational risk events
occurring in other organizations
Collected by external providers or
internal lossreporting process
above a certain
threshold
“An institution must demonstrate that it
has appropriate internal loss
event data , relevant external loss event data ,
consortiums— External databases contain
publicly reported data
— Consortium data contain data
from participating firms
internal controls factors , and results from
scenario analysis to support its operational
risk management and
measurementframework.”
Scenarios
¾ Potential
operational risk
Business Environment &
Control Factors
events could occur
based on business expertise
¾ Collected via a facilitated
workshop
A collection of risk and controls based
on an organization’s processes
A collection of key indicators that aims to proactively
©2010 Algorithmics Incorporated. All rights reserved. 3
ent y potent a areas o r s

7/28/2019 Nedim Baruh
http://slidepdf.com/reader/full/nedim-baruh 4/20
Challenges to Modeling Operational Risk Capital
Understanding the strengths and weaknesses of elements allows for their appropriate use within thecapital modeling methodology and overall management of operational risk
Internal
Data
External
DataScenario RCSA
Can be used to trackaggregateperformance
Can “sum” loss
StrengthsEasily available
from publicandconsortium
Used to identifypotentialevents
Engages business
Used to escalaterisk concernsand controldeficiencies
events both up
and across anorganization
a a ase
providersUsed to inform
aboutotential
units Can be used as
an incentive
Takes a long time to
collect sufficientWeaknesses
events
Relevance
Subjective
Can be difficult to“sum”
Difficult to “sum”
risks,
especially
Lags business andenvironmentalchanges
Scaling issues
Reporting bias
because of overlaps/gaps in scenariogeneration
qualitativerankings
Subjective
Time intensive
©2010 Algorithmics Incorporated. All rights reserved. 4

7/28/2019 Nedim Baruh
http://slidepdf.com/reader/full/nedim-baruh 5/20
Types of External Loss Data
Publically Available Database
FIRST OpData:
Consortium Data
ABA ORX IRST, OpData:losses
ABA, ORX: on-pu c poo e op r s osses
Accurate & Verifiable Provides a wider range of loss
Qualitative & Quantitative: Providesdescriptive info about the loss and the
sever es
More complete loss profile of giveninstitution
• Allows for meaningful data selection & scaling
Analysis of control breakdowns and lessons
Emerging patterns, warning signs, implicationsfor industry
Reporting & control bias;overrepresentation of extreme losses
Relevance; lack of completeness
Lack of detailed event information
©2010 Algorithmics Incorporated. All rights reserved. 5

7/28/2019 Nedim Baruh
http://slidepdf.com/reader/full/nedim-baruh 6/20
Key Considerations
“Reading an article in isolation is not as powerful as reading 40-50 case studies, or being
able to see the whole universe of problems, losses and frauds”
Establishing Relevance
¾Post-mortem analysis – identifying an event trigger , as well as control failings and
contributory factors that allow users to analyze whether it could happen to MY BANK
Risk identification – ’isk identification
an accurate reflection of MY BANK’s which means that risk identification needs to be lookedat in a context broader than one company’s direct loss experience
New product analysis – ew product analysis
integration of risk concerns within the new product approval process so as to help establish
proper controls against identified risks when a new product is brought to market
©2010 Algorithmics Incorporated. All rights reserved. 6

7/28/2019 Nedim Baruh
http://slidepdf.com/reader/full/nedim-baruh 7/20
Asking the right questions
1. Could this type of event happen to me?
. ,
3. If yes, how? What could the impact be?
4. What can I learn from this event?
5. Are there lessons that can help my business become more effective?
6. Can we see any patterns and trends across different events that indicate a growing
concern?
7. Were there any warning signs? Indicators?
.
9. How did management respond to the event?
10. How would our mana ement res ond if this event ha ened to us?
The key is making an event one’s own!
©2010 Algorithmics Incorporated. All rights reserved. 7

7/28/2019 Nedim Baruh
http://slidepdf.com/reader/full/nedim-baruh 8/20
Analyzing Impact
¾ Analyze other organizations’ exposure to the same risks and use that information to.
¾ Develop a catalogue of key “what-if” scenarios:
What will happen if:
a fall in demand for services occurs
em lo ee turnover increases dramaticall
regulations change how services can be priced
certain business practices come under attack by regulators, customers and the media
©2010 Algorithmics Incorporated. All rights reserved. 8

7/28/2019 Nedim Baruh
http://slidepdf.com/reader/full/nedim-baruh 9/20
Public Data: Dispelling the Myths
¾ External events are not relevant to my bank because they occurred to someone elseand in a different control environmentnd in a different control environment
• External events provide the content and context to fully dissect potential problems
• Control breakdowns can be used as a benchmark ‘ ’• an e use o per orm ea -c ec o your an
¾ Only events that occurred to institutions in my same sector and geography arerelevant to meelevant to me
• All firms, no matter their sector, are exposed to national regulations, such as anti-trust andanti-discrimination laws
• – ,
¾
External events occurred in the past and are not relevant to an analysis of whatcould happen in the futureould happen in the future
Similar control breakdowns occur frequently
Patterns can be observed that become predictive of future events
©2010 Algorithmics Incorporated. All rights reserved. 9

7/28/2019 Nedim Baruh
http://slidepdf.com/reader/full/nedim-baruh 10/20
Case Study: Dwelling House S&L (Pittsburgh, PA)
Dwelling House closed on August 14, 2009 by OTS
assume . m on n epos s
Bank had $13.4 million in assets when closed
...and poor bookkeeping that failed to detect crime formore than one year
Criminals transferred proceeds into accounts held with62 financial institutions
Bank’s capital base was depleted by the time the crimewas discovered
opening accounts for prisoners
©2010 Algorithmics Incorporated. All rights reserved. 10

7/28/2019 Nedim Baruh
http://slidepdf.com/reader/full/nedim-baruh 11/20
Case Study: Dwelling House S&L -- Questions
Could such a fraud occur within our organization?
capital base?
Could a smaller fraud occur over a period of timew t ou etect on ou sma w t rawa s o un sby employees or fraudsters add up to somethingsubstantial over time?
What control breakdowns could occur for money to besiphoned out of the bank for over one year withoutdetection?
What is the state of these controls? Are they currently being attended to?
-practices?
Could such practices result in reputational issues?
©2010 Algorithmics Incorporated. All rights reserved. 11

7/28/2019 Nedim Baruh
http://slidepdf.com/reader/full/nedim-baruh 12/20
Approaches to Using Public External Data
Direct Role
Indirect Role
¾ Statistical comparisons identify areas where
external data could be used to ‘fill in’ gaps in
internal data
¾Used to benchmark internal loss data and data
models assuming certain characteristics such as
nature and details - size of loss, categorization
¾ Statistical comparisons identify ways in which
external data could be directly combined with
internal data
¾Techni ues includes
o even are compara e
Informing Scenario Analysis
¾Provide depth of information to ensure
sufficient context for scenario eneration
−EVT Analysis, Body & Tail, Credibility Theory
− Synthetic Data Points
¾Use the event detail as content to build theirown internally relevant scenarios
Assessin Business Control & Environmental Factors− Scaling
• Conventional vs. Statistical
Homogeneity Scaling
¾ Identify potential areas of risk and control
failures by analyzing how similar failures
would occur in one’s own organization• Bayes an Approac to er ve sever ty
distributions
©2010 Algorithmics Incorporated. All rights reserved. 12
7/28/2019 Nedim Baruh
http://slidepdf.com/reader/full/nedim-baruh 13/20
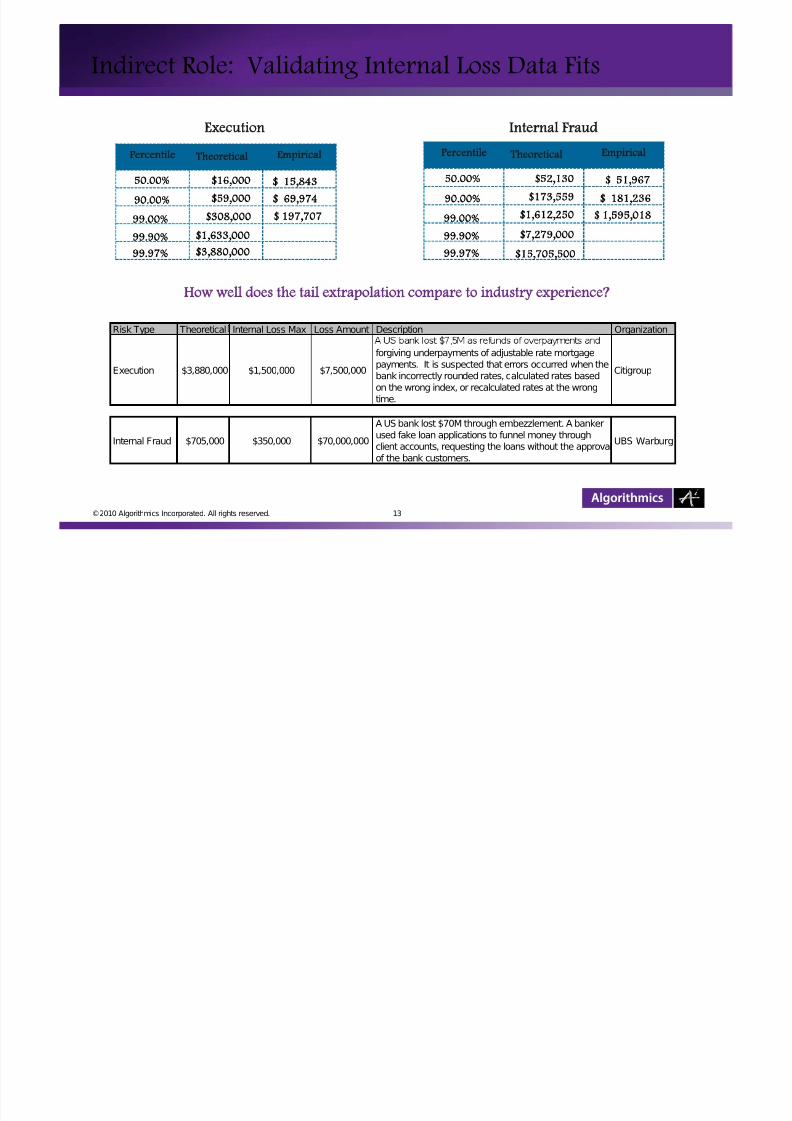
Indirect Role: Validating Internal Loss Data Fits
E i i ll
Execution Internal Fraud
Empiricalercentile Th ti lmpiricalercentile
$16,000
$59,000
$308 000
50.00%
90.00%
$ 15,843
$ 69,974
$ 197 707
Theoretical Empiricalercentile
$52,130
$173,559$1 612 250
50.00%
90.00%
$ 51,967
$ 181,236
$ 1 595 018
Theoretical
$308,000
$1,633,000
$3,880,000
99.00%
99.90%
99.97%
$ 197,707 $1,612,250
$7,279,000
$15,705,500
99.00%
99.90%
99.97%
$ 1,595,018
Risk Type Theoretical Internal Loss Max Loss Amount Description Organization
How well does the tail extrapolation compare to industry experience?
Execution $3,880,000 $1,500,000 $7,500,000
.
forgiving underpayments of adjustable rate mortgage
payments. It is suspected that errors occurred when the
bank incorrectly rounded rates, calculated rates based
on the wrong index, or recalculated rates at the wrong
time.
Citigroup
Internal Fraud $705,000 $350,000 $70,000,000
A US bank lost $70M through embezzlement. A banker
used fake loan applications to funnel money through
client accounts, requesting the loans without the approval
of the bank customers.
UBS Warburg
©2010 Algorithmics Incorporated. All rights reserved. 13

7/28/2019 Nedim Baruh
http://slidepdf.com/reader/full/nedim-baruh 14/20
Indirect Role: Validating Internal Loss Data Fits
Comparing External and Internal LossData Distributions
Severity Distribution
Data Distributions
¾Conduct a qualitative analysis of the external
1.0
a a y assess ng even ca egor a ons,reviewing event details, and analyzing datapatterns and trends
¾Compare the shape of the distributions and
0.9
r o b a b i l i t y
Fitted
size of the losses between internal and externaldata
Plot losses for the internal business unit againstthe CDF of the corres ondin external usiness
0.8
FittedLoss Data (Algo)
unit
QQ-plots
Compare percentiles
0.7
$10,000 $100,000 $1,000,000 $10,000,000 $100,000,000
Loss Amount
xam ne stat st ca measures o goo ness-o - t(KS test, etc)
©2010 Algorithmics Incorporated. All rights reserved. 14

7/28/2019 Nedim Baruh
http://slidepdf.com/reader/full/nedim-baruh 15/20
Indirect Role: Informing Scenario Analysis
Examples: Scenario Analysisuses external data to
Business Unit
Severity Buckets
$100k - $1M $1M - $10M $10M - $20M $20M - $50M $50M - $100M $100M+Risk Type
Max Single
generate scenario examplesof potential losses that
‘could happen’
Internal Fraud 11 11 0.15 0.05 0.05 0.05 100M
External Fraud 0.67 2 0.2 0.1 0.02 0.01 250M
CPBP 1.33 0.67 0.1 0.05 0.67 0.02 30M
EPWS 5 2 0.2 0.1 1.33 0.02 50MBDSF 0.67 0.1 0.05 0.15 5 0.05 500M
Max Loss: External data isused to determine the
EDPM 2 0.2 0.1 0.2 0.67 0.05 100M
DPA 11 0.5 0.1 0.2 0.2 0.15 20M
appropr ate s ze o a s ng emaximum loss event for a given event type Distribution of losses
Probability
Control Breakdowns:
Interviews, an important UnexpectedExpected,
used to determine wherecontrol breakdowns couldoccur - an o erational loss
LossesLosses
©2010 Algorithmics Incorporated. All rights reserved. 15
. percen eAnnual aggregate
loss ($)

7/28/2019 Nedim Baruh
http://slidepdf.com/reader/full/nedim-baruh 16/20
Indirect Role: Max Loss Example
• “Sample Bank” has Structured ScenarioEvent Type
10K -
50K
50K -
100K
100K -
250K
250K -
500K
500K -
1MM
1MM + Max Loss
• Workshop participants provided incomplete
Risk Scenario 1 0.2 0.1 0.1 0.05 0.02
Risk Scenario 2 0.1 0.05
Risk Scenario 3 0.1 0.05 0.04 0.04 0.04 0.04 100k
Risk Scenario 4 0.05 0.05 0.05 0.05 0.05 0.2Risk Scenario 5 0.05 0.02 1mm
max oss a a po n s an max oss es ma es
that were low compared to industry data
Sample BankExternal Data
Max Loss
• “Sample Bank” can directly incorporate loss
amounts from external data that could
represent the max loss
Risk Scenario 11mm
Risk Scenario 2 25mm
Risk Scenario 3 100k
Risk Scenario 4 2.5mm
• Step1: Perform qualitative analysis
• Step 2: Map relevant BU/ETs
• Ste 3: Review size of relevant losses
s cenar o mm
• Step 4: Generate frequency/severity dist.
• Step 5: …………….
©2010 Algorithmics Incorporated. All rights reserved. 16

7/28/2019 Nedim Baruh
http://slidepdf.com/reader/full/nedim-baruh 17/20
Indirect Role: Assessing BC&E Factors
Risk & Control Self-Assessments
Provides content and context for events used
to compare whether an organization is
¾ exposed to similar risks
¾ vulnerable to similar control weaknesses
Key Indicatorsey Indicators
Used to find commonalities among events
¾ Identifying commonalities help uncover
characteristics of a specific type of event
¾These indicators could be monitored over time to
identify the trends that would trigger a similarevent to appen
¾Indicators could be internal as well as external
(e.g., Cyclicality of Operational Risk: The Tracking
©2010 Algorithmics Incorporated. All rights reserved. 17

7/28/2019 Nedim Baruh
http://slidepdf.com/reader/full/nedim-baruh 18/20
Direct Role: Addressing the Paucity of Internal Data
External data is necessary here e r o f e v e n t
N u m
Size of loss
Prerequisite:Good internal data but missing tail, good external data to describe tail
Assumption:External data comes from identified eers and relevance to same external data set
Modeling Approaches:
¾Extreme Value Theory principles applied to external data used to complete the loss distribution
¾Body & Tail combination modeling to complete risk profile, with internal data for the body and external data
as for the tail of the distribution
¾Use Credibility Theory to combine components of the severity distribution
©2010 Algorithmics Incorporated. All rights reserved. 18
− Useful in stress testing impact of use of external data

7/28/2019 Nedim Baruh
http://slidepdf.com/reader/full/nedim-baruh 19/20
Direct Role: ‘Filling Out’ the ‘Fat Tail’
External data is necessary here e r o f e v e n t
N u m
Size of loss
Prerequisite:Available internal data but with gaps
Assumption:External data comes from identified eers and direct relevance to same external data set
Modeling Approaches:
¾Synthetic Data Point methodology by utilizing external data with assigned likelihoods, incorporate intointernal data set and fit a severity distribution across data set
¾Max Loss helps address the max loss question by directly incorporating loss amounts that could represent
the max loss
©2010 Algorithmics Incorporated. All rights reserved. 19

7/28/2019 Nedim Baruh
http://slidepdf.com/reader/full/nedim-baruh 20/20
Conclusion
¾ External data can be used either directly in operational risk capital models to address gaps or
¾ It is important to understand the drawbacks of external data and to use it in the most effective
¾ In deciding how to incorporate external data, it is important to evaluate the “inventory” of
n erna a a ava a e o an ns u on – s w e erm ne ow es o u ze ex erna a a
Industry best practice and the most effective way is to use external data is in a supporting
ro e o n erna a a, scenar os an us ness con ro env ronmen a ac ors
Using external data directly in capital modeling opens up additional questions aboutassumptions t at may e i icu t to support an e en ot interna y to usiness managers
and externally to regulators
©2010 Algorithmics Incorporated. All rights reserved. 20