
ND Transition Follow-up · ND Transition Follow-up . Annual Report . ... after Exit.....25 . ......
69
i ND Transition Follow-up Annual Report Spring 2009 prepared by Janet E. Green, MS This document was prepared by NDCPD at Minot State University through a contract by North Dakota Department of Public Instruction (NDDPI). The opinions expressed here are those of the authors and do not necessarily reflect the opinions or policy of NDDPI.
Transcript of ND Transition Follow-up · ND Transition Follow-up . Annual Report . ... after Exit.....25 . ......

i
ND Transition Follow-up
Annual Report Spring 2009
prepared by
Janet E. Green, MS
This document was prepared by NDCPD at Minot State University through a contract by North Dakota Department of Public Instruction (NDDPI). The opinions expressed here are those of the authors and do not necessarily reflect the opinions or policy of NDDPI.

ii
Table of Contents
Sections
Introduction ..........................................................................................................................1 Section One 2008 Exit Survey .........................................................................................3 2004 – 2008 Exit Survey Comparison ......................................................12 Section Two 2007 Follow-up Interview: One Year after High School Exit..................18 Section Three 2003 – 2007 Follow-up Interview Comparison One year after High School Exit ................................................................................................36
Tables and Figures
Tables Table 1 - Student Numbers for Participating Special Education Units in 2008 ..................4 Table 2 - Racial/Ethnic Groups of 2008 Exiters ..................................................................5 Table 3 - Disability Categories of 2008 Exiting Students ...................................................6 Table 4 - 2008 Adult Providers Who May Assist You After High School .........................9 Table 5 - Occupational Skills Attained by the Student during High School in 2008 ...............................................................................................................10 Table 6 - Student Satisfaction with Various High School Programs in 2008 ....................11 Table 7 - 2008 Program Rating Grade Point .....................................................................11 Table 8 - 2008 Choices for Additional Coursework. .........................................................11 Table 9 - Postsecondary Plans (2004-2008) ......................................................................13 Table 10 - Adult Providers Who Will Help Student as Identified in IEP (2004-2008).......................................................................................................14 Table 11 - Reasons for Exit (2004-2008) ..........................................................................15 Table 12 - Racial/Ethnic Groups of 2008 Follow-up Participants .....................................21 Table 13 - Disability Categories of 2008 Follow-up Participants .....................................22 Table 14 - Who Served as the Source for this Information? ..............................................22 Table 15 - Enrollment in Postsecondary Education since High School ............................24 Table 16 - Other Types of Postsecondary Education .........................................................25 Table 17 - Reasons for not Enrolling in Postsecondary Education at One Year after Exit............................................................................................................25 Table 18 - Other Reasons for not Enrolling in Postsecondary Education .........................25 Table 19 - Employment Status at One Year after Exit ......................................................26 Table 20 - Other Identified Types of Employment ............................................................27 Table 21 - Reasons for not Working at One Year after Exit .............................................27 Table 22 - Other Reasons for not Working ........................................................................28 Table 23 - Categories of Hours Worked per Week at One Year after Exit .......................28 Table 24 - Categories of Hourly Wages at One Year after Exit ........................................29 Table 25 - Does the Student Have Health Insurance? .......................................................30 Table 26 - Living Arrangements at One Year after Exit ...................................................31 Table 27 - Student Chose to Drop Out of School ..............................................................31 Table 28 - Changes to High School Experience at One Year after Exit ............................32

iii
Table 29 - Reasons Student Were Not Prepared for Life after High School .....................33 Table 30 - Reasons Student Were Prepared for Life after High School ............................33 Table 31 - Referral to Adult Services at One Year after Exit ............................................34 Table 32 - Other Adult Services to which Students were Referred ...................................34 Table 33 - Receipt of Services for Disabilities at One Year after Exit ..............................34 Table 34 - Service Providers from which Disability Services are Received .....................35 Table 35 - Living Arrangements at One Year after Exit (2003-2007) .............................38 Table 36 - Services Received at One Year After High School Exit (2003-2007) .............40 Figures Figure 1 - 2008 Participation in Exit IEP.............................................................................7 Figure 2 - Postsecondary plans for 2008 exiters ..................................................................7 Figure 3 - IEP included Independent Living goal ................................................................8 Figure 4 - Reasons for exit in 2008 ......................................................................................9 Figure 5 - Participants in exit study from 2004 through 2008 ...........................................13 Figure 6 - Percent of employment and postsecondary education plans (2004-2008) ........14 Figure 7 - Percent graduated with diploma (2004-2008) ...................................................15 Figure 8 - Satisfaction with overall high school program as GPA (2004-2008) ...............16 Figure 9 - Satisfaction with vocational or transition aspect of high school as GPA (2004-
2008) ......................................................................................................................16 Figure 10 - Satisfaction with special education program as GPA (2004-2008) ................17 Figure 11 - Choices for additional coursework (2004-2008).............................................17 Figure 12 - Employment and postsecondary enrollment of 2007 exiters at one year after high school ......................................................................................................23 Figure 13 - Types of postsecondary education enrollment (2007 exiters).........................24 Figure 14 - Categories of employment at one year after exit ............................................26 Figure 15 - Percents of full-time and part-time employment at one year after exit ...........28 Figure 16 - Categories of hourly wage at one year after exit .............................................29 Figure 17 - Source of health insurance at one year after exit ............................................30 Figure 18 - Three most common living arrangements at one year after exit ....................31 Figure 19 - Perceived preparation for life after leaving high school at one year after exit....................................................................................................................33 Figure 20 - Student attendance in postsecondary education or training since exiting high school (2003-2007) .........................................................................................37 Figure 21 - Percent of students employed at the time of the follow-up interview (2003-2007).....................................................................................................37 Figure 22 - Highest reported living arrangement at one year after exit (2003-2007).....................................................................................................38 Figure 23 - Perceived preparation for life after high school at one year after exit (2003-2007)......................................................................................................39 Figure 24 - Percent of students receiving services for his/her disability at one year after exiting high school (2003-2007) ......................................................................40

iv
Appendices A - 2008 Exit Survey Directions ........................................................................................41 B - 2008 Follow-up Interview Questions...........................................................................46 C - Frequently Asked Questions ........................................................................................51 D - Follow-up Interview Text Responses ..........................................................................53

1
Introduction
Education laws have been in the spotlight recently, specifically No Child Left
Behind and the changes in Individuals with Disabilities Education Improvement Act
(IDEA 2004). At the national level, indicators have been developed to hold states
accountable for student outcomes, including transition from high school to post
secondary activities. State personnel must assure that students with disabilities receive an
appropriate education, stay in school, make progress in the general education curriculum,
and make a smooth transition from school to post secondary education and employment.
The focus on transition began with the National Longitudinal Transition Study (NLTS)
(from 1985-1993) through the second National Longitudinal Transition Study (NLTS-2)
(from 2001-2009). Data from these studies show that students with disabilities face
several unique challenges in accessing, participating, and benefiting from school and
post-school support systems.
To meet accountability requirements, state personnel have developed methods to
collect data on statewide efforts of improving outcomes for students with disabilities. The
data results are reported in various documents (e.g., State Performance Plans, Annual
Performance Reports, and Performance Report Cards). For the past ten years, the North
Dakota Department of Public Instruction (NDDPI) has conducted annual studies to
determine the exit and post-school perceptions and outcomes of students with disabilities.
In 1998, staff from the NDDPI conceptualized a two-phase study to follow
students with disabilities as they left the public education system. The study was a
longitudinal project that examined student status at exit from high school, and again at
one and three year intervals post-school. The study now collects data only at the time of

2
school exit and one year later. Items of interest include satisfaction with high school,
involvement in transition planning, and degree of post-school involvement in
employment, education, and services. School personnel assist students in completing the
exit interviews. The North Dakota Center for Persons with Disabilities (NDCPD) project
staff and Minot State University (MSU) students conduct the follow-up telephone
interviews.
Section One is a summary of the data and results of the 2008 Exit Survey of North
Dakota (ND) students with and without disabilities. Educators in special education
classrooms across the state facilitated the collection of the raw data. The 2008 Online
Exit Survey data for special education programs and the comparison data across the most
recent five exiting cohorts (2004-2008) are reported. Section Two is a summary of
follow-up data at one year after exiting high school for students. Participants in the
follow-up interview included those who completed the Exit Survey at high school exit as
well as high school exiters included in the NDDPI data set. This section presents data
from the 2008 Follow-up Interview: One Year after High School Exit. Section Three,
titled 2003-2007 Follow-Up Interview Comparison: One Year after High School Exit,
offers a review of the one year follow-up data across the five most recent special
education cohorts.
3
Section One
2008 Exit Survey And
2004 – 2008 Exit Survey Comparison
Data Collection Method
Data for this report were collected through a process established by the NDDPI.
The NDDPI contracted with the NDCPD to collect data on students in special education
and general education who exited high school.
Instrument. Prior to the 2004 Online Exit Survey, data were collected using a
paper format of the Exit Survey. The Exit Survey was originally developed after
extensive literature and material review. The NDDPI staff provided the NDCPD project
staff with an initial outline of items for the 2006, 2007, and 2008 Exit Surveys based on
the National Post School Outcomes (NPSO) Center recommendations. Items were
analyzed and useful structural features were selected. Questions and response options
from previous years were revised to elicit more specific information. Several items on the
survey were presented in slightly different formats.
Procedures. Students exiting high school by graduating, aging out of services, or
dropping out were assisted with the completion of the survey by special education staff.
Written directions (see Appendix A) were provided to the school staff regarding the data
collection process. School staff were instructed to assist students in completing the 2008
Online Exit Survey or to conduct personal interviews with each student who was exiting
the special education program. Additional information was available in the student’s
school file or on the individual education program (IEP). Following the interview and file
review, school staff, along with the student when possible, entered data into the 2008

4
Online Exit Survey. The NDDPI staff responded to procedural questions about the
survey. Computer related technical support was provided to school personnel by the
NDCPD project staff.
After all special education units reported that they had completed the 2008 Online
Exit Survey, the NDCPD project staff locked the survey. Data was exported from the
program to an Excel document in which students were assigned an identification number.
The identification number was used to maintain confidentiality.
Participants
Participating special education units. Twenty-seven special education units
participated in the 2008 special education exit survey, resulting in 514 exit interviews.
Those not participating did not have exiters from their special education programs in the
2007-2008 academic year. All ND special education units were asked to participate. The
“other” category from which participants came included private schools not specifically
included in a special education unit (i.e., Dakota Memorial School, Marmot High School,
Anne Carlsen Center for Children, and School for the Deaf). Numbers of students and
percentages of the total response set are shown in Table 1.
Table 1. Student Numbers for Participating Special Education Units in 2008. Special Education Unit (SEU) No. Students Percentage* Bismarck 52 10.1% Buffalo Valley 21 4.1% Dickey/LaMoure 9 1.8% Dickinson 17 3.3% East Central 5 1.0% Fargo 58 11.3% Grand Forks 39 7.6% Griggs/Steele/Traill 13 2.5% Lake Region 39 7.6% Lonetree 16 3.1% Morton/Sioux 26 5.1% Northern Plains 8 1.6%

5
Oliver/Mercer 6 1.2% Other 15 2.9% Peace Garden 24 4.7% Pembina 15 2.9% Rural Cass 6 1.2% Sheyenne Valley 17 3.3% Souris Valley 18 3.5% South Central Prairie 2 0.4% South Valley 11 2.1% Turtle Mountain 14 2.7% Upper Valley 20 3.9% Wahpeton 9 1.8% West Fargo 25 4.9% West River 13 2.5% Wilmac 16 3.1% TOTAL 514 100.0% * Percentage of 514 respondents, rounded to nearest tenth of a percent.
Student demographic data. The special education cohort consisted of 341 male
(66.3%) and 173 female (33.7%) students. Table 2 shows the racial/ethnic background of
the participants.
Table 2. Racial/Ethnic Groups of 2008 Exiters. Racial/Ethnic Group Frequency Percentage
White/Caucasian 441 85.8% American Indian 41 8.0% Hispanic 4 0.8% Black 12 2.3% Asian/Pacific Islander 1 0.2% Other 15 2.9%
Disability category. Table 3 shows the disability categories of students exiting
special education programs. As with recent reports, the most frequently listed primary
disability was specific learning disabilities (51.9%). This was followed by emotional
disturbance (13.2%), other health impairment (11.7%), and mental retardation (10.7%).
These four categories represent approximately 87.5 percent of all participating special
education exiters.

6
Table 3. Disability Categories of 2008 Exiting Students. Category Label Frequency Percentage
Specific Learning Disability 267 51.9% Emotional Disturbance 68 13.2%
Other Health Impairment 60 11.7% Mental Retardation 55 10.7% Speech Impairment 34 6.6%
Autism 14 2.7% Hearing Impaired 5 1.0%
Orthopedic Impairment 5 1.0% Deaf 3 0.6%
Traumatic Brain Injury 2 0.4% Visual Impairment 1 0.2%
Blind 0 0.0% Deaf/Blind 0 0.0%
Results The following section presents the results of the Exit Survey that was completed
online beginning in the spring of 2008. Each item on the survey is presented followed by
the responses from special education exiters in 2008.
What was your level of attendance and participation in the most recent and/or
exit IEP meeting? Exiting students had the following options available for selection:
attended and actively participated; attended, but did not participate; invited but did not
attend; and not invited. Based on the data, most students exiting special education
(84.6%) attended and actively participated in their IEP meeting. See Figure 1.

7
Figure 1. 2008 Participation in Exit IEP.
What are your plan after high school? Figure 2 shows the data on the 2008
exiting students’ post-school employment/education plans. Almost half of the students
exiting special education (44.0%) indicated anticipated employment, followed by
vocational training (39.3%).
Figure 2. Postsecondary plans for 2008 exiters.

8
Did the postsecondary goals identified on your IEP include an Independent
Living goal? Response options for this question included yes or no. Figure 3 indicates
that over half of the participants had an Independent Living goal included in their IEP.
Five participants (1.0%) did not respond to this item.
Figure 3. IEP included Independent Living goal.
Identify Adult Service Providers who have been identified in the IEP that will
provide services to you after you graduate from high school. The transition services
needed for students to reach their post-secondary goals are identified on the IEP and may
include the following adult service providers: Vocational Rehabilitation, Developmental
Disabilities, Job Service, Social Security, University or College Disability Support
Services, and Adult Learning Centers. Table 4 lists the service providers chosen by
students based on participator’s responses. It was reported that two-thirds of the students
exiting special education programs had an identified possible future need for services
from Vocational Rehabilitation (66.7%) and more than one third from College/University
Disability Support Services (31.9%). Sixteen (3.1%) students exiting special education

9
programs did not respond.
Table 4. 2008 Adult Providers Who May Assist You After High School. Service Provider Frequency Percentage
Vocational Rehabilitation 343 66.7% Developmental Disabilities 55 10.7% Centers for Independent Living 18 3.5% Mental Health Services 11 2.1% Job Services 80 15.6% Social Security 42 8.2% College/University Disability Support Services 164 31.9% Adult Learning Center 9 1.8% Other 44 8.6% None needed 72 14.0% DNR 16 3.1% Note: Percentages are based on total participants and rounded to the nearest tenth a percent. More than one response could be selected.
Why did you exit high school? Figure 4 shows the breakdown of reasons for the
students exiting school. For students exiting special education programs in 2008, 88.5
percent graduated with a diploma, 0.8 percent graduated with a certificate of completion,
4.7 percent aged out, 4.5 percent dropped out, and 1.6 percent did not respond to this
item.
Figure 4. Reasons for exit in 2008.
10
Not all exiting students from special education are represented in this survey
which may account for discrepancies in drop out rates. Only students who were still in
school at the time of the 2008 Online Exit Survey participated in the study; therefore the
drop out rate for special education participants is not accurate. Refer to the Data
Collection Methods section on page 3 for further details on participation.
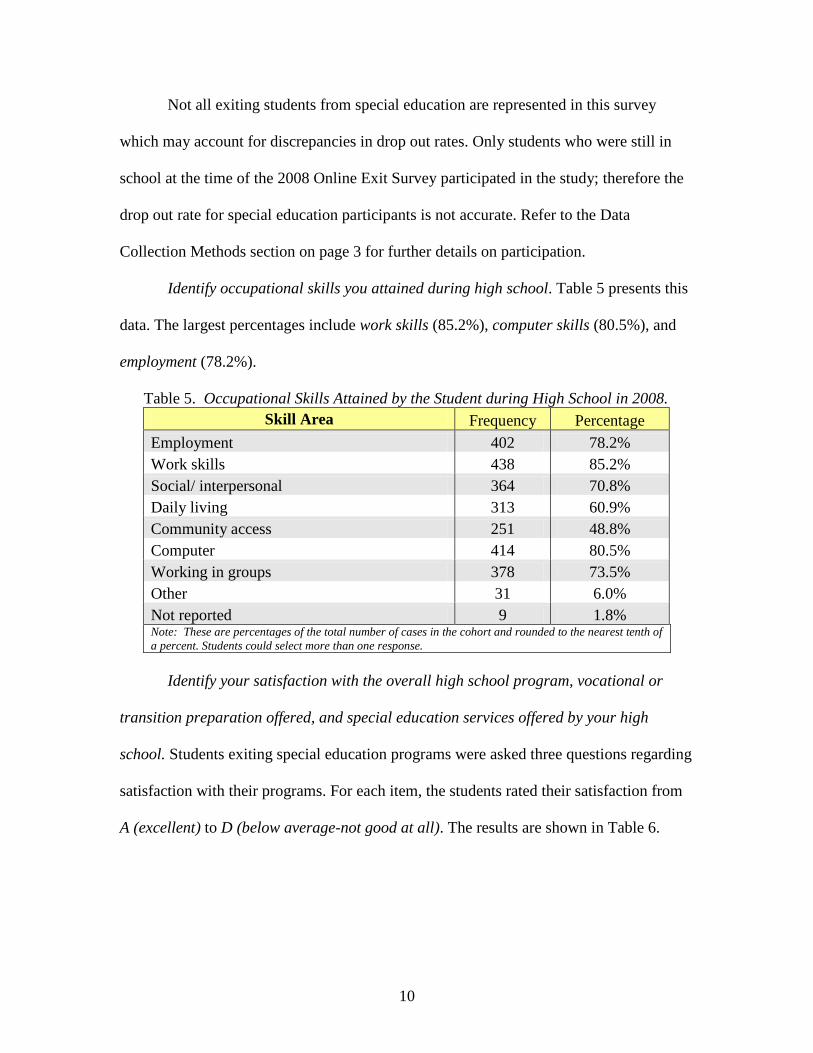
Identify occupational skills you attained during high school. Table 5 presents this
data. The largest percentages include work skills (85.2%), computer skills (80.5%), and
employment (78.2%).
Table 5. Occupational Skills Attained by the Student during High School in 2008. Skill Area Frequency Percentage
Employment 402 78.2% Work skills 438 85.2% Social/ interpersonal 364 70.8% Daily living 313 60.9% Community access 251 48.8% Computer 414 80.5% Working in groups 378 73.5% Other 31 6.0% Not reported 9 1.8% Note: These are percentages of the total number of cases in the cohort and rounded to the nearest tenth of a percent. Students could select more than one response.
Identify your satisfaction with the overall high school program, vocational or
transition preparation offered, and special education services offered by your high
school. Students exiting special education programs were asked three questions regarding
satisfaction with their programs. For each item, the students rated their satisfaction from
A (excellent) to D (below average-not good at all). The results are shown in Table 6.
11
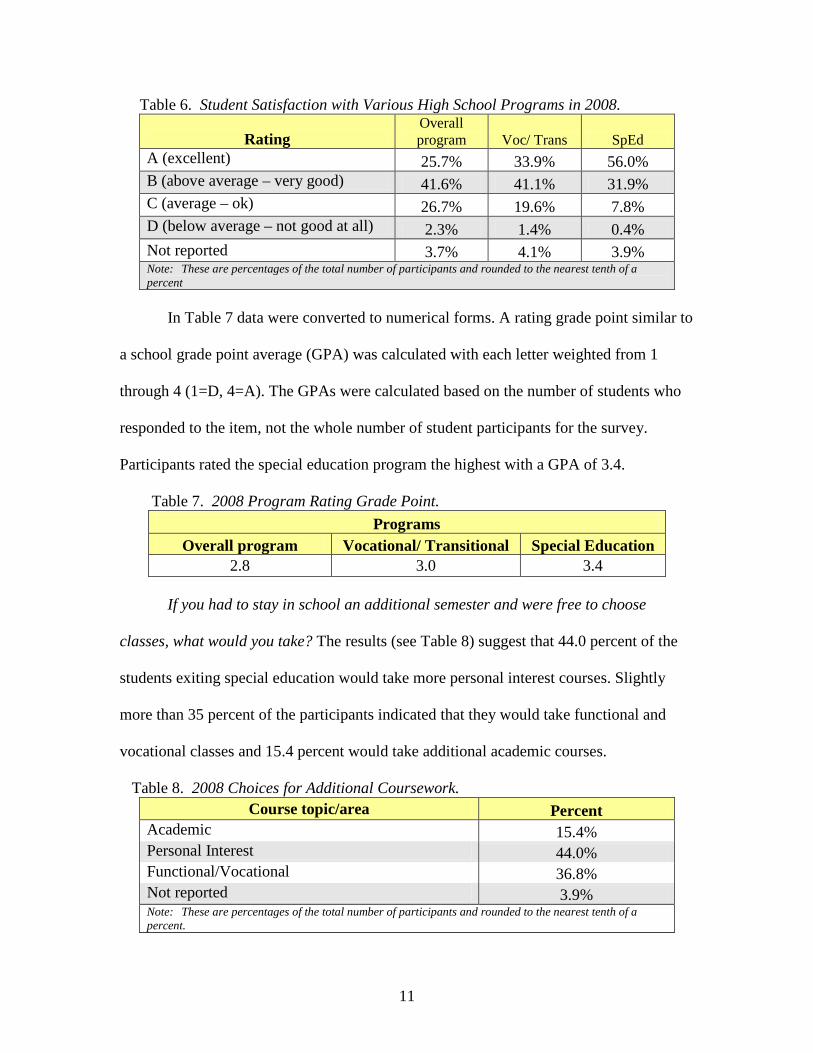
Table 6. Student Satisfaction with Various High School Programs in 2008.
Rating Overall program Voc/ Trans SpEd
A (excellent) 25.7% 33.9% 56.0% B (above average – very good) 41.6% 41.1% 31.9% C (average – ok) 26.7% 19.6% 7.8% D (below average – not good at all) 2.3% 1.4% 0.4% Not reported 3.7% 4.1% 3.9% Note: These are percentages of the total number of participants and rounded to the nearest tenth of a percent
In Table 7 data were converted to numerical forms. A rating grade point similar to
a school grade point average (GPA) was calculated with each letter weighted from 1
through 4 (1=D, 4=A). The GPAs were calculated based on the number of students who
responded to the item, not the whole number of student participants for the survey.
Participants rated the special education program the highest with a GPA of 3.4.
Table 7. 2008 Program Rating Grade Point. Programs
Overall program Vocational/ Transitional Special Education 2.8 3.0 3.4
If you had to stay in school an additional semester and were free to choose
classes, what would you take? The results (see Table 8) suggest that 44.0 percent of the
students exiting special education would take more personal interest courses. Slightly
more than 35 percent of the participants indicated that they would take functional and
vocational classes and 15.4 percent would take additional academic courses.
Table 8. 2008 Choices for Additional Coursework. Course topic/area Percent
Academic 15.4% Personal Interest 44.0% Functional/Vocational 36.8% Not reported 3.9% Note: These are percentages of the total number of participants and rounded to the nearest tenth of a percent.

12
Data reported in this section is disseminated by NDDPI to personnel throughout
the state including special education directors, special education teachers, and the
Transition Steering Council. The data will be used to make program improvements in the
education of ND students as they transition from high school to postsecondary activities.
2004 – 2008 Exit Survey Comparison
The Exit Survey has been completed with samples of students served in special
education beginning in 1999. A comparison of the five most recent years’ data is reported
here.
Items on the Exit Survey from 1999 through 2005 were the same each year.
Changes in process and question responses were made to the 2006 Exit Survey.
Beginning in the fall of 2005, the Follow-up Interview was conducted online. Spring of
2006, the Exit Survey was also completed online. See Data Collection Methods section
on page 3 for details on this process. Changes to specific questions and responses on the
2006, 2007, and 2008 Online Exit Surveys are noted in the text that follows.
Results
The following section reports the results from the five most recent groups (2004-
2008) of students exiting special education programs. See Figure 5 for a comparison of
the numbers of participants in the Exit study.

13
Figure 5. Participants in exit study from 2004 through 2008. What is the student’s plan after high school? The student’s plans after high school
were identified next. In 2004-2008 students and/or their teachers indicated the student’s
plans after high school by selecting from the options listed in Table 9. In 2006, 2007, and
2008 the term Postsecondary was not used. Respondents were asked to select from the
following options: a) University (4 yr.), b) Voc-tech (2 yr.), and c) Trade (1 yr. or less,
includes Job Corps). For the purpose of this comparison, the 2006, 2007, and 2008
options University (4 yr.), Voc-tech (2 yr.), and Trade (1 yr. or less, includes Job Corps)
were combined and entered as Postsecondary. Figure 6 shows the two highest choices for
each year, employment and postsecondary.
Table 9. Postsecondary Plans (2004-2008). Post-secondary Plans 2004 2005 2006 2007 2008
Employment 42.9% 48.6% 45.8% 47.7% 44.0% Military 4.9% 3.8% 5.9% 3.3% 5.1% Postsecondary 46.4% 61.2% *69.2% *68.3% *62.3% Don’t know 4.0% 3.3% 7.8% 6.5% 6.4% Unemployment/not able to work 0.6% 0.8% 0.3% 1.4% 0.4%
Other plans 4.9% 3.3% 5.3% 8.6% 8.9% DNR 1.8% 2.5% 3.9% 1.8% 1.2% *Note: The 2006, 2007, and 2008 Exit Surveys had new response options that divided the post-secondary option to specific post-secondary programs.

14
Figure 6. Percent of employment and postsecondary education plans (2004-2008).
Identify Adult Providers who will help the student as identified in the IEP. The
transition services needed for students to reach their post-secondary goals are identified
on the IEP and may include the following adult service providers: Vocational
Rehabilitation, Developmental Disabilities, Job Services, Social Security, University or
college Disability Support Services and Adult Learning Centers. Table 10 lists the service
providers chosen by students based on participator’s responses. Vocational Rehabilitation
and College or University Disability Support Services were consistently identified as
anticipated providers that would help the student after exiting high school.
Table 10. Adult Providers Who Will Help Student as Identified in IEP (2004-2008). Service Provider 2004 2005 2006 2007 2008
No services needed 18.4% 14.8% 11.0% 13.7% 14.0% Vocational Rehabilitation 61.5% 66.2% 72.2% 66.0% 66.7% Developmental Disabilities 8.3% 10.6% 7.8% 12.9% 10.7% Job Service 15.6% 16.1% 23.5% 21.0% 15.6% Social Security 6.9% 6.1% 7.2% 9.0% 8.2% College/Univ. Disability Support 34.2% 29.0% 43.1% 38.2% 31.9% Adult Learning Center 1.4% 1.2% 1.6% 1.1% 1.8% Other (specify) 6.1% 4.0% 4.3% 7.7% 8.6% DNR 1.6% 3.6% 3.4% 1.6% 3.1%

15
Why did the student exit your program? Table 11 shows the reasons participating
students exited high school. These included graduated with a diploma, graduated with a
certificate, aged out, and dropped out. Figure 7 shows the percent of students reported
having graduated with diploma from 2004 through 2008.
Table 11. Reasons for Exit (2004-2008). Exit Reason 2004 2005 2006 2007 2008
Graduated, diploma 90.5% 90.4% 89.1% 89.8% 88.5% Graduated, certificate 2.2% 3.5% 1.6% 1.1% 0.8% Aged out 2.6% 2.5% 3.2% 3.9% 4.7% Dropped out 1.8% 3.1% 5.0% 4.0% 4.5% DNR 2.8% 0.6% 1.1% 1.2% 1.6%
Figure 7. Percent graduated with diploma (2004-2008).
Identify student satisfaction with overall high school program, vocational or
transition aspect of high school, and special education aspect of high school. Students
gave each program a letter grade (A through F). In 2008, students were only allowed to
give grades from A through D. A rating grade point similar to a school grade point
average (GPA) was calculated with each letter weighted from 1 through 4 (1=D, 4=A).
Each of the figures represents overall student satisfaction calculated as a GPA based on

16
the number of students who responded. Figures 8 through 10 show average student
satisfaction from 2004 through 2008.
Figure 8. Satisfaction with overall high school program as GPA (2004-2008).
Figure 9. Satisfaction with vocational or transition aspect of high school as GPA (2004-2008).

17
Figure 10. Satisfaction with special education program as GPA (2004-2008). If you had to stay in school an additional semester and were free to choose
classes, what would you take? Students could choose from Academic classes,
Topical/Interest classes, or Functional & Vocational classes. The 2006, 2007, and 2008
Online Exit Surveys allowed students to choose only one response from the following
options: a) Academic classes, b) Personal Interest classes, or c) Functional or Vocational
classes. See Figure 11.
Figure 11. Choices for additional coursework (2004-2008). *Note: the 2006, 2007, and 2008 survey response options changed as described above.

18
Section Two
2007 Follow-up Interview: One Year after High School Exit
This report continues the series of technical reports on the ND Transition Follow-
up Project, funded by the NDDPI, Office of Special Education. The NDDPI contracted
with the NDCPD project staff to conduct follow-up telephone interviews with students or
a designated contact person at one year after exit from high school. The following is a
report of data from the 2008 Online Follow-up Interview for students who exited ND
special education programs in the 2007 school year. The initial school exit data were
presented in a previous report and are available from the NDDPI or from the NDCPD, as
well as from their respective websites.
Data Collection Method
Contact information was obtained via the Exit Survey completed in the spring of
2007. The NDDPI provided additional participant data that included the names and
contact information of students who had exited high school but did not complete the Exit
Survey. Once contacted, the respondent (student or designated contact person) was
interviewed using the 2008 Follow-up Interview Questions (see Appendix B). This
instrument and the procedures are described below.
Instrument. The initial interview questionnaire was developed following an
extensive review of materials. Initially, the National Longitudinal Transition Study was
used to develop items to be included on the exit and follow-up instruments. More
recently, the NDDPI staff provided the NDCPD project staff with the National Post
School Outcomes (NPSO) Center essential questions. After several revised drafts by the

19
NDDPI and NDCPD staff, the final version of the NDDPI Follow-up Project Interview
was developed. This questionnaire incorporated the most salient items of interest and
provided an efficient instrument for gathering data via telephone interviews.
Prior to the 2005 Online Follow-up Interview, data were collected using a paper
questionnaire. The new Follow-up Interview questions are based on current information
necessary for special education data collection. Questions and response options from
previous years were revised to elicit more specific information. Several items on the
survey were presented in slightly different formats.
Procedures. The procedure for contacting participants was developed by the
NDCPD project staff. The call list was compiled from the demographic information
(name, address, phone number, and name of designated contact person) provided by the
participating special education units through exit survey data collected. Student
information is sometimes inaccurate one year after exiting high school due to incomplete
information entered on the exit survey or changes that occur after the survey such as
students and/or contacts (generally parents) moving, change in phone number, or a
disconnected phone line. The NDCPD project staff worked to update missing contact
information using public information sources such as the internet and local telephone
books. To ensure that all exiting students were contacted in the follow-up interview, the
NDDPI provided additional student demographic information for exiters of special
education programs who did not participate in the exit survey. These names and
demographic information were added to the call list. The updated call lists were used to
construct computer data files in Excel that were password protected in order to ensure
confidentiality. All student information was organized by identification codes rather than

20
names, also to ensure greater confidentiality. These data files were used to generate
contact logs for the 2008 Online Follow-up Interview.
The NDCPD project staff trained the follow-up telephone interviewers in the
procedures for conducting the telephone interviews using the Online Follow-up Interview
system. The National Post-school Outcomes Center Post-School Outcomes Data
Collection Guide: Training Interviewers was used as a reference tool for training the
interviewers. The interviewers were also given a list of frequently asked questions
(FAQs) that might arise during the interview. The FAQs are found in Appendix C.
The NDCPD project staff practiced with the interviewers the Follow-up Interview
face-to-face and on the telephone until they were comfortable with the process and the
materials. The interviewers were coached as to how to handle participant questions about
the study such as requests for more information or services as well as on refusals to
participate. Interviewers were also instructed to make minimally three attempts to contact
each of the participants. These attempts were to occur at least two hours apart or on
separate days from April through September. Additional calls were requested by the
NDDPI in order to collect data from a larger participant base. NDCPD project staff added
two additional telephone call attempts to special education exiters as per this request.
Participants
In 2007, 568 students from special education completed the 2007 Exit Survey.
The NDDPI provided NDCPD with contact information for an additional 298 students
from special education programs that exited in 2007 so that the 2008 One Year Follow-up
Interview began with 866 students.
Participants from special education programs received five call attempts. Under

21
federal guidelines 814 students from special education programs included in the follow-
up interview qualified as actual exiters whose data could be reported. Of the 814 students,
316 follow-up interviews were completed one year after exit for a 38.8 percent
completion rate. Call results included fall-out of participants for the following reasons: 5th
Contact Failed. Phone Disconnected, Wrong Number, and Refused Participation. These
interview results are reported to the NDDPI by school district.
Student demographic data. The special education cohort consisted of 224 male
(70.9%) and 89 female (28.2%) students. Three students (0.9%) did not disclose gender.
Table 12 shows the racial/ethnic background of participants. Four students (1.3%) did not
disclose racial/ethnic background.
Table 12. Racial/Ethnic Groups of 2008 Follow-up Participants. Racial/Ethnic Group Frequency Percentage
White 280 88.6% American Indian/Alaska Native 26 8.2% Hispanic 3 0.9% Black 1 0.3% Asian/Pacific Islander 0 0.0% Other 2 0.6%
Disability category. Table 13 shows the disability categories of students from
special education programs for which an interview was completed. The most frequently
listed primary disability was specific learning disabilities (51.6%). This was followed by
mental retardation (13.9%) and other health impairment (12.0%). These three categories
represent approximately 77.5 percent of all interviews for students from special education
programs. The disability category for five students (1.6%) was not indicated.

22
Table 13. Disability Categories of 2008 Follow-up Participants. Category Label Frequency Percentage
Specific Learning Disability 163 51.6% Mental Retardation 44 13.9% Other Health Impairments 38 12.0% Emotional Disturbance 26 8.2% Speech Impairment 26 8.2% Autism 7 2.2% Hearing Impaired 4 1.3% Visual Impairment 2 0.6% Traumatic Brain Injury 1 0.3% Orthopedic Impairment 0 0.0% Deaf 0 0.0% Blind 0 0.0% Multiple Disabilities 0 0.0%
Who served as the source for this information? Table 14 shows who served as the
source for the follow-up interviews. Parents were most often the designated contact
person who completed the interviews (55.4%). Thirty-nine percent of the follow-up
interviews for students were completed by the student.
Table 14. Who Served as the Source for This Information? Source Frequency Percentage
The student 123 38.9% Parent 175 55.4% Guardian/Foster parent 0 0.0% Sibling 1 0.3% Grandparent 6 1.9% Other family member 1 0.3% Family friend 1 0.3% Other (specify) 2 0.6% DNR 7 2.2% Note: These are percentages of the total number of cases in the cohort.
State Performance Plan Indicator 14 Information
Figure 12 shows the employment and postsecondary enrollment for the 2007
exiters at one year after high school. This data was compiled by the NDDPI staff for

23
inclusion in the annual follow-up report. The visual representation was developed by
NDCPD staff to assist with reporting of this information to school districts throughout
North Dakota.
Employment & Postsecondary Enrollment One Year after High School for 2007 Exiters
North Dakota Data
36120 118
38.0% 11.4%37.3% 42
13.3%
Employed within one year of leaving high school
238
45.3%
* 1 student did not respond to question about employment
Neither employed or enrolled in postsecondary school within one year
42
13.3%
n=316 Enrolled in some type of postsecondary school within one year of leaving high school
154*
48.7%
118 Both employed and enrolled in postsecondary school within one year
37.3%
Figure 12. Employment and postsecondary enrollment of 2007exiters at one year after high school.
Results
The following section describes the results of the Follow-up Interview at one year
after exiting high school for 2007 exiters. Each question from the interview is included.
Appendix D contains Follow-up Interview text responses for all items to which a text
response could be given.
Has the student been enrolled in any of the following types of post secondary
education at any time since leaving high school? Respondents could select no or yes and
indicate a program (high school completion document or certificate program, short-term

24
education or employment training program, vocational technical school- less than a 2
year program, community or technical college (2 year), college or university (4 year
program) or other (please specify) and indicate a specific program). Approximately half
(50.3%) of the participants had been enrolled in some type of postsecondary education
since exiting high school (see Table 15). Just less than half (49.7%) of respondents
indicated that the student had not been enrolled.
Table 15. Enrollment in Postsecondary Education since High School. Postsecondary Education Enrollment Frequency Percentage
Yes 159 50.3% No 157 49.7% DNR 0 0.0%
Figure 13 shows the options for types of postsecondary educations programs
students had been enrolled in since high school exit. Percentages are based on those who
indicated yes. Over half had been enrolled in a community or technical college (2 year)
program. Two respondents (1.3%) indicated enrollment but did not specify type of
postsecondary program. Table 16 shows the other types of postsecondary education
programs.
Figure 13. Types of postsecondary education enrollment (2007 exiters).

25
Table 16. Other Types of Postsecondary Education. Other Types of Postsecondary Education Military (2) Independent Living Program Moorhead Tech a couple of months Paraprofessional (not sure if that’s a 2 yr or 4 yr thing) Training at his residence Training for volunteer fire department
If not, why hasn’t (student) chosen to enroll in post secondary education since
high school? (Check as many as apply.) Table 17 shows the possible reasons for not
enrolling in postsecondary education. Respondents for students who had not been
enrolled in postsecondary education indicated the most common reasons for not attending
were working (19.3%) and other (12.0%). Table 18 shows “other” options provided by
respondents. See Appendix D for a full listing of other types of postsecondary education.
Table 17. Reasons for not Enrolling in Postsecondary Education at One Year after Exit. Reasons for Not Enrolling Frequency Percentage Lack training in immediate locale 8 2.5% Lacks skills/qualifications 21 6.6% Lacks transportation 8 2.5% Working 61 19.3% Did not want to go 21 6.6% Health problems preclude going 16 5.1% Believes cannot afford 24 7.6% Other (please specify) 38 12.0% Don't know 9 2.8% DNR 0 0.0% Note: These are percentages of the total number of cases in the cohort. Respondents could select more than one response.
Table 18. Other Reasons for not Enrolling in Postsecondary Education. Other Reasons for Not Enrolling Not sure what he/she wants to do yet (5) Planning/will be enrolled in the future (5) Family issues (4) Military (2) Reservations about attending (2)
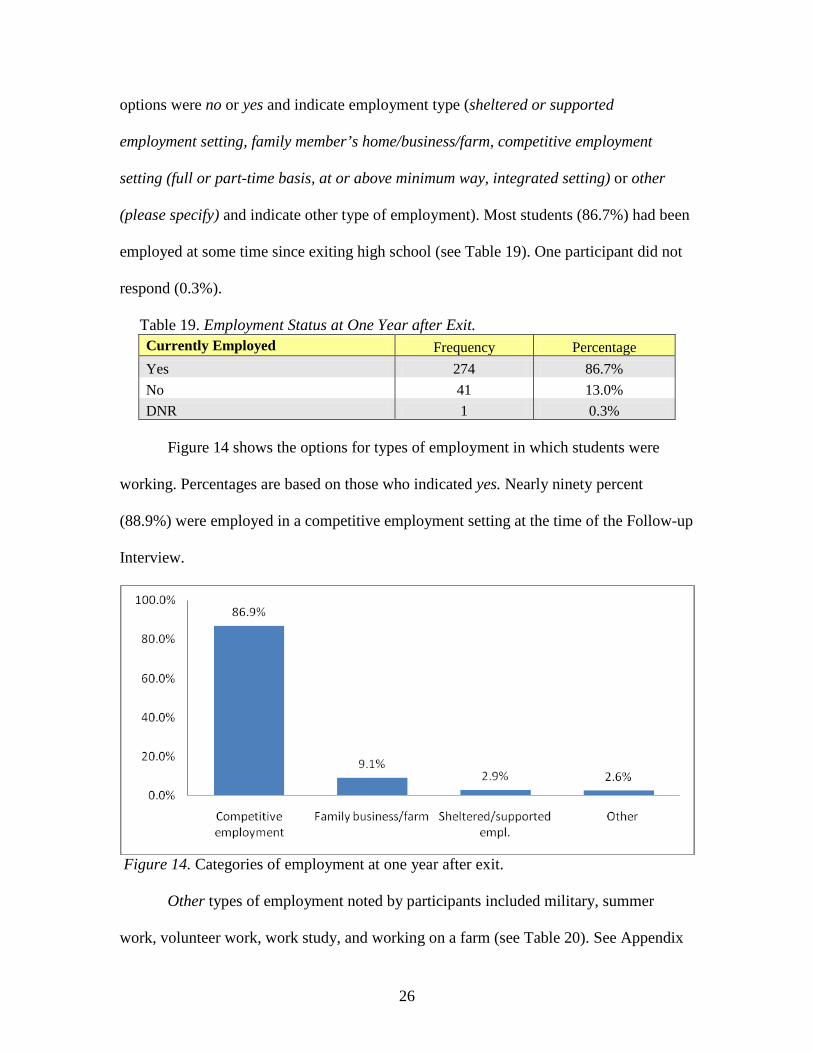
Has the student been employed at any time since leaving high school? Response
26
options were no or yes and indicate employment type (sheltered or supported
employment setting, family member’s home/business/farm, competitive employment
setting (full or part-time basis, at or above minimum way, integrated setting) or other
(please specify) and indicate other type of employment). Most students (86.7%) had been
employed at some time since exiting high school (see Table 19). One participant did not
respond (0.3%).
Table 19. Employment Status at One Year after Exit. Currently Employed Frequency Percentage Yes 274 86.7% No 41 13.0% DNR 1 0.3%
Figure 14 shows the options for types of employment in which students were
working. Percentages are based on those who indicated yes. Nearly ninety percent
(88.9%) were employed in a competitive employment setting at the time of the Follow-up
Interview.
Figure 14. Categories of employment at one year after exit.
Other types of employment noted by participants included military, summer
work, volunteer work, work study, and working on a farm (see Table 20). See Appendix

27
D for a full listing of other types of employment noted during the interviews.
Table 20. Other Identified Types of Employment. Other Types of Employment Workstudy (2) Internship (2) Self-Employed (2) Babysitting Employment through the Open Doors program
If (student) isn't working, why hasn’t (student) obtained employment since leaving
high school? Table 21 shows the possible reasons for not working. Students who were
not working at the time of the follow-up interview most often were attending a
postsecondary program (4.4%). Twenty three students (7.5%) did not respond to this
question.
Table 21. Reasons for not Working at One Year after Exit. Reasons for Not Working Frequency Percentage Lack of employment opportunities in immediate locale 1 0.3%
Lacks the necessary skills/training for employment in the area 6 1.9%
Lacks transportation 4 1.3% Attending a post secondary program 14 4.4% Does not want to work 1 0.3% Health problems that preclude employment 9 2.8%
Believes lose benefits if works 2 0.6% Other (please specify) 10 3.2% Don't know 2 0.6% DNR 2 0.6% Note: These are percentages of the total number of cases in the cohort. Respondents could choose more than one.
Table 22 shows the other reasons for not working which included joined the
military, going to school and looking for a job, to name a few. See Appendix D for a full
listing of reasons for not working noted during the interviews.

28
Table 22. Other Reasons for not Working. Other Reasons for not Working Family issues Waiting to start post-secondary Attending Job-Corp Enrollment in university sports Financial Aid Getting drivers license Only works in summer
How many hours on average does the student work per week?(current or most
recent job). Table 23 shows the breakdown of responses (full-time (more than 35
hours/week), part-time (35 or less hours/week), refuse to answer, don’t know, or no
answer) for hours worked per week. Over half (52.5%) of students were reported as
working full-time. Figure 15 shows the comparison of full-time and part-time
employment reported.
Table 23. Categories of Hours Worked per Week at One Year after Exit. Hours worked per week Frequency Percentage Full-time (more than 35 hours) 166 52.5% Part-time (35 or less hours per week) 111 35.1% Refuse to answer 0 0.0% Don't know 5 1.6% No answer 42 13.3% DNR 3 0.9%
Figure 15. Percents of full-time and part-time employment at one year after exit.

29
How much does the student make per hour?(current or most recent job). Table 24
shows response options for hourly wage (unpaid or volunteer, less than minimum wage,
minimum wage, more than minimum wage, refused to answer, don’t know, no answer).
More than two thirds (67.4%) of the responses reported that the student was earning more
than minimum wage and 11.4 percent were earning minimum wage. Figure 16 shows the
comparison of unpaid/volunteer, less than minimum wage, minimum wage, and more
than minimum wage. Thirteen respondents (3.9%) did not respond to this part of the
question.
Table 24. Categories of Hourly Wages at One Year after Exit. Hourly wage Frequency Percentage Unpaid 2 0.1% Less than minimum 6 1.9% Minimum wage 36 11.4% More than minimum 213 67.4% Refused to answer 0 0.0% Don't know 16 5.1% No answer 44 13.9% DNR 3 0.9% Note: These are percentages of the total number of cases in the cohort. Respondents could select more than one response.
Figure 16. Categories of hourly wage at one year after exit.

30
Does the student have health insurance? Frequency and percentage of students who had
or did not have health insurance are shown in Table 25. If the student had health
insurance they were asked to identify the source of the insurance. Most responses
indicated that the parent was the provider of the health insurance (see Figure 17). See
Appendix D for a listing of other types of insurance noted by respondents.
Table 25. Does the Student Have Health Insurance? Health Insurance Frequency Percentage Yes 228 72.2% No 84 26.6% DNR 4 1.3%
Figure 17. Source of health insurance at one year after exit.
What is the student’s current living arrangement? Pick best fit from description.
Table 26 shows living arrangements at the time of the follow-up interview. Over half of
the students lived with their parents. Figure 18 shows the three living arrangements that
were most often reported. Other living arrangements included barracks, lives at jobsite,
rented apartment with supports, or with other family members (See Appendix D).

31
Table 26. Living Arrangements at One Year after Exit.
Living Arrangements Frequency Percentage Own home or buying it 4 1.3% Live independently in a rented apartment/house 72 22.8%
Live in a dormitory 17 5.4% Live with parents 188 59.5% Live with relative (not parents) 11 3.5% Live in a residential facility 8 2.5% Other-please specify 12 3.8% DNR 4 1.2%
Figure 18. Three most common living arrangements at one year after exit.
Did the student choose to drop out of school? Table 27 contains a frequency and
percentage of respondent indications for this question. Note that these are responses only
for participants in the study and do not represent an accurate account of students in ND
who chose or did not choose to drop out of high school. For more information on
statewide statistics, please contact the North Dakota Department of Public Instruction.
Table 27. Student Chose to Drop Out of School. Chose to drop out Frequency Percentage Yes 41 13.0% No 271 85.8% DNR 4 1.3%
32
Respondents that indicated that they had dropped out of school were asked to
explain why they left and what would have helped them stay in school. Some reasons
given for leaving school were diploma, did not like it, and behind in credits. Some items
noted that would have helped included nothing, not sure, and more interactive and
interesting classes. See Appendix D for a complete list of responses to these questions.
If the student could change anything about his/her high school experience what
would he/she like to change? Table 28 shows some responses to this question. The
highest number of responses (114) was “nothing.” See Appendix D for a complete list of
suggested changes.
Table 28. Changes to High School Experience at One Year after Exit. Changes to high school experience Nothing (114)
Tried harder (8) More participation in extracurricular activities (3) Better teachers (3) Better/different friends (3) Gotten better grades (2) Better study habits (2) Have a study skills class (2) Stayed in school (2) Better transition services (2)
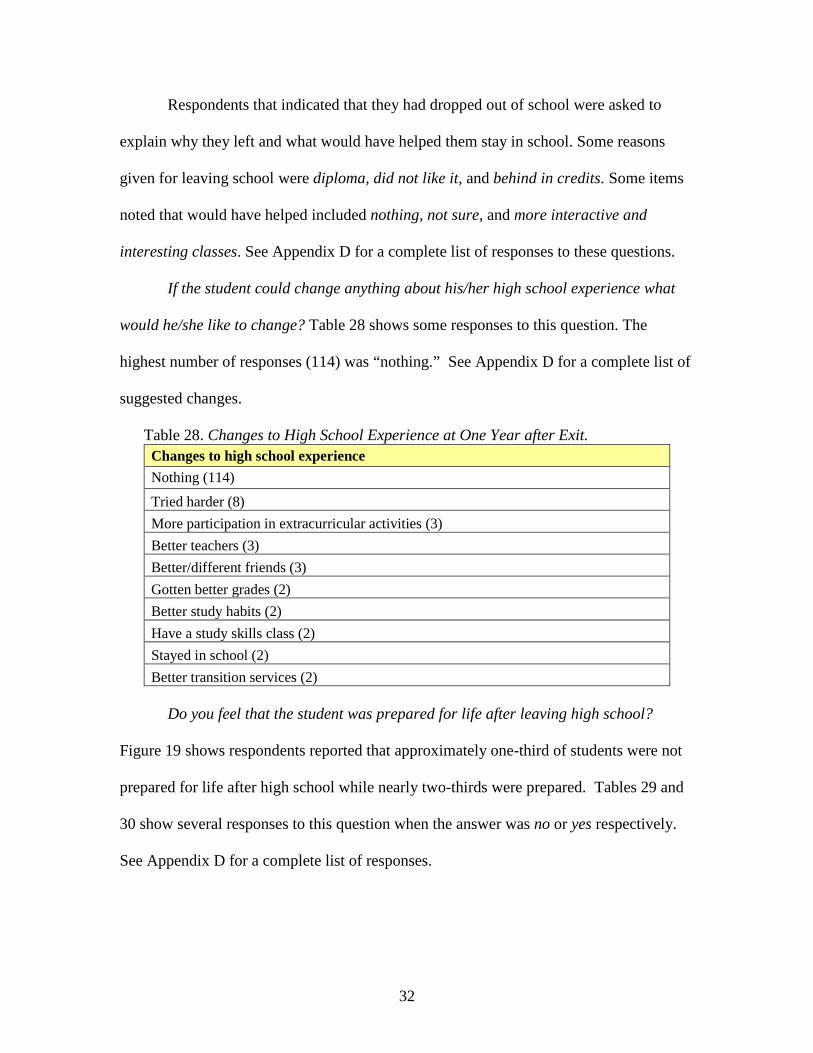
Do you feel that the student was prepared for life after leaving high school?
Figure 19 shows respondents reported that approximately one-third of students were not
prepared for life after high school while nearly two-thirds were prepared. Tables 29 and
30 show several responses to this question when the answer was no or yes respectively.
See Appendix D for a complete list of responses.
33
Figure 19. Perceived preparation for life after leaving high school at one year after exit.
Table 29. Reasons Student Were Not Prepared for Life after High Reasons believed not prepared for life after high school Needed more life skills No one is prepared for life after high school, all areas of life can’t be covered in the school He has some special needs Financial planning Not for life at college but as well as could be expected Needed to follow through with more transition changes
Table 30. Reasons Student Were Prepared for Life after High School Reasons believed prepared for life after high school L.D. teacher was great and able to do work on his level Was able to attend a school that fit her needs Combination of school and family Getting to know people, social skills Teachers were willing to help and offered more support He was able to work and did well in hands on learning Work experiences during high school helped
Since exiting high school, has the student been referred to … (choose as many as
apply). Based on responses in this interview, 45.3 percent of students were not referred to
any type of adult services. The highest services students were referred to was Vocational
Rehabilitation at 32.9 percent (see Table 31). Other adult services to which students were

34
referred are displayed on Table 32.
Table 31. Referral to Adult Services at One Year after Exit. Referred Services Frequency Percentage Vocational Rehabilitation 104 32.9% Disability Disabilities 23 7.3% Job Service 47 14.9% Independent Living Centers 7 2.2% Disability Support Services 45 14.2% Other (please specify) 17 5.4% None 143 45.3% DNR 5 1.6% Note: These are percentages of the total number of cases in the cohort. Respondents could select more than one response.
Table 32. Other Adult Services to which Students were Referred.
Other Services Open Door Program (4) Community Options Job Corps Labor Ready Work investment program
Is the student currently receiving services for his/her disability? Respondents
could answer yes and select from identified service providers or no. Nearly one-third
(30.1%) of the students were receiving services for their disability at one year after
exiting high school. Table 33 shows the services students were receiving at one year after
high school exit based on participants responses. Of the services students accessed after
high school, Vocational Rehabilitation was the most commonly accessed (43.2%). Other
services being received at one year after exit included community living and Easter Seals.
For a complete list of other services see Appendix D.
Table 33. Receipt of Services for Disabilities at One Year after Exit. Services Received Frequency Percentage Yes 95 30.1% No 213 67.4% DNR 8 2.6%

35
Table 34. Service Providers from which Disability Services are Received. Services Providers Frequency Percentage
Vocational Rehabilitation 41 43.2% Social Security 30 31.6% Developmental Disabilities 15 15.8% Job Service 14 14.7% Independent Living Centers 1 1.1% Disability Support Services 23 24.2% Other (please specify) 20 21.1% DNR 8 2.6% Note: These are percentages of the total number of cases in the cohort. Respondents could select more than one response.

36
Section Three
2003 – 2007 Follow-up Interview Comparison One Year after High School Exit
The following section compares the Follow-up Interview data covering the most
recent five years. Some questions changed slightly over time but are still comparable.
The changes are noted in the text. Other questions included in the interview could not be
compared across time. See Appendix B for the Follow-up Interview questions used with
2007 exiters one year after they exited high school.
Results
Results reported in the following section are based on the participation of students
or their contact person from special education programs at one year after high school exit
(2003 through 2007). There were 171 exiters in 2003, 243 in 2004, 138 in 2005, 330 in
2006, and 316 in 2007 that participated in the follow-up interview at one year after high
school exit.
Is the student attending or has attended any type of school or other training after
high school? Respondents could answer no or yes. The 2006, 2007, and 2008 Follow-up
Interview asked the respondent if the student had been enrolled in any type of post
secondary education since leaving high school. In 2006, respondents could answer no,
yes, yes (specify other) or don’t know. In 2007 and 2008, the don’t know option was
deleted. Yes and yes (specify other) responses were combined to report the yes data for
2005, 2006, and 2007 exiters. Figure 20 shows the percent of interview responses in
which the answer to this question was yes.
37
Figure 20. Student attendance in postsecondary education or training since exiting high school (2003-2007).
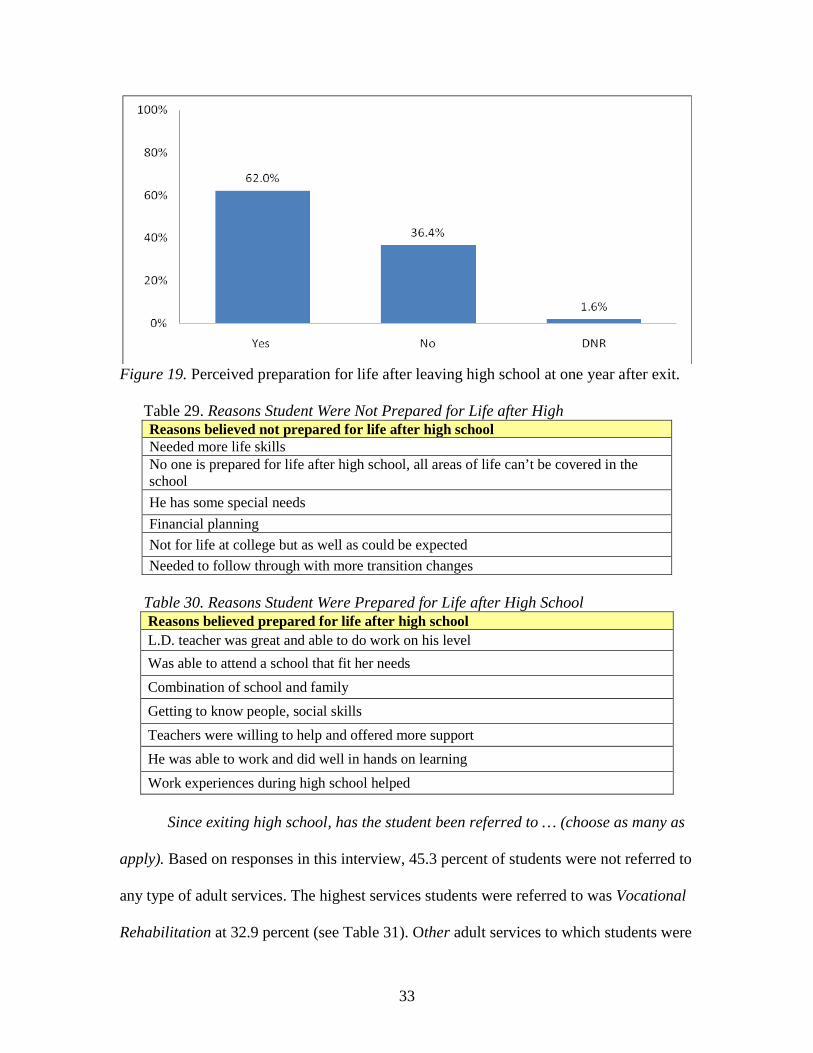
Has the student been employed at any time since exiting high school? In 2008,
this question changed to include employment since high school as well as the previously
reported “currently employed”. Figure 21 notes this change with an asterisk for the 2007
data point. Nearly eighty-seven percent of respondents for the 2007 exiters indicated
employment at some time in the one year since the student exited secondary education.
Figure 21. Percent of students employed at the time of the follow-up interview (2003-2007).
What is the student’s current living arrangement? (Pick best fit from the

38
description). Percents of responses are reported in Table 35. The table indicates the living
arrangement at the time of the follow-up interview. The two highest overall responses to
this item are reported in Figure 22. In 2007 and 2008, the Follow-up Interview combined
Live independently in a rented apartment/house and Live independently and share a
rented apartment/house with a friend. To reflect this change, previous years’ percentages
have been combined in order to compare across time. Other options that were available
were not comparable across all five years and are not shown here.
Table 35. Living Arrangements at One Year after Exit (2003-2007) 2003 2004 2005 2006 2007 Own a home or is buying it 0.6% 2.1% 1.4% 2.7% 1.3% Live independently in a rented apartment/house with or without a roommate
*33.9% *39.1% *26.8% 34.5% 22.8%
Live with parents 43.9% 40.7% 39.9% 50.3% 59.5% Live with relatives (not parents) 0.6% 2.9% 5.1% 3.9% 3.5% Other (specify) 17.0% 12.8% 21.0% 0.6% 3.8% DNR 0.0% 0.0% 1.4% 0.6% 1.2%
*Note: These data were combined as described in the narrative above.
Figure 22. Highest reported living arrangement at one year after exit (2003-2007).
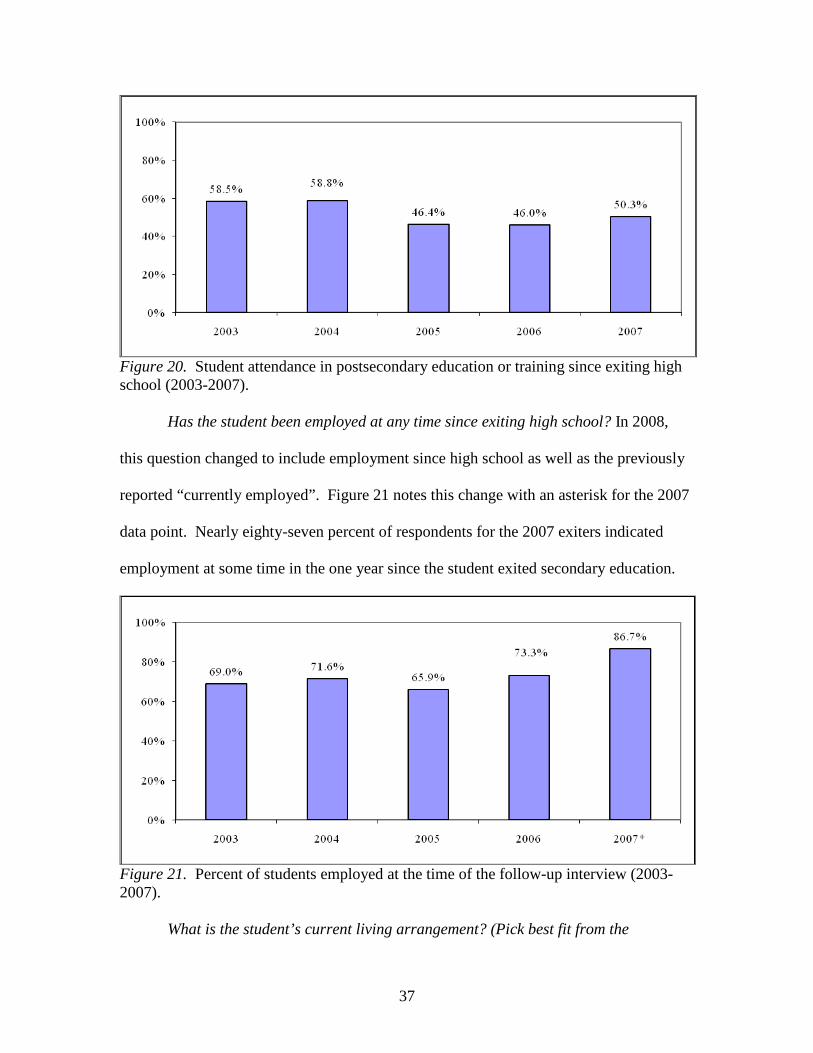
Do you feel that the student was prepared for life after leaving high school?
Figure 23 shows that generally more students were prepared for life after high school as
reported one year after exiting high school.
39
Figure 23. Perceived preparation for life after high school at one year after exit (2003-2007).
Does the student receive services for his/her disability? Between 23 and 32
percent of students reported having received services for their disability after exiting high
school (figure 24). Exiters from 2005 were reported as the having the largest percent of
students receiving services for disabilities at one year after exit from high school.
Figure 24. Percent of students receiving services for his/her disability at one year after exiting high school (2003-2007).
Those respondents who identified the 23 to 32 percent of students receiving
services were then asked to identify the specific services. These are identified in Table 36
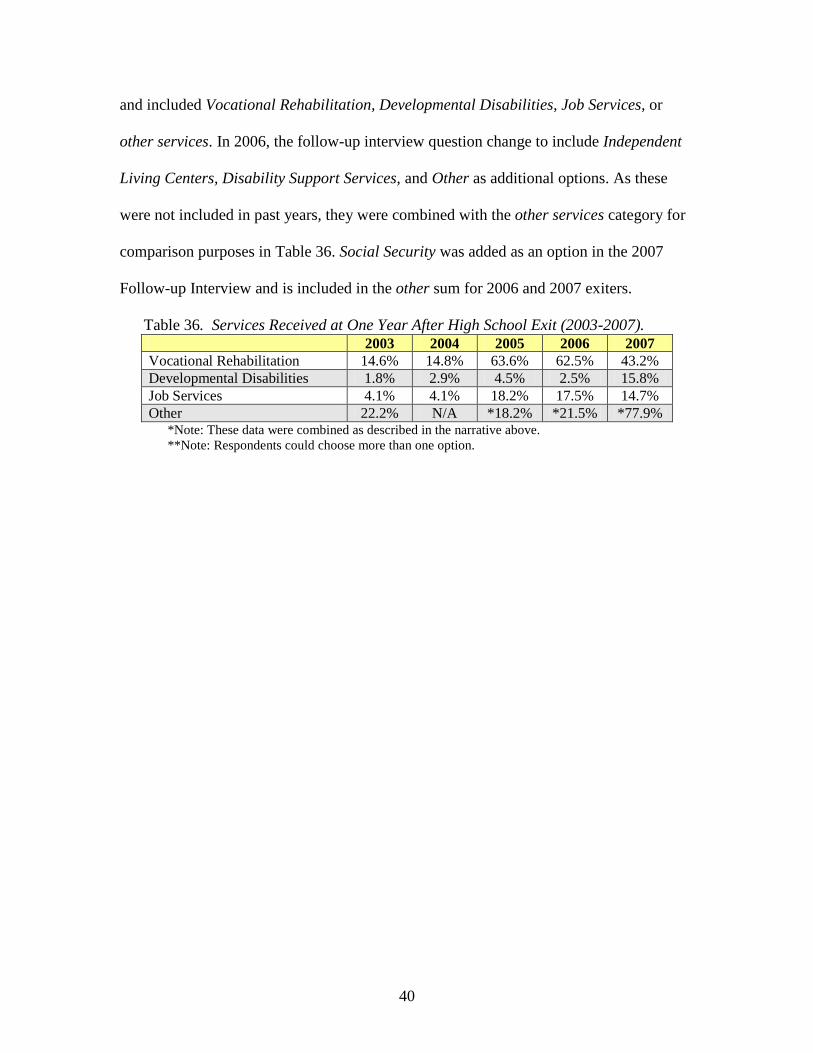
40
and included Vocational Rehabilitation, Developmental Disabilities, Job Services, or
other services. In 2006, the follow-up interview question change to include Independent
Living Centers, Disability Support Services, and Other as additional options. As these
were not included in past years, they were combined with the other services category for
comparison purposes in Table 36. Social Security was added as an option in the 2007
Follow-up Interview and is included in the other sum for 2006 and 2007 exiters.
Table 36. Services Received at One Year After High School Exit (2003-2007). 2003 2004 2005 2006 2007
Vocational Rehabilitation 14.6% 14.8% 63.6% 62.5% 43.2% Developmental Disabilities 1.8% 2.9% 4.5% 2.5% 15.8% Job Services 4.1% 4.1% 18.2% 17.5% 14.7% Other 22.2% N/A *18.2% *21.5% *77.9%
*Note: These data were combined as described in the narrative above. **Note: Respondents could choose more than one option.

41
Appendix A 2008 Exit Survey
Directions

42
ND Transition Exit Survey 2008-Special Education Student http://ndcpd.org/TransitionSurvey
Complete the online ND Transition Exit Survey with all 2008 exiters receiving special education services in your unit. This is intended to reflect a personal interview with each student as not all information is identifiable in the IEP and/or student file review. This survey should take no more than 15 minutes per student. Complete all questions for all students. IF YOU HAVE QUESTIONS AT ANY TIME DURING TRANSITION EXIT SURVEY PROCESS, PLEASE CALL GERRY TEEVENS, SPECIAL EDUCATION REGIONAL COORDINATOR AT (701) 328-2277. Student Name: First Name, Last Name (in designated boxes).
Address: Mailing address, city, state, and zip code.
Phone: (701) XXX-XXXX
Gender: Identify male or female.
Disability: Identify according to the primary disability identified on the student’s IEP.
Race: Identify student race.
Contact Name: First Name, Last Name (in designated boxes).
Contact Phone:
(701) XXX-XXXX
Questions:
The following questions are to be asked of each exiting student, discussed/clarified if necessary, and then recorded by the Unit designee. For questions 4 and 6 there may be an open-ended response; log that response in the appropriate boxes.
This information will allow measures of correlation between student IEP attendance/participation and post school outcomes as well as with best practices regarding student invitation, self-advocacy, etc. Choose only one.
Q 1: What was your level of attendance and participation in the most recent and/or exit IEP meeting?
Select attended and actively participated if you attended and actively participated in your most recent and/or exit IEP meeting. Select attended, but did not participate if you attended, but did not participate in your most recent and/or exit IEP meeting. Select invited but did not attend if you were invited but did not attend your most recent and/or exit IEP meeting. Select not invited if you were not invited to your most recent and/or exit IEP meeting.
The intent of this question is to establish a baseline as to student plans at the time of high school exit, and will be compared with the same type of question asked during the
Q 2: What are your plans after high school?

43
Follow-Up Interview one year after exit. If you plan to be involved in more than one of the choices listed, mark all choices that apply. Employment: indicates that you will seek and secure employment. If the employment is known, please note such in the indicator box for this question (be as specific as possible). If you know you will seek work, but are uncertain about what and where, indicate employment and identify ‘uncertain’ in the box. Military: you will enter any branch of the armed services or ND National Guard. In many cases, a student may enroll in the Guard along with employment or retraining; in this case, please mark all responses that apply. University (4 yr.): you will attend a liberal arts program (e.g., UND, NDSU); Voc-tech (2 yr.): you will attend a two-year community college (e.g., BSC, NDSCS); Trade (1 yr. or less, includes Job Corps): you will attend a specific trade program or Job Corps. Can include BSC or NDSCS, or other programs if duration is less than 12 months; Don’t know: you have no future plans following high school. Unemployment/not able to work: you choose not to work or are not able to maintain employment as a result of personal choice or disability. Other: your choice is something other than those above. Please describe this choice in the box.
Select yes if your IEP included an independent living goal in the section of the IEP titled: Transition Services-Measurable Post-secondary Goals. An independent living goal includes activities such as home living, community access, recreation and leisure skills, health and safety, etc.
Q.3: Did the postsecondary goals identified on your IEP include an Independent living goal?
Select no if your IEP did not include an independent living goal.
The collaboration and need for seamless services beyond high school is critical for student success. This question could have multiple responses.
Q 4: Identify Adult Service Providers who have been identified in the IEP that will provide services to you after you graduate from high school :
No services needed: no Adult Providers are necessary for assistance. Vocational Rehabilitation: VR services to include supported employment, funding assistance for postsecondary education, placement assistance. Developmental Disabilities: DD services to include case management, residential or day services, group home living. Centers for Independent Living: such as Options, Freedom, Dakota Center for Independent Living. Mental Health Services: Therapeutic and supportive services accessed through private agencies, human service centers, hospitals, day and evening treatment programs, support groups. Job Services: JS services to include JTPA/WIA programs, placement assistance, Job Corps.

44
Social Security: SS services to include PASS, income supplement. College/University Disability Support Services: services to include academic accommodations & supports while pursuing postsecondary education. Adult Learning Center: services to include further study at any ALC. Other: other services provided that will benefit your post school or career goal. Please specify what information you can in the box designated in the middle of the page.
The intent of this question is to identify the exit status of each student. Only one choice may be selected.
Q 5: Why are you exiting high school?
Graduated with a diploma: you exited the educational program through receipt of a regular high school diploma. Graduated with a certificate: you exited the educational program through receipt of a certificate of completion, modified diploma fulfillment of an IEP. Aged out: you exited the educational setting as a consequence of reaching the maximum age for receipt of special education services. Dropped out: you exited the educational program as a consequence of dropping out of school, withdrawal from school without completing.
Identify all skills that apply. This information may come from instruction/coursework, IEP goals, etc.
Q 6: Identify occupational skills you attained during high school.
Employment: you have held any form of employment during high school regardless of who arranged it; Work skills: you acquired specific instruction to arrive at work on time, dress appropriately, and perform tasks under supervision; Social and/or interpersonal skills: you acquired specific instruction on how to interact appropriately with others, handle conflict, talk socially with coworkers and customers, ask/answer questions, etc; Daily living skills: you acquired specific instruction in independent living, grooming, hygiene, etc; Community access skills: you acquired specific instruction in how to access such community facilities as churches, bank, courthouse, recreation centers, etc; Computer literacy/keyboarding: you learned how to use a computer and/or type; Work in teams/groups: you learned how to work with others, participate, delegate, etc.; Other relevant skills: you learned other specific skills acquired during high school that will positively impact your work skills. Please specify what information you can in the box.
Overall student satisfaction with high school considering all factors is significant to post school success.
Q 7: Identify your satisfaction with the overall high school program.
Think about your overall years in high school. If you were to give your high school a

45
grade, what grade would that be? A (excellent) B (above average – very good) C (average - ok) D (below average – not good at all)
Student satisfaction with services as they relate specifically to transition/vocational preparation; getting ready for life after high school is the intent of this question.
Q 8: Identify your satisfaction with the vocational or transition preparation offered by your high school.
Think now about your overall transition preparation for life after high school. If you were to give your high school a grade, what grade would it be? A (excellent) B (above average – very good) C (average - ok) D (below average – not good at all)
Student satisfaction with services in special education while in high school is important to document accountability as well as future planning.
Q 9: Identify your satisfaction with the special education services offered by your high school.
Think about the special education services you received in high school. If you were to give your high school a grade, what grade would it be? A (excellent) B (above average – very good) C (average - ok) D (below average – not good at all)
Seeking suggestions from students is important in planning and reviewing past performance. This question is intended to solicit subjective response(s) from students about what they perceive to need.
Q 10: If you had to stay in school an additional semester and were free to choose classes, which would you take?
Academic classes (math, history, English, sciences) Personal interest classes (music, band, gym, etc.) Functional or vocational classes (consumer sciences, industrial tech, independent living, etc)

46
Appendix B 2008 Follow-up Interview
Questions
47
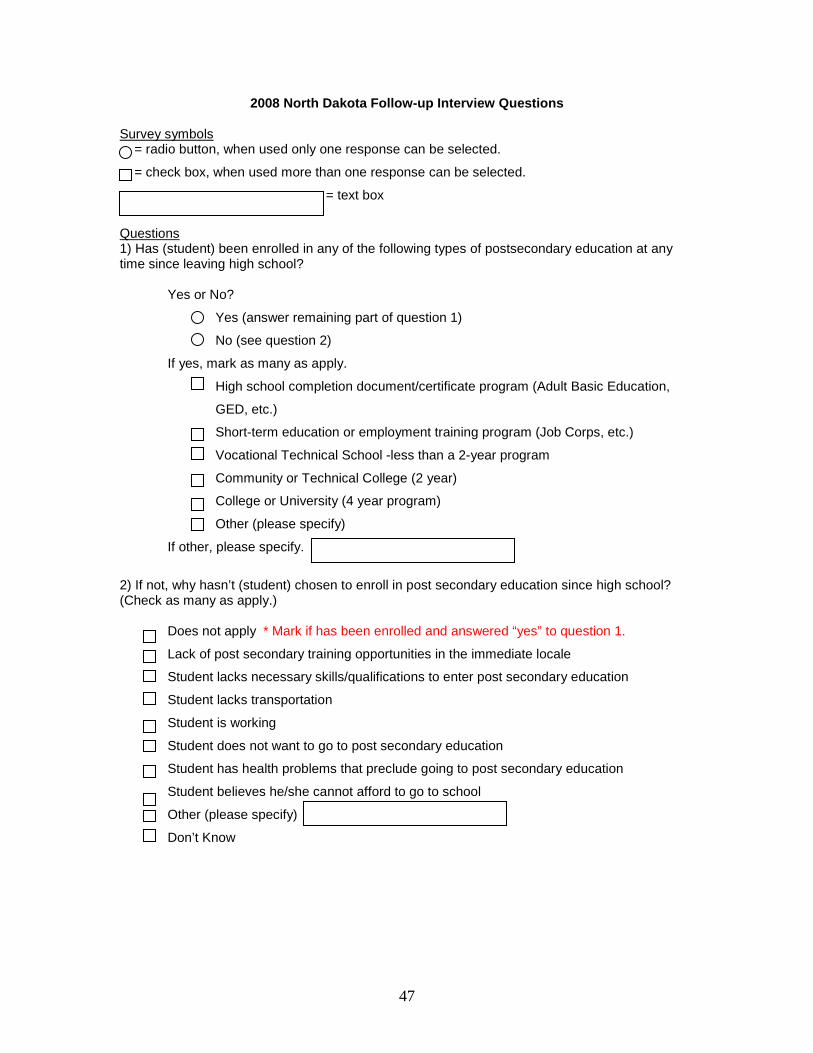
2008 North Dakota Follow-up Interview Questions
Survey symbols = radio button, when used only one response can be selected.
= check box, when used more than one response can be selected.
= text box
Questions 1) Has (student) been enrolled in any of the following types of postsecondary education at any time since leaving high school?
Yes or No?
Yes (answer remaining part of question 1)
No (see question 2)
If yes, mark as many as apply.
High school completion document/certificate program (Adult Basic Education,
GED, etc.)
Short-term education or employment training program (Job Corps, etc.)
Vocational Technical School -less than a 2-year program
Community or Technical College (2 year)
College or University (4 year program)
Other (please specify)
If other, please specify.
2) If not, why hasn’t (student) chosen to enroll in post secondary education since high school? (Check as many as apply.)
Does not apply * Mark if has been enrolled and answered “yes” to question 1.
Lack of post secondary training opportunities in the immediate locale
Student lacks necessary skills/qualifications to enter post secondary education
Student lacks transportation
Student is working
Student does not want to go to post secondary education
Student has health problems that preclude going to post secondary education
Student believes he/she cannot afford to go to school
Other (please specify)
Don’t Know

48
3) Has (student) been employed at any time since leaving high school?
Yes or No?
Yes (answer the remaining part of question 3)
No (see question 4)
If yes, mark as many as apply.
In a competitive employment setting for pay (competitive employment means
work on a full or part time basis, at or above minimum wage in an integrated
setting)
In a family member's home, business, or farm
In a sheltered or supported employment setting
Other (please specify)
If other, please specify.
4) If (student) isn't working, why hasn’t (student) obtained employment since leaving high school?
Does not apply * Mark if working and answered “yes” to question 3.
Lack of employment opportunities in the immediate locale
Student lacks necessary skills or training for employment in the area
Student lacks transportation
Student is attending a post secondary program
Student does not want to work
Student has health problems that preclude employment
Student believes he/she will lose benefits if he/she works
Other (please specify)
Don't know
5) How many hours on average does (student) work per week? (current or most recent job)
Full-time (more than 35 hours/week)
Part-time (35 or less hours/week)
Refuse to answer
Don't know
No answer
6) How much does (student) make per hour? (current or most recent job)
Unpaid or volunteer
Less than minimum wage
Minimum wage
More than minimum wage *Based on minimum wage of $5.85
Refused to answer
Don't know
No answer

49
7) Does (student) have health insurance?
Yes or No?
Yes (please identify the source of the insurance)
No (see question 8)
If yes, please identify the source of the insurance.
Parent's insurance
Through (student)'s job
Self-purchased
Unknown
Other (please specify)
If other, please specify.
8) What is (student’s) current living arrangement? (Pick best fit from the description)
Own home or is buying it
Live independently in a rented apartment/house with or without a roommate
Live with parents
Live with relatives (not parents)
Live in a dormitory *“Dorms” includes college/university or military
Live in a residential facility (such as an institution like the Developmental Center or
vocational program with on-site housing like Job Corps) *Any housing that is required as
enrollment in a service.
Other
9) Did (student) choose to drop out of school? *Referring to dropping out of high school.
Yes or No? Yes (answer remaining part of question 9)
No (see question 10)
What was the reason (student) left? Please explain.
What would have helped (student) stay in school? Please explain.
10) If (student) could change anything about his/her high school experience, what would he/she like to change? 11) Do you feel that (student) was prepared for life after leaving high school?
Yes (Please explain)
No (Please explain)
50
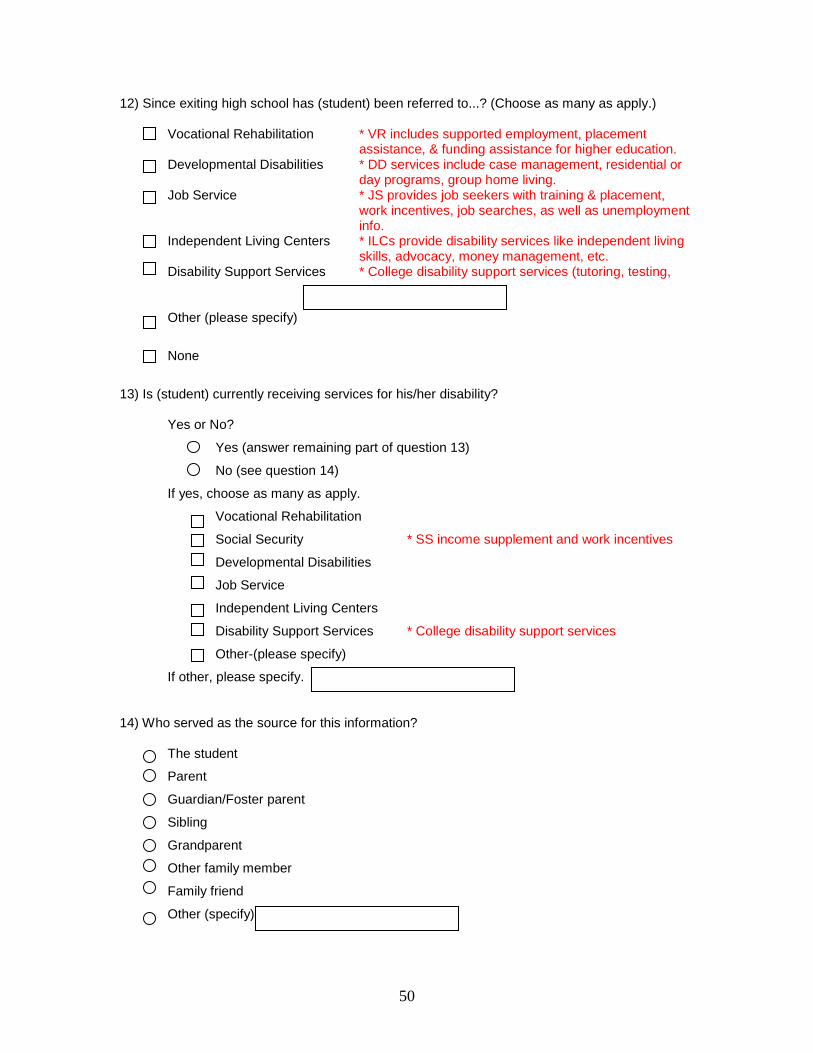
12) Since exiting high school has (student) been referred to...? (Choose as many as apply.)
Vocational Rehabilitation * VR includes supported employment, placement assistance, & funding assistance for higher education.
Developmental Disabilities * DD services include case management, residential or day programs, group home living.
Job Service * JS provides job seekers with training & placement, work incentives, job searches, as well as unemployment info.
Independent Living Centers * ILCs provide disability services like independent living skills, advocacy, money management, etc.
Disability Support Services * College disability support services (tutoring, testing,
etc.)
Other (please specify)
None
13) Is (student) currently receiving services for his/her disability?
Yes or No?
Yes (answer remaining part of question 13)
No (see question 14)
If yes, choose as many as apply.
Vocational Rehabilitation
Social Security * SS income supplement and work incentives
Developmental Disabilities
Job Service
Independent Living Centers
Disability Support Services * College disability support services
Other-(please specify)
If other, please specify. 14) Who served as the source for this information?
The student
Parent
Guardian/Foster parent
Sibling
Grandparent
Other family member
Family friend
Other (specify)

51
Appendix C Frequently Asked Questions

52
North Dakota Follow-up Project Frequently Asked Questions Supported by the ND Dept. of Public Instruction (NDDPI), Office of Special Education
1. How do you know or get my name? When your son/daughter was in his/her senior year in high school, he/she agreed to sign up for a study that the NDDPI’s Office of Special Education organized to follow students in transition from high school and also see what they were doing in the following years.
2. How do you know my child? When your child was in his/her senior year in high school he/she
agreed to sign up for a study that the NDDPI’s Office of Special Education organized to follow students in transition from high school and also see what they were doing in the following years.
3. How did you get my number? Your phone number was recalled from the demographics section of
the Transition Exit Survey completed by the exiting student in his/her final year of high school. You were listed as the contact person who may be willing to participate in the one-year follow up telephone survey.
4. Where are you calling from? I am calling from the ND Center for Persons with Disabilities at
Minot State University. We are involved in the transition study that you were contacted about in a postcard we sent out to you in March.
5. From where did you get my information? The information we needed to contact you and know
about you was provided by the exiting student in the Transition Exit Survey. When your son/daughter was in his/her last year of high school he/she volunteered to participate in a study organized by the NDDPI looking at their Transition from High School and after High School as well as their opinions of how helpful the high school was to prepare them for leaving school.
6. What will you do with this information? The information that we will collect for the study will
go into a database. After all the data is collected, a final report will be drawn up to look at all the information gathered and how the High School programs can be changed or improved to allow for better transitions from school.
7. What is NDCPD? The NDCPD is a research and service center focused on individuals who have
disabilities in North Dakota. It is the mission of NDCPD to advance the state of the art and promote the adoption of practices that effectively and appropriately increase the independence, productivity, integration, and inclusion of people who have disabilities.
8. In case of a ‘referral’ or ‘diagnosis’ call, If a parent asks about their child’s condition or has
questions about a referral like how they could get a job, let them know you are not qualified to assist them in this area but they can refer to the contact information on the postcard and contact Janet Green at (1-800-233-1737).
9. My son/daughter doesn’t have a disability ... The federal law under the Individuals with
Disabilities Improvement Act defines disability and how the need for special education services for children with disabilities is determined. These criteria must have been met for your child to be included in this Follow-up Interview process. During their final year of high school your son/daughter received some type of special education services. It may have been help with reading, math, resource room or some other accommodation. My records do not indicate any specifics.

53
Appendix D Follow-up Interview
Text Responses

54
2007 Follow-up Survey Comment Responses Question 1: Has (student) been enrolled in any of the following types of postsecondary education at any time since leaving high school? College classes online; start in July Moorhead Tech a couple of months FACE post secondary program in Lakeland FL
Paraprofessional (not sure if that’s a 2 yr or 4 yr thing)
In the fall Special education school Independent living program Training at his residence Life education Training for volunteer fire department Life education classes Military (2) Question 2: If not, why hasn’t (student) chosen to enroll in post secondary education since high school? (Check as many as apply.) Didn’t have paperwork done Just haven't done it yet Does not know what field she wants to go into
Just taking a year off to save up some money for school
Doesn't know what she wants to do Looking into going Dropped out of school Moved out of town Enrolled for the upcoming fall (3) National Guard Fear of acceptance Not sure yet (2) Financial issues when doing school and work
Is enrolled for the upcoming semester, had a baby and got married
Gas prices are too expensive and is waiting a year to save up some money to go into town to start school. Very excited to start college!
Graduated one year early; plans on going to college next year
Got pregnant Pushed thru school Planning to go this fall to Wahpeton Scared to go because of her disability Had a child Started a family Has applied but not accepted yet Taking a year off He's still thinking about it. Thinking about finishing alternative school I never liked school too much Undecided In process of applying Voc Rehab wouldn't help Ordered into treatment program Went to work Joined the Marine Corps Work under Voc Rehab Question 3: Has (student) been employed at any time since leaving high school? Babysitting Started own business Employment through the Open Doors program
She is currently not working at this time though
He works in an internship Work Study at BSC Internship at RTO; also farm work Work study through school Self employed

55
Question 4: If (student) isn't working, why hasn’t (student) obtained employment since leaving high school? Attending Job Corps Is in sports year round at university
Financial Aid Is waiting to start a postsecondary education in the fall
Getting drivers license Mother has health problems Had a baby and got married so didn't have time
Not taking meds; not in the right frame of mind
Has 2 boys Only works in summer Question 7: Does (student) have health insurance? County Social Services Medicaid, Social Security Grandparent (2) Medical Assistance (2) Her health insurance expires April 30th, 2008 Medicare and Medicaid (2)
HIS (3) State school HMO, BCBS Through Job Corps Husband Tri Care thru the National Guard MA in Minnesota Unknown (2) Medicaid (26) Question 8: What is (student’s) current living arrangement? (Pick best fit from the description) Barracks Living in Arizona Bouncing around from house to house Military Grandmother Not sure In a rented apartment with support services Rent from mother Lives at jobsite and at home with parents Staying with an older sister Lives with boyfriend and boyfriends mom in their house Treatment
Question 9a: If (student) chose to drop out of school, what was the reason (student) left? A lot of problems with behavior Health issues, bullying Because of his disability Health problems Behind in credits (2) His disability causes a lack of focus Did not like it (3) Moved around Didn't feel he was going to succeed Medical reasons
If they would have left him on an IEP instead of taking him off of it due to funding cuts
Left because he had to take English over 3rd time. No real help through the Resource room. He was on an IEP but not helped. Very upset
Diploma (5) School structure didn't fit needs He was falling behind/Not enough 1 on1 contact
Fight in school, packed bags at 18 and moved out and dropped out of school
She was sick, and had bad anxiety Was not working out

56
Didn't want to go, Wasn't getting proper help Was living with mother at the time
His medication made him sleepy, needed more help
Someone tried to strangle a student so parent felt it wasn't a safe environment, child received bad sun burn on an outing
Got bullied Wasn't for him Got into trouble Question 9b: If (student) chose to drop out of school, what would have helped (student) stay in school? Better teachers Not sure (3) Get rid of the No Child Left Behind Act More interactive and interesting classes Had a program like GED in the high school Not moving Have a safer environment, and better care taking of students
Maybe if mother and father would not have gotten divorced
Having a different principal Nothing (5) He needed better friends. Some counseling Maybe given incentives, or job training classes
We didn't want to push her, it was better at the time for her not to be there
He needed more motivation Question 10: If (student) could change anything about his/her high school experience, what would he/she like to change? Applied himself, early on Not anything Be able to play more sports Not going to the high school i went to Be more outgoing Not missing any days at all Better/different friends (2) Not sure (13) Better grades (2) Better qualified teachers Not sure if LD program prepare them enough for college, how to study
Not to have a girlfriend, school was good experience
Better study habits Cannot answer (2) Not to have him separated from his peers, fear of being different
Not wasting time. Get most education could.
Change social life Nothing (102) Nothing has a good experience Nothing at all. students were very helpful Do better Nothing had a good experience Do not know (14) Nothing had a good LD teacher Do not know if he would change anything Nothing had a great time Do not talk about high school, it is done with
Chose different type of school rather than traditional high school
Everything was good Nothing, absolutely loved high school Frustration, more friends Nothing, had a great experience (6) Get into less trouble Nothing, he loved high school Get to know classmates better Nothing, programs were very good Girl problems Nothing, really enjoyed it

57
Getting help with school, LD, sooner, pressed the issue of getting help more
Nothing, thanks to the special services offered through the school
Give principal harder time Nothing. He was happy in high school. Graduate on time Offer more services and general studies Had a good IEP team so nothing major Offer more assistance Offer more time to and programs for job training and living skills
Offer different classes that do more with employment
Had a very good experience. Wishes she would have turned in more of her homework so she would have received better grades
Had a social skills program for kids with disabilities but it was dropped when the professional moved. Wish they could have continued the program
Hated school. Needed help and did not get it.
Have an English class that would qualify for people with his disability
Only liked seeing friends Participated in sports more Have an environment where he was not scared to go to. Where he was treated like a human being instead of an animal and to be treated equally
Some of the kids were not very understanding of her disability and were not very nice. She did not like being labeled as "special"
Have him go to school and graduate Placed on a IEP, did very well. Have more friends. Do things more with friends
People in the school/teacher (some of them)
Have more of focus on art and music Put more effort into school than I did Have more study skills Read more books Have some girls in my class. Really happy Take more elective classes She seemed to enjoy it. Have someone in school to keep teachers from slacking, but some were very attentive, liked the inclusive education
Problems with Case Manager with Learning Disability, switch case managers at the end.
Have the teachers be more educated about learning disabilities
Special ed unit did a fantastic job. Some regular teachers were not as willing to help
Have them do more with the LD classes and better acquainted for college
Studied more and taken more advanced course
Having more farming classes Stayed in school and received diploma He had a disturbing life, stay out of trouble Study a lot more He isolated a little bit. I wish he'd have been a little more involved. He was pretty self-conscious.
Have the school do more about the bullying situation
He would have liked to have done better in school
Taken classes to pass the test to get into college
He would like to go back. Taken more difficult classes Helped out more by the school Taken more drafting classes Her friends Taken more language classes His dad being a full time father Taken more math classes His foster care experience in high school was hard on him so would change that
Teacher dealing with special education did not follow the IEP

58
His whole senior year because of switching teachers
That he would have passed drivers ed to get his driver’s license
I cannot answer for her (2) The principal at the high school
His work ethic The principal was not very nice but otherwise than that it was good.
His high school experience was good but transition services going into college was terrible
They (the school) pulled his IEP, then told him he could not come to school anymore when he still should have been able to. They need more advocacy in school for people with disabilities
I do not know (3) To do another sport I do not know. It bothered him that he was in the developmental classes.
To make the learning process come easier but the school offered good services
I do not know. Nothing really. To study more and be a better student I have no idea. She had a pretty good experience. She got to do lots of things in the community.
In his last year he had a good LD teacher but before then the LD teacher was ineffective for him
I struggled in math. No other concerns. Too worried about what to do in the future I wish I would have decided to go to college to play football.
Tried a little harder instead of just getting by
I would have paid more attention. Tried harder To try harder Tried to work harder It went well. Not much to change. Try harder Joined a sports team Unique classes, skills in retail Learn more to do with computers Wait to have kids, and go to college Keeping things fair between the kids at school
Wanted more help, need more 1 on 1 time with teachers and did not get it.
Less English Wanted to be more involved in sports Loved High School Wanted to graduate from a different town Made gym class longer Way teachers dealt with him Make classes not so boring and alone, make more entertaining
More prepared for college with his disability
Maybe learn a little more Wishes she would not have gotten sick Middle and grade school, he was picked on bad. High school was a different experience.
Would have been nice to be able to keep him at home
More application Worked harder his freshman year More offered classes/ information on going into the workforce
More participation in extracurricular activities
Working harder on his studies Would change nothing/Active in FFA/Ag Wishes he could have been closer to home Would do more in the classroom More recent books. Would go to a different high school More shop classes Worked harder More social skills, joining clubs and such for kids with special needs
Would have been nice to have stayed in a private school

59
More variety of classes to be offered. Some of the teachers could have been more helpful
Would have given more life skills opportunities instead of academically focused
More involved Would have behaved
Need more following through by administration and teachers
Would have liked to play sports. School wouldn't allow him in music classes either. Teacher said she couldn't handle it
Need more help with services that are offered
Needed more study time, [Name] school helped him more than [Name 2] did
Would have played more sports Would have worked harder
Needed to grow up. Would like to be more into the regular education classroom
No (2) Would not change a thing No nothing Would pay more attention in class Question 11: Do you feel that (student) was prepared for life after leaving high school? Yes please explain. Able to do finances and basic survival Just accomplishing graduation Able to get a job and life experience Able to live on her own Just being able to follow societies rules and getting along
Just got basic knowledge and taking care of self
Able to make the choice to go to Job Corps Just happy to be done Able to work Just the classes I was able to take After looking at his year at college think he was prepared
LD teacher was great and able to do work on his level
All of the classes helped Just was As well as could be (11) Knowing how to use switches Attitude is good. Just the experience of high school Because he was able to live there so he learned independent living skills
Learned a lot in high school he was ready to go
Because he was working and knew how to pay bills and manage money
Because she was able to attend a school that fit her needs
Besides having a disability, he knew that he would have to transition and that he would be on his own and knew that he was moving away from family. He feels successful at his new place of residence and is happy there, it feels like a second family
Learning how to apply for jobs and getting ready for work life. Reality of getting out and learning how to work.
Because of counseling Life experiences helped Being able to have a job and live on own Life yes, academics a little behind Learned everything he should have Mom did not know Still has some questions Mom helped the most Classes got him ready for the real world More independent
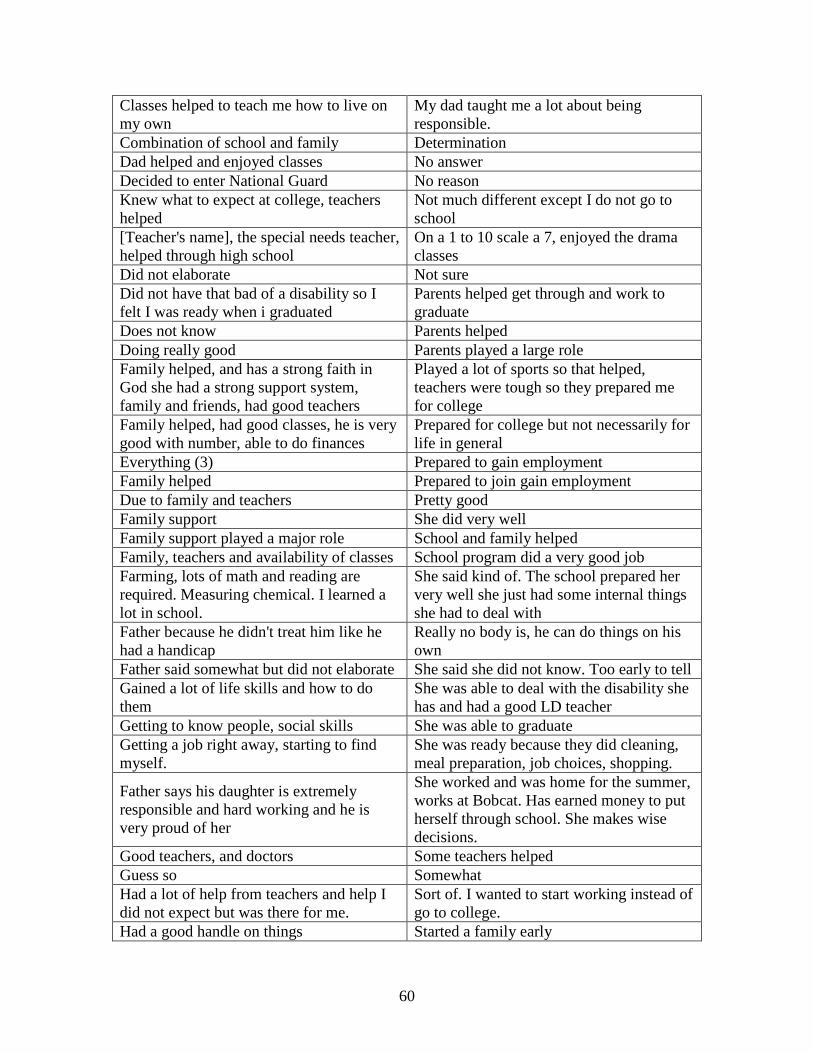
60
Classes helped to teach me how to live on my own
My dad taught me a lot about being responsible.
Combination of school and family Determination Dad helped and enjoyed classes No answer Decided to enter National Guard No reason Knew what to expect at college, teachers helped
Not much different except I do not go to school
[Teacher's name], the special needs teacher, helped through high school
On a 1 to 10 scale a 7, enjoyed the drama classes
Did not elaborate Not sure Did not have that bad of a disability so I felt I was ready when i graduated
Parents helped get through and work to graduate
Does not know Parents helped Doing really good Parents played a large role Family helped, and has a strong faith in God she had a strong support system, family and friends, had good teachers
Played a lot of sports so that helped, teachers were tough so they prepared me for college
Family helped, had good classes, he is very good with number, able to do finances
Prepared for college but not necessarily for life in general
Everything (3) Prepared to gain employment Family helped Prepared to join gain employment Due to family and teachers Pretty good Family support She did very well Family support played a major role School and family helped Family, teachers and availability of classes School program did a very good job Farming, lots of math and reading are required. Measuring chemical. I learned a lot in school.
She said kind of. The school prepared her very well she just had some internal things she had to deal with
Father because he didn't treat him like he had a handicap
Really no body is, he can do things on his own
Father said somewhat but did not elaborate She said she did not know. Too early to tell Gained a lot of life skills and how to do them
She was able to deal with the disability she has and had a good LD teacher
Getting to know people, social skills She was able to graduate Getting a job right away, starting to find myself.
She was ready because they did cleaning, meal preparation, job choices, shopping.
Father says his daughter is extremely responsible and hard working and he is very proud of her
She worked and was home for the summer, works at Bobcat. Has earned money to put herself through school. She makes wise decisions.
Good teachers, and doctors Some teachers helped Guess so Somewhat Had a lot of help from teachers and help I did not expect but was there for me.
Sort of. I wanted to start working instead of go to college.
Had a good handle on things Started a family early

61
Had a very good mentor who was a stand up kind of guy special ed teacher helped to become a self advocate and was awesome
Had to grow up fast so he assumed the role of helping and knew what life was about, very responsible
Had a wonderful LD teacher Taking a career class and transition classes Still has lots of growing up to do. Needs experiences.
Teachers helped a lot, knew he had to grow up
Had some experience living on his own his senior year
Teachers were willing to help and offered more support
Had some very good teachers, lots of support through her family
Thanks to ongoing programs, and family support
Had responsibility Thanks to parents The availability of classes and help from brothers
The aides were very helpful, learned good writing skills
He had a very good LD program that helped him with his study skills and staying on task
He knew what he was interested in doing for a career after high school
He has a good work ethic in school and in life, also has good will power
The carpentry program helped with his hands-on learning, work ethic was good
He believes so The LD teacher really helped He was able to work and did well in hands on learning
He was in scouts so he learned a lot about being prepared and doing things on his own
The teachers helped The teachers were really good He was ready They helped to get ready for college Was able to move on her own and get a job They prepared me for what I needed. He was working already in high school. He knows what work is. He knew what was coming after graduation.
Took classes like home improvement, health careers, classes on living on your own
[Teacher's name] helped a lot Very ready. Help from teachers and the homework and tests
Was able and wanted to pursue further education
Helped to let him know what he wanted to do
Was able to learn about the environment outside of school
He is doing very well in school and is pretty responsible.
He was mature and worked through his senior year in high school.
His teacher was excellent with handicapped kids
Was able to take a living skills class, and work skills, communication classes
Home life helped, after graduating social security called and said she did not qualify as having a disability so they cut off services
I cannot see him living on his own. He needs guidance in many areas. One is money. Another is picking up after himself. He definitely needs a guardian.
How to manage money Was able to take some living classes
Was able to take a lot of classes Went into National Guard--paid for his college.
Independent Will see It was different -different things to get used to.
Work experiences during high school helped

62
It was the way I was raised. Yes, he was ready Question 11: Do you feel that (student) was prepared for life after leaving high school? No please explain. A class like home economics would have been helpful for knowing more about managing money, doing laundry and those sorts of things
Not able to manage life on own. lived by himself for a year but is moving home with parents
A life skills class would be nice Needed more life skills After I started working I did Needed more time
Because he was held back he has poor social skills, low self esteem, depressed due to this. Wants to succeed but needs a type of program to help with this type of learning.
Needed to have more job/life skills. Definitely need improvement on transition services. It was supposed to start his junior year but didn't receive any until senior year and then hardly got any services or use from the program. Could have also gotten more
Because of his disability he can't live independently but is working towards that goal
Not as well as he should have been. I don't think he realizes that what he does now has such an impact on his future.
Below average. Nothing the school could have done to help.
Needed to follow through with more transition changes
He didn't get his degree Because of Voc Rehab inability to help Needed some experience for finding out what he wanted to do. likes to do hands on activities
Needed to know the real world, in certain situation where to go for help, how to be more assertive
Better sex education, teach more about finances
Needed to learn more about employability and writing resumes and such
Better teachers Needed to offer home economics, life skills Could have offered more ideas about employment opportunities rather than focusing so much on college
No one is prepared for life after high school, all areas of life can't be covered in the school setting
Could have offered a class that is about life skills
Brother didn't think so, nothing high school could teach you for life
Could have offered financial No reason No one is ready after leaving high school Not a very good education Could have offered more life skills classes, banking knowledge
Needed more life skills, financial, automotive, home skills
Counseling at a younger age Needed to fill out college applications Depends on a lot of support from parents but is pretty much ok Not even close. There's a lot more expenses
Didn't get enough help from the school Don't realize how to manage money Didn’t want to elaborate Not for college. Doesn’t know much about taxes taken from paychecks
Not for life at college but as well as could be expected
Financial issues Not grown up yet

63
Even though he was older he needed more experience. I tried to give him advice about my own experience
Not focused enough, maybe didn't get enough attention direction from parents and family
Not prepared for college with his disability. In high school he had a great LD teacher, [Name], but at college he didn't have a teacher/helper that took the time to do the same
Not from the school but from family. Special ed courses didn't offer needed classes for graduation. They asked mother to tutor instead because there wasn't enough teachers available. Expected him to perform at normal level in classroom when he had an IEP
Financial planning Not really grown up but otherwise ok For a kid with learning disabilities the paperwork didn't help and made feel defeated; not a quick learner so was misunderstood
Offer more social skills classes, more teachers with better skills and qualifications and patience for students with special needs
He experienced a traumatic car accident and health problems
Offer more choices for jobs let you know what's out there, maybe go to college
Not sure Nothing He's pretty low functioning; school didn't fail, he's just not capable
Nothing to do with the high school more individual
His maturity level is way behind his peers along with his reading/comprehension skills and printing
Her mom said the whole first year of college was a real eye opener that her daughter was not at all prepared for
HS they still treat you like 10 yrs old Offer more life skills classes, job skills I don't feel I'm ready. Not really, wants to learn how to drive I don't know that anyone is ready. Poor writing skills If counselor would have taken time to meet with students more to discuss options
only thing is that needed to learn to write a resume
In every aspect but with college needed help taking tests and studying
Program was worthless in High School for [Name] not enough 1 on 1
If they offered a life skills class She could have been a little more prepared. She is learning as she goes, able to take care of self and wants to make it on her own
She didn't have a concept on how to handle money. Social issues as well--when to listen to your friends, etc.
Knows generals of life but not so much in terms of being financially informed and as mature as he should be
She had some problems but it had nothing to do with the school or its services, don't think they could have done anything
Lack of maturity Just facing reality of growing up Learning about finances, experienced loss of father made it hard
Let kids know more about how life is after high school
She said yes and no. No because she didn't know right away what she wanted to do for a profession when she exited. But now she has it figured out so she feels prepared.
She wasn't ready for financial aspect, but not concerned about her ability to take care of herself and live independently
Taking responsibility for own actions Should have taught him more. Need more socialization They could have done a lot better

64
Mom feels that her daughter just did the work but did not comprehend it. She feels the school did not have adequate resources available.
The school could have had more focus on students choice for after school, maybe more on employment and not just on college
Need more social skills but prepared otherwise
The school needs to provide better services and support for students and family
More one to one instruction, more demand from instructor
Need availability of group homes because of amount of care that she needs
Need to help distinguish people who may use him
Too many choices for future and not enough direction
Needed more application on his behalf, more services to get ready for the outside world
Wasn't prepared because of his disability. He didn't receive a fair chance at receiving his education
Would have helped to make better friends, he hung around with the wrong crowd. More job fairs and help to find out what options were available after high school
Were interested in the transition program offered through the state but were told that the transition program was not for him. Parents felt he could have benefited from that program, wish they could have been able to participate
Needed a quality plan instead of occupational coursework
Wish the classes they offered were more like college classes; Would help to have been more prepared
Needed better LD services, he is not able to do finances or be on his own
Would have been nice to have a stronger business program, and building trades
Needed more experiences Needed more challenging Needed more help with general life skills Would have liked to have saved money Needed more help with his disability Would like drivers license and a job Needed more information on the workforce and getting a job
You can only learn so much, not too much about life
Question 12: Since exiting high school has (student) been referred to…? (Choose as many as apply) A type of social service program Open Door Program (4) Community Options REM Her mom just said Rehabilitation and the person she works with in [city]
Something through Jamestown that helped me get back braces and stuff.
Job Corps Sylvan learning centers, Ace it program Labor Ready West Central Human Resources Military Work investment program Northeast Question 13: Does (student) currently receive services for his/her disability? Academic support services Northeast Human Services. Receives services from the FACE program he is attending
Not at this moment but she will be getting a job coach when she turns 21
Attending Job Corps Only went once though to VR
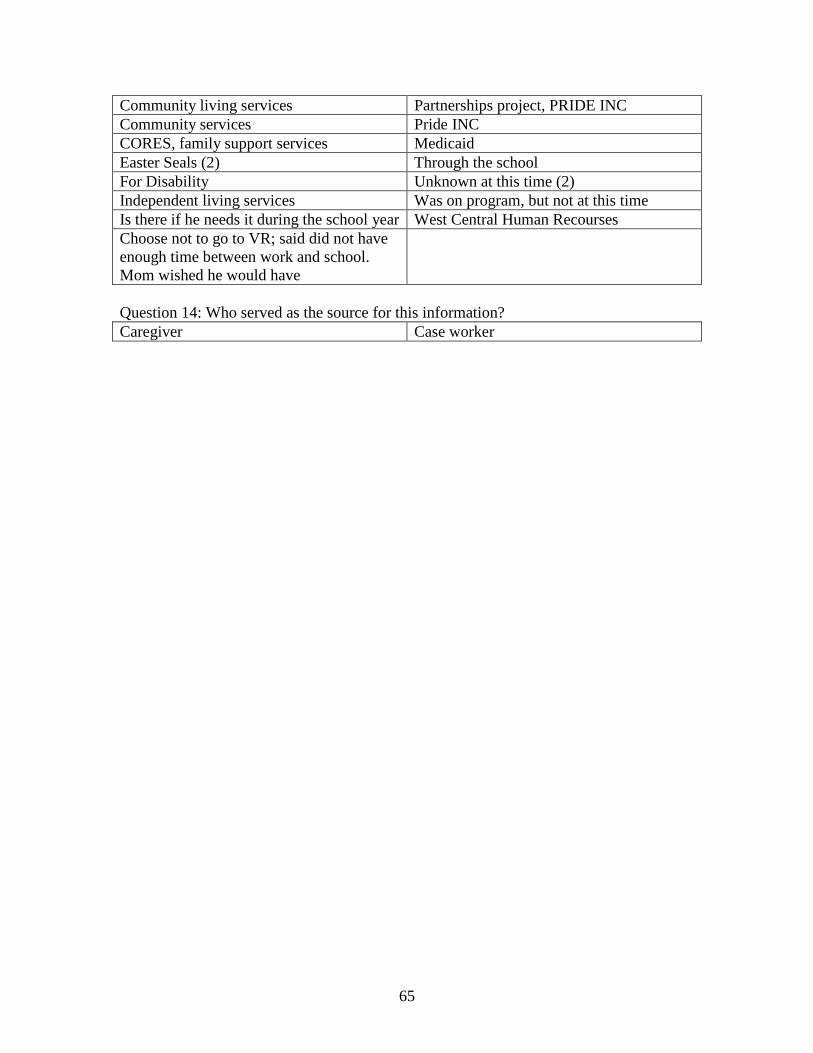
65
Community living services Partnerships project, PRIDE INC Community services Pride INC CORES, family support services Medicaid Easter Seals (2) Through the school For Disability Unknown at this time (2) Independent living services Was on program, but not at this time Is there if he needs it during the school year West Central Human Recourses Choose not to go to VR; said did not have enough time between work and school. Mom wished he would have
Question 14: Who served as the source for this information? Caregiver Case worker


