NBER WORKING PAPER SERIES FINANCIAL DISTRESS AND ...
33
NBER WORKING PAPER SERIES FINANCIAL DISTRESS AND EMPLOYMENT: THE JAPANESE CASE IN THE 90s Kazuo Ogawa Working Paper 9646 http://www.nber.org/papers/w9646 NATIONAL BUREAU OF ECONOMIC RESEARCH 1050 Massachusetts Avenue Cambridge, MA 02138 April 2003 This paper is part of the research project where the author was a chief research economist at Research Office, Director-General’s Secretariat of Small and Medium Enterprise Agency. The author was permitted by Statistical Bureau of Ministry of Public Management, Home Affairs, Posts and Telecommunications to use the micro-data of the Annual Report of Financial Statements of Incorporated Business for the purpose not originally intended when the data was collected. The author thanks Hidehiko Ichimura, Anil Kashyap, Fumio Ohtake, the participants of the NBER/CEPR/CIRJE/EIJS Japan project meeting and the research stuff at Research Office, Director-General’s Secretariat of Small and Medium Enterprise Agency for useful suggestions and comments. This research was partially supported by Grants-in-Aid for Scientific Research 12124207 of the Ministry of Education. Any remaining errors are the sole responsibility of the author. The views expressed herein are those of the authors and not necessarily those of the National Bureau of Economic Research. ©2003 by Colin Mayer, Koen Schoors, and Yishay Yafeh. All rights reserved. Short sections of text not to exceed two paragraphs, may be quoted without explicit permission provided that full credit including ©notice, is given to the source.
Transcript of NBER WORKING PAPER SERIES FINANCIAL DISTRESS AND ...

NBER WORKING PAPER SERIES
FINANCIAL DISTRESS AND EMPLOYMENT:THE JAPANESE CASE IN THE 90s
Kazuo Ogawa
Working Paper 9646http://www.nber.org/papers/w9646
NATIONAL BUREAU OF ECONOMIC RESEARCH1050 Massachusetts Avenue
Cambridge, MA 02138April 2003
This paper is part of the research project where the author was a chief research economist at Research Office,Director-General’s Secretariat of Small and Medium Enterprise Agency. The author was permitted byStatistical Bureau of Ministry of Public Management, Home Affairs, Posts and Telecommunications to usethe micro-data of the Annual Report of Financial Statements of Incorporated Business for the purpose notoriginally intended when the data was collected. The author thanks Hidehiko Ichimura, Anil Kashyap, FumioOhtake, the participants of the NBER/CEPR/CIRJE/EIJS Japan project meeting and the research stuff atResearch Office, Director-General’s Secretariat of Small and Medium Enterprise Agency for usefulsuggestions and comments. This research was partially supported by Grants-in-Aid for Scientific Research12124207 of the Ministry of Education. Any remaining errors are the sole responsibility of the author. Theviews expressed herein are those of the authors and not necessarily those of the National Bureau of EconomicResearch.
©2003 by Colin Mayer, Koen Schoors, and Yishay Yafeh. All rights reserved. Short sections of text not toexceed two paragraphs, may be quoted without explicit permission provided that full credit including©notice, is given to the source.
Financial Distress and Employment: The Japanese Case in the 90sKazuo OgawaNBER Working Paper No. 9646April 2003JEL No. E5, J2
ABSTRACT
We examine quantitatively the extent to which financial distress in the 1990s affected employment
behavior in Japan. Based on the firm-level panel data that include small firms, we estimate dynamic
labor demand function, taking the impact of financial distress on employment into consideration.
We find that the firm’s ratio of debt to total asset exerts a significantly negative effect on
employment of small firms. We also find that employment of small firms is sensitively affected by
lending attitude of financial institutions.
Kazuo OgawaInstitute of Social and Economic ResearchOsaka University6-1 Mihogaoka, Ibaraki, Osaka567-0047 [email protected]

2
1.Introduction
It is often argued that massive debt outstanding in the corporate sector and the
associated bad loan problems in the banking sector are the main cause of long stagnancy
of the Japanese economy in the 1990s. Theoretically, financial distress exerts a negative
effect on the real economy through a variety of channels.
First of all, it is well known that the balance sheet conditions of debtors affects the
cost of external funds when there is asymmetric information between debtors and
creditors. The cost of external finance is higher than that of internal finance, reflecting
several factors including the creditor’s cost of collecting the debtor’s information and
monitoring the debtor’s behavior, and the costs arising from lemon problems or moral
hazard. It can be shown that the external finance premium, the wedge between the cost
of external finance and internal finance, is an increasing function of the loans
outstanding relative to the collateralizable net worth. Thus, the higher the debt burden is
on firms, the higher the cost of external finance is, thereby leading to cut back of
economic activities of the debtor.1
Secondly, under asymmetric information, managers’ interests can diverge from the
shareholders’ interests and managers might pursue their own interests. An increase of
debt to net worth raises external finance premium due to the associated increase in the
probability of bankruptcy. Managers are more concerned with bankruptcy than
shareholders, since it is quite likely in the case of bankruptcy that the managers are fired.
Therefore, faced with increasing debt, managers will make every effort to cut back labor
and investment to raise efficiency. This is a disciplinary role of debt.
Thirdly, corporate debt can affect investment by creating debt overhang. Debt
overhang is defined as deterrence of new investment due to the presence of debt
outstanding. It occurs when the face value of debt outstanding is greater than its market
value. In this case some of the benefits from new investment will go to the existing
creditors rather than to the new investors.2
Fourthly, bad loans can also cause problems. An increase of bad loans impairs the
bank’s balance sheet. It raises the cost of external finance for the bank for the same
reasons as were discussed above and thereby restrains the bank’s lending activity. It will

3
in turn exert a negative effect on the real activities of the bank-dependent borrowers.
Based upon the theoretical developments on the relations between financial
distress and the real economy, some studies examined empirically how the financial
distress affected the Japanese economy. However, all of them are mainly concerned with
the impact of financial distress on fixed investment.3 It should be noted that the
arguments held for fixed investment are perfectly applicable to employment since both
fixed capital and labor are quasi-fixed in nature.4
The purpose of this paper is to examine the impact of financial distress in 1990s on
employment of Japanese firms quantitatively. Specifically, using firm-level micro data
we estimate the extent to which firms’ employment is affected by high leverage in the
corporate sector and bad loan problems in the banking sector.
There are two novel features of this study. First of all, we analyze a rich panel data
set that is constructed from the Annual Report of Financial Statements of Incorporated
Business or Hojin Kigyo Tokei Nenpo of the Ministry of Finance(abbreviated as ARFS).
It includes not only large firms listed in stock exchange but also unlisted small firms.
The sample period covers the period of 1993 to 1998 that includes the financial turmoil
that is often described as a “credit crunch” in Japan. There are no previous studies that
investigate the impact of financial distress on employment by utilizing firm-level data
including small firms.
Secondly, we deal with not only financial leverage in the corporate sector but also
bad loan problems in the banking sector. Lingering bad loans on the banks’ balance
sheet might lead to a reduction of bank loans, which might directly affect employment
of bank-dependent firms. In general, it is quite difficult to estimate the effect of loan
supply on employment from observed data of bank loans due to the identification
problem of supply and demand conditions. Therefore it is necessary to select the
variable purely representing the supply condition of loans. Fortunately the Bank of
Japan Tankan (Short-term Economic Survey of Corporations) records the diffusion
index of ‘banks’ willingness to lend’ that can serve as a good proxy of the supply
condition of loans. The data is available by industry and firm size, so that it is possible
to test whether the impact of supply conditions of loans on employment varies across
4
firms with different size.
We preview our main findings of this study. First the firm’s ratio of debt to total
asset exerts a significantly negative effect on employment of small firms. It is consistent
with capital market imperfections story that suggests that the external finance premium
is inversely associated with the collateralized net worth relative to loan size. Second, the
lending attitude of financial institutions has significant effect on employment of small
firms. It implies that bank health is important for employment of small firms that are
bank-dependent. Therefore, mounting debt outstanding in the corporate sector as well as
bad loans in the banking sector is partially responsible for cut back of employment of
small firms in the 1990s.
This paper is organized as follows. The next section sketches a derivation of
dynamic labor demand function to be estimated from the intertemporal profit
maximization of firms. Section 3 explains the procedure for constructing the panel data
set along with the major characteristics of the obtained data set. Section 4 explains the
estimation results and discusses the implications derived from them. Section 5 gives
concluding remarks.
2. Formulation of Employment Equation in an Intertemporal Optimization Framework
The basic model of labor demand we rely upon is a dynamic model originally
developed by Nickell(1986). The virtue of the model is that it has solid
micro-foundations. Employment decisions are made in such a manner that the firm
maximizes the present value of its earnings net of quadratic adjustment cost of
hiring/firing labor. Then it can be shown that the actual employment is written, via a log
approximation and the certainty equivalence results, as
( )( ) ( ) *
01 log11loglog st
s
stt NNN +
∞
=− ∑−−+= αµαµµµ (1)
where tN :actual employment in period t
*tN : short-run equilibrium employment in period t
µ :stable root of the Euler equation of employment

5
r+
=1
1α and r is a real interest rate in terms of wages
10 << α
Note that the speed of adjustment, µ−1 , decreases as the convexity of adjustment cost
rises and that it is also affected by the discount factor α .
Eq.(1) is modified in several ways to obtain the employment equation to be
estimated. First, we incorporate the existence of different types of labor with different
adjustment costs. Then it can be shown that the aggregated employment equation has at
least two lags on the dependent variable. Furthermore, the coefficient structure in the
distributed lead term is much more complex than a simple geometric recursion. 5
Second, we specify the short-term equilibrium level of employment under the
CES production function. When the production function is written as
( )[ ] ρρρ γγ1
* 1−
−− −+= ttt KNAY , (2)
where tK :capital stock at the beginning of period t
tY : real output in period t
then the equilibrium employment level that maximizes the short-run profit for a
competitive firm is given by
( )t
tt pwAYN
+
−+
+= − log1
1log1
1loglog *
ργ
ρρ (3)
where tw : nominal wage rate in period t
tp :output price in period t
Third, we assume that the variables determining the short-run equilibrium
employment have the following stochastic structures.
yttyyt YaaY ε++= −110 loglog

6
wtt
wt
wwt p
wapwaa
pw ε+
+
+=
−− 22
110 logloglog (4)
where wtyt εε , iid stochastic disturbances
Fourth, we approximate the degree of financial distress by two variables. One
corresponds to the leverage of the firms and the other to the proxy of bad loan burden
on banks. The former is represented by the ratio of debt to total assets ( tDEBT ) and the
latter by the lending attitude of commercial banks ( tLEND ). It is expected that the
harder the bad loan problem hits the bank, the more severe the bank’s lending attitude
becomes. The degree of financial distress has an impact on employment through two
channels. One is by changing the external finance premium facing the firm. High debt
outstanding relative to total assets and/or severe lending attitude of banks raises the
external finance premium under asymmetric information between lenders and borrowers,
which in turn leads to an increase of effective interest rate or a decrease of discount
factor α . Note that the speed of adjustment is affected by the discount factor.
The other is a disciplinary role of debt. Firm managers have more incentive to
cut employment when the debt asset ratio is high. In other words, faced with increasing
debt, managers realize the adjustment cost of labor to be less convex. It implies that
managers can adjust employment less costly.
Substituting eqs.(3) and (4) into eq.(1) and taking an additional lag of the
dependent variable and financial factors into consideration, we obtain the employment
equation to be estimated as:
Ntttttt
tttttt
ttttt
LENDDEBTYpw
pw
LENDNDEBTNLENDNDEBTNNNN
εβββββ
βββββββ
++++
+
+
×+×+×+×+++=
−
−−−−−−
−−−−
111091
87
226225114
11322110
logloglog
logloglogloglogloglog
(5)
where Ntε : disturbance term
Note that the financial distress variables affect not only the employment level
but also the adjustment process of employment.

7
3. Data Set Construction and its Characteristics
The panel data set we use is constructed from the Annual Report of Financial
Statements of Incorporated Business or Hojin Kigyo Tokei Nenpo (ARFS) of the
Ministry of Finance. It records individual items of firms’ balance sheet as well as profit
and loss statement. The virtue of this data set is an extensive coverage of corporations
with a variety of firm size for all the industries except financial and insurance industries.
The coverage of firms is much wider than the firm database provided by NIKKEI and
Development Bank of Japan, both of which include only the listed large firms.
The sample period covers the fiscal year of 1993 to 1998 including the period of
financial turbulence in 1997 and 1998. The number of observations in the original data
set is 26040, 26218, 26594, 25691, 25394, and 25505 in the period of 1993 to 1998,
respectively. The ARFS is basically a cross-section data and the sampled firms whose
equity capital are less than one billion yen are chosen randomly at the beginning of
fiscal year and fixed for a year, although the sample includes all the firms whose equity
capital are more than one billion yen. Fortunately, the ARFS has major items of firms’
balance sheet at the beginning of period as well as at the end of period. This overlapping
nature of data series enables us to obtain a panel data set by comparing the
beginning-of-period asset in the current period with the end-of-period asset in the
previous year. When they coincide, it is inferred that they are generated from the same
firm. Specifically, comparison is made between the beginning-of-period value in the
current period and the end-of-period value in the previous year for three items of firm’s
balance sheet: total assets, tangible fixed assets excluding land, and total borrowings.
The total number of firms consistently available during the whole sample period
is 3044. The industry classification of the sampled firms is shown in Table 1.6 The
number of manufacturing firms is 1463(48.1%) and the rest belong to
non-manufacturing industries (51.9%). The price we have to pay for obtaining the panel
data set is to discard the firms discontinuously sampled, most of which are small firms.
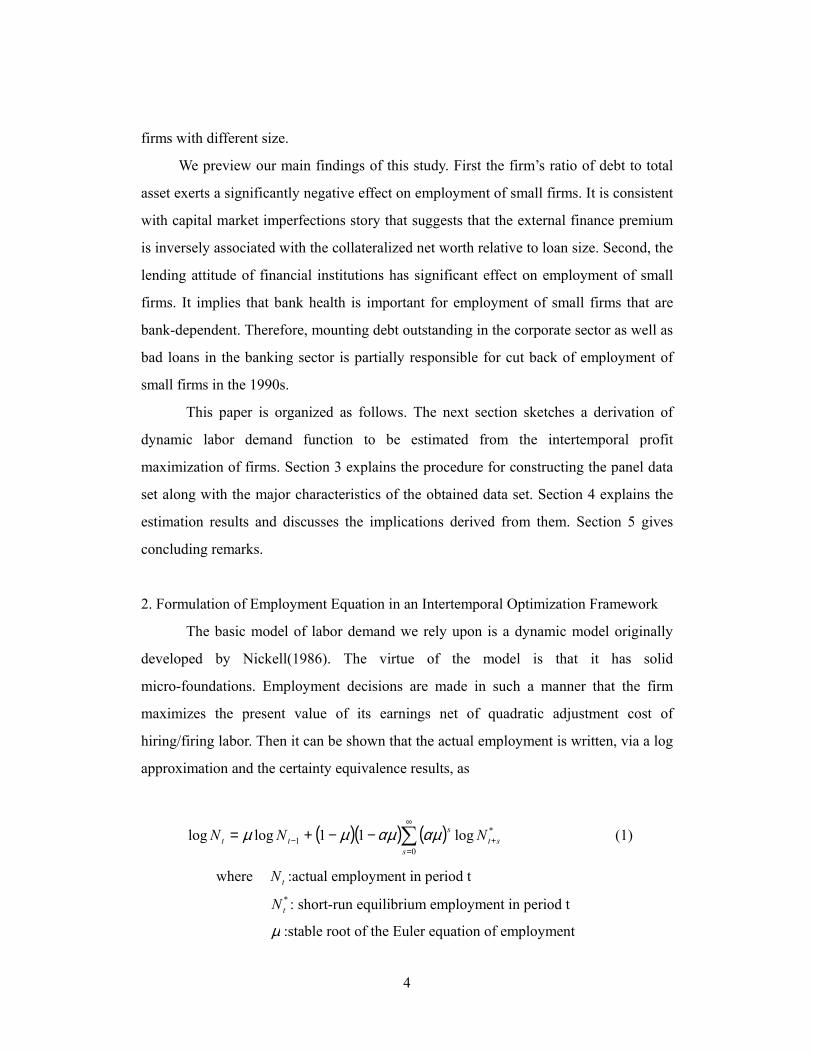
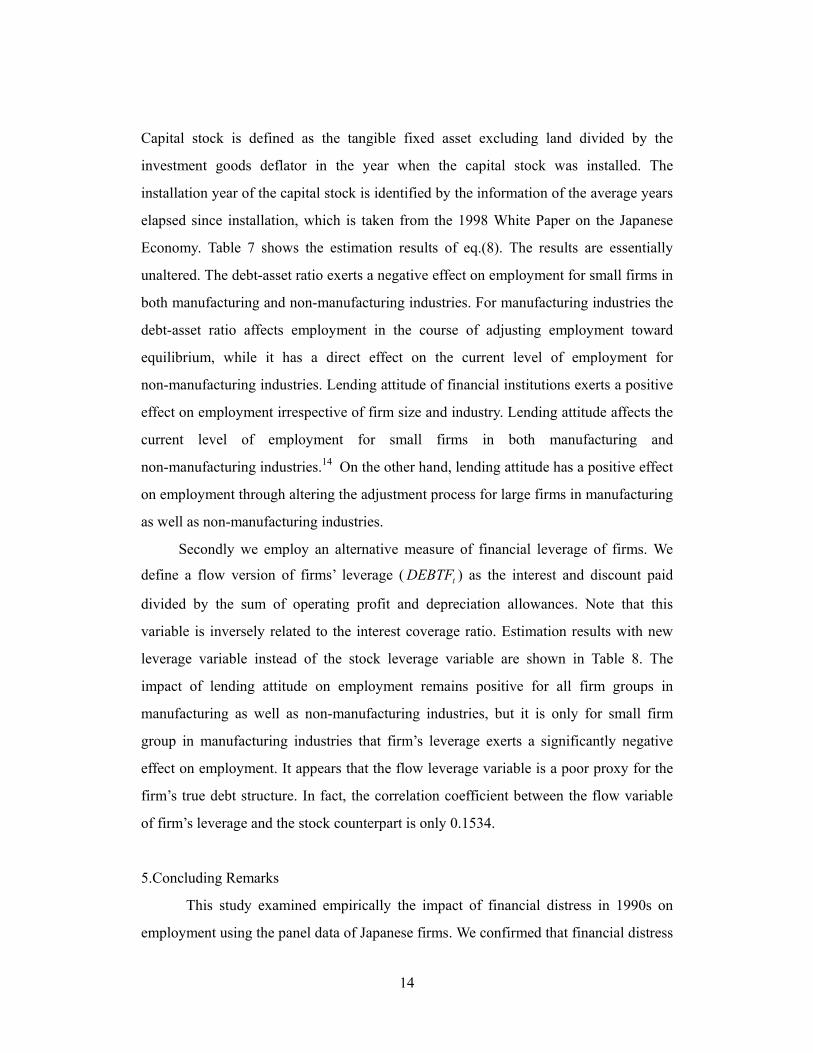
Figure 1 and 2 show histograms of equity capital and number of employees of the
constructed panel data set in 1993, respectively. The proportion of firms whose equity

8
capital is less than 1 billion yen is 30.9 % for our sample, while it is 82.8 % for the
original data set. As for the distribution of employees, the proportion of firms with
employees less than 100 is 14.4 % for our sample, while it is 62.7 % for the original
data set.7 This suggests that the histogram of equity capital as well as the number of
employees is much more skewed to the right for the constructed data set than for the
original one. In fact the median of equity capital and the number of employees is 1664
million yen and 529 for the constructed data set, while they are 99 million yen and 42
for the original data set.
Now we describe the procedure to construct the variables used in estimation.
The employment variable ( )tN is measured by the number of employees excluding
directors. Real output is measured by real value-added, which is the sum of current
profits, salaries for staffs, welfare expenses, interest and discounting expenses, rental
fees of tangible assets and land, taxes, and depreciation allowance. The nominal
value-added is deflated by the industry value-added deflator. The wage rate is computed
as the sum of salaries for employees and welfare expenses divided by the number of
employees. We obtain the real wage rate by dividing the nominal figure by the industry
value-added deflator. The debt-asset ratio is defined as the ratio of borrowings and
bonds payable to total assets at the beginning of period. The lending attitude of financial
institutions is taken from the Short-term Economic Survey of All Enterprises called
Tankan, conducted by the Bank of Japan. It is the diffusion index and represents the
proportion of entrepreneurs feeling the present lending attitude of financial institutions
to be “accommodative” minus those feeling the present lending attitude of financial
institutions to be “ severe”. The data are available by industries and three firm-size
groups (small, medium and large firm group) classified by regular employees.
Table 2 shows the median and mean values of real value-added, number of
employees, real wage rate, and the ratio of debt to total assets over the whole sample
period for manufacturing and non-manufacturing industries. The mean value is much
higher than the median value especially for real value-added and number of employees,
implying that the distribution of these variables is skewed to the right. The mean and
median values of real value-added, number of employees, and real wage rate are larger

9
for manufacturing industries than for non-manufacturing industries. On the contrary, the
debt-asset ratio is higher for non-manufacturing industries.
Figure 3 shows the diffusion index of lending attitude of financial institutions for
three firm groups in the period of 1993 to 1999. It is clear that the lending attitude
becomes very severe in the last quarter of 1997. Note that large financial institutions
such as Yamaichi Securities and The Hokkaido Takushoku Bank went into bankruptcy
on November in 1997. The proportion of “severe” respondents exceeded that of
“ accommodative” respondents starting in the first quarter of 1998.
4. Impact of Financial Distress on Employment: Quantitative Evaluation
Eq.(5) is estimated in a first-differenced form by the two-step GMM estimation
proposed by Arellano and Bond(1991). The instruments we use are logarithm of thrice
and fourth lagged employment, twice to fourth lagged logarithm of real value-added and
real wages, once to fourth lagged debt-asset ratio and lending attitude of financial
institutions and the cross terms of logarithm of thrice and fourth lagged employment
with the corresponding lagged debt-asset ratio and lending attitude of financial
institutions. Estimation is conducted for four cases classified by industry
(manufacturing and non-manufacturing) and firm size (small to medium-sized firms and
large firms). The large firms are defined as those whose equity capital in 1993 are
larger than 1 billion yen.
Basic Results
Table 3 shows the estimation results. Real value-added has a significantly
positive effect on employment, irrespective of industry and firm size. Real wage rate
also exerts a significantly negative effect on employment for all firm groups in
manufacturing as well as non-manufacturing industries. As for the effect of financial
distress on employment, the debt-asset ratio has a significantly negative effect on
employment for small firms in manufacturing and non-manufacturing industries.
However, the manner in which debt-asset ratio affects employment differs between
these two sectors. For manufacturing industries debt-asset ratio exerts a negative effect

10
on the adjustment process of labor. That is to say, higher debt-asset ratio increases the
speed of adjusting employment toward equilibrium level. On the other hand, the
debt-asset ratio directly affects the current level of employment negatively for
non-manufacturing industries.
Lending attitude has a statistically positive effect on employment for all firm
groups, irrespective of industry. The response pattern of employment to lending attitude
is somewhat similar to that of employment to debt-asset ratio. Severe lending attitude
raises the adjustment speed of employment for all firm groups in manufacturing
industries and large firms in non-manufacturing industries, while severe lending attitude
leads to direct reduction of current employment for small firm group in
non-manufacturing industries. We will discuss later why small firms, in particular for
non-manufacturing industries, responds quickly to financial distress.
Quantitative Evaluation of the Impact of Financial Distress on Employment
Now we evaluate quantitatively the impact of financial distress on employment
by comparing the employment pattern across firms with different debt structure and
facing different lending attitudes of financial institutions. Our empirical strategy to
accomplish this purpose is to conduct the following four numerical exercises. The first
exercise we make is to compute how much current employment is reduced when the
debt-asset ratio increases. Table 4 shows the percentage change in current employment
by firm size for selected industries when the debt-asset ratio rises from the 1st quartile to
the 3rd quartile in 1998. Employment is substantially reduced for small firms in
non-manufacturing industries. For instance, employment is reduced by 36.6 percent for
small real estate firms. The percentage change in employment of small firms in
manufacturing industries is second largest, hovering around 1-2 percent, although it is
by far smaller than that of counterparts in non-manufacturing industries. The change in
employment of large firm groups is much smaller than that of small firm groups.
In the second exercise, we compute how much current employment changes when
lending attitude becomes severe. Table 5 shows the percentage change in current
employment by firm size for selected industries when lending attitude changes from

11
1996 that is a relatively accommodative year to 1998 when credit contracted severely.
Employment is reduced by between 1.3 and 2.6 percent for small firms.
The third exercise is to compare the adjustment process of employment across
firms with different debt structure when a temporary shock hits the firm. Specifically we
compare the future adjustment paths of employment generated by a one-standard-error
increase in the employment equation residual between a firm with the 1st quartile
debt-asset ratio in 1998 and a firm with the 3rd quartile debt-asset ratio in 1998. The
exercise is conducted by firm size for four manufacturing industries (chemicals,
machinery, electrical machinery and transport equipment) and four non-manufacturing
industries (construction, wholesale trade, retail trade and real estate). The results reveal
that the higher the debt-asset ratio is, the quicker the adjustment of employment toward
equilibrium, but the difference is not large quantitatively. In fact, for manufacturing
industries the difference is at most 7 basis points (1st to 2nd year after the shock in
electrical machinery) for small firms and 4 basis points (2nd year after the shock in
electrical machinery). As for non-manufacturing industries, the difference is at most 8
basis points (2nd year after the shock in real estate) and 3 basis points (1st to 2nd year
after the shock in real estate).8
The last exercise is to compare the adjustment process of employment across
firms facing different lending attitudes when a temporary shock hits the firm. We
compare the dynamic path of employment generated by a one-standard-error increase in
the employment equation residual between a firm facing severe lending attitude and a
firm facing accommodative lending attitude.9 The exercise is conducted by firm size for
the same industries in the third exercise. The results indicate that the more severe the
lending attitude is, the quicker the firm adjusts employment toward equilibrium, but the
difference is by no means large. For manufacturing industries the difference is at most 6
basis points (1st year after the shock in chemicals) for small firms and 3 basis points (2nd
year after the shock in machinery). For non-manufacturing industries, the difference is
at most 3 basis points for small firms (2nd year after the shock in construction, wholesale
trade and real estate) and large firms (1st year after the shock in construction, wholesale
trade and real estate).

12
To sum up, increase in debt-asset ratio reduces the current level of employment
for small firms substantially, but not for large firms. Higher debt-asset ratio raises the
adjustment speed of employment irrespective of firm size and industry, but it is not
quantitatively large. The same holds true for the impact of lending attitude on
employment.
Interpretations of Our Findings
Our findings are consistent with the theoretical prediction that financial distress
might exert a negative effect on employment. Moreover, the finding that the impact of
financial distress on employment is much stronger for small firms is reasonably
interpreted as follows. First, the external finance premium might be raised higher by the
debt-asset ratio for small firms since large firms have large collateralizable net worth
that helps to diversify unobservable idiosyncratic risk, while small firms do not.10
Moreover, a number of large firms in Japan belong to industry groups known as keiretsu,
where main bank plays a central role in mitigating the informational asymmetry
between lenders and borrowers, while small firms have relatively loose ties with main
banks. Aoki(1994) argues that main bank system is institutionally complementary with
the Japanese employment system where employees embodying firm-specific training
are kept within a firm over quite the long term. Moreover, large firms tend to retain a
higher proportion of employees with firm-specific training, which is confirmed by the
following table. Table 6 shows the average length of service of employees by firm size
for selected industries. The average length of service is used as a proxy of the extent to
which firm-specific training is prevalent in an industry. We can see from the table that
the average length of service is shorter for small firms, irrespective of industry. The
upshot is that labor resources of large firms that embody firm-specific training fluctuate
less by the temporary adverse shock since the main banks support the troubled firms
financially.11 We can give direct empirical evidence to support this line of argument.
Figure 4 shows the dynamic response of employment to a temporary fall of sales by 10
percent for small and large firm groups in electrical machinery and real estate
industries.12 It is clear from the figure that the adjustment is much smoother and slower

13
for large firm groups.
Second, disciplinary role of debt might be more potent for small firms since the
managers of small firms on the verge of bankruptcy feel threatened by the cut of bank
loans and/or are easily fired by their parent firms. Therefore the managers of small firms
have good reasons for making every effort to reduce employment to improve efficiency
of production. Third, small firms are more bank-dependent, so that lending attitude of
banks has much stronger effect on employment.
Robustness of Our Findings
Now we examine in two different ways the robustness of our findings that
financial distress has an adverse effect on employment. First we re-estimate the
employment equation by respecifying the short-run equilibrium employment level. In
general the employment level maximizing the short-run profit is expressed as a function
of real wage rate and capital stock at the beginning of period ( tK ). In other words, it is
written in a logarithmic form as
t
tt pwKN
++= logloglog 210* γγγ (6)
We assume that the capital stock has the following stochastic structure.
KttKKt KaaK ε++= −110 loglog (7)
Then we obtain the following employment equation to be estimated.13
Ntttttt
tttttt
ttttt
LENDDEBTKpw
pw
LENDNDEBTNLENDNDEBTNNNN
εβββββ
βββββββ
++++
+
+
×+×+×+×+++=
−
−−−−−−
−−−−
111091
87
226225114
11322110
logloglog
logloglogloglogloglog
(8)
14
Capital stock is defined as the tangible fixed asset excluding land divided by the
investment goods deflator in the year when the capital stock was installed. The
installation year of the capital stock is identified by the information of the average years
elapsed since installation, which is taken from the 1998 White Paper on the Japanese
Economy. Table 7 shows the estimation results of eq.(8). The results are essentially
unaltered. The debt-asset ratio exerts a negative effect on employment for small firms in
both manufacturing and non-manufacturing industries. For manufacturing industries the
debt-asset ratio affects employment in the course of adjusting employment toward
equilibrium, while it has a direct effect on the current level of employment for
non-manufacturing industries. Lending attitude of financial institutions exerts a positive
effect on employment irrespective of firm size and industry. Lending attitude affects the
current level of employment for small firms in both manufacturing and
non-manufacturing industries.14 On the other hand, lending attitude has a positive effect
on employment through altering the adjustment process for large firms in manufacturing
as well as non-manufacturing industries.
Secondly we employ an alternative measure of financial leverage of firms. We
define a flow version of firms’ leverage ( tDEBTF ) as the interest and discount paid
divided by the sum of operating profit and depreciation allowances. Note that this
variable is inversely related to the interest coverage ratio. Estimation results with new
leverage variable instead of the stock leverage variable are shown in Table 8. The
impact of lending attitude on employment remains positive for all firm groups in
manufacturing as well as non-manufacturing industries, but it is only for small firm
group in manufacturing industries that firm’s leverage exerts a significantly negative
effect on employment. It appears that the flow leverage variable is a poor proxy for the
firm’s true debt structure. In fact, the correlation coefficient between the flow variable
of firm’s leverage and the stock counterpart is only 0.1534.
5.Concluding Remarks
This study examined empirically the impact of financial distress in 1990s on
employment using the panel data of Japanese firms. We confirmed that financial distress

15
had an adverse effect on employment of small firms. In a companion paper
(Ogawa(2001)), we also found that financial distress affected fixed investment of small
firms negatively. Putting these findings together, it is clear that financial distress in the
corporate sector as well as the banking sector led to a reduction of demand for
quasi-fixed inputs. It should be noted that quasi-fixed factors embody a new technology
that raises efficiency of production. To attain the sustained long-run growth, reducing
the corporate debt and wiping out the banks’ bad loans is an urgent agenda for the
Japanese economy.

16
Footnotes
1 There is a growing body of literature on this issue. See Hubbard (1998) for a survey of investment behavior under capital market imperfections. 2 See Myers(1977) and Hart(1995) for more detailed discussion on debt overhang. 3 Ogawa et al. (1996), Suzuki and Ogawa (1997) and Ogawa and Suzuki (1998) examine empirically the effects of collateralizable net worth or land on corporate investment. As for the effects of the bank’s balance sheet conditions on corporate investment, Gibson(1995 and 1997) and Kang and Stulz(2000) conduct direct tests of the impact of bank health on investment activities. The former studies found that the impact of bank health on investment was small; while the latter found that more bank-dependent firms invested less in early 1990s. Motonishi and Yoshikawa (1999) and Ogawa and Kitasaka (2000) show that bank lending exerts a significant effect on investment. Using the Bank of Japan diffusion index of ‘banks’ willingness to lend,’ Motonishi and Yoshikawa obtain the evidence that bank lending is a significant determinant of business investment of small firms, but not large firms. Ogawa and Kitasaka also show that expenditures on fixed investment are sensitively affected by bank loans for small firms that do not have close substitutes of bank loans. Based upon the firm-level data, Ogawa(2001) found that the ratio of debt to total assets exerted a negative effect on fixed investment for small firms and that lending attitude of financial institutions affected fixed investment, irrespective of firm size. 4 Lange et al.(1996) and Nickell and Nicolitsas(1999) find a negative relation between leverage and employment for the U.S. and U.K., respectively. Cantor(1990) and Sharpe(1994) find that employment growth at highly leveraged firms is more sensitive to demand and financial market conditions for the U.S. For Japan, as far as the author knows, Tomiyama(2001) is the only study that examines empirically a relation between leverage and speed of adjusting labor, using the panel data of firms. 5 See Nickell(1986) pp.509-510 for more detailed discussions. 6 We exclude the firms in agriculture, forestry, fishery and mining industries since the data of lending attitude of financial institution are not available for these industries. We also exclude the firms in electric power and gas industries due to regulatory nature of these industries. 7 It should be noted that even if the proportion of small firms in our sample is lower than that in the original data set, it is much higher than the other studies. For example, the proportion of firms with employees less than 100 is only 1 % in Tomiyama(2001). 8 The one-standard-error increase in the employment equation residual corresponds to 0.0841, 0.0896, 0.1859, and 0.1375 for small and large firms in manufacturing

17
industries and small and large firms in non-manufacturing industries, respectively. 9 The severe lending attitude is represented by the cross terms of lagged lending attitude in 1998 and 1997 with lagged employment, while the accommodative lending attitude is represented by the cross terms of lagged lending attitude in 1996 and 1995 with lagged employment. 10 Gertler and Gilchrist (1993) emphasize that asymmetric information problems are more severe for small firms than for large firms. See Berger and Udell (1998) for a comprehensive survey of small business finance. 11 Abe(1999). Tomiyama(2001) and Urasaka and Noda(2001) examine empirically whether employment fluctuations are mitigated for the firms with strong ties with main banks. Their findings are generally in the affirmative. 12 In computing the dynamic response of employment, we use the lagged lending attitude and industry-median debt-asset ratios in 1998 and 1997. 13 This equation corresponds to the basic employment specification adopted by Nickell and Nicolitsas(1999). 14 Note that in the previous specification lending attitude affects employment via adjustment process for small firm group in manufacturing industries.

Table 1 Number of Firms in Our Sample
Number of firms
ManufacturingFood and beverages 142Textiles 41Wearing apparels and clothing accessaries 8Wood and wooden products 8Pulp, paper and paper products 27Publishing and printing 19Chemicals 241Petroleum and coal products 25Non-metallic mineral products 53Iron and steel 59Non-ferrous metals 61Fabricated metal products 76Machinery 165Electrical machinery, equipment and supplies 245Transport equipment 116Precision instruments 44Shipbuilding and repairs 20Other manufacturings 113
Non-manufacturingConstruction 212Wholesale trade 315Retail trade 244Real estate 168Land transportation 108Marine transportation 45Other transportation and communications 124Services for business activities 115Hotels and lodging 64Personal service activities 10Movies and entertainments 52Broadcasting 70Other services 54
Total 3044Data source: Ministry of Finance, Annual Report of Financial Statements of Incorporated Business

Table 2 Descriptive Statistics of Major Variable in Our Sample
Sample meansManufacturing Non-manufacturing
Real value-added 27027.3 20019.5(7158.2) (5207.8)
Number of employees 1678 1340(610) (402)
Real wage rate 7.4 6.4(6.9) (5.2)
Ratio of debt to total assets 0.2876 0.3705(0.2581) (0.3124)
Notes: Real value-added and real wage rate are obtained by dividingthe corresponding nominal figures by the industry valu-added deflator(1990=1.0) (Unit: million yen). The wage rate is per annum.The figures in parentheses are sample medians.

Table 3 Estimation Results of Dynamic Labor Demand (1):Basic Case
Lagged dependent variable Debt-asset ratio Lending attitude ofOne-period lagged Two-period lagged One-period lagged Two-period lagged One-period lagged Two-period lagged financial institutions
x debt-asset ratio x debt-asset ratio x lending attitude x lending attitudeManufacturing Small firms 0.1178 0.1252 -0.0150 -0.0135 0.0182 -0.0116 -0.0039 0.0690
(1.54) (4.57) (-2.48) (-2.49) (2.13) (-1.25) (-0.10) (1.19)Large firms 0.4229 0.0579 -0.0087 -0.0057 -0.0027 0.0158 0.0366 -0.0098
(5.83) (1.48) (-1.49) (-0.97) (-0.64) (2.79) (0.23) (-0.24)
Non-manufacturingSmall firms -0.0313 0.1668 0.0003 -0.0082 0.0009 0.0079 -0.6801 0.0518
(-0.24) (2.36) (0.02) (-0.77) (0.23) (0.89) (-5.37) (3.66)Large firms 0.3990 0.0438 -0.0040 -0.0004 0.0033 -0.0009 -0.0040 0.0058
(6.33) (1.05) (-0.51) (-0.06) (2.11) (-0.20) (-0.08) (0.34)
Real wage rate Real value-added J-statisticsCurrent One-period lagged p-value
Manufacturing Small firms -0.3829 0.0064 0.2990 30.2561
(-4.97) (0.19) (4.40) (0.78)Large firms -0.2052 0.1271 0.0934 48.3142
(-2.55) (2.09) (1.83) (0.10)
Non-manufacturingSmall firms -0.0557 -0.0801 0.2604 32.9297
(-1.90) (-1.35) (2.70) (0.66)Large firms -0.3190 0.0049 0.1753 29.9524
(-3.21) (0.11) (2.76) (0.79)Notes: The figures in parentheses are the ratio of coefficient estimate to its standard error.

Table 4
Change in Current Employment by an Increase of Debt-asset Ratio from the 1st to the 3rd Quartile in 1998
(%)Small firms Large firms
ManufacturingChemicals -1.28 1.09Machinery -1.65 0.95Electrical machinery -1.89 1.10Transport equipment -1.12 0.90
Non-manufacturingConstruction -18.53 -0.13Wholesale trade -19.70 -0.13Retail trade -24.85 -0.15Real Estate -36.55 -0.22
Table 5
Change in Current Employment When Lending Attitude Changes from 1996 to 1998
(%)Small firms Large firms
ManufacturingChemicals -2.62 0.48Machinery -2.06 0.49Electrical machinery -2.20 0.35Transport equipment -2.16 0.58
Non-manufacturingConstruction -1.76 -0.35Wholesale trade -1.78 -0.39Retail trade -1.27 -0.31Real Estate -2.56 -0.41

Table 6
Average Length of Service of Employees
(year)Number of Employees
10-99 100-999 1000-
Manufacturing 10.9 12.9 17.0Construction 10.1 12.4 16.4Wholesale trade 9.8 10.9 13.2 and retail tradeReal estate 7.4 8.9 10.1
Data Source: Basic Survey on Wage Structure 1998, Ministry of Labour

Table 7 Estimation Results of Dynamic Labor Demand (2):Alternative Specification of Short-run Equilibrium Employment
Lagged dependent variable Debt-asset ratio Lending attitude ofOne-period lagged Two-period lagged One-period lagged Two-period lagged One-period lagged Two-period lagged financial institutions
x debt-asset ratio x debt-asset ratio x lending attitude x lending attitudeManufacturing Small firms 0.2214 0.0459 -0.0188 -0.0149 0.0148 0.0063 -0.0440 0.1109
(2.51) (0.90) (-2.97) (-1.90) (1.34) (0.55) (-0.87) (1.81)Large firms 0.2469 0.0344 -0.0115 -0.0002 0.0029 0.0098 -0.0858 -0.0248
(4.08) (0.91) (-2.08) (-0.04) (0.77) (1.81) (-0.61) (-0.65)
Non-manufacturingSmall firms 0.1535 0.2352 0.0028 -0.0133 0.0003 0.0060 -0.5076 0.0336
(1.27) (3.11) (0.26) (-1.24) (0.08) (0.69) (-4.35) (1.96)Large firms 0.2992 0.1795 -0.0103 0.0004 0.0034 -0.0034 0.0210 0.0061
(4.41) (2.89) (-0.99) (0.06) (2.19) (-0.71) (0.49) (0.34)
Real wage rate Capital stock J-statisticsCurrent One-period lagged p-value
Manufacturing Small firms -0.2599 0.0493 -0.0589 48.2933
(-3.96) (1.35) (-1.41) (0.15)Large firms -0.1246 0.0521 0.1729 42.4706
(-2.15) (0.96) (2.71) (0.32)
Non-manufacturingSmall firms -0.0986 -0.0455 0.0460 30.0471
(-1.60) (-0.84) (1.05) (0.85)Large firms -0.1411 -0.0886 0.0494 37.1049
(-1.26) (-1.85) (1.39) (0.56)Notes: The figures in parentheses are the ratio of coefficient estimate to its standard error.

Table 8 Estimation Results of Dynamic Labor Demand (3):Flow measure of leverage ratio
Lagged dependent variable Interest and discounts Lending attitude ofOne-period lagged Two-period lagged One-period lagged Two-period lagged One-period lagged Two-period lagged paid/ operating profits financial institutions
x debt-asset ratio x debt-asset ratio x lending attitude x lending attitude plus depreciationManufacturing Small firms 0.1397 0.0959 0.0287 -0.0190 0.0191 -0.0030 0.1686 0.0511
(2.00) (3.75) (1.26) (-1.78) (2.13) (-0.33) (0.75) (0.90)Large firms 0.4225 0.0273 0.0487 0.0013 -0.0022 0.0192 -0.4135 -0.0331
(4.69) (0.67) (2.52) (0.17) (-0.48) (2.88) (-1.39) (-0.78)
Non-manufacturingSmall firms 0.3146 0.1383 0.0411 -0.0067 0.0079 0.0148 0.3644 0.0199
(2.77) (1.78) (1.14) (-0.49) (1.70) (1.23) (1.27) (1.03)Large firms 0.4196 0.0543 0.0056 0.0053 0.0048 0.0033 0.7015 0.0161
(5.97) (1.10) (0.28) (0.70) (2.42) (0.66) (2.46) (0.81)
Real wage rate Capital stock J-statisticsCurrent One-period lagged p-value
Manufacturing Small firms -0.3863 0.0094 0.3101 35.4400
(-4.71) (0.28) (4.40) (0.45)Large firms -0.0767 0.1114 0.0244 36.4920
(-0.86) (1.79) (0.45) (0.40)
Non-manufacturingSmall firms -0.1508 -0.0218 0.4071 28.5001
(-1.90) (-0.37) (3.45) (0.77)Large firms -0.3930 0.0291 0.2023 30.7458
(-3.76) (0.50) (2.98) (0.67)Notes: The figures in parentheses are the ratio of coefficient estimate to its standard error.

Figure 1 Histogram of Equity Capital in 1993
0
100
200
300
400
500
600
700
0-0.5 0.5-1 1-2 2-4 4-6 6-8 8-10 10-14 14-18 18-25 25-50 50-100 100-
Equity capital (billion yen)
Freq
uenc
y
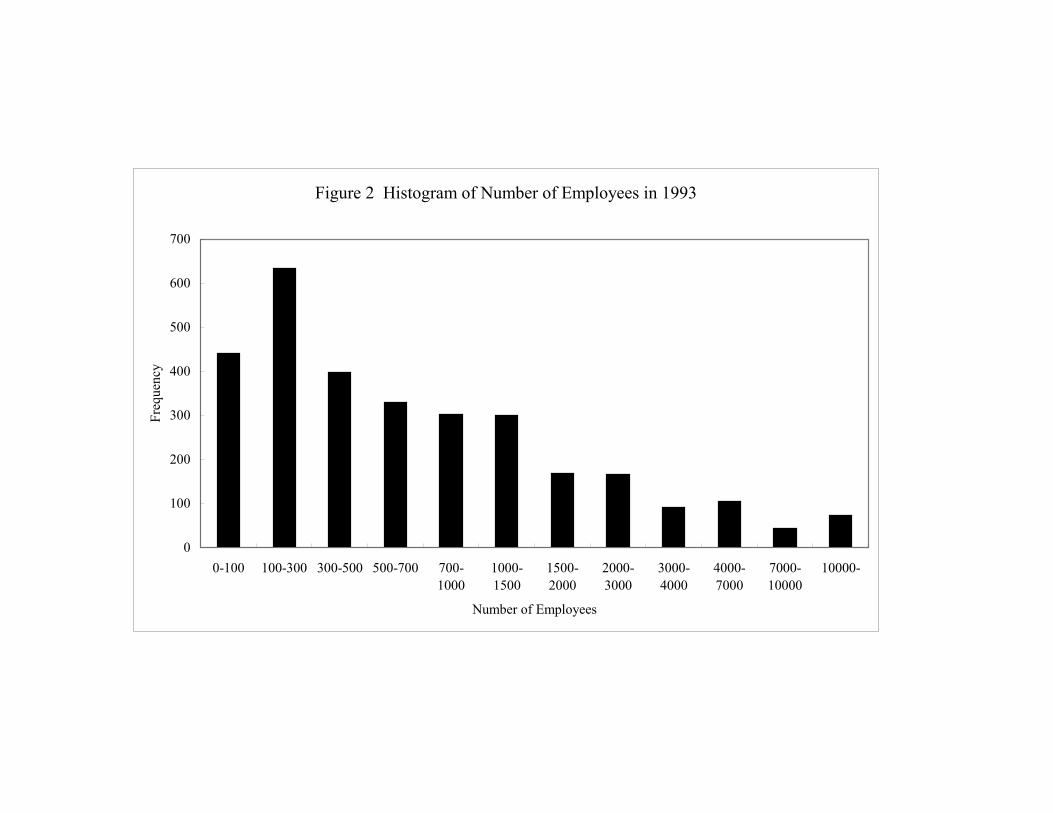
Figure 2 Histogram of Number of Employees in 1993
0
100
200
300
400
500
600
700
0-100 100-300 300-500 500-700 700-1000
1000-1500
1500-2000
2000-3000
3000-4000
4000-7000
7000-10000
10000-
Number of Employees
Freq
uenc
y
Source: Bank of Japan: Short-term Economic Survey of Enterprises (Tankan)
Figure 3 Diffusion Index: Lending Attitude of Financial Institutions
-30
-20
-10
0
10
20
30
40
Jun-93
Sep-93
Dec-93
Mar-94
Jun-94
Sep-94
Dec-94
Mar-95
Jun-95
Sep-95
Dec-95
Mar-96
Jun-96
Sep-96
Dec-96
Mar-97
Jun-97
Sep-97
Dec-97
Mar-98
Jun-98
Sep-98
Dec-98
Mar-99
%
Small firms Medium firms Large firms

Figure 4-1 Adjustment Process of Employment to Sales Shock: Electrical Industry
-3
-2.5
-2
-1.5
-1
-0.5
0
0.5
0 1 2 3 4 5
%
Small firms Large firms
Figure 4-2 Adjustment Process of Employment to Sales Shock: Real Estate Industry
-3
-2.5
-2
-1.5
-1
-0.5
0
0.5
0 1 2 3 4 5
%
Small firms Large firms

18
References
[1] Abe, M.(1999).” Kigyo Gabanansu Kozo to Koyo Sakugen Ishi Kettei: Kigyo Zaimu
Deta wo Riyosita Jissho Bunseki (Corporate Governance Structure and Decision Making
on Employment Cut: An Empirical Analysis Using the Firm-level Data),” In Nakamura, J.,
Nakamura,M.(eds.) Nippon Keizai no Kozo Chosei to Rodo Shijyo (Structural Adjustment
of the Japanese Economy and Labor Market), (Nippon Hyoron Sha,Tokyo), pp.75-102.
[2] Arellano, M. and S. Bond(1991).” Some Tests of Specification for Panel Data: Monte
Carlo Evidence and an Application to Employment Equations,” Review of Economic
Studies Vol.58, pp.277-297.
[3] Aoki, M.(1994).” The Contingent Governance of Teams: Analysis of Institutional
Complementarity,” International Economic Review Vol.35, No.3, pp.657-676.
[4] Berger, A.N. and G..F. Udell(1998).”The Economics of Small Business Finance: The
Roles of Private Equity and Debt Markets in the Financial Growth Cycle,” Journal of
Banking and Finance Vol.22, pp.613-673.
[5] Calomiris, C.W., Orphanides, A., and S.A. Sharpe(1997).” Leverage as a State Variable
for Employment, Inventory Accumulation, and Fixed Investment,” In Capie,F., Wood,G.E.,
(eds.) Asset Prices and the Real Economy (St. Martin’s Press: New York), pp.169-193.
[6] Cantor, R.(1990).” Effects of Leverage on Corporate Investment and Hiring Decisions,”
Federal Reserve Bank of New York Quarterly Review Vol.15, pp.31-41.
[7] Gertler, M. and S. Gilchrist(1993).” The Role of Credit Market Imperfections in the

19
Monetary Transmission Mechanism: Arguments and Evidence,” Scandinavian Journal of
Economics 95, pp. 43-64.
[8] Gibson,M.S.(1995).” Can Bank Health Affect Investment? Evidence from Japan,”
Journal of Business, Vol. 68, pp.281-308.
[9] Gibson,M.S.(1997).” More Evidence on the Link between Bank Health and Investment
in Japan,” Journal of the Japanese and International Economies 11, pp.296-310.
[10] Hart, O.(1995). Firms, Contracts and Financial Structure, Oxford Clarendon Press.
[11] Hubbard, R.G.(1998).”Capital-Market Imperfections and Investment,” Journal of
Economic Literature Vol.36, pp.193-225.
[12] Kang, J.K. and R.S. Stulz(2000).” Do banking Shocks Affect Borrowing Firm
Performance? An Analysis of the Japanese Experience,” Journal of Business Vol.73,
pp.1-23. .
[13] Lang, L., Ofek,E. and R.M.Stulz(1996).” Leverage, Investment, and Firm Growth,”
Journal of Financial Economics Vol.40, pp.3-29.
[14] Motonishi, T. and H. Yoshikawa(1999).” Causes of the Long Stagnation of Japan
during the 1990’s: Financial or Real?” Journal of the Japanese and International
Economies 13, pp.181-200.
[15] Myers, S.C.(1977).” Determinants of Corporate Borrowing,” Journal of Financial
Economics 5, pp.147-175.

20
[16] Nickell, S.(1986).” Dynamic Models of Labour Demand,” In Ashenfelter, O., Layard,
R.,(eds.) Handbook of Labor Economics, Vol.1 (Elsevier Science Publishers), pp.473-522.
[17] Nickell, S. and D. Nicolitsas(1999).” How Does Financial Pressure Affect Firms?”
European Economic Review Vol. 43, pp.1435-1456.
[18] Ogawa,K.(2001).” Financial Distress and Corporate Investment: The Japanese Case in
the 90s,” mimeographed.
[19] Ogawa, K.,Kitasaka, S.,Yamaoka, H. and Y. Iwata(1996).” Borrowing Constraints and
the Role of Land Asset in Japanese Corporate Investment Decision,” Journal of the
Japanese and International Economies 10, pp.122-149.
[20] Ogawa, K. and K. Suzuki(1998).” Land Value and Corporate Investment: Evidence
from Japanese Panel Data,” Journal of the Japanese and International Economies 12,
pp.232-249.
[21] Ogawa, K. and S. Kitasaka(2000).” Bank Lending in Japan: Its Determinants and
Macroeconomic Implications,” in Hoshi, T. and H. P. Patrick (eds.), Crisis and Change in
the Japanese Financial System (Kluwer Academic Publishers), pp.159-199.
[22] Sharpe,S.A.(1994).” Financial Market Imperfections, Firm Leverage, and the
Cyclicality of Employment,” American Economic Review Vol.84, No.4, pp.1060-1074.
[23] Suzuki, K. and K. Ogawa(1997).” Tochi Kakaku no Hendo to Setsubi Toshi – Nippon
no Seizougyou ni kansuru Paneru Deta niyoru Bunseki – (Fluctuation in Land Prices and

21
Capital Investment – Evidence from Panel data of Japanese Manufacturing Firms -),” The
Economic Review (The Institute of Economic Research, Hitotsubashi University), Vol.48,
pp.218-226.
[24] Tomiyama,M.(2001).” Mein Banku Sei to Kigyo no Koyo Chosei (The Main Bank
System and Employment Adjustment in Firms),” The Japanese Journal of Labour Studies
Vol.43, No.2・3, pp.40-51.
[25] Urasaka, J. and T. Noda(2001).” Kigyo Tochi to Koyo Chosei – Kigyo Paneru Deta ni
Motozuku Jissho Bunseki- (The Effect of Corporate Governance on Employment
Adjustment in Japanese Manufacturing Firms),” The Japanese Journal of Labour Studies
Vol.43, No.2・3, pp.52-63.