Tropical Andes EcoSystem - Vilcabamba-Amboró Conservation Corridor

JNCC Report No. 492
Nature conservation and ecosystem service delivery
Eastwood, A., Nijnik, M., Brooker, R., Pakeman, R., Artz, R., Norton, L., Ross, L., Bullock, J.M., Vellinga, N., Albon, S., Fielding, D., Irvine, R.J.,
Ramsay, S. & Cooksley, S.
September 2013
© JNCC, Peterborough 2013
ISSN 0963 8901

Nature conservation and ecosystem service delivery
For further information please contact: Antonia Eastwood James Hutton Institute [email protected] Diana Mortimer or Matt Smith Joint Nature Conservation Committee Monkstone House City Road Peterborough PE1 1JY [email protected] [email protected] www.jncc.defra.gov.uk This report should be cited as: Eastwood, A., Nijnik, M., Brooker, R., Pakeman, R., Artz, R., Norton, L., Ross, L., Bullock, J., Vellinga, N., Albon, S., Fielding, D., Irvine, R.J., Ramsay, S. & Cooksley, S. (2013) Nature conservation and ecosystem service delivery. JNCC Report No. 492 Acknowledgements: The project team would like to thank all the stakeholders that contributed their invaluable knowledge and expertise and assisted with the case-study assessments. In particular we would like to acknowledge, Jeremy Roberts (RSPB Abernethy), Will Anderson (Seafield Estate) and Desmond Dugan (RSPB Abernethy). JNCC would like to acknowledge Linda Birkin, Chris Cheffings, Deanna Donovan, Diana Mortimer and Matt Smith who contributed to the development of the research questions and to production of this report.

Nature conservation and ecosystem service delivery
Summary The types of ecosystem service (ES) delivered by protected areas and sites managed for conservation and biodiversity Conservation actions include both the designation of sites and the management of sites to improve their conservation status. Although many studies have explored the impact of these actions on conservation outcomes, far fewer have explored their impact on ES delivery. Correlational assessments show relationships between designation and the delivery of a limited number of services, for example carbon storage, and one of the major impacts of designation may be in preventing changes in land use and hence in ES delivery. However, such relationships can be dependent on a number of factors, including the scale of assessment (local, regional, national and global). In addition the location of the designated site can influence the delivery of some services, in particular cultural services whose delivery may decrease with increasing distance from areas of high population density. Studies of changes in management within land use types show subtler impacts on ES delivery, and some types of ES such as pollination services may be more sensitive to such influences. Whether conservation management within land use types has a beneficial or negative impact on ES delivery depends on the particular management action and the service being delivered. Although it is clear that a very wide range of ES are delivered by protected areas or areas managed for nature conservation, and broad statements are made about patterns of association, or congruence, between protected areas or biodiversity management actions and ES delivery, it is much harder to be certain about whether these relationships are causal. To plug this gap in our understanding, we need data for a wider range of ES, at finer spatial resolution, which include time series assessments of management or designation impacts. The representation of ES derived from nature conservation in current typologies The use of fundamental ecological principles in the main rival typologies, and in general their evolution from the common starting point of the framework used in the Millennium Ecosystem Assessment ensures some degree of basic underlying agreement and commonality in the representation of ecosystem services derived from nature conservation. But differences do exist between typologies, including: the location of ‘Habitat Services’, which has been considered as either one of the broad categories of ES or as an underlying ecological process; the distinction (or not) of final ecosystem services to avoid double counting; the treatment of cultural services. The last of these is perhaps the most difficult to grapple with, yet at the same time is critical to the factors that drive conservation. The main typologies acknowledge the importance of cultural services within an ES framework to inform decision-making, but fail to fully characterise and integrate the full complexity of socio-ecological interactions. This is because cultural services (non-use values) are difficult to quantify in biophysical or monetary terms, providing challenges to their effective integration into current ES frameworks. As many of the additional benefits arising from nature conservation and designated areas fall with the non-material/cultural services category, and hence do not fit well into the above ES framework, there is a very substantial risk that they will not be adequately incorporated into decision making.

Nature conservation and ecosystem service delivery
The delivery of ES from designated sites and non-designated sites: the case studies This chapter explored the delivery of ES, and disservices and trade-offs from designated and non-designated sites. It did this by examining the differences in ES delivery between comparative sites, either spatially or temporally, in nine different case-studies using an ecosystem services assessment framework. The assessments were conducted using expert judgement from one or two assessors. The case-studies covered a range of broad habitat types (e.g. Scots pine woodland, chalk grassland, rivers and montane habitats) and levels of designation from agri-environment schemes to National Nature Reserves (NNR). The key findings from the assessments were: • Designated sites tended to deliver more in terms of cultural and regulating services than
non-designated sites. However, this was not always the case and related to the spatial and temporal context of the site and the associated conservation effort. For example, in some cases there were no differences between designated sites and non-designated sites or the differences were marginal.
• Surprisingly, across all the nine case-studies, designation did not have a negative
impact on provisioning services (an often cited trade-off). This may be a reflection of the case-studies themselves or the fact the designated areas and the comparative sites were in marginal areas for production. The notable exception is the Parsonage Down case-study.
• It is likely that improving the condition of notified habitats (from unfavourable to
favourable) would lead to enhanced regulating services such as water quality, soil quality, pollination and carbon sequestration.
• Condition monitoring would not be an appropriate method to monitor the ES delivery
from designated sites as it does not factor in the beneficiaries (people) of those services.
• In some cases, the confidence in the evidence used by the assessors was low. This
was primarily due to the lack of monitoring data (most importantly time series data) for some ecosystem services and for some case-studies.
Valuing the ecosystem services delivered by nature conservation • Economic valuation helps in informing policy and management decisions regarding
resource management and use, e.g. in determining whether the payments for ecosystem services (PES) scheme is worth implementing to aim for nature conservation. Valuation provides estimates of how ES contribute to the generation of income and wellbeing. It also guides the decision-making on the prevention of damages that inflict costs on society. When it is used in combination with cost estimates and is linked to the demand for ES, valuation can help to resolve potentially conflicting decisions, e.g. such as whether or not to replant an area of woodland, or whether or not to restore a peatland area.
• Valuation concerns total economic values (e.g. of a designated site) as well as marginal
changes in values (important to know for changes in site designation). Reliable economic valuation depends on the robustness of the methods, their appropriateness and how well we can quantify the relationship between ES provision and human well-being.

Nature conservation and ecosystem service delivery
• Valuation is case specific, context sensitive and contingent to a particular social context. Values vary between individuals and groups. They can also change temporally and spatially. Valuation, however, is carried out using the knowledge of the day, which, by itself, is usually incomplete.
• The complexity of ES and their spatial arrangements pose problems. Insufficient
understanding of ecological processes, human-environmental relationships and various uncertainties often lead to the unreliability of valuation.
• Largely due to complexity and numerous uncertainties about the future, potential use
values of ES (i.e. option values) are not easy to assess. Ecosystems are being judged on what they are now rather than on their potential to become. Therefore, option values (and those of existence and bequests) are not fully incorporated in ES valuation, but consideration should be given to their inclusion.
• When markets are explicit, as in the UK, they function well for the provisioning ES, and
direct economic valuation, based on prices, is largely applicable. Even in the case of public goods, the user values can still be marketed and valued (but indirectly, e.g. by using contingent valuation methods (CVM) or travel cost (TC) methods).
• Economic valuation is particularly difficult to apply in the field of biodiversity or
landscapes, both as a result of their uniqueness and distinctiveness, and because of a shortage of robust primary valuations and numerous uncertainties.
• However, as non-market benefits are the most important output of much of the
designated areas, it is a high priority for policy makers to obtain more accurate estimates of these benefits. More research from economic and social scientists is needed, for example, by combining socio-economic valuation techniques, both qualitative (e.g. participatory) and quantitative.
• In addition to use values, biodiversity has its non-use values. They comprise of intrinsic
values, the economic valuation of which is unlikely to be possible. Thus, while market instruments can provide effective tools in some cases, they do not work everywhere. The concept of the safe minimum standard and ‘precautionary principle’ should be considered for designated sites containing endangered species of high intrinsic values.
• The use of valuation techniques should be incorporated wider in decision-making
processes. When nature conservation issues are concerned, much will depend upon government intervention and incentives (both economic and non-economic, e.g. PES) to change behaviours of end-users for the protection of natural environment.
• The value of designation should include relevant stakeholders and incorporate their
perspectives and values. Techniques such as group valuation and in particular, deliberative discourse methods, can assist in valuing public goods and ecosystem services as they provide a more complete and socially just assessment of the benefits to humans.
• There is currently very little guidance on communicating the value of designation and
the ecosystem services they deliver, although a number of web-sites do provide advice on communicating complex scientific concepts in non- technical language.

Nature conservation and ecosystem service delivery
Project specification (as per contract tender)
Background This project will assess how nature conservation management affects ecosystem service (ES) delivery. The UK National Ecosystem Assessment (NEA)1 published in June 2011 was the first independent assessment of the state and trends in the UK’s ecosystems and the benefits they provide to society and the economy. The NEA provides a substantial evidence base of the services that nature provides (ecosystem services - ES), how these have changed over the past decades, prospects for the future and the benefits of these to society. A key finding from the NEA was that the links between biodiversity and ecosystem services were not well understood. In addition to this it is unclear how the management of areas for nature conservation affects the delivery of ecosystem services. Nature conservation takes place both within designated areas and in the wider environment. The aim of this project is to understand the ecosystem service delivery trade-offs that occur from different management choices and how management / designation affects the value of the services delivered. Project objectives The project will consider both designated sites and the wider environment (i.e. areas outside designated sites). The project will draw on existing projects and analyses to provide a range of case studies that illustrate how ES delivery (e.g. the type of ES delivered and where appropriate quantity and quality) is affected by nature conservation management. By doing this is will be possible to determine how ES delivery changes according to the management undertaken, and the different beneficiaries and trade-offs that occur. The specific project objectives are detail below. Objective One - Introduction to the project The contractor is asked to provide the following information to introduce the topic and ensure all important background information is brought together. • Provide a review of work that has considered
o What are the types of ES delivered from protected areas / wider countryside
managed for nature conservation and biodiversity (including ES that are related to the designation/management – broad analysis not detailed) and how do these differ from what would have been delivered if the area was not designated / managed for nature conservation?
o How have ES derived from biodiversity / related to nature conservation been categorised i.e. drawing on NEA, TEEB2 and CICES3 typologies? What are the limitations and problems associated with these categorisations for biodiversity / nature conservation?
1 http://uknea.unep-wcmc.org/ 2 http://www.teebweb.org/ 3 Currently under development by Nottingham University see http://cices.eu/

Nature conservation and ecosystem service delivery
Objective Two Using existing projects / case studies provide examples of the following4. • When land is managed for nature conservation some intermediate and final services
such as cultural services or wild species are expected to increase. How are other services affected and what impact does this have on the potential beneficiaries of these services? For example what ES could be delivered from an area if it was not managed for nature conservation? It is important to consider the transitions between low to medium and medium to high biodiversity condition of the area. For example how ES delivery changes according to management effort – this is very relevant to off-setting for example).
• How does habitat condition affect ES delivery? For example what differences would you expect to see in ES delivery from designated areas which are in favourable or unfavourable condition? This analysis also needs to consider different levels of nature conservation management on different types of land. Examples might include for instance entry level scheme on arable land, management of a Site of Special Scientific Interest (SSSI) for a particular species and restoration of a coastal wetland.
• Can condition monitoring of protected areas (e.g. under the Habitats Directive) be used to determine the ES delivered?
Objective Three This section will discuss the ways to value ecosystem services that are related to nature conservation management. • What are the different ways to value (monetary and non-monetary) the ecosystem
services delivered as a result of nature conservation management (from areas of low level management e.g. outside protected areas, to high level management on Special Areas of Conservation (SACs)? This should include an analysis of when different valuation methods are appropriate and under what scenarios they are most useful to decision making. It should also include examples of when valuation is inappropriate and why that is the case.
• What is the value of designation? For example, just because an area is designated does
this mean it has been ascribed a value? How can this best be expressed and communicated; and do different audiences require different approaches?
4 Where none exist to illustrate the points that need to be made the contractor should propose what additional case studies are required and what they would be expected to show.

Nature conservation and ecosystem service delivery
Contents 1 The types of ES delivered by protected areas and sites managed for
conservation and biodiversity .................................................................................... 1
1.1 Objectives of review ....................................................................................................... 1
1.2 Scope, definitions and methodology .............................................................................. 1
1.2.1 Conservation actions ................................................................................................ 1
1.2.2 Definition of ecosystem services .............................................................................. 1
1.3 Results ........................................................................................................................... 2
1.3.1 Broad-scale comparisons across conservation designations or land use types ....... 2
1.3.2 Changes in management within habitats or land uses ............................................. 6
1.4 Discussion ................................................................................................................... 11
2 The representation of ES derived from nature conservation in current typologies ..................................................................................................................................... 13
2.1 Objectives of the review ............................................................................................... 13
2.2 Similarities of the typologies ........................................................................................ 13
2.3 Differences and limitations of different typologies ....................................................... 13
3 The delivery of ecosystem services from designated sites and non-designated: the case studies ......................................................................................................... 17
3.1 Objectives .................................................................................................................... 17
3.2 Methodology ................................................................................................................ 17
3.2.1 The case studies .................................................................................................... 17
3.2.2 The ecosystem service assessment (for conservation) framework to assess the delivery and importance of ecosystem services from designated areas ................ 20
3.3 Results ......................................................................................................................... 21
3.3.1 Balranald SSSI (SSSI, SPA, SA AND RSPB reserve) compared with adjacent non-designated coastal grasslands (North Uist) ............................................................ 21
3.3.2 Sletill Peatlands SSSI compared with adjacent ex-forestry plantation ................... 22
3.3.3 Rora Moss SSSI compared with nearby Middlemuir Moss..................................... 24
3.3.4 Beinn Eighe (NNR, SSSI SAC AND NSA) compared with surrounding upland areas ................................................................................................................................ 25
3.3.5 Abernethy Forest (NNR, SAC and SSSI) before and after (1975 onwards) acquisition and management by RSPB .................................................................. 26
3.3.6 Parsonage Down (NNR) compared with adjacent improved grasslands ................ 28
3.3.7 Drumochter Hills (SAC) compared with Dalnacardoch (non-designated area) ...... 29

Nature conservation and ecosystem service delivery
3.3.8 Loweswater catchemtn (Lake District National Park) a comparison of land before and after agri-environment schemes ...................................................................... 30
3.3.9 The River Dee (SAC) compared with the River Don .............................................. 31
3.3.10 A combined analysis across all case studies ...................................................... 33
3.4 Discussion ................................................................................................................... 38
3.4.1 The delivery of ecosystem services from land that is not managed for nature conservation ........................................................................................................... 38
3.4.2 The effects of designation and conservation management on ecosystem service delivery ................................................................................................................... 39
3.4.3 Economic valuation of marine ecosystem services ................................................ 40
3.4.4 Can condition monitoring of designated sites be used to determine ES delivery? . 41
3.4.5 Evidence and assumptions made to conduct the assessments ............................. 42
4 Valuing the ecosystem services delivered by nature conservation ..................... 43
4.1 Valuation methods ....................................................................................................... 43
4.1.1 Rationale of ecosystem service valuation .............................................................. 43
4.1.2 Types of value estimates ........................................................................................ 43
4.1.3 The concept of total economic value ...................................................................... 44
4.1.4 Economic valuation techniques .............................................................................. 44
4.1.5 Wider social science approaches ........................................................................... 49
4.1.6 Combining valuation approaches ........................................................................... 50
4.2 The use of valuation in nature conservation ................................................................ 51
4.2.1 Opportunities, challenges and complexities ........................................................... 51
4.2.2 Selected examples of valuation methods ............................................................... 55
4.2.3 To value or not value .............................................................................................. 56
4.3 The value of designation: stakeholders and scales ..................................................... 57
4.3.1 The various stakeholders and the value of designation ......................................... 58
4.3.2 The influence of different scales on the value of designation ................................. 59
4.3.3 How to communicate the value of designation to stakeholders .............................. 60
5 List of common acronyms ........................................................................................ 62
6 References .................................................................................................................. 64
7 Appendices ................................................................................................................. 72
7.1 Case study 1-9: Ecosystem service delivery matrix .................................................... 72
Nature conservation and ecosystem service delivery
List of Figures Figure 1. Key components of total economic value (adapted from Glaves et al, 2009). ..... 44
List of Tables Table 1. Provision of biodiversity and ecosystem services under three conservation strategies. ............................................................................................................................... 3
Table 2. Ecosystem services delivered by semi-natural grassland and enclosed farmland. . 5
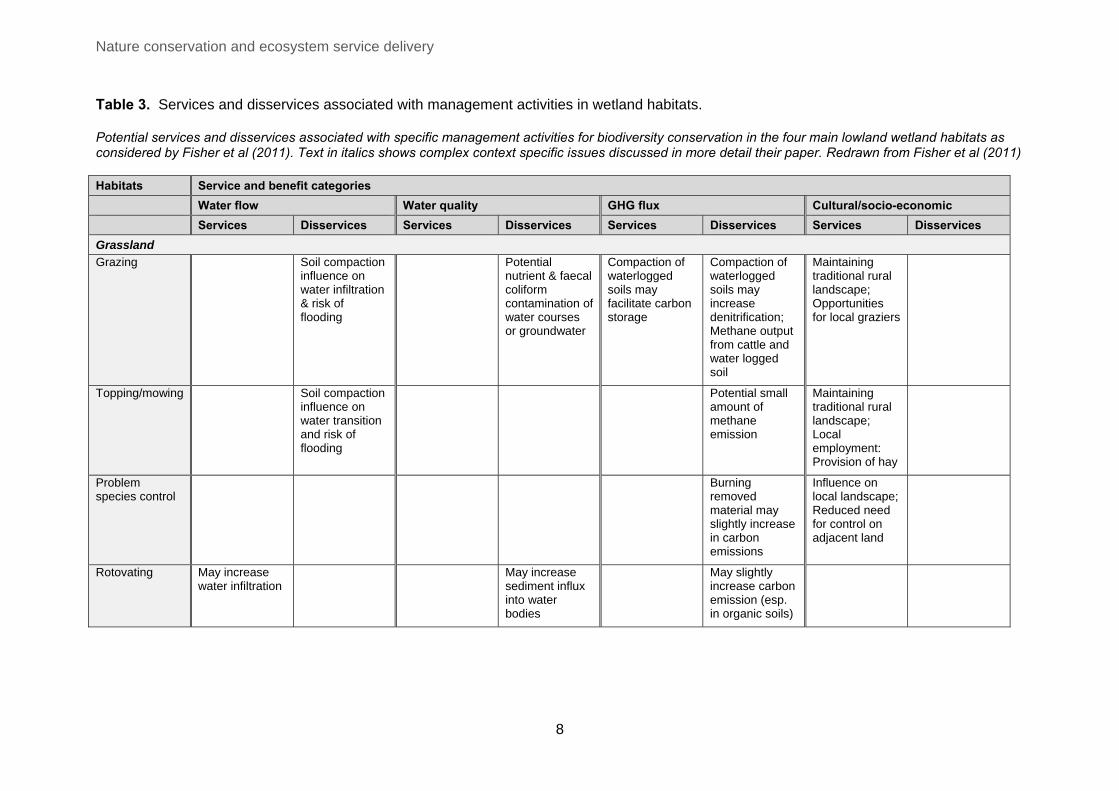
Table 3. Services and disservices associated with management activities in wetland habitats. .................................................................................................................................. 8
Table 4. A comparison between typologies; the MEA, TEEB, UK NEA and CICES. .......... 15
Table 5. A summary of the case studies. ............................................................................ 19
Table 6. Test of the differences between individual and total service delivery between designated and non-designated sites. .................................................................................. 35
Table 7. Spearman rank correlation coefficients for the difference between rankings of designated and non-designated sites. .................................................................................. 36
Table 8. The relevance of exludability and rivalness to natural resource categorisation (adapted from Farnsworth et al, 1983 and Randall, 1993). .................................................. 47
Table 9. Selected examples of valuation methods. ............................................................. 55
List of Boxes Box 1. Examples of non-exludability. .................................................................................. 46
Box 2. An example of CVM valuation. ................................................................................. 48
Box 3. Examples of ES valuation. ....................................................................................... 48
Box 4. An example of a BT study. ....................................................................................... 49
Box 5. An example of ES valuation using a combination of techniques. ............................. 50
Box 6. An example of combining analytical approaches with visualization and participatory techniques. ............................................................................................................................ 51
Box 7. Stakeholder valuation of multi-functional forestry (MFF), a Q-method application... 53

Nature conservation and ecosystem service delivery
1
1 The types of ES delivered by protected areas and sites managed for conservation and biodiversity
1.1 Objectives of review The objective of this review chapter is to consider the types of ecosystem services (ES) delivered from protected areas and the wider countryside. It includes a broad analysis of the ES that are related to designation as well as those related to conservation management activities. We try to answer this objective by addressing two questions. The first asks about the pattern of ES associated with protected areas and conservation management. The second asks whether or not these patterns are correlative or causal i.e. does conservation designation or management to improve a site or a feature’s conservation status alter the delivery of ES? In this chapter (and chapter two) we focus on the consequences of conservation management for service delivery. We do not focus on the relationships between biodiversity (in a technical sense) and ecosystem function and ultimately services.
1.2 Scope, definitions and methodology 1.2.1 Conservation actions Management action for nature conservation (i.e. the conservation of biodiversity at all levels) takes many different forms. Eigenbrod et al (2009) define three broad categories of conservation action: protected areas (for example nature reserves), restrictive zoning (for example National Parks), and incentive payments to landowners (for example agri-environment schemes). We take actions that can be covered by these broad categories as being within the remit of this review. We also consider ecological restoration projects, i.e. those aimed at “assisting the recovery of an ecosystem that has been degraded, damaged, or destroyed, typically as a result of human activities” (Rey Benayas et al, 2009), as well as activities within protected areas that are designed to enhance their conservation status, for example management actions within nature reserves. However, we do not consider actions such as the creation of urban green space. 1.2.2 Definition of ecosystem services The definition of ecosystem services for nature conservation is discussed in more detail below with respect to chapter 2. This has been a fast-moving and relatively fluid topic over the last 4-5 years. Although broad categories of ES are widely-recognised – supporting, regulating, provisioning, and cultural services – precise definitions and sub-divisions within these broad categories are still debated. Inevitably, when reviewing the literature, the exact way in which ES are defined then varies between studies. In this section, therefore, we do not try to work to a precise ES nomenclature. Instead we use the terminology applied in the original studies, with the recognition that this may not necessarily match the nomenclature that we ourselves apply later on in this report. However, we also try to be clear about what is considered an ES within the various studies. Initially, we focussed collation of literature evidence on studies from the UK, as this is most relevant to the case study analyses. However, and as discussed below, the number of relevant studies is actually very small. Therefore we broadened our literature search to encompass any studies that provided information relevant to our categories of conservation action and their impact on ES, and also considered those that explored the broader relationship between ES delivery and biodiversity conservation.

Nature conservation and ecosystem service delivery
2
We collated information for this section from three main sources: ISI Web of Knowledge, the “grey literature” (which can now be readily searched using Google, and the websites of key projects such as the UK National Ecosystem Assessment, the Valuing Nature Network, and the Ecosystem Services Partnership), and the UK NEA reports.
1.3 Results Biodiversity sits at many levels within the ES hierarchy (Mace et al, 2012), being part of the ecosystem processes and functions that deliver ES, an ES in its own right in some classifications (for example as “wild species diversity” within the UK NEA typology) and a final ‘good’ delivered by ES. However, although there are many (probably thousands) of studies assessing the impact of designation and conservation management (e.g. management within a protected area to improve its conservation status) on biodiversity, relatively there are far fewer that explicitly address the impact of conservation action on a broader range of ES. Furthermore, although the role of biodiversity in delivering ecosystem services is widely acknowledge (Cardinale et al, 2012), linking biodiversity responses to consequences for ecosystem service responses is difficult because we lack in many cases the appropriate monitoring data (Norris et al, 2011). 1.3.1 Broad-scale comparisons across conservation designations or land use
types Recent mapping studies have attempted to associate available data on proxies for ES with that for the distribution of biodiversity and conservation designations. Working at a national scale (focussing on Great Britain, and so not including Northern Ireland), Anderson et al (2009) asked whether areas high in biodiversity coincided with areas delivering a high level of ES. They considered three services – carbon storage, agricultural value and recreational use – and assessed whether these were associated with biodiversity (richness of species of conservation concern, specifically UK Biodiversity Action Plan (BAP) species). The relationships that they found were scale dependent. At a national scale, carbon storage, agricultural value and recreation were respectively negatively, positively and not associated with BAP species richness. However, when they explored the relationship at a finer resolution (i.e. within National Grid squares) they found that in many cases the regional relationship differed from the national pattern. For example, in the north-west of the UK the biodiversity-carbon relationship was also negative (with species-poor habitats being associated with high carbon storage) whereas in the south-east it was positive. Anderson et al concluded that conservation in many cases is not associated with broader ES delivery. However, this may in part be driven by their metric of biodiversity, i.e. species richness. Many species-poor habitats are also of high conservation concern, and it may be these species poor but still highly valued habitats that are associated with services such as C fixation and storage. Furthermore, it is not necessarily the case that high biodiversity levels are associated with conservation action. Eigenbrod et al (2009) addressed the relationship between conservation action and ES delivery more explicitly. They used a similar suite of ES to that applied by Anderson et al, but explored the concordance of service delivery with the occurrence of the three types of conservation management action: protected areas, restrictive zoning, and incentive payments to landowners (as discussed above). They also had a narrower geographic scope for their analysis, focussing only on England. The three conservation management actions that they assess covering land with a surface area of more than 35% of England. Their analysis assessed whether the level of ES delivered (as a proportion of delivery in England) is more than would be expected based on the land area involved and an even distribution of delivery. Their results are summarised in Table 1. In brief, protected areas have high levels of biodiversity (again, UK BAP species richness) and C storage, but low recreation and

Nature conservation and ecosystem service delivery
3
agriculture. A similar pattern is shown for protected landscapes (areas of restrictive zoning), but with a more evenly-balanced portfolio of ES delivery for agri-environment scheme regions, which have no particular association with delivery of biodiversity, carbon storage and agriculture. Notably – and perhaps surprisingly - all three strategies have a negative association with recreation, a relationship that we return to later. Table 1. Provision of biodiversity and ecosystem services under three conservation strategies. Area of Outstanding Natural Beatury (AONB), National Park (NP), Countryside Stewardship Scheme (CSS). A ratio of <1 indicates that that ecosystem service is relative under-represented in that conservation strategy relative to its national coverage; a ratio >1 indicates over-representation. “% of total” indicates the percentage of the total amount of each ecosystem service in England covered by each conservation strategy, with “All conservation strategies refers to the area covered by all three strategies combined. Redrawn from Eigenbrod et al, 2009.
Protected landscapes Agri-environment schemes
Protected areas
NP AONB CSS All conservation strategies
% of total
Ratio % of total
Ratio% of total
Ratio% of total
Ratio % of total
Ratio
Biodiversity 18.8 3.33 14.1 1.71 28.4 1.78 13.7 0.99 55.8 1.59 Carbon storage
11.4 1.80 12.9 1.61 16.3 1.06 17.1 1.08 42.1 1.17
Recreation 5.6 0.88 6.0 0.75 13.5 0.88 10.4 0.66 27.9 0.78 Agriculture 2.5 0.40 3.7 0.46 12.9 0.84 16.0 1.01 29.9 0.83
Eigenbrod et al (2010) adopt the same analytical approach, but consider the additional issue of tiered conservation strategies, i.e. the effect of an area of land being covered by more than one conservation action. The results are broadly similar, with a strong a positive relationship between “tiering” and stored carbon, a weaker positive relationship with agricultural production, and no relationship to recreation. Remaining at a national scale, Egoh et al (2009) examined the spatial congruence of biodiversity and ES delivery in South Africa. Their aim was to assess whether hotspots of ES delivery and biodiversity coincide, and so whether delivery of ES can be used as an argument in favour of the conservation of biodiversity. They assessed the distribution of the ranges and hotspots of five ecosystem services (surface water supply, water flow regulation, carbon storage, soil accumulation, and soil retention) in South African biomes. They found that grassland and savannah biomes contained significant amounts of all five ecosystem services, and that there was a generally positive but low correlation between ES hotspots and species richness and vegetation diversity hotspots. Species richness was mostly higher in the hotspots of water flow regulation and soil accumulation than would be expected by chance. Critically, they conclude that “no single biodiversity measure can be used as a surrogate for ecosystem services and vice versa”. At the European scale, Burkhard et al (2012) looked at the association of ES demand with different CORINE land classes. Although not specifically looking at nature conservation classifications – as nature conservation action might vary within land classes – it is possible to assess whether those land classes likely to be of conservation concern are associated with high demand levels for other services. Their analysis indicates that important habitat classes for conservation such as peat bogs, natural grassland and moors and heathland, although ranking high for supply relative to demand for regulating services, do not deliver

Nature conservation and ecosystem service delivery
4
much in terms of provisioning services. Perhaps, however, the results of this analysis are not surprising, as the relationships between land-classes and service demand are based on expert judgement (and so might match our pre-conceptions). Finally, analyses of biodiversity and ES congruence have been conducted at a global scale. The study by Naidoo et al (2008) undertook “global mapping” of ES and conservation priorities. They focussed on four ES: C sequestration, C storage, grassland production of livestock, and water provision. These were chosen on the basis that there is a good global coverage of data for service delivery. They found that regions selected to maximise biodiversity provide no more ecosystem services than regions chosen randomly. Their general conclusion was that if effort for conservation is focussed on regions that deliver high biodiversity rewards then they will not achieve high returns for the four ES as assessed in this study. However, despite these global-scale patterns, some win-win areas (i.e. particular eco-regions) could be identified that deliver both biodiversity benefits and the other ES. This finding again indicates the impact of grain size on assessments of these relationships. The findings of Naidoo et al (2008) are in notable contrast to those of Larsen et al (2012), who also undertook a global-scale analysis. Larsen et al assessed the association between the distribution of a global network of sites containing species on the edge of extinction and four types of ES benefits: C storage, provision of freshwater, option value (as yet unknown benefits likely to accrue from having conserved biodiversity) and cultural value. Option value was assessed as the number of narrow-ranged genera as a proxy for evolutionary distinctiveness secured by a site’s conservation; cultural value was assessed using the metric of regional language richness (a metric quite distinct from commonly-applied measurements of cultural service delivery such as recreation). Overall Larsen et al found that sites of high conservation priority performed better for ES delivery. Notably, although citing the study by Naidoo et al (2008), Larsen et al do not try to explain the differences between their own conclusions and those of the earlier work. These differences may result from methodological differences: Naidoo et al use ecoregions and look at species richness, which is in contrast to the focus on species on the edge of extinction as per Larsen et al Effectively, these studies are comparing ES delivery between different alternative land use types or land classes, or between quite markedly distinct conservation actions. There are then significant differences in the underlying composition and functioning of the systems involved in the different management designations or levels of biodiversity. Not surprisingly then we see substantial change in ES delivery. The influence of changes between land use types on suites – or “bundles” – of ES is summarised by De Groot et al (2010), who state: “Most ecosystems on earth have been converted to another type of land cover which can be characterized by its management, or land use type... Management systems differ in the way people extract goods, in the level of production, in the intended and unintended provision of services and in the level and quality of biodiversity. Land use and management influence the system properties, processes and components that are the basis of service provision. A change in land use or management will therefore cause a change in service supply, not only for specific services but for the complete bundle of services provided by that (eco)system..” Conservation designation is sometimes aimed at preventing changes in land use type, often from low-intensity, species rich systems, for example multi-species native broad-leaved woodland or lowland peat bog, to more intensively productive but often species-poor systems such as plantation forestry or arable crops. The step change in ES delivery associated with a change in land use or broad habitat type is reinforced by the analyses developed by the UK NEA. By contrasting the NEA’s assessment of ES delivered by viable alternative land use types we can indirectly assess the benefits of conservation designation for service delivery. A good example is the comparison that is possible between semi-natural grassland (UK NEA Chapter 6; Bullock et al, 2011) and enclosed farmland, which covers both arable and improved grassland systems (UK NEA Chapter 7; Firbank et al, 2011).

Nature conservation and ecosystem service delivery
5
Firbank et al note that semi-natural grassland historically has been converted into enclosed farmland, and it is reasonable to conclude that conservation of semi-natural grassland helps to prevent this change in broad habitat type. Both UK NEA chapters tabulate the services delivered by their respective broad habitat types, and this data can be combined (Table 2) to provide a comparison of service delivery. If we assume that the services listed with respect to semi-natural grasslands are those for which the habitat delivers a high level, then the switch from semi-natural grassland to enclosed farmland (which may occur in the absence of conservation designation) appears to have negative impacts for climate regulation, water purification and wild species diversity. Not surprisingly it has beneficial effects in terms of provisioning services, whilst the response of cultural services is potentially mixed: both semi-natural grassland and enclosed farmland are considered as delivering aspects of environmental settings and culturally valued landscapes, demonstrating perhaps the complexity of understanding the delivery of cultural services and the subcomponents of this broader service category. Table 2. Ecosystem services delivered by semi-natural grassland and enclosed farmland. Based on Tables 6.12 and 7.3 of the UK NEA (Bullock et al, 2011, Firbank et al, 2011). Although using slightly different structures, an attempt has been made here to link the information on specific services between the two tables. The first column details the ES category (as per the UK NEA typology), and the second lists the key services delivered by semi-natural grassland, including greater detail on the mode of delivery. The third and fourth columns detail, respectively, the importance of enclosed farmland management for particular services, and the impact of enclosed farmland on those services (with impact values ranging from ++ to --).
Ecosystem Service category
Service delivered by semi-natural grassland
Importance of enclosed farmland for service
Impact of enclosed farmland on service
Provisioning
Livestock: forage for cattle, sheep etc.
Crops, plants, livestock, fish, etc. (wild and domesticated)
High ++
Standing vegetation: biomass crops
Trees, standing vegetation & peat
Low +
Crops: pollination and pest control spill over
Cultural
Environmental settings: valued species and habitats, agricultural heritage, archaeological heritage, razing for rare livestock breeds, ecological knowledge, training areas
Environmental settings – meaningful places incl. green & blue space
Low 0
Environmental settings – socially valued landscapes and waterscapes
High ++
Regulating
Climate regulation: sequestration and storage of carbon and other greenhouse gases
Climate regulation High --
Hazard regulation – vegetation & other habitats
High --
Provisioning - Regulating
Water quantity: storage of water and recharging of aquifers
Water quantity High +/-
Purification: reduced pollution and storage of pollutants
Purification Low --
Waste breakdown and detoxification
High --/+
Wild species diversity: plant genetic diversity, seed for restoration projects
Wild species diversity including microbes
High --

Nature conservation and ecosystem service delivery
6
1.3.2 Changes in management within habitats or land uses Focussing as they do on comparisons of quite distinct land use or conservation designation types, the above studies do not consider the perhaps subtler changes in ES delivery that might occur within a habitat in response to targeted conservation action. Such studies are even rarer than broader-scale correlational analyses. However, a few studies have explicitly addressed this question. In a study exploring the extent to which farmland bird conservation (taken as an indicator of cultural ES) was associated with a suite of ES related to ecosystem processes, Bradbury et al (2010) focussed in particular on the management actions associated with agri-environment schemes (AES). Although they state that their results should be considered indicative (because service delivery was assessed on the basis of expert judgement), they conclude that “The simple message from the assessment is that action for [farmland bird] species does not necessarily enhance other services”. Notably the outcome is often dependent on the particular type of management action and habitat involved, with win-wins occurring for, for example, permanent grassland and field corner management. Some management options, however, had negative impacts for broader ES delivery. For example cereals for whole crop silage could produce more nutrient pollution than the alternative habitat (e.g. a grass ley). A similar within-habitat analysis was undertaken by Fisher et al (2011). They looked at ES delivery and species-focussed conservation action in UK wetlands. They examined in particular the impact of different management actions on target species and ES delivery in RSPB wetland reserves. Again, ES response to conservation management was assessed using expert judgement, this time in combination with visitor surveys. A wide range of services were considered, being grouped into a number of broad categories: hydrological (water flow and quality), greenhouse gas flux, cultural socio-economic services. A large number of service-management relationships was assessed in this study (for details see Table 3), but the basic underlying result is that whether conservation management actions have a beneficial or negative impact on service delivery depends on the particular management action and the service being considered. In some cases, although management actions might be altered to benefit a wider suite of ES beyond biodiversity conservation, this might then have negative consequences for conservation objectives. For example, reed bed cutting regimes might be altered to enhance commercial benefits but would have negative impacts on conservation objectives. Bastian (2013) considers the role of Natura 2000 sites in delivering ecosystem services. He combines a literature review with a more focussed study of Natura 2000 sites in the Ore Mountains in the German state of Saxony. He concludes that subtle changes in management or habitat status within a particular habitat type are important for particular classes of ecosystem service. For example, he concludes that a decline in the conservation status of semi-natural grassland habitats is associated with declines specifically in the provision of wild foods, biochemical substances, natural medicines and freshwater, in addition to pollination services. These changes follow a broadly similar pattern to those indicated by our comparison (above) of service provision in semi-natural grasslands and enclosed farmland. They are also supported by experimental studies such as that of de Deyn et al (2011) who showed that long-term biodiversity restoration practices in grassland systems increased soil C and N storage, especially when these treatments were combined with promotion of the legume Trifolium pratense. High rates of C and N accumulation were associated with reduced ecosystem respiration, increased soil organic matter content and improved soil structure. However, Bastian (2013) also concludes that the habitat is often more important for service delivery than the occurrence of particular species of conservation concern. Interestingly, and

Nature conservation and ecosystem service delivery
7
of direct relevance to this contrast between changes within and between habitats, he also notes that although some regulating and “socio-cultural” services are influenced by within-habitat changes in condition, some service types are only significantly influenced by changes between land use type, for example “many of the provisioning and regulating services. For these ecosystem services, “rough” vegetation structures, vegetation classes and land cover are generally more important.” This may indicate that the possibility of grouping services – and service responses – using bundles may depend upon the service types under consideration. The Broad Habitats chapters within the UK NEA also contain some examples of the response of ES to within-habitat conservation management actions. A good example is provided by the Mountains, Moorlands and Heaths chapter (Van der Wal et al, 2011). In particular this chapter describes a study of the response of ES to the restoration of the peatland habitat on Bleaklow Plateau in the Peak District. The restoration project – undertaken through the Moors for the Future Partnership – treated 6 km2 of bare peat on the Plateau to attempt to restore the cotton-grass dominated blanket-bog vegetation. Realised service benefits from the restoration action include: climate regulation through avoided carbon loss; improved water quality through reduced erosion; increased benefits for tourism and recreation through greater soil stability and hence access; enhanced quality of the socially valued landscapes through greater vegetation cover; increased field sports opportunity through increased red grouse numbers. Future projected service changes involve continuation of these trends, as well as reduced DOC losses (improving water quality regulation) and the potential for the fully restored bog to become a carbon sink (benefiting climate regulation). An assessment of the response of ecosystem services to peatland restoration was also the focus of a recent study of Exmoor by Grand-Clement et al (2013). This study concluded that the long-term benefit of peatland restoration to some ES, such as a reduction in carbon losses and improvement of water storage and quality, has the potential to balance high financial investment. The Freshwaters Chapter of the UK NEA (Maltby et al, 2011) also contains an assessment of within-habitat management actions, this time focussing on Beckingham Marshes, Nottinghamshire, and drawing on the work of Posthumus et al (2010). Although the study focuses on what are described as “ecosystem indicators” these are broadly speaking related to the delivery of different services. The existing (2006), agricultural production and floodwater storage management scenarios considered all have similar ecosystem indicator response and “score high on agricultural production and floodwater storage, low on environmental services such as water quality, greenhouse gas balance, habitats and space for water recreation and landscape. By comparison, the agri-environment and biodiversity [i.e. conservation-orientated] scenarios show relatively higher values for indicators relating to soil quality, habitats, space for water, recreation and landscape” (Maltby et al, 2011). However, assessments of service responses to within-habitat management action do not always show a negative correlation between provisioning services (e.g. agricultural production) and cultural or supporting services. The Coastal Margins chapter of the UK NEA (Jones et al, 2011) describes an assessment made by Everard et al (2009) of ES responses to the option of managed coastal realignment at Alkborough Flats on the Humber. Assessing the consequences for service delivery, and working to the MEA classification system of provisioning, regulating, cultural and supporting services, provided evidence “overturning an unstated assumption that ‘provisioning services’ were being traded-off to boost ‘regulatory services’ (particularly flood risk) and ‘supporting services’ (habitat for wildlife)” (Jones et al, 2011). The conclusion drawn is that environmentally sensitive innovations do not inevitably lead to a trade-off between particular benefit types.
Nature conservation and ecosystem service delivery
8
Table 3. Services and disservices associated with management activities in wetland habitats. Potential services and disservices associated with specific management activities for biodiversity conservation in the four main lowland wetland habitats as considered by Fisher et al (2011). Text in italics shows complex context specific issues discussed in more detail their paper. Redrawn from Fisher et al (2011) Habitats Service and benefit categories
Water flow Water quality GHG flux Cultural/socio-economic
Services Disservices Services Disservices Services Disservices Services Disservices
Grassland
Grazing Soil compaction influence on water infiltration & risk of flooding
Potential nutrient & faecal coliform contamination of water courses or groundwater
Compaction of waterlogged soils may facilitate carbon storage
Compaction of waterlogged soils may increase denitrification; Methane output from cattle and water logged soil
Maintaining traditional rural landscape; Opportunities for local graziers
Topping/mowing Soil compaction influence on water transition and risk of flooding
Potential small amount of methane emission
Maintaining traditional rural landscape; Local employment: Provision of hay
Problem species control
Burning removed material may slightly increase in carbon emissions
Influence on local landscape; Reduced need for control on adjacent land
Rotovating May increase water infiltration
May increase sediment influx into water bodies
May slightly increase carbon emission (esp. in organic soils)

Nature conservation and ecosystem service delivery
9
Habitats Service and benefit categories
Water flow Water quality GHG flux Cultural/socio-economic
Services Disservices Services Disservices Services Disservices Services Disservices
Open water
Water level control
Influences flood storage potential; May influence groundwater recharge
Influences flood storage potential; May influence groundwater recharge
Carbon storage can be high in waterlogged soils
Denitrification and methanogenesis can be high in waterlogged soils
Influence in local landscape; May influence local flood potential
May influence local flood potential
Wet feature creation
Increased area for water storage
May influence local flood potential
May slightly increase denitrification
Influence on local landscape
Ditch reprofiling & de-silting
Increased area for water storage
May influence rate of water transfer & local flood potential
Potential slight increase in rate of carbon emission
Reedbed
New reedbed planting
Can influence evapo-transpiration rate; May influence flood storage
Can influence evapo-transpiration rate
May improve water quality
Reed may provide routes for GHG transport
Influence on local landscape
Reedbed cutting Can influence evapo-transpiration rate
Lowered water levels may reduce de-nitrification; Emissions from use of cut reeds; Potential biofuel
Lowered water levels may reduce carbon storage; Emissions from use of cut reed
Maintaining traditional cultural activities; Provision of reed for thatching
New channel creation
Increased area for water storage
May influence local flood potential
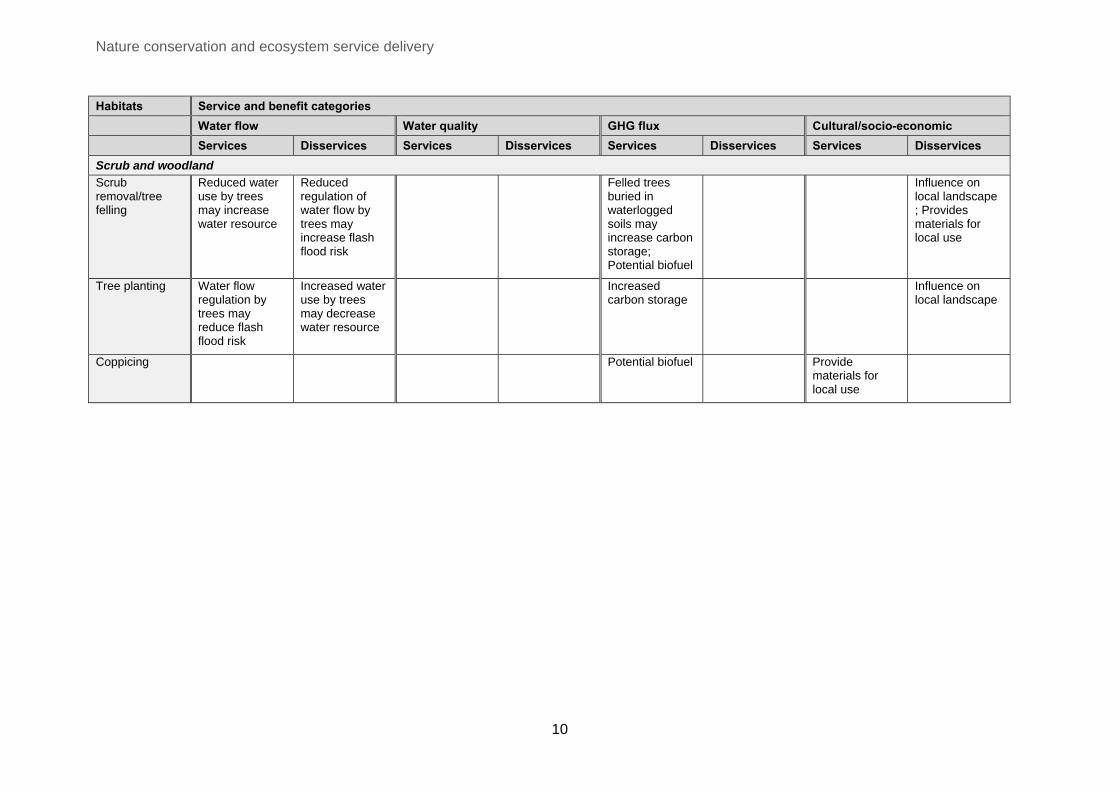
Nature conservation and ecosystem service delivery
10
Habitats Service and benefit categories
Water flow Water quality GHG flux Cultural/socio-economic
Services Disservices Services Disservices Services Disservices Services Disservices
Scrub and woodland
Scrub removal/tree felling
Reduced water use by trees may increase water resource
Reduced regulation of water flow by trees may increase flash flood risk
Felled trees buried in waterlogged soils may increase carbon storage; Potential biofuel
Influence on local landscape ; Provides materials for local use
Tree planting Water flow regulation by trees may reduce flash flood risk
Increased water use by trees may decrease water resource
Increased carbon storage
Influence on local landscape
Coppicing Potential biofuel Provide materials for local use

11
1.4 Discussion To return to our original question, it is clear that a very broad range of ES is delivered by protected areas/the wider countryside managed for nature conservation. Although any area of land probably delivers at least some level of a given service, if we think in terms of ES bundles as described by de Groot et al (2010) – and talking in very broad terms - areas managed for nature conservation appear to deliver higher levels of supporting or regulating services, and less in the way of provisioning services. In terms of cultural services, not only are these services potentially more difficult to measure, the factors regulating their delivery are perhaps more complex. The studies by Anderson et al (2009) and Eigenbrod et al (2009) both indicate that areas of high BAP species richness do not deliver (and in fact are negatively associated with) recreation. This is because such areas are not close to areas of high population density; most recreational activities take place near to towns or cities, whereas protected areas or biodiversity hotspots (in the UK at least) tend to be removed from such locations. This demonstrates the problem of determining cause and effect in these ES-conservation management relationships. Although we can make broad statements about patterns of association, or congruence, between protected areas or biodiversity management actions and ES delivery, it is much harder to be certain about whether these relationships are causal. Whether ES delivery would differ if an area were not designated may be more dependent upon whether alternative land uses are possible and, as with the delivery of cultural services, this may be dependent on their location. For example, in lowland systems in the UK, designation probably prevents conversion of habitats from low to high intensity management, a change which is often associated with species loss (Norris 2008). Designation therefore maintains ES bundles associated with conservation and limits those associated with more intensive agricultural production. However, conservation designations are often disproportionately focussed on upland or northern environments with inherent low productivity. The strong positive association of “tiering” of conservation designations and C storage found by Eigenbrod et al (2010) is driven by the greater likelihood of a site in the uplands receiving multiple conservation designations, which in turn is perhaps a result of there being limited demand for high-return alternative land uses in upland systems, or a lower level of historic over-exploitation in upland systems because of lower associated returns (and hence a retention of biodiversity value). Another example provided by Eigenbrod et al (2010) of the problems of determining cause and effect from correlational data is the apparent high representation of both biodiversity and agricultural production in areas with the joint designation of being a protected area and in the ESA agri-environment scheme. This positive relationship might be taken as indicating a win-win situation but, along with noting the small amount of land covered by this joint designation (only 0.16% of the English land surface), Eigenbrod et al also point out that the result may be an artefact of the resolution of data used in the analysis. As they put it “most of the biodiversity might be packed into small natural areas within agriculturally productive regions, rather than species occurring on the farmed land.” This is not unlikely given that ESAs do not have to deliver biodiversity goals, but instead simply ensure that land is managed in a particular way. Irrespective, the data available have insufficient resolution to unpick this problem. However, we are not entirely without data that enable us to assess whether the conservation action – service delivery link is causal. As mentioned, experimental studies such as those of de Deyn et al (2011) demonstrate that conservation actions in grasslands can be linked clearly to benefits in terms of C storage, although such effects are relatively subtle and at a different scale to those reported by Eigenbrod et al (2009, 2010). Additional evidence is also available from meta-analyses such as that undertaken by Rey Benayas et al (2009), which

Nature conservation and ecosystem service delivery
12
focussed on the response of ecosystem services to ecological restoration projects. A general pattern across their data set was that supporting and regulating ecosystem services and biodiversity were higher in restored than in degraded systems, but lower than in undamaged reference systems, with provisioning services showing no effect of restoration (but with a low sample size for the latter analysis). Perhaps more importantly for this discussion, however, is the finding that although biodiversity and ecosystem service response ratios were positively correlated for both restored versus degraded and restored versus reference comparisons, the relation was much stronger in the former comparison. It is suggested that this observed difference “may be linked to an asymptotic relation between biodiversity and ecosystem function, whereby increasing biodiversity from low values has relatively strong impacts on individual ecosystem functions, but the relation plateaus at relatively high biodiversity values.” Hence this study supports the notion of the functional relationship between restored or conserved biodiversity and service responses. Nearly all of the studies described above concur on the limited availability of data. As can be seen from the examples given in this brief review, we have had to be relatively flexible in selecting studies and interpreting data because of the shortage of information. Based upon the points raised in these studies and the comparison we have made across them, we can summarise the consequences of data limitations into a number of categories. • A lack of data on a wide range of ES. Naidoo et al (2008) note “one of our most striking
findings is simply how few ecosystem services we were able to include in our analyses”. Many studies focus on a small suite of services (C storage, agricultural production, species richness) because these are the only ones that can be mapped with some degree of certainty based on existing data. This problem reflects perhaps the relatively recent interest in ES delivery, and hence the current gaps in monitoring methodologies and data for many ES.
• A lack of fine-resolution data. In some cases this limits the capacity to drill deeper into
apparent relationships which evidence suggest may be scale dependent (e.g. the work of Anderson et al, 2009, Naidoo et al, 2008). In other cases it forces a dependence on expert judgement, which may lead to conclusions concerning ES responses to conservation management that almost inevitably match our expectations.
• A lack of time series data to show trends in ES delivery in relation to conservation
designation or action. This would enable more assessments such as that undertaken by Rey Benayas et al (2009) as to whether conservation action influences ES delivery, or whether its application just happens to be spatially correlated with particular patterns of ES.
Again de Groot et al (2010) succinctly summarise this state of affairs, noting “Empirical information on the quantitative relationship between land use and ecosystem management and the provision of ecosystem services at the local and regional scale is, however, still scarce”. But this problem may start to be rectified as new monitoring and measurement approaches are developed in response to the re-focus of the CBD on the Aichi targets. At the same time biodiversity projects might morph into what Goldman et al (2008) describe as ES projects, i.e. “those that have biodiversity goals, but in addition have an explicit goal or strategy of at least one ecosystem service such as water purification, carbon sequestration, and opportunity for ecotourism.” The assessment of success in such projects will necessitate new monitoring and measurement approaches for ES, and should lead to much greater data availability.

Nature conservation and ecosystem service delivery
13
2 The representation of ES derived from nature conservation in current typologies
2.1 Objectives of the review The aim of this chapter is to conduct a literature review on the representation of ecosystem services derived from nature conservation in current typologies and discuss the limitations of these typologies in relation to nature conservation/biodiversity. 2.2 Similarities of the typologies The use of fundamental ecological principles within a ES framework has helped ensure that there are many similarities in the different typologies used in ecosystem assessments, to both define individual ecosystem services (e.g. Pollination) and group them into service categories (e.g. Supporting, Provisioning, Regulating, Cultural). Essentially, recent typologies, including The Economics of Ecosystems and Biodiversity (TEEB, 2010), the UK National Ecosystem Assessment (UK NEA, 2011) and, the on-going work to develop a Common International Classification of Ecosystem Services (CICES), have all evolved from the framework used in the Millennium Ecosystem Assessment (MEA, 2005).
2.3 Differences and limitations of different typologies Not surprisingly this evolution has led to a number of differences in typology, some of which may have implications for nature conservation objectives. First, TEEB introduced Habitat Services, including maintenance of life cycles of migratory species and maintenance of genetic diversity, alongside the highest level categorisations of Provisioning, Regulating and Cultural services, whereas the MEA and the UK NEA see these as basic ecological processes that are relevant through their underpinning of Supporting Services. CICES has explicitly recognised these habitat service types as a group “lifecycle maintenance, habitat and gene pool protection” within an expanded category of regulating services, called Regulation and Maintenance. Both TEEB and CICES also see soil formation as a Regulating Service, rather than a Supporting Service, as in the MEA and UK NEA. However, this difference in categorisation does not matter for nature conservation, as long as issues relating to soils, for example, are not ignored, but does matter when it comes to valuation, because of the risk of double-counting. Second, and to specifically overcome the risk of double counting, the UK NEA explicitly distinguished Final Ecosystem Services – an ecosystem service that directly underpins or gives rise to a “good” that has value to human well-being. Although the CICES typology is very much geared around the desire to relate to the UN Sustainable Development (UNSD) initiative to revise the System of Economic and Environmental Accounts (SEEA), this typology does not explicitly separate out Final Ecosystem Services. This is somewhat surprising given the consultation report on the latest iteration of CICES does discuss the issue at some length (Haines-Young & Potschin 2013). This would be an issue if valuation was being undertaken to explore the trade-offs between ecosystem services and the consequences of different management options for human well-being. Third, possibly the area of greatest difference between typologies is in the treatment of Cultural Services. On the one hand the MEA and TEEB acknowledge that ecosystems provide aesthetic information, spiritual and education experiences, inspiration for art, as well as opportunities for recreation and tourism, whereas on the other hand the UK NEA and CICES see these attributes as examples of “goods” delivered by ecosystems. This stresses

Nature conservation and ecosystem service delivery
14
the importance of separating ‘final ecosystem services’ from ‘goods’. As a result the UK NEA defined Cultural Services as “the environmental settings that give rise to the cultural goods and benefits that people obtain from ecosystems. Over millennia these environmental settings have been co-produced by the constant interactions between humans and nature. They are inscribed with not only natural features but also the legacies of past and current societies, technologies, and culture.” (UK NEA Technical Report 2011, Chapter 16, p. 634). In reality much of nature conservation is motivated by a sense of place reflecting an appreciation of the habitats and species that characterise an environmental setting, both at local and land/seascape scales (see below). All the above typologies recognise the importance of cultural services to human well-being, whether expressed in terms of a service, good or benefit. However, whilst they acknowledge their importance within an ES framework to inform decision-making, they fail to fully characterise the full complexity of socio-ecological interactions. This is because cultural services (non-use values) are difficult to quantify in biophysical or monetary terms, providing challenges to their effective integration into current ES frameworks (Daniel et al, 2012). They have been proven to be somewhat elusive, as their valuation is often complicated by their intangible, subjective and incommensurate nature (Chan et al, 2012). Indeed the main ES typologies, whilst providing compelling reasons for conserving ecosystems, have been criticised by Chan et al (2012) in that they fail to recognise the interconnected, interdependency and ubiquitous nature of many benefits and services, especially the non-material benefits. For example, there is often overlap between say landscape aesthetics and recreation as the former often contributes to the latter. Indeed it is these intertwinements that indicate how important cultural services are and how challenging they are to identify and assess to inform decision makers (Daniel et al, 2012). Both Chan et al (2012) and Daniel et al (2012) argue that as many ES co-produce ‘cultural’ benefits, (e.g. stalking and shooting deer for venison; provides benefits which would be characterised as both provisioning and cultural), the full characterisation of ES must address non-material values through social science methods. As many of the additional benefits arising from nature conservation and designated areas fall with the non-material/cultural services category, and hence do not fit well into the above ES framework, it stands to reason that they will not be adequately incorporated into decision making. Chan et al (2012) propose a new typology (see Figure 1 in Chan et al, 2012) where many services produce multiple benefits and the value of the service depends on the marginal value of changes in the various benefits it provides. As each of the associated benefits might simultaneously change, the independent valuation of several services becomes problematic. However, as Chan argues that valuation will be more successful if services are simultaneously valued, with the multiple benefits and their interdependencies accounted for, thereby avoiding double accounting. This is in contrast to the conventional economic approaches to ES where it is often desirable to compartmentalise services such that each service only provides one benefit. Fourth, while all the ES typologies implicitly assume that, since all living things and their interaction with air, land and water are the natural resources that shape ecosystems, the ES that flow from them must be dependent to some degree on biodiversity, the UK NEA explicitly tried to clarify how biodiversity has key roles at all levels of the ecosystem hierarchy (see also Mace et al, 2012). The motivation for distinguishing the multi-layered influence of biodiversity i) as fundamental to underpinning ecosystem processes, ii) as a final ecosystem service, and iii) as a good that is subject to valuation, whether economic or otherwise, was to avoid confusion in both the rapidly expanding research and policy fields, which threatened efforts to create coherent policy. Thus, while there is increasing evidence that the functional diversity of soil organisms is important for terrestrial ecosystem processes, bird species richness may not be. However, biological diversity at the level of species, or at the level of
Nature conservation and ecosystem service delivery
15
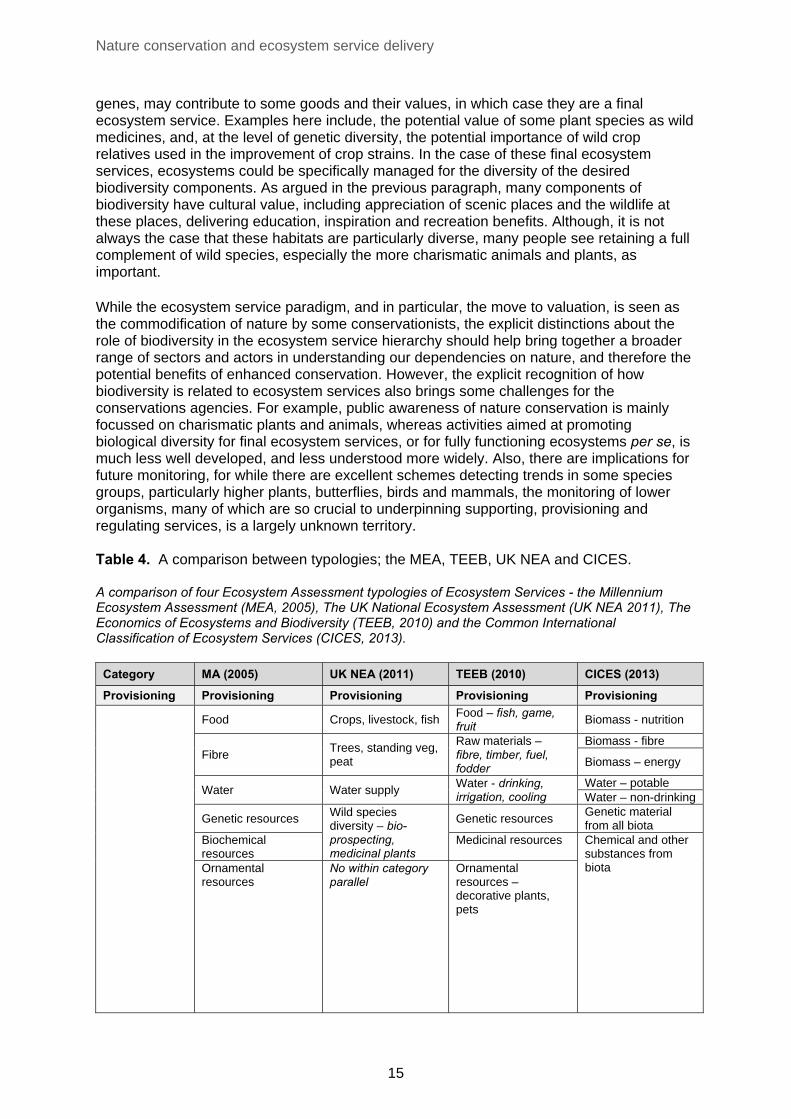
genes, may contribute to some goods and their values, in which case they are a final ecosystem service. Examples here include, the potential value of some plant species as wild medicines, and, at the level of genetic diversity, the potential importance of wild crop relatives used in the improvement of crop strains. In the case of these final ecosystem services, ecosystems could be specifically managed for the diversity of the desired biodiversity components. As argued in the previous paragraph, many components of biodiversity have cultural value, including appreciation of scenic places and the wildlife at these places, delivering education, inspiration and recreation benefits. Although, it is not always the case that these habitats are particularly diverse, many people see retaining a full complement of wild species, especially the more charismatic animals and plants, as important. While the ecosystem service paradigm, and in particular, the move to valuation, is seen as the commodification of nature by some conservationists, the explicit distinctions about the role of biodiversity in the ecosystem service hierarchy should help bring together a broader range of sectors and actors in understanding our dependencies on nature, and therefore the potential benefits of enhanced conservation. However, the explicit recognition of how biodiversity is related to ecosystem services also brings some challenges for the conservations agencies. For example, public awareness of nature conservation is mainly focussed on charismatic plants and animals, whereas activities aimed at promoting biological diversity for final ecosystem services, or for fully functioning ecosystems per se, is much less well developed, and less understood more widely. Also, there are implications for future monitoring, for while there are excellent schemes detecting trends in some species groups, particularly higher plants, butterflies, birds and mammals, the monitoring of lower organisms, many of which are so crucial to underpinning supporting, provisioning and regulating services, is a largely unknown territory. Table 4. A comparison between typologies; the MEA, TEEB, UK NEA and CICES. A comparison of four Ecosystem Assessment typologies of Ecosystem Services - the Millennium Ecosystem Assessment (MEA, 2005), The UK National Ecosystem Assessment (UK NEA 2011), The Economics of Ecosystems and Biodiversity (TEEB, 2010) and the Common International Classification of Ecosystem Services (CICES, 2013).
Category MA (2005) UK NEA (2011) TEEB (2010) CICES (2013)
Provisioning Provisioning Provisioning Provisioning Provisioning
Food Crops, livestock, fish Food – fish, game, fruit
Biomass - nutrition
Fibre Trees, standing veg, peat
Raw materials – fibre, timber, fuel, fodder
Biomass - fibre
Biomass – energy
Water Water supply Water - drinking, irrigation, cooling
Water – potable Water – non-drinking
Genetic resources Wild species diversity – bio-prospecting, medicinal plants
Genetic resources Genetic material from all biota
Biochemical resources
Medicinal resources Chemical and other substances from biota Ornamental
resources No within category parallel
Ornamental resources – decorative plants, pets

Nature conservation and ecosystem service delivery
16
Category MA (2005) UK NEA (2011) TEEB (2010) CICES (2013)
Cultural Cultural Cultural Cultural Cultural & Amenity
No within category parallel
Wild species diversity - recreation
No within category parallel
No within category parallel
Recreation & tourism
Environmental settings
Opportunities for recreation/tourism Physical and
intellectual interactions with ecosystems and land-/seascapes
Cultural diversity Inspiration for art, culture & design
Knowledge systems Educational vale
Information for cognitive development
Spiritual/religious value
Spiritual experience Spiritual, symbolic other interactions
Aesthetic values Aesthetic information
Regulating Regulating Regulating Regulating Regulation & Maintenance
Climate regulation Climate regulation Climate regulation Atmospheric compositn and climate regulation
Pollination Pollination – can also be an intermediate service
Pollination See below ‘Life cycle maintenance’
Air quality regulation Detoxification/ purification of air, soil & water
Air quality regulation Mediation of waste, toxic and other nuisances – incl. noise
Waste treatment – water purification
Maintenance of soil fertility – incl. formation
Soil formation and composition
Erosion regulation
Hazard regulation
Moderation of extreme events –storm protectn, flood prevention Mediation of flows –
mass, liquid, gaseous/air
Water regulation
Regulation of water flow – natural drainage, irrigation, drought prevn
Erosion prevention
Pest regulation Disease & pest regulation
Biological control - Pest and disease control
No within category parallel
Noise regulation No within category parallel
See above ‘Mediation of nuisances’
Supporting Supporting
Ecosystem processes and Intermediate Services – incl. Supporting
Defined as Habitat Services but limited compared to MA & NEA
Supporting services not explicit but subsumed under maintenance
Implicit Ecological processes – incl. decomposition
Maintenance of life cycles of migratory species – incl. nursery services
Life cycle maintenance, habitat and gene pool protection
Implicit Evolutionary processes
Maintenance of genetic diversity
Subsumed in biodiversity
Wild species diversity
Subsumed in biodiversity
Photosynthesis Implicit Implicit No within category parallel
Weathering No within category parallel
Supporting Supporting
Not explicit
Primary production Primary production Soil formation Soil formation Nutrient cycling Nutrient cycling Water cycling Water cycling

17
3 The delivery of ecosystem services from designated sites and non-designated: the case studies
3.1 Objectives The main objective of this chapter is to provide examples, using case-studies, of how the delivery of ecosystem services is affected by nature conservation, either through specific designated sites or other mechanisms used to achieve biodiversity conservation, for example, agri-environment schemes. By exploring a range of case-studies we aim to answer the questions below: • What ES could be delivered from an area if it was not managed for nature
conservation?
• What ES are expected to increase when land is managed for nature conservation?
• How does the habitat condition of the site affect ES delivery?
• Can condition monitoring of protected areas be used to determine the ES delivery?
• How does ES delivery change with conservation effort?
• What are the expected trade-offs in ES between designated and non-designated sites?
3.2 Methodology 3.2.1 The case studies In order to address the above objective and to try to answer the specific questions, nine different case-studies across Scotland and England were selected. The case-studies were selected to represent a range of different types of habitats/ecosystems (and hence potential ES) and included rivers, coastal and chalk grasslands, montane heaths, raised bogs and Scots pine woodlands. In most of the case-studies (1-7) the case-study was composed of a designated component or site and a non-designated component or site. The pair-wise comparison, of designated versus non-designated, allows for a comparative assessment of the delivery of ES between designated and non-designated sites of similar ecosystem type (currently or in recent past). In the Loweswater catchment case-study (8) the comparison is between land managed under agri-environment schemes and that without agri-environment schemes. The Loweswater catchment was specifically selected to explore the effects of a different level or type of conservation management other than designation per se, e.g. the effects of agri-environment schemes. In the River Dee case-study (9) the comparison is between the River Dee, which is predominantly a SAC along the whole catchment, compared to the River Don in which only a proportion of the catchment is under a SAC. For the River Dee/Don case-study only the river and associated wetland habitats were considered in the assessment. A summary of each case-study is listed in Table 5. The types of designation covered by the nine case-studies include; international designations such as those under the Ramsar convention, European designations such as SAC (Special Areas of Conservation) and national designations such as NNR (National Nature Reserves), SSSI (Sites of Special
Nature conservation and ecosystem service delivery
18
Scientific Interest) and national parks such as the Lake District National Park. In the majority of the case-studies national designations, e.g. SSSIs are nested within international or European designations, e.g. an SAC or SPA (Special Protection Area).

19
Table 5. A summary of the case studies.
No. Case-study Key habitats/species of designated site
Key habitat/species of non-designated site
Management scenario explored
1 Balranald SSSI/SPA/SAC/RSPB reserve compared with adjacent non-designated areas (North Uist)
Coastal machair, dunes and lochs Adjacent coastal grasslands 1) Removal of the designation 2) Full restoration of rotational arable
agriculture on the designated site.
2 Sletill Peatlands SSSI (part of Caithness and Sutherland Peatlands SAC, SPA, Ramsar, Flows NNR) compared with adjacent ex-forestry plantation
Blanket bog, breeding birds Ex-forestry plantation, barley crops
1) Removal of SSSI designation 2) Habitat restoration of SSSI
3 Rora Moss SSSI compared with Middlemuir Moss
Raised bog Cut over peat bog 1) De-designation 2) Habitat restoration
4 Beinn Eighe NNR/SSSI/SAC/NSA compared with surrounding upland areas
Alpine heathland, Scots pine-forest, oceanic bryophytes, Golden Eagle
Heathland, grassland, blanket bog
1) Removal of SSSI designations 2) Favourable to unfavourable
5 RSPB Abernethy National Nature Reserve NNR/SAC/SSSI
Scots pine-forest (ancient and plantation)
Scots pine forest (ancient and plantation)
1) The RSPB reserve returning to be managed as a traditional highland estate (forestry and sporting)
2) Unfavourable to favourable condition of Tulloch moor (bearberry heath)
6 Parsonage Down NNR (Salisbury Plain) compared with adjacent improved grasslands
Species-rich calcareous grassland Ploughed, sown with agricultural grasses and fertilised.
1) Removal of SSSI 2) Habitat restoration of non-designated areas
(agriculturally improved areas)
7 Drumochter Hills (SAC) compared adjacent Dalnacardoch (non-designated area)
Alpine heathland, late snow bed vegetation, high altitude grasslands, blanket bog, Assemblages of arctic and upland breeding birds
Upland/montane vegetation comprising mainly of a heather/grass mosaic (predominantly wet heath and blanket bog) - of European importance
1) Removal of SAC
8 Loweswater catchment (Lake District National Park) land with and with-out agri-environmental schemes
Upland bog, heathland, acid grassland, broadleaved woodland, lake (under agri-environmental schemes)
Upland bog, heathland, acid grassland, broadleaved woodland, lake
1) Change in management regime (cattle reduction)
2) Change in management regime (woodland expansion)
9 River Dee Catchment SAC compared with River Don
Otter, salmon, freshwater pearl mussel
Otter, salmon, freshwater pearl mussel
1) The whole River Don catchment becoming an SAC

20
3.2.2 The ecosystem service assessment (for conservation) framework to assess the delivery and importance of ecosystem services from designated areas
In order to conduct an assessment on the effects of designation or degree of conservation management on the delivery of ecosystem services, an ecosystem service assessment for conservation (ESAC) framework within an Excel database was developed. The ESAC comprises of three data sheets and a guidelines sheet: 1) an introduction to the sites used in the case-study, 2) the ESAC framework, 3) key findings from the ESAC and 4) guidelines for the expert assessor. The ESAC for each case-study was conducted by an expert assessor. The framework assesses, using the expert opinion of an assessor, the differences ES delivery between designated sites and non-designated sites and expected changes in ES following changes in management or designation. Introduction to the sites This first datasheet provides the background to each case-study and includes information on the two sites used for the comparison. It includes information on the name and location of the sites, the type of nature conservation designations in place, predominant habitats and species, any notified features and the condition of the habitats and species if known. In addition it has the details of the expert assessor used to conduct the assessment and details of additional stakeholders asked to score the ecosystem service importance rating. The sheet also includes a section on the different management scenarios the expert assessor used to explore changes in ecosystem service delivery. Typical scenarios explored by the expert assessors included a change from unfavourable to favourable condition of habitats of species or a change in designation. The ESAC framework The ESAC framework provides a framework to enable the delivery of ecosystem services for both designated sites and non-designated sites to be assessed and compared based on a simple, scoring method of ranking and rating. The goods and benefits, completed by the assessor(s), arising from the comparative sites are categorised into 24 descriptive ecosystem services categories, which map onto the four broad master categories (provisioning, regulating, cultural and supporting) used in all the main ES typologies (see chapter two). This framework allows the interconnections between ES and the different bundles of benefits arising from ES to be acknowledged and considered in the overall assessment. This is particularly relevant for cultural services as argued by Chan et al (2012). For example, if we consider venison from a highland estate: it could be viewed as food under provisioning services or as recreation under cultural services. Whether assessed as a provisioning service or cultural services there are multiply benefits of ‘bundles of benefits’; material, livelihood, nutrition, heritage, physical, psychological, social capital. In order to explore the differences in ES delivery of designated and non-designated sites the master category cultural services was expanded to include seven sub-categories; aesthetics, artistic, heritage, education, religious, tourism and recreation, and stewardship. The cultural service- stewardship refers to the distinct service provided by ecosystems in terms of a providing a setting or place for conservation or environmental volunteering. It was felt that this required a distinct sub-category, as opposed to just being included under recreation, as the reasons and motives for environmental stewardship as well as the benefits are distinct from just recreation alone. In the first instance the assessor was asked to select the ES categories which would have formed the basis of the reasons for designation itself. This is so that the impact of the

Nature conservation and ecosystem service delivery
21
notified features (the reason for designation) could be factored into the comparative assessment. Prior to ranking the delivery of ecosystem services for the designated and non-designated sites the expert assessor was asked to rate the relative importance (by distributing one hundred points) of each ecosystem service for that particular ecosystem and location. There is an option within the framework for additional stakeholders to rate the relative importance of the ecosystem services e.g. farmers or other land managers. The assessor, based on their expert opinion, was asked to rank the delivery of each of the 24 ecosystem services for the designated and non-designated site using four ranks: low, low-medium, medium-high and high. The differences between the delivery of ES from the designated and non-designated site is automatically calculated and highlighted in the framework. In order to explore the changes in delivery of ES with a change in management scenario, the assessor was asked to score the expected change for each of the 24 ES categories. For example, is the ES expected to go up, down or stay the same? For both the changes in ES delivery between the designated and non-designated sites, and the expected changes due to different management scenarios the assessor was asked to state the level of confidence associated with each assessment. Key findings for ESAC In this sheet the assessor was asked to note any key findings, results and relevant discussion points to include in the final results and discussion. Guidelines for the expert assessor The final sheet of the ESAC template includes notes and guidelines for the assessor to assist them in completing the different components of the assessment.
3.3 Results 3.3.1 Balranald SSSI (SSSI, SPA, SA AND RSPB reserve) compared with
adjacent non-designated coastal grasslands (North Uist) The completed ESAC framework is attached in Appendix 1. The case-study assesses the delivery of ES from the mosaic of coastal dunes, machair and lochs on the most westerly point of North Uist. The designated site is an SSSI managed by RSPB and includes the naturally nutrient-rich loch and marsh, Loch nam Feithean. The primary reasons for the original SSSI designation, and subsequent NATURA designations, are attributable to biodiversity goods within an ES typology; namely the features and species of conservation interest/value both nationally and at a European level. This includes wetland birds such as the corncrake and Greenland barnacle goose, amongst others, as well as habitats such as the machair, naturally nutrient-rich lochs and dune systems. These goods were categorised under cultural services- aesthetics. According to the assessment the SSSI site, when compared to the adjacent non-designated areas of coastal machair and lochs, delivers more cultural services namely; aesthetics, education, stewardship and tourism/recreation. It also delivers higher in one regulating service - pollination. The only service in which the designated site ranked less was regulation-climate due to the relatively high levels of arable agriculture carried out which

Nature conservation and ecosystem service delivery
22
reduces carbon build up in the soil. In all the other eighteen ES assessed there was no difference between the designated site and non-designated site. According to the assessment, the ES that would be expected to decrease (within five years) if the SSSI was de-designated are: cultural-aesthetics, cultural-education, cultural –stewardship, cultural-tourism/recreation and regulating-pollination. There would be no expected changes in the delivery of any of the other ES. The second management scenario explored in the case-study was if traditional or rotational arable agriculture was restored across all the areas where it had previously occurred across the designated site (one of the objectives of a current LIFE+ project). Currently across the island, as in other crofting areas of the islands, the reduced numbers of active crofters and a general trend away from cropping, have led to substantial reductions in the area under rotational agriculture (Pakeman et al, 2011). Under this scenario, the ES services expected to increase would be cultural-aesthetics, cultural-heritage, regulating-pollination, regulating-soil quality, provisioning-fibre, provisioning-food and provisioning -genetic resources. Those that would be expected to decrease are regulating-climate, regulating-hazard, regulating-water quality and supporting-soil formation. The confidence level associated with the changes of delivery varied between the type of ES been evaluated. For example, the assessor had high confidence in the expected changes to the ES relating to soil functions and regulation, but low confidence in the impact of change on artistic cultural services. 3.3.2 Sletill Peatlands SSSI compared with adjacent ex-forestry plantation The completed ESAC framework is attached in Appendix 2. The case-study assesses the delivery of ES from the blanket bog habitat at the Sletill Peatlands SSSI, which is part of the wider Caithness and Sutherlands SPA, SAC, Ramsar and the Flows National Nature Reserve. The designated site is co-owned and managed by RSPB and includes several lochs that are important wader breeding grounds. Although a full ecosystem services assessment for this area since designation has not been carried out, some highlights of successes along the lines of an Ecosystems Approach framework for the Flow Country were presented in the UK Peatland Restoration – Demonstrating Success booklet (Cris et al, 2011). The primary reasons for the original SSSI designation are attributable to biodiversity goods within an ES typology; namely the features and species of conservation interest/value both nationally and at a European level. This includes wetland bird species such as the common scoter, dunlin, golden plover and greenshank, as well as the blanket bog habitat. These goods were categorised under cultural services- aesthetics and partly under cultural-education. These two categories were assessed as providing 11 out of a possible 100 points in terms of their relative importance of ES delivery for blanket bogs. According to the assessment, the SSSI site, when compared to the adjacent non-designated areas, delivers more in 15 of the 24 ecosystem services. A caveat needs to be put in place though. The delineation of the original Sletill Peatland SSSI follows the area of blanket bog in this area that was not planted with commercial timber species in the 1970-80s. The non-designated areas that surround the Sletill Peatlands SSSI were all afforested during this time. Much of the plantation forestry in such areas surrounding the Sletill Peatlands SSSI has been felled over the last 15 years as part of an on-going peatland restoration programme in the wider Flows NNR, however the underlying soil in these areas is not always deep blanket peat. For example, although the 1:250,000 Soils of Scotland indicates that the non-designated area immediately south and east of Sletill Hill is deep blanket peat, much of the area adjacent to the western-most border of the SSSI is shallower, peaty
Nature conservation and ecosystem service delivery
23
podzol. Some of these areas of shallower soils may be suitable for reforestation, as, although current guidelines advise against afforestation on deep blanket peat, such shallower organic soils can be planted if suitable under other criteria (Morison et al, 2010). The delivery of ES on the designated site, therefore, is highly influenced by the management that has taken place on the non-designated areas, perhaps more so than by the management on the designated site itself. The designated site delivers better in five out of the seven cultural services, which manifests itself as strong interest in the Forsinard visitors centre, the number of volunteers that annually help with the monitoring and management programme, the interest in the area for artistic work (photography, paintings and books) and the delivery of statutory responsibilities for the protection of nationally and internationally important habitat and breeding birds. It has been estimated that the wider Caithness and Sutherland Peatlands SPA, SAC, Ramsar contributes to £187,000 annually to the local economy from nature protection activities. Out of the four provisioning categories, only the fresh water category was increased in the designated site, as research has shown the metal and dissolved organic carbon load to be lower and hence water quality to be improved. In the four regulating categories, climate and water quality regulation were deemed to be improved in the designated site. Amongst the supporting services, the presence of a healthy acrotelm5 layer would result in three out of the four services being improved. The only service in which the designated site ranked less was provisioning – raw materials, as the site had been restored to remove or fell in site any plantation forestry within the SSSI boundaries. Similarly, peat harvesting for either horticultural or fuel peat does not take place. In all the other eight ES assessed there was no difference between the designated site and non-designated site. According to the assessment, 12 ES would be expected to decrease (within five years) if the SSSI was de-designated. There would be an expected increase in the delivery of only ES, namely three provisioning services: energy, raw materials, and fibre, as the land use on the site could be (partially) changed to peat harvesting for fuel or horticultural peat, afforested (in pockets of <0.5 m peat depth) or stocked with sheep. The second management scenario explored in the case-study was further restoration management to improve the habitat condition of the blanket bog by further removal of conifers regenerating from remnant seeds. This could be particularly beneficial in some of the non-designated, former forestry block, areas that abut the eastern parts of the SSSI. This would affect the moisture holding potential across this section of the SSSI positively as one source of evapotranspiration losses would be removed. Twelve of the ES would be positively affected, whilst only energy and raw material provisioning services would be negatively affected. The confidence level associated with the changes of delivery varied between the type of ES being evaluated. For example, the assessor had high confidence in the expected changes to the ES relating to the cultural services and to some extent the regulating services, whilst the delivery of provisioning services would, to some degree, be affected by legislative changes with regards to peat production and/or the forestry sector. Low confidence was predominantly in areas where no, or little supporting evidence could be found, such as provisioning- genetic resources, regulating – hazard and – air quality. We could find no evidence of spiritual or religious cultural services attached to blanket bog. Overall, it is difficult, however, to arrive at a conclusion that the reasons for all or part of the more positive delivery of ecosystem services in the case study of the Sletill Peatlands SSSI blanket bog are directly and entirely related to the designation status. Designation has indeed brought a means to bring resources to the site that encourages use for educational, research and nature conservation purposes. These bring with them an accelerated visibility
5 The acrotelm layer is the top layer (around 30 cm) in peat bogs comprising Sphagnum and other typical peatland vegetation. It produces the typically spongy surface of peat accumulating bogs.
Nature conservation and ecosystem service delivery
24
of the site, through campaigns that have involved local artists, for example, or have opened access to voluntary activities. Hence, although the primary factors for designation initially were the cultural-aesthetic and cultural-education services, other factors are indirectly influenced by the designation status and this assessment must be seen in this context. 3.3.3 Rora Moss SSSI compared with nearby Middlemuir Moss
The completed ESAC framework is attached in Appendix 3. The case-study assesses the delivery of ES from the raised bog habitat at the Rora Moss SSSI, when set in contrast with a nearby, non-designated, raised bog at Middlemuir Moss, which has a very similar historical context. It must be stated that Rora Moss SSSI is a somewhat atypical amongst the designated raised bog habitats, in that the designation status at this bog has not conferred the same level of management activities typical of other nearby raised bogs under designation (e.g. Reidside Moss). A flagship site that demonstrates the delivery of ecosystem services from designated raised bogs in Scotland would be Blawhorn Moss SAC/SSSI/NNR, a short summary of the ES benefits of restoration management at this site may be found in Cris et al (2011). However, the findings of our review of a less managed raised bog SSSI do show the minimum effects of designation in the context of ecosystem services delivery and therefore may be seen as a useful, though perhaps worst-case, scenario. As in the case of the blanket bog case study (3.3.2.), the differences in the delivery of ecosystem services may be directly affected by the designation process. In the case of Rora Moss, initial designation was for cultural-aesthetic and cultural-education services, in this case for the quality of the remaining raised bog habitat. These two service categories scored 20 out of the total 100 points for importance ratings. According to the assessment, the SSSI site, when compared to the adjacent non-designated areas, delivers more in eight of the 24 ecosystem services. One of these is one of the primary reasons for designation, the delivery of cultural-aesthetics, e.g. delivery of the Habitats Directive. It was judged, however, that this site did not perform better than the non-designated comparison in terms of the cultural-education services. The designated site did not produce higher benefits in the delivery of any of the provisioning services. Within the regulating services, the designated site, on account of the remaining raised bog habitat, did perform better than the non-designated site in terms of air quality, climate, pollination and soil quality service categories. Similarly, the designated site performs better at delivery of three out of the four supporting services, again due to the remnant raised bog habitat within the overall site when compared to the non-designated site at Middlemuir Moss. There were only two services in which the designated site ranked less. The first of these was the provisioning – raw materials service, as peat harvesting for either horticultural or fuel peat has not taken place since designation, in contrast to the Middlemuir Moss non-designated site. This also affects the outcome of the cultural services- heritage services delivery. The recent industrial peat cutting at Middlemuir Moss provided a source of income and on-going domestic peat cutting at this site is preserving local heritage. In the other eight ES assessed there was no difference between the designated site and non-designated site. According to the assessment, the ES that would be expected to decrease (within five years) if the SSSI was de-designated are: cultural-aesthetics, cultural–stewardship, cultural-tourism/recreation, regulating-air quality, regulating-climate, regulating-water quality, regulating-pollination, regulating-soil quality, and all of the four supporting service categories. Only the provisioning-raw materials and provisioning-energy services would be positively influenced by de-designation scenarios. There would be no expected changes in the delivery of the other 10 ES.

Nature conservation and ecosystem service delivery
25
The second management scenario explored in the case-study was restoration management as applied on other raised bog SSSI on the designated site. Under this scenario, the ES services expected to increase would be almost all of the cultural services except artistic and religious, regulating-air, -water and -soil quality, and all of the four supporting service categories. Those that would be expected to decrease provisioning of energy and raw materials (peat). The confidence level associated with the changes of delivery varied between the type of ES being evaluated. For example, the assessor had medium to high confidence in the expected changes to the ES relating to supporting services and provisioning services in relation to energy and raw materials, but relatively low confidence in the expected changes in relation to the majority of the cultural services. 3.3.4 Beinn Eighe (NNR, SSSI SAC AND NSA) compared with surrounding
upland areas The completed ESAC framework is attached in Appendix 4. This case study evaluates the delivery of ecosystem services from the Beinn Eighe massif and surrounding area in Wester Ross, north-west Scotland. The area comprises a mosaic of upland habitats including wet and dry heaths, grasslands, blanket bog, native pinewood, alpine communities and scree. The designated site is a SSSI, NNR (the oldest in the UK, designated in 1951), SAC, NSA and Biosphere Reserve, and is owned and managed by Scottish Natural Heritage. Notified features of the site include the bryophyte assemblage, native pinewood, upland mosaic assemblage, invertebrate assemblage, vascular plant assemblage, Moine geology and Cambrian stratigraphy. There were some differences in the relative importance ratings between the assessor and the stakeholder. The former gave more weighting to cultural services, particularly aesthetics (which included the intrinsic value of biodiversity), education and tourism & recreation. The stakeholder (reserve manager) distributed the points more evenly between the ES categories, with the exception of fresh water (provisioning) and water quality (regulating), which were rated more highly. There were a total of eight categories of ES out of a total of 24 where the designated area was assessed as delivering to a greater degree than the surrounding non-designated area. Five of these were classed as cultural services (aesthetics, artistic, education, stewardship and tourism & recreation). This was mainly a result of the visitor facilities, access and field centre that have been implemented as a result of NNR designation. The remaining categories were in genetic resources (provisioning) relating to the distinct race of Pinus sylvestris (Scots pine) in the reserve, climate (regulating) relating to the carbon sequestration by the woodland, and nutrient cycling (supporting), again relating to the processes occurring in the woodland. There were no services in which the designated area was assessed as delivering less than the non-designated area, thus there was no difference between these areas for the remaining 16 services. The first management scenario looked at the consequences of de-designation for ES. Those that would be expected to decrease mostly fall into the cultural ES category: aesthetics, cultural heritage, stewardship, education, and tourism and recreation. This would mainly be caused by the loss of the reserve facilities and programmes. The other ES where delivery would be expected to decrease are food and genetic resources (provisioning), however the only ES where delivery may increase was primary production (supporting), which refers to the potentially increased production of timber.

Nature conservation and ecosystem service delivery
26
The second scenario looked at the changes in ES delivery following the change from favourable to unfavourable condition in the SSSI. In this instance, only three cultural services are likely to decrease: aesthetics, artistic and educational. In addition, water supply (provisioning) and climate and pollination (regulating) are predicted to decrease. Unfavourable condition is likely to involve increased grassiness at the expense of alpine and dwarf-shrub heath species (Ross et al, 2012), which can result in lower rates of long-term C sequestration (Woodin et al, 2009). The other ecosystem services are likely to remain unaffected. For both of these management scenarios, confidence levels in the evidence for the predicted outcomes were rated as higher for cultural ES than for regulating, supporting or provisioning ES. 3.3.5 Abernethy Forest (NNR, SAC and SSSI) before and after (1975 onwards)
acquisition and management by RSPB The completed ESAC framework is attached in Appendix 5. This case-study is temporal in that it assesses the delivery of ES from the RSPB Abernethy National Nature Reserve currently and compares it to when it was managed as a traditional highland estate by the Seafield and Holt/Naylor families. The site today, extending some 13, 713 hectares, contains multiple nature designations within its boundaries including two SSSIs, one NNR, four SPAs, two SACs and a Ramsar site (Loch Avon). It is situated within the Cairngorms National Park and extends from Nethy Bridge in Strathspey all the way to Cairn Gorm (1245 m) and Ben Macdui (1295 m) massifs. The first land acquisition by RSPB (Loch Garten and immediate forest) was in 1975 and almost overlaps Abernethy forest’s SSSI designation in 1972. The multiple designations on the site illustrate its importance for conservation and biodiversity at a national and European level. It is the largest contiguous remnant of ancient Scot’s Pine forest in the UK with exemplar examples of montane habitats including alpine heath, dry heaths, raised bogs and fresh water lochs. These are home to a vast array of iconic and charismatic species such as capercaillie, osprey, Scottish crossbill, dotterel and otter, amongst many others. Over 3,000 species have been recorded at Abernethy, of which 795 are categorised as either a UK BAP/ red list species or as national rare or scarce. In contrast to the other case-studies the assessment was conducted by three assessors; two from the RSPB reserve itself, and one a forestry manager from the Seafield Estate. The assessment was facilitated by Antonia Eastwood. The initial importance ratings for the 24 ecosystem services were scored independently by the conservation manager and the forestry manager. The extensive expert knowledge, both current and historical, of the three assessors ensured that, for such a large and complex site as Abernethy, the assessment was as comprehensive as possible given the short time frame available. The first noticeable finding of the assessment is the marked difference in importance ratings allocated across the ES by the conservation manager and the forester respectively. The conservation manager gave a high rate to cultural-aesthetics (35), cultural-heritage (10) and cultural-education/research (10) and cultural-steward (7). In contrast the forester rated provisioning- energy (11), provisioning- raw materials (11) the highest with the other categories more evenly distributed e.g. cultural-aesthetics (5), climate-regulating (5), cultural-education (5) etc. These differences highlight the difference in values and perspectives of expert opinions based on their professional fields and expertise. In terms of service delivery the designated site performed much better in the majority of the cultural services other than cultural-heritage and cultural-religion, which were ranked equal. This can be attributed to the high level of commitment, resources and capacity invested by RSPB in areas of visitor facilities, access, outreach and education and research. The number of annual visitors exceeds 90,000 of which 36,000 are to the Osprey Centre.

Nature conservation and ecosystem service delivery
27
It was also assessed as delivering greater ES in terms of provisioning-food, regulating-hazard and regulating- soil. The site when managed as a traditional multi-use highland estate scored higher for provisioning –energy (wood fuel) and provisioning fibre (wood fibre). However, the differences in these provisioning services were only marginal and most surprisingly, there was no difference in timber production between the two sites. All the other services were assessed as ranking equally. The marginal or no differences in timber, fuel-wood and wood fibre production between now and when Abernethy was managed as an estate can be explained by the long time-scales involved in timber production in the Highlands (Anderson, pers. comm. 2013). The majority of the Scots pine woods in Strathspey, including Abernethy, were planted after the Second World War. They are, therefore, only just reaching their harvestable size (circa 80-100 years from planting). The Abernethy case-study highlights the importance of time-scales when conducting ecosystem service assessments, as the flow (delivery) can be very dependent on the time-frame used in the assessment. The other interesting finding from Abernethy is that there is no expected trade-off between provisioning-food and cultural-aesthetics ES. In fact the site under conservation management delivers more venison than when it was managed as a sporting estate. This can be explained by the fact that as part of the conservation management objectives of the reserve, to reduce deer numbers for forest regeneration (whilst also removing remnant deer fences to aid capercaillie), deer stalking and shooting has markedly increased on the reserve. In balance, the amount of provisioning-food ES have increased on the reserve, this is even when the livestock farming (hill sheep) by previous tenants on the estate is factored in. In the first scenario explored, where the site was returned to a traditional multi-purpose estate, the levels of cultural services in all the categories other than cultural-religion, would be expected to reduce dramatically. A highland estate would not be able to provide the financial resources required to provide the facilities, staff and infra-structure for all the current educational, research and recreational activities currently supported by RSPB. However, with more woodland management geared towards production, and with the Abernethy forests reaching harvestable age, the provisioning services in terms of timber, wood fibre and wood fuel would increase. The other ecosystem service anticipated to increase over the long-term would be regulating-climate. This is due to the higher levels of carbon sequestration in plantation forests, as opposed to the more open old aged stands. In addition, carbon will also remain locked up in any timber that is used for construction and furniture. Under this scenario there would be a trade-off between cultural services and wood production and carbon sequestration. However, one has to remember the level of RSPB investment in such a high profile and flag-ship nature reserve, the level of which is not typical in the majority of designated sites. In the second scenario explored, improving the condition of unfavourable the bearberry heath on Tulloch moor, there would only have a marginal impact on the ES as the majority of the reserve is in favourable condition already. The confidence levels associated with the ranking and scenarios by the assessors varied according to assessor and type of ES being assessed. High confidence was associated with some of the cultural services provided by the reserve due the availability of good monitoring data on visitor numbers and biodiversity. Less confidence was generally attributed to regulating services where no on-site monitoring data exists but is based on research/knowledge from other sites. One of the difficulties that the assessors found in the ranking ES delivery was assessing whether the change in delivery was actually due to designation or other external socio-

Nature conservation and ecosystem service delivery
28
economic factors e.g. an increase in the mobility of visitors and general public access to the highlands. 3.3.6 Parsonage Down (NNR) compared with adjacent improved grasslands The completed ESAC framework is attached in Appendix 6. The assessment is based on the semi-natural Grasslands chapter of the NEA (Bullock et al, 2012), with local verification and nuances based on the Wessex-BESS project. The NNR is on the southern edge of Salisbury Plain in southern England, and comprises of ancient chalk grassland, arable land, improved and ley grass, and restored chalk grassland, and is managed as a whole by Natural England as a working farm. The case study assesses ES delivery from the chalk grassland component of this NNR, which is managed traditionally by livestock grazing. The chalk downland is the primary focus of the NNR designation, which is valued as an ancient landscape providing habitat for a range of characteristic species, in particular chalk grassland plants such as: field fleawort, early gentian, burnt tip orchid, green winged orchid, frog orchid and fragrant orchid. These biodiversity and landscape attributes can be considered within an ES typology as relating to cultural services, in particular aesthetics, tourism and recreation, and cultural heritage. In comparison to adjacent agriculturally-improved grassland, this chalk grassland scored higher for all cultural service aspects, as these were linked to the greater biodiversity and landscape values. This conclusion is based on assumptions about the links between biodiversity and landscape character and these cultural services; these assumptions have not been well researched and so confidence is low. The higher biodiversity of the chalk downland was also considered to support improved pollination and pest control services (both through higher diversity and abundance of important invertebrates). The application of polluting chemicals to the intensively farmed land, lower soil quality (frequent cultivation and compaction by machinery), and lower organic matter were all considered to decrease the ES of water quality, air quality, and climate change amelioration (higher greenhouse gas fluxes and lower carbon storage). Similarly, the less compacted and well vegetated soils (with deep rooting plants) chalk downland would allow better water infiltration and filtering, thus providing cleaner water, flood alleviation, and replenishment of aquifers. The only negative is that primary production and provisioning of forage to livestock is lower on the semi-natural grassland than on improved grass or arable. These conclusions are based on good to moderate evidence and so have high to medium confidence. The second scenario considered is the restoration of chalk grassland on arable land or improved grassland. Simply, this would be expected to reverse the losses of cultural and other services described above, and to move them towards the values of the traditional chalk grassland. Primary production and related provisioning would drop, but remain high for some time (decades) in relation to chalk downland due to the residual soil fertility. Agricultural improvement as a result of de-designation would have almost instantaneous (<1 year) effects on local biodiversity, soils, water pollution, etc. In the second scenario restoration would begin to have effects immediately (1 year) on soil quality, runoff, carbon sequestration, etc. These effects will accumulate over time and biodiversity impacts will become apparent. However, complete restoration of biodiversity and ecosystem services to the status of chalk grassland would take many decades (> 50 years).

Nature conservation and ecosystem service delivery
29
3.3.7 Drumochter Hills (SAC) compared with Dalnacardoch (non-designated area)
The completed ESAC framework is attached in Appendix 7. The case study assesses the delivery of ES from the Drumochter Hills which is under SSSI, SAC and SPA designation compared with the neighbouring Dalnacardoch estate which is largely a non-designated area (see Map Tab in Appendix 7). The Drumochter Hills is a large upland site 23km North-West of Blair Atholl and 1km south of Dalwhinnie. It comprises of a series of rounded summits/high altitude plateau cut by steep sided corries and stream gullies. The site was designated an SAC in 2005 because it provides an example of European dry heaths in the central Scottish Highlands. The SAC also provide good examples of Alpine and Boreal heaths, sub-arctic willow scrub, extensive areas of blanket bog and other priority habitats. Drumochter Hills is also designated as an SPA because of the dotterel and merlin. The principal forms of management on this site have traditionally been upland sheep farming, deer stalking and grouse shooting. Areas of heath are managed by traditional muirburn practices, and this is generally appropriate. Deer cull targets are set annually by the West Grampian Deer Management Group with advice from the Deer Commission for Scotland. Dalnacardoch estate includes part of the above designated area but is largely undesignated. It is a large upland site south of Dalwhinnie and north east of the A9. Comprised mainly of rounded hills, with a steep rocky escarpment where the estate joins the A9 opposite Dalnaspidal lodge and a small patch of woodland/coniferous plantation to the south west of the site. An estate track runs north to south on the eastern side of the estate. The estate employs two full-time game keepers and two part-time keepers. The estate is managed predominately for deer stalking, however they also shoot grouse (secondary activity). The annual deer cull has increased over the past 10 years in an attempt to reduce deer numbers. Some heather burning is conducted but heather is quite sparse on the estate. The following predators are controlled - crows, foxes, stoats and weasels. The estate comprises habitats similar to the designated area and typical of upland/montane vegetation. It is mainly of a heather/grass mosaic with predominantly wet heathand and blanket bog on deeper peat. These habitats are of European Importance but are not currently under designation. There has been no quantification of ES. However, there is data on habitat condition for the qualifying features on Drumochter hills and for habitat condition of upland heaths and bird diversity on Dalnacardoch. These assessments indicate that the habitats are mainly in unfavourable condition on both the designated and non-designated areas but the extent of sub-arctic willow scrub and tall herb communities is restricted to areas less accessible to grazing animals. The assessment carried out using the ESAC process indicates that the designation on Drumochter relates to only one of the ES categories: cultural-aesthetic. In this case it is the intrinsic value of the habitats and species which the site provides. Although the site provides more or less the full set of ES, only three were regarded as being important and these were all in the cultural services category. Because of the upland nature of the site, as well as providing habitats and species of intrinsic importance, the site also provides recreational opportunities in the form of deer and grouse shooting and the socially important role of providing an arena for communities based on traditional activities and the values associated with this way of life. Our assessment indicated that the designation was unlikely to have changed the trajectory of ES delivery except in two cases. First, designation may increase the education value of the area because the monitoring will generate knowledge. However, because of the location and the lack of public facilities this is unlikely to be of relative importance compared to the other ES. Second, designation may decrease deer stalking and grouse shooting opportunities if lower grazing pressure and less intensive grouse moor management is the result.

Nature conservation and ecosystem service delivery
30
Overall, our assessment indicates that there is very little difference in the ES provision between the designated area and the non-designated area. They have similar habitats and are used for similar purposes. Landscape characteristics are similar and the condition of the habitats are similarly, in unfavourable condition. This may well be a common occurrence in these large upland areas which are often remote from urban areas and not currently used for provisioning services because of their nutrient poor soils. Thus the impact of activities to generate provisioning services is not largely affected by designated, although if these activities were to increase then they would be likely to have a negative effect. Thinking about the scenarios: In the first case, losing the designation may lead to more opportunities for traditional field sports and the ways of life associated with these because higher deer densities would be possible (and potentially increases in livestock). Although currently the designation does not seem to infer improved condition on this site, de-designation could potentially result in deterioration if domestic and wild herbivore numbers increased, but we have no hard evidence to support this. In contrast, moving to favourable status is likely to mean reducing grazing pressure and benefit some of the habitats that are currently in unfavourable condition, but not all. However, this may reduce deer stalking opportunities and may be restrict development such as renewable energy. This is the main trade-off we have identified. However, it is not clear how moving to favourable status for the habitats is likely to influence ES delivery over and above what is already delivered unless it can be shown that ES such as water quality and carbon sequestration may improve. Yet there is little data on these ES for these sites. So although we have reasonable data on biodiversity indices, our assessment of the ES delivery from these sites is based on individual judgement with a high degree of uncertainty in most cases reflecting expert opinion on what is likely but this is not based on any actual ES delivery data. 3.3.8 Loweswater catchment (Lake District National Park) a comparison of
land before and after agri-environment schemes The completed ESAC framework is attached in Appendix 8. The case-study assesses the delivery of ES from the Loweswater catchment, a small (<8km) mixed upland/lowland catchment in the north-west lake district. The designation chosen is a temporal one representing the catchment post agri-environment schemes introduction (early 1990s) (designated) and the period preceding that (~’70-’90) (non-designated). The Environmentally Sensitive Area Scheme (ESA) was launched in the early 1990s in the Lake District to help protect the Lakeland fells and its cultural farming landscapes containing a valuable assemblage of less-intensive agriculturally managed landscapes. In terms of an ES framework many of these goods are more important as cultural services than as provisioning services. According to the assessment the designation of the catchment under agri-environment schemes resulted in marginal improvements in the provision of a range of ES including cultural (education and stewardship) and regulating (water and soil quality and pollination) services. In all other 15 assessments there was no difference between the designated site and non-designated site. The two scenarios considered relate to scenarios tested using catchment modelling as part of a community catchment management project at Loweswater. The scenarios tested potential extreme agricultural management changes in the catchment specifically targeted at water quality. Whilst these were selected for a specific purpose, they have relevance here for understanding how management decisions which may or may not be in line with agri-environment designations are likely to impact on ES provision. According to the assessment, the ES that would be expected to decrease (within five years) if cattle were removed from the catchment are: cultural-heritage, cultural –stewardship, provisioning-food, provisioning –

Nature conservation and ecosystem service delivery
31
genetic, regulating-pollination and regulating-nutrient cycling. ES that would be expected to increase would include regulating-air-water-climate-soil-diseases/pests and supporting primary production (with more resource available to different species). Losing cattle would therefore involve trade-offs which could see benefits to the catchment which would need to be weighed against losses of cultural services, income to farmers (though this may actually be negative when beef prices are low), the biodiversity value of cows in opening up turf for herbaceous species and food production. The second management scenario explored in the case-study was a change in management away from stock farming to woodland. Under this scenario, the ES expected to increase would be, provisioning-energy, provisioning-raw materials, regulating-climate, regulating-air quality, regulating-hazard, regulating-water quality, regulating-soil quality, regulating-diseases and pests, supporting-soil formation, supporting nutrient cycling, supporting-water cycling and supporting-primary production. Those that would be expected to decrease are cultural-aesthetics, cultural-artistic, cultural-heritage, cultural-stewardship, cultural-tourism and recreation, provisioning-food, provisioning-genetic resources, regulating-pollen, supporting-soil formation, supporting-nutrient cycling, supporting-water cycling and supporting-primary production. The confidence level associated with the changes of delivery was mostly assessed as being ‘high’ due to the intensive way in which this catchment has been studied (both human and natural components). Additional comments Some ES changed over time regardless of the designation. Whilst not included in the case study, these changes were significant and highlight the importance of considering change resulting from external drivers (context) when looking at the success of designation. At Loweswater, changes in markets for food and fibre and changes in the demographics of the local population and resultant impacts on land management arrangements impacted negatively on ES production within the catchment separately from agri-environment designation. It should also be noted that the incidence of Foot and Mouth Disease (FMD) in the locality in the early 2000s did a great deal to alter perceptions about what was important in terms of ES delivery from locations such as Loweswater. Realisation that the important cultural services delivered by landscapes such as this are reliant on both natural capital and human interactions with it dawned when the countryside was essentially ‘closed’ for access during FMD, affecting farmers and services operators in FMD areas and visitors alike. 3.3.9 The River Dee (SAC) compared with the River Don The completed ESAC framework is attached in Appendix 9. The last case-study explores the delivery of ES from the River Dee and River Don in north-east Scotland. Both of these rivers originate in the Cairngorm Mountains and enter the North Sea at Aberdeen, at Aberdeen harbour and Bridge of Don (respectively). The Dee is regarded as of national importance as an excellent example of a highland eroding river, with high headwaters and characteristic fauna and flora. Iconic to the River Dee is the Atlantic salmon as well as the related sea trout. The most prized fish is the spring running salmon, attracting fishermen, from the UK and beyond. The River Don is reputed to be one of the finest wild brown trout rivers in Scotland, well known for its size and quality. For much of their length both the River Dee and River Don have excellent to good water quality. However, as the watercourse travels through the agricultural land in the lowlands it deteriorates, primarily due to defuse pollution from agriculture and urban run- off, causing

Nature conservation and ecosystem service delivery
32
eutrophication. For example, the Loch of Skene (River Dee) has been affected by phosphorous enrichment leading to frequent algal blooms during summer months. Both the River Dee and River Don have water bodies that are notified as of significant risk of failing ‘good ecological status’ of the Water Framework Directive. The Blacklatch Burn and Elrick Burn in the River Don have both been categorised as poor by the Scottish Environment Protection Agency (SEPA). The two catchments vary greatly in the quantity and degree of nature designations. Both originate in the Cairngorm National Park, with the River Don catchment encompassing four SSSIs and two SACs. In contrast the River Dee catchment encompasses, if not totally than partially, five NNRs, seven SPAs, 11 SACs, three Ramsar sites and 28 SSSIs. However, for this particular assessment the important difference in designation is that the River Dee itself, and the majority of its tributaries, are designated an SAC along its full course. In contrast, the River Don is only an SAC in the upper headwaters (Ladder Hills). The River Dee was designated an SAC (along most of its course) in 2005 because of its Atlantic salmon, freshwater pearl mussel and European otter. All three species are also present in the River Don (only remnants of freshwater pearl mussel remain in River Don) and have statutory protection through the Wildlife and Countryside Act. For the assessment of ES the assessor only considered the actual water courses themselves and surrounding riparian habitats, rather than the whole catchments which are an extensive mosaic of habitats and different land use types. The highest importance ratings attributed to the ES delivered by the two rivers were cultural-aesthetics (10), cultural-heritage (8), cultural-stewardship (8), cultural-tourism and recreation (10), provisioning-freshwater (10), regulating-water quality (10) and regulating hazard (8). Both rivers supply public and private water throughout Aberdeenshire and Aberdeen itself. They are also both renowned for their fisheries; specifically Atlantic salmon (Dee) and brown trout (Don). The salmon fishery alone on the Dee generates approximately £11.6 million for the local economy and supports around 500 full-time equivalent jobs. Both rivers have statutory fishery boards which are responsible for protecting and enhancing stocks of salmon, sea trout, and brown trout. They also have established charitable trusts (River Dee Trust, River Don Trust) with the aims of conserving and enhancing the natural biodiversity associated with the respective freshwater environments. Both the trusts have active fishery management plans which they implement and update regularly. From the 24 ecosystem services assessed, seven services ranked higher in the designated site (Dee). These were cultural-aesthetics, cultural-artistic, cultural-education, cultural-stewardship and cultural-tourism/recreation, provisioning-genetic resources and regulating-water quality. The two sites differed by only one rank in all these categories. The River Don ranked higher in two categories; provisioning-energy (micro-hydro) and provisioning- food (fish). The River Don still has operating net fisheries along its course and although catch and release it encouraged, as well as seasonal limits (per angler) on the number of fish retained (RDT, 2009), the level of provisioning services would be higher than the Dee. The River Dee has a 100% catch and release policy and legal netting is no longer practised on the Dee (DDSFB, 2009). Poaching of salmon does occur on the Dee with around 40 reported incidents a year.
One of the main impacts of designation has been the ability of the stakeholder groups in the River Dee catchment to leverage funding and resources to undertake and protect the notified features of the river; Atlantic salmon, freshwater pearl mussel (FPM) and otter. The formation of the Dee Catchment Partnership (this is a voluntary initiative and independent of river basin planning) and the agreement of the Dee Catchment Management Plan (Cooksley, 2007) are partly due to the SAC designation. This enhanced capacity, focus and networking has resulted in the Dee benefiting from many spin-off projects ranging from LIFE CASS (Conservation of Atlantic salmon, 2004-2008), LIFE Pearls in Peril (2012-2016) to the

Nature conservation and ecosystem service delivery
33
Think Tank project, an initiative aimed at improving the management of septic tanks in the Dee catchment (to reduce diffuse pollution). The main threats to both the Atlantic salmon and FPM is diffuse pollution and degraded habitats (for FPM to reach favourable condition water quality has to be at the top end of High Ecological Status) a focus of the LIFE projects and DCMP is to improve water quality along its course. Management activities and initiatives such as; gravel bed restoration, riparian habitat restoration, fencing (to reduce soil erosion, improve bank stability and reduce agricultural run-off), public education on septic tanks, removal of coniferous plantations in riparian zones, construction of silt traps, ditch blocking, removal of artificial obstacles etc. have not only lead to improvements in water quality (regulating-water quality) but also in the riverine habitats for migrating salmon and FPM. All the above initiatives have extensive outreach, education, public awareness and monitoring programmes resulting in enhanced delivery of many of the cultural services; aesthetic, artistic, stewardship, education/research and tourism/recreation. The case-study explored one scenario: the designation of the River Don as an SAC. Under this scenario the ES expected to go up are; cultural-aesthetics, cultural-artistic, cultural-education/research, cultural-stewardship, regulating-climate, regulating water-quality and provisioning genetics resources. This would, in turn, have an impact (trade-off) on provisioning-food (fish) and provisioning (energy). One of the challenging aspects of this assessment was to separate the impact of designation on cultural services-recreation/tourism due to the additional but significant influence (external factor) of Royal Deeside and that of the actual designation. 3.3.10 A combined analysis across all case studies The data from all the case studies was analysed in three ways. Firstly, the ES delivery ranks were compared between the non-designated and designated sites. The data were converted from the ‘low’, ‘medium-low’, ‘medium-high’ and ‘high’ classifications into an ordinal set of scores from 1 to 4. As the data was ordinal, a non-parametric test was necessary to account for the type of data. A Friedman test with designated/non-designated as the groups and case-study as the blocking factor was therefore used to assess the null hypothesis that there was no difference in ratings between the two types of site. Only the data from the assessors was used, as there were too few stakeholder assessments to provide a meaningful comparison. However, a two way-analysis of variance of assessor/stakeholder by designated/non-designated (with case-study as a blocking factor) showed no overall difference between the total scores between assessor and stakeholder (p = 0.0164) for the three case-studies with both scores. Secondly, for each service these ordinal rating scores were multiplied by the relative importance rating and the resulting products summed across all services. The totals were then tested using an analysis of variance with the same design as the Friedman test above. Thirdly, the difference between the ecosystem delivery ranks for the non-designated and designated sites for each service was correlated together. This effectively addresses whether the benefits and dis-benefits of designation for individual services show any patterns that can identify groups of services that could be seen as a ‘bundle’ that effectively behaved in the same way, or services that showed a trade-off as they were negatively correlated. As the data are ordinal, a Spearman rank correlation was used to assess this correlation. Analysis of the individual ecosystem delivery ratings (Table 5) showed that there were consistent differences in ranking between designated and non-designates sites for eight of the 24 services. In all cases these differences were positive, i.e. the designated sites had

Nature conservation and ecosystem service delivery
34
higher mean ratings than the non-designated sites. The significant differences were concentrated in the cultural services category (4) and the regulating (3). Against expectations, there was no consistent negative impact of designation on the provisioning services across the case-studies. The cultural services were considered by a relatively high number of assessors to be part of the reason for designating sites, so it is not surprising that these were identified by the analysis as differing between the two types of site. Table 5 also shows the mean confidence of the assessors in making these ratings. These ranged from 1.22 to 2.78 (minimum possible = 1, maximum = 3). There was no pattern between confidence and significance. The total service delivery was significantly higher on the designated sites (296) compared to the non-designated sites (229, minimum = 100, maximum = 400, Table 5). This method of assessment clearly indicates that designated sites are delivering higher levels of ES than non-designated sites, with the difference mainly dependent on higher levels of cultural and regulating services. Performing a correlation analysis across the 24 services means carrying out 276 correlations. This means that there is a high likelihood of significant correlations appearing by chance – in this case at a significance level of p = 0.05, 276/20 = 13.8 would be expected. Table 6 shows that there were 23 instances where the correlation coefficient was more extreme than that indicating p = 0.05. This indicates that overall there was no great level of correlation between the services enhanced by designation. However, there was a high degree of correlation amongst the cultural services; 6 out of the 21 possible correlations were significant (and positively so). This suggests that there may be a possibility of treating cultural services as a ‘bundle’. This pattern was not, however, repeated across the other service categories. Other notable features of the correlation matrix included the positive correlation between genetic resources and a number (3) of cultural services and negative correlations between food and fibre production with regulating services including air quality and diseases and pests, and the provisioning of fresh water. Also notable was the number of correlations (4) between the supporting service water cycling and a range of different cultural, provisioning and regulating services.

Nature conservation and ecosystem service delivery
35
Table 6. Test of the differences between individual and total service delivery between designated and non-designated sites. p-values are from a Friedman test, with significance levels indicated by * 0.05 ≤ p < 0.01, ** 0.01 ≤ p < 0.001. Also shown are the proportion of cases where it was thought that the service was an influence on designation and the mean confidence score of the assessors (scale from a minimum of 1 to a maximum of 3).
Category Services p-value
Significance
Proportion of cases where service was a reason for designation
Mean confidence of assessors
Cultural Aesthetics 0.008 ** 1.00 2.78
Artistic 0.025 * 0.11 1.67
Cultural heritage 1.000 0.22 2.00
Education 0.005 ** 0.44 2.22
Religious 0.317 0.00 1.22
Stewardship 0.008 ** 0.22 2.22
Tourism/Recreation 0.059 0.11 2.22
Provisioning Energy 0.157 0.00 2.33
Fibre 0.317 0.11 2.22
Food 0.564 0.11 2.33
Freshwater 0.083 0.00 1.89
Genetic Resources 0.025 * 0.00 1.78
Raw Materials 0.564 0.00 2.33
Regulating Air Quality 0.157 0.00 1.78
Climate 0.103 0.11 2.22
Diseases/Pests 0.157 0.00 1.89
Hazard 0.157 0.00 1.67
Pollination 0.025 * 0.11 1.78
Soil Quality 0.025 * 0.11 2.11
Water Quality 0.045 * 0.00 1.89
Supporting Nutrient Cycling 0.083 0.00 1.89
Primary Production 0.564 0.11 2.11
Soil Formation 0.157 0.00 2.22
Water Cycling 0.083 0.00 2.11
Total All Services 0.005 ** - -

36
Table 7. Spearman rank correlation coefficients for the difference between rankings of designated and non-designated sites. For probability levels between 0.05 and 0.01, rs values are shown in bold, whereas for levels between 0.01 and 0.001 they are in bold and underlined. Critical values for the Spearman rank correlation are p = 0.05 rcrit= 0.700, p = 0.01 rcrit= 0.833, p = 0.001 rcrit= 0.933. CULTURAL PROVISIONING REGULATING SUPPORTING
AE
ST
HE
TIC
S
AR
TIS
TIC
CU
LTU
RA
L H
ER
ITA
GE
ED
UC
AT
ION
SP
IRIT
UA
L/R
ELI
GIO
US
ST
EW
AR
DS
HIP
TO
UR
ISM
/RE
CR
EA
TIO
N
EN
ER
GY
FIB
RE
FO
OD
FR
ES
HW
AT
ER
GE
NE
TIC
RE
SO
UR
CE
S
RA
W M
AT
ER
IAL
S
AIR
QU
ALI
TY
CLI
MA
TE
DIS
EA
SE
S/P
ES
TS
HA
ZA
RD
PO
LLIN
AT
ION
SO
IL Q
UA
LIT
Y
WA
TE
R Q
UA
LIT
Y
NU
TR
IEN
T C
YC
LIN
G
PR
IMA
RY
PR
OD
UC
TIO
N
SO
IL F
OR
MA
TIO
N
WA
TE
R C
YC
LIN
G
CU
LTU
RA
L
AESTHETICS -
ARTISTIC 0.42 -
CULTURAL HERITAGE 0.00 0.47 -
EDUCATION 0.19 0.68 0.43 -
SPIRITUAL/RELIGIOUS 0.44 0.32 0.75 0.07 -
STEWARDSHIP 0.09 0.73 0.29 0.90 -0.07 -
TOURISM/RECREATION 0.34 0.76 0.35 0.76 0.15 0.81 -
PR
OV
ISIO
NIN
G
ENERGY -0.27 0.06 0.57 0.65 0.19 0.44 0.17 -
FIBRE -0.44 -0.32 -0.75 -0.07 -0.07 0.07 -0.15 -0.19 -
FOOD -0.25 -0.21 -0.44 0.34 -0.57 0.34 0.13 0.37 0.57 -
FRESHWATER 0.54 0.63 0.50 0.14 0.50 0.10 0.30 -0.19 -0.50 -0.71 -
GENETIC RESOURCES 0.45 0.91 0.48 0.73 0.36 0.73 0.61 0.22 -0.36 -0.22 0.53 -
RAW MATERIALS -0.29 -0.21 0.00 -0.64 0.08 -0.48 -0.33 -0.55 -0.08 -0.68 0.05 -0.24 -

Nature conservation and ecosystem service delivery
37
CULTURAL PROVISIONING REGULATING SUPPORTING
AE
ST
HE
TIC
S
AR
TIS
TIC
CU
LTU
RA
L H
ER
ITA
GE
ED
UC
AT
ION
SP
IRIT
UA
L/R
ELI
GIO
US
ST
EW
AR
DS
HIP
TO
UR
ISM
/RE
CR
EA
TIO
N
EN
ER
GY
FIB
RE
FO
OD
FR
ES
HW
AT
ER
GE
NE
TIC
RE
SO
UR
CE
S
RA
W M
AT
ER
IAL
S
AIR
QU
ALI
TY
CLI
MA
TE
DIS
EA
SE
S/P
ES
TS
HA
ZA
RD
PO
LLIN
AT
ION
SO
IL Q
UA
LIT
Y
WA
TE
R Q
UA
LIT
Y
NU
TR
IEN
T C
YC
LIN
G
PR
IMA
RY
PR
OD
UC
TIO
N
SO
IL F
OR
MA
TIO
N
WA
TE
R C
YC
LIN
G
RE
GU
LAT
ING
AIR QUALITY 0.66 0.00 0.13 -0.32 0.75 -0.40 -0.13 -0.28 -0.75 -0.42 0.25 0.06 0.12 -
CLIMATE 0.66 0.58 0.00 0.41 0.31 0.41 0.33 0.00 -0.31 0.16 0.20 0.65 -0.51 0.46 -
DISEASES/PESTS 0.66 0.47 0.63 0.34 0.75 0.13 0.23 0.28 -0.75 -0.42 0.75 0.54 -0.37 0.50 0.46 -
HAZARD 0.28 0.48 0.57 0.38 0.66 0.33 0.57 0.29 -0.66 0.06 0.19 0.33 -0.31 0.43 0.46 0.43 -
POLLINATION 0.54 -0.19 0.25 -0.13 0.60 -0.26 -0.11 0.11 -0.60 -0.32 0.30 -0.07 -0.15 0.65 0.10 0.65 0.17 -
SOIL QUALITY 0.54 0.19 0.25 0.06 0.60 0.05 0.13 0.11 -0.60 -0.02 0.30 0.16 -0.45 0.65 0.59 0.65 0.62 0.68 -
WATER QUALITY 0.28 0.39 0.61 -0.02 0.61 0.02 0.08 0.00 -0.61 -0.69 0.82 0.33 0.11 0.31 0.08 0.71 0.23 0.53 0.53 -
SU
PP
OR
TIN
G NUTRIENT CYCLING 0.54 0.16 0.00 -0.05 0.50 -0.05 -0.05 -0.19 -0.50 -0.27 0.00 0.39 0.16 0.75 0.61 0.25 0.19 0.30 0.30 0.00 -
PRIMARY PRODUCTION -0.01 0.21 -0.38 0.46 -0.66 0.50 0.36 0.12 0.66 0.72 -0.11 0.07 -0.70 -0.60 0.20 -0.16 -0.06 -0.39 -0.04 -0.31 -0.55 -
SOIL FORMATION 0.66 0.00 -0.50 -0.02 -0.19 -0.10 -0.13 -0.28 0.19 0.12 0.25 0.0 -0.49 0.22 0.46 0.34 -0.28 0.34 0.34 0.05 0.13 0.42 -
WATER CYCLING 0.86 0.26 0.16 0.07 0.57 -0.10 0.03 -0.06 -0.57 -0.32 0.60 0.34 -0.37 0.70 0.60 0.86 0.25 0.72 0.72 0.51 0.44 -0.10 0.70 -

38
3.4 Discussion The discussion on the delivery of ES from designated and non-designated will be centred upon the key questions set out in the objectives of the chapter. We will use the findings from the individual case-studies and our combined analysis to discuss the impact of designation or conservation management on the delivery and subsequent trade-offs of ecosystem services. 3.4.1 The delivery of ecosystem services from land that is not managed for
nature conservation The types of ES that are delivered from land not managed for nature conservation is context specific and largely dependent on the land use (governed to some extent by the land capability of the site) and management objectives of the site. For example, a large proportion of the uplands in Scotland and England are too unproductive (marginal) for arable crops or improved grasslands but are suitable for livestock grazing (sheep and cattle). They may also be suitable for upland land use systems such as grouse shooting, deer staking and forestry as practiced by typical sporting estates (see case-studies five and seven). These traditional land management practices are delivering both provisioning services (venison, lamb, timber) and cultural services in terms of recreation and heritage (grouse shooting and fishing). In contrast, in the more productive lowland land-use systems, such as the chalk grasslands on the Salisbury plain (case-study 6), livestock and arable farming are the primary objectives of land management outside of designated site and this is reflected in the higher levels of provisioning services (lamb, beef and wool). From the above nine comparative case-studies we can see that land that is not specifically managed for nature conservation delivers a wide range of services and benefits from cultural, provisioning to regulating and supporting. It is the extent to which these are delivered, taking into consideration the land use, management objectives and specific context of the site, which determine their relative delivery in comparison to designated sites or those under conservation management. For example, the majority of the land that was once classified as raised bog, of which the remaining is now mostly protected, has already been extracted or cut over and subsequently afforested with conifer plantations. The main ES being delivered from fully or partially converted raised bogs include provisioning-fuel (peat), provisioning-timber, provisioning-raw materials (peat for horticulture) and provisioning-fibre (wood). These converted raised/blanket bogs still deliver cultural, supporting and regulating services but to a much lesser degree than the original ecosystem. For example, the non-designated comparator for the Sletill Peatlands site (case-study 2) ranks lower in the delivery of two regulating services (water quality and climate) and three out of the four supporting services. The length of time that blanket bogs can continue to deliver the provisioning (fuel) and cultural (heritage) services associated with traditional peat cutting is limited by the nature of the finite resource and the rate of extraction. The general trend, as seen from the review chapter (Chapter 1), is that land not managed specifically for nature conservation tends to deliver more in terms of provisioning services and less in terms of regulating services. Interestingly, across the nine case-studies assessed, there was no significant difference between non-designated and designated sites in terms of the delivery of provisioning services. Although the non-designated sites did in most cases deliver more in terms of provisioning services, the differences, according to the case-studies, where only marginal and not equally across all the types of provisioning services. This result may reflect the fact that, apart from the chalk grassland case-study (6), the comparator sites are located in marginal areas of low productivity. This in turn may be an
Nature conservation and ecosystem service delivery
39
indication that designated sites tend to exist on land that has not already been converted to agriculture or forestry (the less productive areas). The analysis of service delivery across all the case-studies (Table 5) showed that non-designated areas delivered less in terms of cultural aesthetics, cultural-education/research and cultural-stewardship services. However, they did not deliver significantly less in the cultural service- recreation/tourism or cultural-heritage. For example, the Boat of Garten woods (Strathspey) and Forest of Falkland (Fife), as many local wood lands across the UK, provide a huge amenity service for local communities and their importance and value cannot be underestimated. Their importance and value is largely based on their close proximity to people and their accessibility, which again highlights the importance of scale and context with regards to ES delivery. In addition, one must not disregard the cultural heritage services that are strongly associated with traditional land management practices such as livestock farming in the Lake District and deer stalking on highland estates. With regards to trade-offs on non-designated sites, there are definite trade-offs between the provisioning services (notable food and fibre) and the delivery of regulating-air quality, regulating-diseases/pests and provisioning-water. These trade-offs are across all the nine case-studies as demonstrated by the significant negative correlations in Table 6. This trade-off between provisioning and regulating services are most apparent in the raised bog, blanket bog, chalk grassland and Loweswater case-studies. The services, disservices and trade-offs associated with land not managed for nature conservation is governed by the spatial and temporal context of the system (biophysical, social, economic and political), which in turn effects the type of land use and management on that site. An example of this contrast between the magnitudes of services, trade-offs and disservices associated with the provisioning and regulating ecosystems services and subsequent disservices is the calcareous grasslands in North Uist and those on the Salisbury plains. 3.4.2 The effects of designation and conservation management on ecosystem
service delivery So what are the likely effects of designation conservation management on the delivery of ecosystem services? Well, if we exclude cultural aesthetics, as the main reason for the original designation to fall into this category, then the main effect of designation has been an increase in the other cultural services, namely artistic, education/research and stewardship. This is supported by the analysis of the individual ecosystem delivery rankings (see Table 5). The effect of designation on cultural services is particularly apparent for the case-studies which have been assessed on National Nature Reserves namely, Beinn Eighe, Abernethy and Parsonage Down either spatially or temporally. All these reserves have invested significantly in public access, amenity and education facilities resulting in enhanced delivery of many of the cultural services, including education and research, stewardship and recreation/tourism. This is exemplified by the RSPB Abernethy which has over 90,000 visitors to the reserve, of which around 36,000 are to the Loch Garten Osprey Centre. The knock on effects to the local economy, although not easily quantifiable, can be seen by local village festivals such as Osprey Festival (a music festival) or branding such as the ‘Osprey village’ or ‘Forest village’. With a focus on conservation management, inevitably, some provisioning services such as timber, meat, dairy and arable crops tend to have reduced. Interestingly, although sheep grazing has virtually been eliminated in Abernethy, provisioning services have notably increased. This is due to the increase in deer stalking and hence venison (around £12,000 per year) as part of the reserves woodland management regime.
Nature conservation and ecosystem service delivery
40
Many of the regulating services (pollination, carbon sequestration, water quality) are also higher in the majority of the designated sites. This again is supported by the analysis of the overall ecosystem delivering rankings. This is primarily due to the improved condition, or prevention of further degradation, of priority habitats such as dwarf shrub heath, semi-natural grasslands and, raised and blanket bogs. For example, Rora Moss (SSSI) provides high levels of regulating services in terms of carbon sequestration, water quality, pollination, soil quality and the associated supporting services than the nearby cut-over and exploited Middlemuir Moss. A possible exemption is Abernethy forest, where in the next 10 years if managed as multi-purpose woodland, rather than primarily for nature conservation, carbon sequestration would be higher. This is due to the fact that a large proportion of carbon remains locked up in timber used for construction, even when taken off site. In addition, the planting densities and age of the trees in plantations would sequester more carbon than older more mature trees (iconic granny Scot’s pines). To date the differences in any regulating services between the RSPB reserve and the comparative highland forestry estate would have been negligible due to the long time frame for forests to reach harvest age in the Highlands, c. 80 years (Will Anderson, pers. comm., 2013). For some of the case-studies, the effect of designation or broader conservation actions (such as agri-environment schemes) has had little or apparent no effect on the delivery of ecosystem services. This is particularly the case for the Loweswater catchment (case-study 8) and the Drumochter Hills (case-study 7) where neither designation (SSSI, SAC or SPA) nor the agri-environment schemes had have a notable impact on the delivery of ecosystem services. The Drumochter Hills, a large site in the central highlands, may be typical for many upland areas where nutrient poor soils limit the extent of provisioning services and their isolation constrain them in their ability to offer a significant tourist attraction and amenity, above and beyond traditional deer stalking and grouse shooting. In fact, the cultural-heritage and cultural-recreation services may actually reduce in these designated sites as the main conservation objective, reducing deer/sheep numbers to improve habitat condition, may actually impact on opportunities for deer stalking. The notified habitats on Drumochter Hills are in very similar condition (mostly unfavourable) to that in the adjacent non-designated areas and so there are no enhanced benefits, at least currently, in terms of regulating services. However, current monitoring and management prescriptions are working towards reducing grazing impacts on the Drumochter SAC and this essentially involves attempts to agree on reducing herbivore pressure. The problem remains of how to manage an SAC when it forms part of a larger management unit. Although there are few barriers against the movement of wild deer, there are fences preventing animals crossing the A9 (which forms one of the boundaries) and this has the effect of holding the deer in this area and potentially increasing the gazing pressure in areas near to the fence. As for land outside designated areas the ecosystem services, disservices and trade-offs associated with land managed for nature conservation is governed by the spatial and temporal context of the system (biophysical, social, economic and political), which in turn effects the type and intensity of management (conservation effort) on the site. In some cases, the differences in delivery of ecosystems services (and associated trade-offs and disservices) between designated and non-designated sites is only marginal as for Loweswater and Drumochter Hills, whereas in other cases the difference can be large such as Parsonage Down, Abernethy Forest, Beinn Eighe and the River Dee. 3.4.3 Economic valuation of marine ecosystem services Across all the case-studies assessed, a favourable habitat condition on designated sites had significant positive effects on the delivery of regulating services; particularly pollination, soil quality and water quality. Favourable condition of peat land and heath land habitats (raised

Nature conservation and ecosystem service delivery
41
bog, blanket bog, dwarf-shrub heath, alpine heath, dry heath) such as those assessed in the Abernethy (5), Beinn Eighe (4), Sletill (2), Rora Moss (3) and Drumochter (7) case-studies, also delivered better (or would do) in terms of carbon sequestration (regulating-climate). This is particular relevant for peat forming habitats which rely on the deposition of sphagnum mosses to accumulate peat. The habitat condition of a site wouldn’t necessarily impact on the aesthetics of the area unless it, in turn, had a substantial effect on the visual landscape aesthetics of an area (plantation Scot’s pine compared with ancient, open Scot’s pine woodland) or the delivery of charismatic species such birds, butterflies and orchids or those species and habitats of high conservation value. However, unfavourable or poor habitat condition may result in a decrease in other cultural services such as education, research and stewardship. Cultural heritage services may actually, in some cases, decrease as a result of improving habitat condition (by reducing grazing impacts) in upland areas with traditional hill farming or deer stalking for recreation. 3.4.4 Can condition monitoring of designated sites be used to determine ES
delivery? In the case-studies assessed, only one or two of the twenty-four ES could possibly be monitored using condition monitoring. The most obvious ES that could be monitored using condition monitoring is the one that directly relates to biodiversity as a good in its own right i.e. the cultural-aesthetics service. However, the cultural-aesthetics ES (and associated benefits) is very context dependent, especially in terms of accessibility and use of the site by people and hence the benefits they receive. Some designated areas may have exceptional biodiversity much in favourable condition. However, the site may be located in a remote area with poor accessibility and infrastructure, which limits the beneficiaries and the benefits (could be limited to just existence and intrinsic benefits). In turn, woodland in unfavourable condition, but with close proximity to a town and free car-parking, may provide considerable benefits to the local community in terms of recreation and amenity (dog walking, jogging, den building). None of the other cultural services and benefits (which can intertwine with provisioning services) can be effectively monitored using condition monitoring as the delivery of that service is dependent how many people benefit (or dis-benefit) from that service, which in turn depends on the stakeholders in question and the relative values they place on the service and its associated benefits. The ES that could be assessed using condition monitoring are those regulating services where the habitat condition directly affects the functioning of that ecosystem to deliver that service. So for example, this is where the species richness of flowering herbaceous plants in a semi-natural grassland would potentially be an indicator for the supply of regulating-pollination services. However, this again is spatially and contextually specific; as the benefits to people would depend on the other types of land-use in the area and the beneficiaries of the service (gardeners, orchard owners, farmers). The one service that could possibly be assessed approximately by condition monitoring is that of carbon sequestration (regulating-climate) for peatland and heathland habitats; blanket bog, raised bog, and wet heaths as their functionality, sequestration of carbon, is correlated to aspects of their condition; namely through the presence and abundance of peat forming species such as Spaghnum mosses. Carbon sequestration is considered a national/global good or service and hence the beneficiaries are considered to be global and hence spatial context is not relevant in assessment. So, in summary, as ecosystem services are governed to a large extent by the beneficiaries, an assessment of habitat condition, with the possible exception of carbon sequestration on

Nature conservation and ecosystem service delivery
42
peatlands and heathlands, will not be a good indicator of their service to people. A range of indicators or indicator bundles, that cover the full range of services that designated sites provide needs to be developed to go alongside condition monitoring of habitats and species. These indicators would need to be spatially and contextually flexible to accommodate the variety of designated sites and conditions. Developing these methods and providing the resources for this additional monitoring in designated areas and the wider countryside needs to be addressed. 3.4.5 Evidence and assumptions made to conduct the assessments The assessments for the case-studies were conducted using expert opinion (judgement), usually from one expert, sometimes two, within a very short time frame, using only data and information that already existed in accessible formats. Understandably, the level of confidence assigned by our assessors varied considerably between ecosystem services and across case-studies. For some case-studies extensive knowledge and research in a range of social, ecological, environmental and economic indicators gave high levels of confidence across all the ecosystem services (e.g. Loweswater case study). In others only data from biodiversity and land management indicators were used to make the assessment, resulting in low confidence intervals across the majority of ecosystem services (e.g. Drumochter Hills). The highest confidence level across all the assessors was the cultural-aesthetics service, which relates to biodiversity as a good. Lowest confidence was attributed to cultural-artistic, cultural-religion, provisioning-water, provisioning-genetic resources, regulating-air quality, regulating-pest diseases, regulating-pollination, and regulating water quality and regulating-nutrient cycling. This may be a reflection of the lack of assessors’ knowledge in these specific areas or it may be related to the lack of data and knowledge, based on substantiated evidence, on how habitats and species of conservation concern contribute to these services above and beyond other types of land use. More confidence in the evidence could be achieved by including more experts (from different disciplines) and stakeholders in the actual assessment through facilitated deliberative discussion groups. However, this does not solve the problem of the lack data for many ecosystem services at local scales. To quote Groot et al (2010) again ‘Empirical information on the quantitative relationship between land use and ecosystem management and the provision of ES at the local and regional scale is, however, still scarce’. The case-studies used in the assessment were based on comparative assessments; either spatially or temporally. To the best of our knowledge, there have not been any research projects or case-studies that have monitored changes in the delivery of ES in response to increases in conservation effort or designation. The necessity of the assessors to compare the delivery of services spatially or temporally rendered the assessment difficult in some of the case-studies. It was sometimes difficult to differentiate and quantify the casual effects (e.g. the effect of external drivers) of the differences in ES delivery between designated and non-designated sites, i.e. were the observed differences due to designation or other casual factors, such as a change in socio-economic conditions (see the Loweswater catchment for an example of the issue). The assessors, when making their expert judgement, would incorporate these possible external drivers and factors into the overall assessment.
Nature conservation and ecosystem service delivery
43
4 Valuing the ecosystem services delivered by nature conservation
4.1 Valuation methods
A series of reports have been published highlighting the growing costs of biodiversity loss and ecosystem degradation (IEEP, 2006; O’Gorman and Bann, 2008)6. Taking inspiration from ideas developed in the TEEB, MEA, UKNEA, Defra’s Guide and related documents (HM Government, 2011), in this section, we aim to describe the ways and key methods to value ecosystem services (ES).
4.1.1 Rationale of ecosystem service valuation
The Economics of Ecosystems and Biodiversity (TEEB, 2010) is a major international initiative aiming to promote a better understanding of the economic value of ES. It is also aiming to offer economic tools to take proper account of this value. The “Mainstreaming the Economics of Nature” component of the report illustrates how the economic concepts and tools can help incorporate the ES values into decision-making at different levels. In the UK, Defra’s (2007) Introductory Guide and the subsequent documents provide guidance to valuing ES, including for the purposes of policy appraisal7. Ecosystem services contribute to the generation of income and wellbeing, as well as to the prevention of damage that inflict costs on society. The prevention of damage is characteristic of certain ES that provide insurance, regulation and resilience functions. All these types of benefits (and costs) should be accounted for in decision-making.
4.1.2 Types of value estimates Reliable estimates of ES values depend on the robustness of the methods and on the accuracy of quantifying the relationship between ES provision and human well-being. Valuation is case (e.g. ecosystem service) specific and context-sensitive. It is contingent on a particular social context. ES values can be modified by social context and social context can be modified by ecosystem changes. The way of assessing ES depends upon the nature of these services, on research objectives, and on the time and scale of the study performed. At regional and global scales some services can be approximately assessed by simple links between ecosystem types and services, underpinned by general assumptions developed from information already available in the literature (Hermann et al, 2011). More specifically, valuation of ES can be divided into: ecological, socio-cultural and economic (Farber et al, 2002). Ecological value is determined by the integrity of a forest systems provisioning, supporting and regulatory functions, and by its parameters, i.e. indicators of ecological relevance, such as complexity, diversity, rarity, or naturalness, applied across spatial scales. Socio-cultural values include various social values (e.g. equity) and end-users perceptions including with respect to their cultural and spiritual (or non-material) well-being. Indicator systems are widely used for assessing ecological and socio-cultural values. Economic indicators (e.g. those of employment and income) have also been developed and used (Adamowicz, 1995).
6 See also MEA (2005) and http://ec.europa.eu/environment/nature/biodiversity/economics/index_en.htm; http://www.defra.gov.uk/environment/ policy/natural-environ/using/value.htm and http://www.defra.gov.uk/wildlife-countryside/natres/pdf/nr0103-full.pdf. See also http://www.eea.europa.eu/atlas/teeb for more information on valuation with examples coming from all over the world. 7 This is done through cost-effectiveness or cost-benefit analysis, or by considering approaches used for Environmental Impact Assessment (EIA); Strategic Environmental Assessment (SEA); Risk Assessment, etc. See also Pearce et al (2006).

Nature conservation and ecosystem service delivery
44
4.1.3 The concept of total economic value In addition to using indicators, valuation of ES employs a range of methods developed specifically by economists, with the most important and relevant approaches presented in this section. Total economic value (TEV) of ecosystem services (O’Gorman and Bann, 2008) can be assessed based on the economic concept of value (Nunes and van den Bergh, 2001) which originates from neoclassical welfare economics. It has its roots in utilitarianism, and expresses the degree to which a service satisfies individual preferences. An estimate of TEV8 is usually considered as the sum of direct benefits, the indirect benefits and the non-use benefits provided, as shown in Figure 1. Figure 1. Key components of total economic value (adapted from Glaves et al, 2009). Examples
Provisioning services Timber, woody biomass for energy, non-timber products
Direct Use9 Social (cultural) services Recreation, health
Total Economic Value
→
Indirect Use10
Regulating services Air quality regulation, flood and soil erosion management
Supporting services Soil formation and protection
Carbon sequestration and storage
Other Option11 Future use, resilience
Non-Use12: Existence13 and Bequest14
Cultural, stewardship,
Intrinsic value of nature15
4.1.4 Economic valuation techniques Market valuation Some services (e.g. provisioning) (Figure 1) take the form of ‘economic goods’. They are derived from the use of a natural resource, e.g. land. In a well-functioning market, supply and demand determine the appropriate price level; and market valuation applies as well. This valuation is largely ‘objective’ and is done either (1) directly, i.e. based on observed market transactions and actual prices, or through (2) indirect market valuation (Turner et al, 2010). Approaches using market values, but going beyond the actual pricing, could be based on market prices of close substitutes, or on shadow pricing. They could also be based on 8 TEV is equal to market value plus the consumer surplus (CS, i.e. the difference between what an individual is willing to pay for a good or services and what they actually pay). If a good has no market price, the consumer surplus represents the TEV. It is the total gain in wellbeing from a policy, which comprises use and non-use values (Defra, 2007). 9 Direct use value is where individuals make actual or planned use of an ecosystem service (Defra, 2007). 10 Indirect use value is where individuals benefit from ES supported by a resource, rather than by using it directly (Defra, 2007). 11 Option value is the value that people place on having the option to use a resource in the future (Defra, 2007). 12 Non-use value is the value that is derived from the knowledge that the natural environment is maintained. This comprises bequest value, altruistic value and existence value (Defra, 2007). 13 Existence value is the value individuals derive from the knowledge that an ecosystem resource exists, even though they have no current or planned use for it (Defra, 2007). 14 Bequest value (an example of non-use value) is the value individuals attach to the fact that the resource will be available for use by future generations (Defra, 2007). 15 Intrinsic value: the worth of a good or service for its own sake (Defra, 2007).

Nature conservation and ecosystem service delivery
45
‘changes-in-productivity’ or on cost-of-illness considerations (a form of dose-response market analysis) (Dixon et al, 1995). There is also an approach based on opportunity costs associated, for example, with either changes in the use of ecosystems (e.g. because of a changing designation type), or with changes driven by environmental and climatic impacts, which then affect the provision of ES in the area under investigation.16 Many ES enhance incomes (e.g. natural water quality improvements increase commercial fisheries catch and thereby incomes of fishermen). Such ES could be valued through the indirect market valuation technique called the factor income method. Biodiversity can be treated as an input into the production of other goods based on resource linkages and market analysis (i.e. ‘production functions’ technique) or through ‘public pricing’ (i.e. public investment e.g. through land purchase or monetary incentives, as a surrogate for market transactions). Monetary (cost-assessing) approaches (e.g. used for comparing different scenarios, e.g. with designation vs. without it, or for comparing different types of designation) are usually based on the value of actual or potential expenditure (e.g. expenses in support of a more sustained provision of ES). These approaches include cost-effectiveness; preventive expenditures (i.e. avoided cost method, AC); replacement costs; relocation costs (RC); and shadow project (i.e. a type of RC techniques).17 The avoided cost (AC) method employs a consideration of the costs that would have been incurred in the absence of services (e.g. regulatory services of flood control found in close proximity to a designated area, normally established for nature conservation rather than flood defence). Examples are flood control by the area of wetlands that have been maintained due to designation, which allows avoiding property damages, or loss of agricultural production, or natural waste treatment (avoiding health costs) in a closer neighbourhood to the area. The replacement cost (RC) method employs a consideration of the costs of a service replacement (or off-setting) with an alternative (e.g. human-made). An example could be natural waste treatment by a designated area of wetlands which can be (partly) replaced with artificial treatment systems; the cost of replacing natural pest control by pesticides could also form the basis of such an evaluation. The relocation costs method means the consideration of expenses to displace or off-set, for example to relocate a cultural monument from an area potentially affected by flooding to a different location, or to replace a habitat which has been lost to house building. In some situations where regulatory standards are set externally, the challenge may be not the estimation of non-market benefits but instead the estimation of the least cost solution to meet regulatory needs (NIDA 2004). This generally requires cost-effectiveness analysis. Cost effectiveness (CE) analysis is widely recognised as a useful tool in considering the least cost method of compliance with regulatory standards such as those appertaining to good ecologic condition. An improved understanding of the cost-effectiveness of mechanisms to support nature conservation is important when planning future ecosystem management and use. Such mechanisms may support the presence and maintenance of features in designated areas that contribute to their ecological character or to their visual and/or cultural significance. The overall CE of delivery mechanisms of nature conservation depends first upon finding which parts of the conservation programme contribute most to effectiveness (i.e. outcome
16 Not only provisioning services could be valued by market valuation of one type or another. But, for example, supporting services (e.g. habitat functions) could be valued through direct market pricing (i.e. donations for conservation). 17 Regulating services (of flood control or erosion prevention) are mainly valued through AC or RC methods.

Nature conservation and ecosystem service delivery
46
delivery) and, then, assessing which of those programme components have the lowest cost (Phillips and Thompson, 2003). The CE depends on the relationship between spending and outcome; and whilst spending costs are measured as money spent, outcome could be evaluated either directly (number of species preserved and/or other indicators) or indirectly when it deals with patterns of subjective perspectives across individuals concerning various ecosystems’ features (Nijnik, 2008). Excludability and rivalry characteristics of ES In some cases, however, monetary market based estimates can be a poor approximation of value. This is particularly true when intrinsic values (Figure 1) and nature conservation targets are concerned. Thus, when there are no explicit markets, we must use more indirect means of valuation (also, some techniques of indirect market valuation explained earlier may apply). There is often no optimal solution to the problems raised by conservation (Rittel and Webber, 1973). With interacting ecological, economic, and social (and policy) factors, conservation decisions are complex, while markets tend to undermine the provision of non-rival and non-excludable ecosystem services (see Box 4. 1 for an explanation of these term), particularly those having intrinsic values (Table 4.1). This is because many ES are non-excludable, i.e. recipients receive the service regardless of whether they pay for it or not; non-payment does not lead to exclusion. Many ES are also apparently non-rival, i.e. any number of people can use the resource without leaving less for others. It is difficult for providers to charge the recipients of such ES, and direct market exchange between their providers and recipients fails (URS Scott Wilson, 2011).18 Box 1. Examples of non-exludability. Food and fibre provisioning services are usually highly excludable, and complex property rights and market supply-chains have evolved to connect land managers to end consumers. Similarly, via market intermediaries access to clean water is typically excludable. This means that free-riding is generally impossible. To some extent free-riders could also be excluded from using some recreational and cultural services, i.e. club goods (e.g. through the use of fences and controlled access points). However, other ES, e.g. biodiversity, are not easily excludable.
Thus, economic valuation of non-rival and non-excludable ecosystem services, i.e. of public goods (Table 8) is often controversial. Ecosystem services that fall under this category favour public sector interventions and they largely rely on valuation techniques presented below, in this section.
18 Many of ES are non-excludable, i.e. recipients receive the service regardless of whether they pay for it or not; non-payment does not lead to exclusion. Many of ES are non-rival, i.e. any number of people can use the resource without leaving less for others. Non- (or low) excludability typically comes along with ill-defined property rights. Rivalness is a property of the ES in question, unrelated to institutions, e.g. climate stability or flood control (URS Scott Wilson, 2011).

Nature conservation and ecosystem service delivery
47
Table 8. The relevance of exludability and rivalness to natural resource categorisation (adapted from Farnsworth et al, 1983 and Randall, 1993).
Revealed preference (RP) techniques of ES valuation Variation in scope for exclusion (Table 8) produces a need for different valuation systems (often fairly subjective); and valuation of public goods largely relies on observable market transactions. Social services of nature conservation areas (commonly containing public goods, having intrinsic values) are usually analysed through revealed preferences (RP). Examples of revealed preferences measures are travel cost (TC) estimates (Clawson and Knetsch, 1966) and hedonic prices, HP (Rosen, 1974). The TC method considers travel costs as a reflection of the implied value of the service. An example is areas designated for recreation that attract distant visitors whose value placed on that area must be at least what they were willing to pay to travel to it. For example, each year there are some 20 million day visits to forests by tourists alone, and tourism day visits to forests accounted for around 3% of the total annual tourism expenditure in Scotland (Hill et al, 2003). The HP methods (i.e. property and other land-value approaches) imply that ES demand may be reflected in the prices which people pay for associated goods (e.g. housing prices at green spaces usually exceed prices of identical homes near less attractive scenery). The revealed preferences techniques are efficient when dealing with the ‘use value’ of ES. However, the ‘existence value’ of ES (Figure 1) remains overlooked. Stated preference (SP) techniques of ES valuation Stated preference (SP) techniques (The Department for Transport, 2002), e.g. bidding and trade-off games, take-it-or-leave it, Delphi techniques and choice experiments modelling, are used to overcome this limitation (Adamowicz, 1995). The idea is to create hypothetical markets and examine implicit preferences (Bateman and Willis, 1999; Bateman et al, 2002; Hanley and Spash, 1998). First applied by Davis (1963) as a tool for valuing outdoor recreation, the contingent valuation method (CVM), e.g. willingness to pay (WTP, with an example seen in Box 2 for the preservation of endangered species, or willingness to accept compensation (WTA) for the loss of ES, and the more recent “method of choice” experiments are now used extensively to determine values of a wide range of non-conventional ES.
Excludable Non-excludable
Rival
Market goods Most elements of provisioning ES (timber, fish, mushrooms honey) as well as e.g. waste absorption capacity for regulated emissions
Open access resources ('tragedy of the commons') Elements of ecosystem structure that are not protected by property rights (e.g. timber or fish from unprotected stocks) and waste absorption capacity for unregulated emissions
Non-rival Inefficient market goods Information or e.g. ‘club goods’
Public good Supporting and regulating ES (e.g. of biodiversity, climate or water regulation, clean air or clean water)

Nature conservation and ecosystem service delivery
48
Box 2. An example of CVM valuation. Brown et al (1993) analysed CVM studies with their WTP estimates for preservation of endangered species and habitats. Annual per capita WTP estimates for individual species range between US$1 to US$50, while habitat values were between US$30 and US$107. Experts’ WTP values given to UK Nature reserves were of c.US$40 per year.
Usefulness and limitations of RP and SP techniques Both RP and SP techniques are, in a sense, an extension of market valuation, which is aimed to assign a monetary measure to the components of TEV, both of ‘use’ and ‘non-use’. The approaches have biases. RP cannot capture non-use values (MacMillan et al, 2004), whilst the biases of CVM, extensively discussed in the literature (Hanley and Spash, 1998; Bishop and Romano, 1998), fall into two broad categories: bias due to sampling error, and hypothetical bias (Schlapfer et al, 2004). In addition to technical problems inherent in valuing the not-marketed services (and public goods, in particular), there is concern about the gap between the hypothetical monetary values and reality (i.e. not all beneficiaries are actually willing to pay, and the scientifically derived WTP may substantially exceed actual expenditure). Also, valuations generally reflect the current distribution of income, with those with higher ability to pay being better able to reflect their preferences by higher WTP (Bateman et al, 2010). Nevertheless, RP and SP can still provide useful information to decision-makers. This particularly true in cases when a market for some goods is absent, for example in the case of free public goods with zero prices (Arrow et al, 1993; Bishop and Romano, 1998; Jacobsson and Dragun, 1996; Garrod and Willis, 1997; Hanley et al, 2002) and because comprehensive analyses remain approximate, while comparative analyses (as shown in Box 3) are fairly rare (Nijnik et al, 2008). Box 3. Examples of ES valuation. Valuation of the ES attained through the renovation of the Mayes Brook Park in London provided evidence of substantial public values derived through enhanced regulation of air quality and flooding, and improved amenity and habitat for wildlife in this designated urban area http://www.trrt.org.uk/index.aspx?articleid=15955. Forestry Commission Report (2003) by Willis et al showed that TEV of forest ES provided in Britain amounts to £1023m, with: recreation of £393m; biodiversity of £386m; landscape of £150m; and carbon sequestration of £94m. Increasingly, attention is being drawn to other social and environmental benefits (e.g. regulatory ES, such as improving air quality, and regulating water supply and quality). A study in Ukraine (European Environment Agency, 2010) showed the value of timber and non-timber forest products to be around 125 Euros ha-1yr-1 while the value of several non-market ES (carbon, water, and soil protection) deemed to exceed 170 Euros ha-1yr-1.
Benefit transfer approach19 Recently, benefit transfer (BT) methods20 for the spatial modelling of ES values has received attention (Defra, 2007; Defra, 2010). This approach uses estimates in one place to infer
19 Environmental Valuation Reference Inventory (EVRI) coordinated by Environment Canada, which is a comprehensive value (benefits) transfer database currently consisting of over 2,100 valuation studies is available at www.evri.ca. Additional information about EVRI can be found on the Defra website at: http://statistics.defra.gov.uk/esg/evri/evri/default.htm. 20 It is also called Value Transfer, as seen in defra (2010) at http://archive.defra.gov.uk/environment/policy/natural-environ/using/valuation/documents/non-tech-summary.pdf

Nature conservation and ecosystem service delivery
49
benefits elsewhere or over a wider area. It has many positive characteristics (Bateman et al, 2002). It’s relatively easy to understand, and thus, to apply (also for analysing ESS within the areas under designation, see Box 4). Box 4. An example of a BT study. Benefit transfer approaches developed at the Macaulay Institute were used to estimate non-market benefits from recreation at Forestry Commission forests. These values were compared at forest block level with data on the costs of recreational provision. The analysis revealed that there are huge divergences in the non-market values over space and that only in a minority of sites, normally those closer to built-up areas, was there a surplus of social benefit over the costs of provision. To compare: a peri-urban forest recreation site with modest parking facilities can generate in excess of 200,000 trips a year, when a far more visually attractive and environmentally interesting site in a remote area might only receive 10,000 visits a year (Gelan, 2002).
However, transfer values are to a large extent abstract and indicative, often relying on the availability of data and classifications that were developed for other purposes, and not necessarily at an appropriate scale or with contemporary values. For example, conservation decisions are often carried out at a small scale, such as farm, forest or estate level, with limited reference to activities occurring at the landscape scale and higher (Glück, 2002). 4.1.5 Wider social science approaches There is also a group of valuation approaches that does not apply market analogies. This is largely because recent literature provides strong arguments that preferences for the social states of public goods (e.g. biodiversity) can and should be determined through non-market-oriented stated preferences or preferences that are revealed through mechanisms other than the market (Kant and Lee, 2004; Kearney et al, 1999). Participatory and multi-criteria analysis techniques If all values have been expressed in the same units (e.g. monetary) they can be aggregated. If they are presented in different units, the values can be presented side-by-side and compared (c.f. Strijker et al, 2000). Alternatively, they can be compared using multi-criteria analysis (MCA).21 With MCA, stakeholders can be asked to assign relative weights to different sets of indicators (non-monetary, as well as monetary), enabling comparison (Nijkamp and Spronk, 1979; Costanza and Folke, 1997; Balana et al, 2010). Different stakeholder groups may have different perspectives on the importance of the different types of value (Vermeulen and Koziell, 2002). Through group valuation, or the use of deliberative processes, and action research, stakeholders can be encouraged to converge to a representative assessment of the values of different ES (O’Neill, 2001; Nijnik et al, 2011). Depending on valuation objectives, different techniques can be applied, including various surveys, focus groups, MCA and multi-attribute utility analysis (MAUA) (Nijnik et al, 2008). Some of the approaches enable researchers for example to develop a “conceptual content cognitive map” to illustrate either individual or group perceptions and preferences regarding the issue in question. Each valuation method is useful, if used properly and for particular purpose, yet each method/model has at the same time its weaknesses and/or application challenges (Steelman and Maguire, 1999). 21 See Multi-Criteria Analysis: A Manual: http://www.communities.gov.uk/archived/publications/corporate/multicriteriaanalysismanual

Nature conservation and ecosystem service delivery
50
Focus groups are often unrepresentative, and it is difficult to find methodological guidelines to draw out a systematic understanding of their value-relevant information. Surveys can suffer from difficulties in design, administering the questions, and interpreting the results. MAUA is usually difficult for participant understanding; whilst ranking and MCA employ human subjectivity and do not provide aggregate estimates or statistically generalisable results (Keeney and Eppel, 1990). 4.1.6 Combining valuation approaches A proper combination of several valuation tools may be most relevant in certain cases (Box 5). For example, the market stall approach (Macmillan et al, 2002) is a group-based deliberative method combining the features of citizens’ juries with SP techniques. A combined RP–SP method is the contingent behaviour model (Christie et al, 2007). Box 5. An example of ES valuation using a combination of techniques. In the study of Nijnik et al (2008) for the UK and several other countries, CVM indicated the individuals’ WTP as an expression of public valuation, whilst the method of aggregated ecological indexes (MAEI) estimates were based upon expert knowledge. WTP estimates were expressions of intrinsic values, which people attach to inanimate components of a landscape, such as a waterfall, a lake, a rock and a mountain. The idea was that the obtained estimates could be used as relative values for cross-comparison analysis. The results obtained from using the techniques were compared to elicit public preferences, with the aim providing advice for decision making. The approach therefore combines aspects of participatory methods with economic valuation. It adds to the information on the study context, gives insights into evaluation process, and in cases of reasonable agreement between obtained CVM and MAEI estimates, it provides evidence in support of the validity of ES valuation.
Combinations of research methods are becoming increasingly attractive as some of them could be applied across multiple objectives, and various scales and levels of analysis. In addition the use of one technique can be validated by using a different technique for the same purpose. The decision-making process concerning nature conservation relies upon human factors (e.g. stakeholder evaluation) that include the attitude towards participatory decision-making of those who design and facilitate the planning process and of those who are involved in it, on the ground. The Q-methodology, for example, could be used to structure so-called “wicked problems”, i.e. problems that are characterised by much uncertainty and value-conflicts, because it is able to identify patterns in perspectives on these problems, thereby reducing some of the complexity surrounding them (Cuppen, 2009). The methodology22 combines a range of qualitative and quantitative approaches. It incorporates elements of behavioural studies into action research (Argyris et al, 1985) that starts with consultation with stakeholders in order to identify research essentials, followed by interviews through either survey and/or focus groups. The output data from surveys are assessed by using the sequential application of correlation and factor analysis. The final steps include interpretation of the social discourses uncovered by the quantitative analysis, and contrasting the value outputs with the socio-economic background of respondents, and verification and communication of the results with/to respondents (Nijnik et al, 2010). The decision-making process concerning nature conservation also relies on technical factors that include: the incorporation of technological features in research tools and their effective use; the incorporation of appropriate levels of information content in the tools to
22 For more information see http://www.qmethod.org , http://www.rz.unibwmuenchen. de/~p41bsmk/qmethod It is also described in further details in our papers of Nijnik et al, 2008 and Nijnik et al, 2010.

Nature conservation and ecosystem service delivery
51
communicate knowledge to those involved in the process (Miller et al, 2009). Turner et al (2010) argue that geographical information systems (GIS) are emerging as a valuable tools in valuation. It is anticipated that their incorporation in ES valuation, with the consideration of spatial factors, will become easier and common, as access to GIS software and our expertise increase. A good example of a project that combines analytical approaches with visualization and participatory techniques is the EC funded project VisuLands (Miller et al, 2005). This project considered different cultural and landscape contexts, with the aim of informing approaches towards more sustainable natural resource management. Visualisation tools were used for stakeholder evaluation of scenarios of landscape changes. A Virtual Landscape Theatre (VLT) was designed to analyse preferences and support the sharing of views by audiences. This was often done with electronic voting tools, whilst navigating through computer models of the landscape, using a ‘drive-through’ of the area. Software functions were used to switch on/off or move groups of features (e.g. woodlands). The output was end-user evaluation of change in ES management, and an evaluation of the effectiveness of the associated programme of awareness raising (Box 6). Box 6. An example of combining analytical approaches with visualization and participatory techniques.
Miller et al (2009) discuss the integration of analytical approaches and participatory and visualization techniques for planning the sustainable use of nature. The first example considers land use in the Amazon region, and the second, the socio-economic, ecological and visual aspects of ES in a European landscape (six countries). Each example involves active participation of stakeholders and the public in supporting the decision-making. The outcomes from the experiences are used to prove the necessity of stakeholder and community involvement in assessing environmental problems and their potential solutions. These experiences (Nijnik et al, 2011) suggest that wider stakeholder involvement in decision-making has had a high level of participant satisfaction, and an increased understanding of the issues associated with nature conservation. Comparisons of the similarities and differences between the studies provide a basis for discussion of common and locally distinctive guidelines and good practices in ecosystem management and landscapes planning.
A number of socio-economic valuation techniques, qualitative and quantitative, in combination with each other can offer a sufficiently sophisticated framework for identification and explanation of nature conservation related values connected directly with human visions and perceptions. They can bring together different theoretical and methodological approaches, such as analytical and participatory techniques (Nijnik and Mather, 2008; Nijnik et al, 2011); participatory techniques, GIS and visualisation tools (Miller et al, 2009); and CVM and the method of aggregated ecological indexes, MAEI (Nijnik et al, 2008). It can be argued that the applied approaches based on consultation with the public offer a credible means of performing ES valuations relevant to conservation policy and resource management.
4.2 The use of valuation in nature conservation
4.2.1 Opportunities, challenges and complexities Valuation helps in identifying beneficiaries and in providing evidence of the scale of benefits. Valuation also helps in both informing an appropriate level of payments for ecosystem

Nature conservation and ecosystem service delivery
52
services (PES), e.g. in consideration of damages caused to designated areas, and in determining whether a PES scheme is worth implementing for nature conservation. 23 Subjectivity, complexity and uncertainty
Despite the recent advance in ES valuation and its well acknowledged importance to assist in decision-making, many critical views have been expressed about economic valuation of ES, with Porras (2012) arguing that policy makers are usually lost when confronted with TEV, as the figures are too abstract and indicative, especially BT values.
In reality, however the value of services is contingent on location with respect to the source of demand. This type of variability arises from those public goods which have use values (as opposed to non- use values, see Figure 1). Consequently, an accessible high quality landscape is worth more than that same landscape in a remote location with respect to use values. Such use values inevitably create distributions of non-market benefits which are shaped by the distribution of population. Thus a forest recreational attraction’s value is often more a function of where it is than the landscape aesthetics of the site (Slee et al, 2008). There is an inherent variability in the value of public goods over space also because the particular ES in question is spatially variable (e.g. the habitat of a rare species or the scope for sequestering carbon).24
Also, valuation (going beyond direct market approaches) is not free of judgement (e.g. our subjectivity and assumptions made). Perceptions vary between individuals and within cultural groups of people. Valuation tends to place a single value on a service, yet there are often variations in opinion amongst stakeholders regarding the value of a service. For example, Christie et al (2006) assessed the recreational benefits obtained by different groups of forest users, including walkers, cyclists etc. It was found that different user groups are likely to place different values on ES. Thus, differentiating these different types helps to improve the valuation evidence base that might be used in subsequent analysis. This is shown in our study addressing Scottish forestry (Box 7), and the question as to whose preferences are most important, remains challenging.
23 The PES level should be between the minimum payment required to provide incentives to the provider to alter behaviour (i.e. it must at least cover the income foregone from converting land from one use to another, as well as any costs associated with the effecting the change) and the maximum value of benefits delivered by the enhanced ES (URS Scott Wilson, 2011). See also (Defra, 2010).
24 Equally, ecosystem management could induce more ‘public bads’ (i.e. dis-benefits) in some areas compared to others. These arise from such actions as the application of nitrogenous fertiliser, the presence of methane emitting ruminant livestock etc., the visual intrusiveness of blocks of exotic conifers etc. (Slee et al, 2008).

Nature conservation and ecosystem service delivery
53
Box 7. Stakeholder valuation of multi-functional forestry (MFF), a Q-method application25
Given the assumptions of the studies (Nijnik et al, 2010), five attitudinal groups reflecting on the selected ES of forests in Scotland, were distinguished. The primary advocates of regulating and supporting ES belong to groups 1 and 4. Those, whom we could label as ‘radical conservationists’ (group 1), fail to see the importance of timber production. The ‘moderate conservationists’ (group 4) favour MFF, including using forests for climate change mitigation. Their support of nature conservation comes along with the support of sustainable forest management. Respondents in groups 3 and 5 (as seen in the figure) give their priority to provisioning services. Compared with group 3 (‘radical productivists’), group 5 balances timber production, including for bio-energy, and the provision of other ES. Group 2 respondents favour landscape beauty and recreation activities in forests. They e.g. suggest that hunting and fishing are necessary to maintain the quality of ecosystems. This group, termed ‘recreants’, supports a range of ES, starting from the conservation of forests to the consideration of socio-economic benefits that forests provide for communities.
Findings indicate that the conservation of biodiversity receive the support of all attitudinal groups, except 3. All groups, excluding group 4, consider cultural and social services as important. The enhancing of provisioning services is supported by all, except the radical conservationists (group 1), while only the productivists (groups 3, 5) consider the importance of maintaining forest for timber above all else. The results also indicate that an increasing intensity of conservation measures may influence timber production, and vice versa. At one end of the spectrum, ecological approaches emphasise environmental protection, and at the other end, climate change considerations promote carbon forestry (e.g. short rotation coppicing). Overall, despite the heterogeneity of attitudes, all groups identified support the necessity of multiplying the wealth of local communities from woodlands, also putting the emphasis on stability and resilience of ecosystems.
25 This study was extended to several other European countries. Findings suggest that attitudinal diversity towards (and trade-offs between) various ES associated with forest is dependent upon the socio-economic, political and historical preconditions, cultural standards and ethical principles operating in each case study (Nijnik et al, 2010).

Nature conservation and ecosystem service delivery
54
Values are not fixed, and not only because they vary between different individuals and groups. They also change both temporally and spatially. Valuation is also carried out using the knowledge of the day, which, by itself, is often incomplete. Thus future valuation work should focus on both marginal assessments of changes (e.g. from one designation type to another) and the TEV of cumulative impacts on the environment (Jacobs, 2008). The TEV framework is now common, while marginal valuation as a measure of the change in the provision of ES under various scenarios is often particularly relevant. This is because economic analysis to inform policies usually concerns marginal changes (O’Gorman and Bann, 2008). The complexity of ES and their spatial arrangement (ecosystem condition, size, connectivity, and context) pose further problems.26 Insufficient understanding of ecological processes and numerous uncertainties surrounding the cause and effect relationships being evaluated often lead to unreliability in the obtained economic estimates. Valuation of supporting services, in particular, is difficult due to a lack of robust data. This also concerns real integrated values of supporting services. The monetary value could be estimated e.g. by the avoided-cost or replacement cost methods. However, the effect of site-specific conditions and local scarcity means that the value of services generated from e.g. a hectare of area under designation in one locality will vary substantially from that for a different location. Moreover, largely due to complexity and numerous uncertainties about the future, potential use values of ES (i.e. option values) are not easy to assess. Ecosystems are being judged on what they are now rather than on their potential to become. Therefore, currently, option values (and those of existence and bequests, see Figure 1 are not incorporated in ES valuation, but consideration should be given to their inclusion. Double counting Particular challenges arise when dealing with jointly produced services, which are delivered and utilised as bundles: pricing individual components can be difficult. Some types of services contribute to others, also leading to potential double counting (e.g. supporting ES contribute to regulating ES, or regulating ES contribute to cultural ES; de Groot 2002; Nijnik and Miller, in press). Double counting is also an issue where multiple services are delivered and where these are sold separately or included in schemes operated by different jurisdictions, e.g. by management authorities, private businesses (URS Scott Wilson, 2011). The ‘double-counting’ may arise when attempting to value primary ecological processes (e.g. soil formation, nutrient cycling, etc.) which support ES functions (Bateman et al, 2010). This could lead to the risk of overstating the total values generated (Fisher et al, 2008), putting the underlying ecological assets at risk (Gren et al, 1994). Scale and trade-off considerations Scale consideration (both spatial and temporal, and the context of each valuation study) is of importance while valuing the ES. Consider, for example, provisioning services associated with a forest: timber provision has its explicit (market) value at local, regional through to global scales. However, this may not be the case for non-timber forest products (e.g. medicinal plants, berries or fungi may have value only for local people).
26 And it is important to note that economic values reflect the services of an ecosystem and not the economic value of that ecosystem

Nature conservation and ecosystem service delivery
55
In particular, the value of many regulating services only exist at a regional scale, whereas the value of carbon storage and sequestration, in contrast, becomes obvious at a global scale. Many ecosystem services arise from complex processes, making it difficult to determine which actions affect their provision and precisely who the providers and beneficiaries are (FAO, 2007). The gap between providers and beneficiaries of ES is also among the major challenges of designing and implementing PES (URS Scott Wilson, 2011). Ecosystem service valuation is more robust when addressed at lower scales. However, services of significant values at local scale (e.g. of soil erosion prevention) can be overlooked at a larger scale of valuation (Daily and Ellison, 2002). There could be trade-offs in valuation of ES, e.g. in favour of direct benefits like employment versus supporting or regulating services. Also, trade-offs between different ES are scale specific. Kremen et al (2000) examined the value (i.e. opportunity costs) of forest conservation and showed that at a national level the financial benefits of logging are greater than of conservation. However, additional consideration of global benefits (i.e. of carbon and biodiversity) led to the conclusion that conservation benefits are greatest. Muriithi and Kenyon (2002) showed that only when non-use and existence values, which are not realised by the local and national population, are included in valuation, forest conservation benefits exceed the opportunity costs. Today, valuation evidence in the UK tends to be based on a range of case studies (e.g. for angling, grey seals, brown hares, water voles, various habitat types etc.), all of which are very useful but very difficult to scale-up into a compelling narrative or which can be used in different ways (NE, 2009). Thus, a challenge for conservation lies in creating the correct framework to capture TEV. 4.2.2 Selected examples of valuation methods A range of the key methods used for valuing ES of trees, as an example, are shown in Table 9. However, it is important to advance research tools such that they are relevant, accessible and effective in offering meaningful information to different audiences, such as guiding public understanding of consequences of ES changes, developing institutional capabilities, and aiding the decision-making.
Table 9. Selected examples of valuation methods. Examples of ES/goods Valuation method Value
Provisioning services Timber Market valuation Market prices Non-timber forest products Market valuation Market prices Woody biomass for energy Market valuation Market prices
Regulating services
Carbon sequestration Climate regulation
Cost-effectiveness Market valuation
MAC (costs per tCO2) Market prices (if CO2 is traded)
Erosion alleviation Shelter belts
Replacement and avoided cost methods
Avoided losses in yields or cost of increased yields
Air quality Avoided cost methods Avoided losses
Flood regulation Benefit transfer Avoided cost methods
BT estimates Avoided losses
Cultural services
Recreation SP, e.g. contingent Valuation RP, i.e. travel cost method Indirect market valuation
WTP values Travel cost estimates Market pricing
Landscape beauty, aesthetics
RP, hedonic pricing method of SP, e.g. choice experiments
HP values WTP values
Health Indirect market valuation Changes-in-productivity Cost-of-illness estimates

Nature conservation and ecosystem service delivery
56
Examples of ES/goods Valuation method Value Supporting services Oxygen Replacement cost methods Cost of oxygen
Soil formation and protection Avoided cost method Cost of purchasing top-soil from elsewhere
Species diversity Indirect market valuation Donations for conservation 4.2.3 To value or not value Wilson (1988) presented an overview of the thinking about valuing biodiversity. Brown et al (1993) examined the economics of biodiversity, showing a wide range of examples of end-users’ WTP for conserving biodiversity. However, no real monetary estimates of the TEV of biodiversity were yet provided (Dixon et al, 1995). Important therefore is to answer the question ‘to value or not to value’ and in answering this question it is useful to return to Table 8. When a good/service is excludable and rival, it makes sense to value it economically, and the use of monetary values (market prices) is then largely applicable. For non-excludable and rival resources (from unprotected stocks rather than designated areas) society can try making it excludable, and may set aside some of the ES. In New Zealand, for example, existing fishermen were awarded tradable permits for their historical harvests, whilst an adequate amount was then purchased back to conserve the total stock (Memon and Cullen, 1992). Also, when for example a privately owned forest or wetland generates non-excludable and non-rival services, it may be possible to limit property rights with a total quota for excludable uses of the resource, then allowing markets in uses that exceed that quota. An example coming from a wetlands policy in the US suggests that the quota could be set at existing levels, yet allowing landowners to drain wetlands, if they pay for restoring or building new wetlands elsewhere (Shabman and Scodari, 2004). Also, tradable development permits could cap total allowable development in an area, but allow landowners to trade development rates such that the location of development (the value of ES in this location) is market determined (Stavins, 2002). The option of creating artificial markets as well as the use of various off-setting (e.g. replacement) schemes are, of course, highly problematic (Spash, 2010) and especially for public goods (Table 4.1), when the intrinsic value of nature is concerned (Bateman et al, 2010). Off-setting schemes largely deal with ‘items’, species, maybe even plant communities (yet not with functions and ecosystem services). Moreover, do wetlands or woodlands created in remote areas have as much cultural value as those with easy access to the public near a city; and can the intrinsic values of natural ecosystems be wholly valued and offset? Economic valuation is difficult to apply in the field of biodiversity or landscapes, both as a result of their uniqueness and distinctiveness, and because of a shortage of robust primary valuations (NAO, 2008), and numerous uncertainties. But even in the case of public goods (i.e. which are largely non-excludable and non-rival, as seen in Table 4.1), the user values (Figure 4.1) can still be marketed and valued (e.g. by CVM or TC methods, as explained in section 4.1.4). This is important to realise because e.g. nature/biodiversity driven recreation is expected to grow, as income increases, and as unique habitats become scarcer (Dixon et al, 1995; Gelan, 2007). However, in addition to use values, biodiversity has also its non-use values (Figure 4.1). They comprise human orientated (anthropocentric) intrinsic values, e.g. relating to cultural or spiritual benefits, the economic valuation of which is unlikely to be possible. Furthermore, in addition, biodiversity has a non-anthropocentric intrinsic value. It is not possible for us to

Nature conservation and ecosystem service delivery
57
capture the value of non-anthropocentric intrinsic benefits of biodiversity, as it exists irrespective of any value individuals might put on it (O’Gorman and Bann, 2008). Thus, using economic values to determine the level of taxes/fees in order to change behaviours that undermine conservation goals, or using subsidies for activities that promote them can work and be useful in some cases (Baumol and Oates, 1989). It may be possible to put economic values and then pay landowners for providing ES. Payments for ES are now becoming increasingly popular (Landell-Mills and Porras, 2002; Pagiola et al, 2002; URS Scott Wilson, 2011). However, while market instruments can provide effective conservation tools in some cases, they do not work everywhere. Creating market solutions may be less appropriate under numerous uncertainties, or/and when conservation needs are site specific and conflict with existing property rights (Czech and Krausman, 2001). It is particularly inappropriate when the designated sites are of highest significance, e.g. contain endangered species of high intrinsic value. When there is an issue of critical natural capital, i.e. when ecosystems (or their components) are nearing critical thresholds (and ‘tipping points’), and if/where their conservation is essential, valuing and managing of ES cannot be driven by, and rely on economic variables. Economic valuation and the use of markets alone - particularly when non-marketed (public) goods and services (having high intrinsic values) are concerned - will not lead to their sustainable, just and efficient allocation towards nature conservation management goals. Prices can respond to ecological constraints much more quickly than ecosystems can respond to economic variables. Therefore, the level of conservation should be price determining, not price determined (Daly, 2007). Thus, because of the considerable complexity surrounding ES, and when it is unclear whether economic values represent a large share or a tiny fraction of the true TEV of unique and endangered ecosystems (Dixon et al, 1995) which are near thresholds, economic analysis alone will not be an appropriate solution (Turner et al, 2010). The concept of the safe minimum standard and the ‘precautionary principle’ should then be considered (Ciriacy-Wantrup, 1952; Bishop, 1978).27 Moreover, given a range of uncertainties and potentially irreversible impacts of some of our decisions on certain type of ecosystems, and particularly on their intrinsic values, ethical and political choices must be made carefully and should be deliberately agreed. Estimates of TEV should aim to address not only the use values to local communities and people on the ground but also benefits enjoyed by the global community in the form of, for example, wildlife protection, carbon sequestration (and option and non-use values, where possible). Mechanisms to capture the benefits and costs are also needed (Kooten et al, 2000); and the use of valuation techniques should be incorporated more widely in decision making processes (NAO, 2008; Ferraro, 2011). Much then depends upon good governance, broader policy interventions (when nature conservation issues are concerned), with explicit definition of property rights and a range of proper incentives (both economic and non-economic) towards the changing of behaviours to protect the environment and use the ecosystems more sustainably.28
4.3 The value of designation: stakeholders and scales Central to the conservation of biodiversity are protected areas (TEEB, 2009), designated areas or sites. Such areas can be considered as ecosystems or groups of ecosystems that
27 The opportunity cost of not converting and losing a unique resource should also be considered carefully (Dixon et al, 1995). 28 See (Ferraro, 2011).

Nature conservation and ecosystem service delivery
58
provide various services to us. The total value of a protected area is the sum of two components. The first is the added value of designation which is the symbolic value of the protected area status, the value of subsequent avoided degradation due to measures on or off site, and the increased value due to management and investment (op cit. p.4/5). The second component is the value of services maintained without designation. Spash (2008) is critical of studies that focus on determining the total value of ecosystem services. An example of the latter is Constanza et al (1997) and in this study the total monetary value of the world’s ecosystems is estimated. Spash argues that “The ’total value’ in economic terms of, say, oxygen is the value humans place on their own survival. That fresh air lacks a price does not mean it has no value, merely that it is not a traded commodity and we govern its use via non-market institutions. Differentiation is actually made in economics between value in totality and market price or marginal value. This is referenced as the ‘diamond water paradox’: the total value of water exceeds by far that of diamonds but the latter has a high price and the former a low one. The explanation is that economic trade prices concern relative values in exchange set by the marginal units sold. As mentioned at the beginning, designated areas provide a number of services and benefits, including those related to local cultural heritage and identity. The benefits refer to the total economic value or the value because of direct and indirect use. An example of the latter is intrinsic value (see Figure 1). Stakeholders often have to be convinced of these benefits, and that costs are equitably distributed (op cit. p.6). Wilson et al (2002) define equity “as a normative concept that emphasizes the ex-ante freedom and equality of all persons, both across and within generations“. Designated areas can provide benefits to various stakeholders at many different scales. The next section focuses on the issues related to the valuation of designated areas while taking into account different stakeholders and scales. The first section discusses the value of designation and the relationship with stakeholders (Section 4.3.1) and the following section discusses the value of designation at different levels of scale (Section 4.3.2). In the final section (Section 4.3.3) the ways to communicate values of designations are discussed. 4.3.1 The various stakeholders and the value of designation For determining the value of designated areas it is important to identify relevant stakeholders that benefit from them. We first consider here why this is the case, then go on to discuss how to deal with competing interests within stakeholder groups. Designated areas (or ecosystem services in general) provide value, but this very much depends on the stakeholders that receive those benefits. For that reason, Hein et al (2006) modify the definition of stakeholder to become “any group or individuals who can affect or is affected by the ecosystem’s services”. The views and needs of the various stakeholders influence the value of ecosystem services. To incorporate stakeholders in the valuation of ecosystem services means that we have to take into account the mutual and dynamic relationships that exist between the stakeholders and the ecosystem services. Hein et al argue that the identification of relevant ecosystem services can be done on the basis of the stakeholders involved. But different stakeholder groups are also likely to have different perspectives when it comes to value. Group valuation is then a good method to assess these different perspectives, as its aim is to converge on an assessment representative of the group as a whole. To evaluate ecosystem services in the case of competing social groups one technique has gained prominence, the discourse-based valuation (Wilson et al, 2002). Public debate should be the process to uncover preferences towards public goods as it is argued that the valuation of public goods is not the aggregation of individual preferences. Furthermore,

Nature conservation and ecosystem service delivery
59
environmental policy should be guided by a forum consisting of a small group of citizen stakeholders who will deliberate on the economic value of a public good. Wilson et al argue that deliberation requires citizens to go beyond private self-interest. As a group they can piece together a more complete, and socially just, assessment of ecosystem services. The authors finish with the statement that conventional methods of measuring the value of ecosystem services and discourse-based valuation should be considered complementary, and that one is not better than the other. 4.3.2 The influence of different scales on the value of designation To be able to value designated areas (or ecosystem services in general) we must have a clear definition of the object that is to be valued. Hein et al (2006) extend the definition of the object of valuation to explicitly take the spatial component into account. An ecosystem according to them is “the individuals, species and populations in a spatially defined area, the interactions among them, and those between the organisms and the abiotic environment”. They argue further that, ecosystem services have to be assessed in physical terms before it is possible to carry out the valuation. A prerequisite for quantification in case of regulation services provided by ecosystem services is an analysis of the bio-physical impact on the environment in or surrounding the ecosystem of the service. It is not always needed to incorporate the spatial component. An example of the latter is the valuation of the carbon sequestration service. For the assessment of the value of carbon sequestration it does not matter where the carbon is being sequestered. If one includes regulating services into the assessment of the value of ecosystem services there is the danger of double counting (op cit. 214). It is argued that in order to avoid double counting; regulating services should only be included “if they have an impact outside the ecosystem to be valued, and/or if they provide a direct benefit to people living in the area”. Hein et al (2006) go on to argue that in the first case the value of the service is determined by the interactions with the ecosystems or society and the spatial configuration. It becomes mandatory to provide the spatial boundaries to define the ecosystem29. According to Turner et al (2010) it is important to evaluate designated areas taking the spatial characteristics of the designated areas into account. The reason is that the provision, the costs and benefits of the services provided by the designated areas are context dependent. As an example they refer to a study by Naidoo et al (2006) who perform a cost-benefit analysis of three potential equivalent conservation corridors in Mbaracayu Biosphere Reserve, Eastern Paraguay. Naidoo et al (2006) found that one corridor generated net benefits three times greater than the other corridors. Turner et al (201) further argue that "The disparity was largely due to differences in opportunity costs as a result of variability in spatial factors, such as land tenure, slope, and soil type." The opportunity costs of conservation of designated areas can be rather low due to, for instance, the slope of the area. The steeper the slope of the area leads to lower deforestation rates and therefore lower costs (Naidoo et al, 2006). Temporal scale is also an important factor for consideration. Designated areas may have impacts beyond a standard time period (Defra, 2007). Their development over time is influenced by these changes and this development must be clear to all stakeholders. By discounting and thereby converting all costs and benefits to present values (see Section 2), we can take into account any temporal distribution of the costs and benefits of ecosystem services. The issue then is to choose the right discount rate as this can have significant differences in terms of the final outcome of the valuation. There are recommendations about
29 It should be noted that scales and stakeholders are most likely correlated (op cit. 214) as scales refer to the phenomena’s or observations’ physical dimensions in space and time. The size of a landscape determines which stakeholders are affected. The larger the size, the more likely more stakeholders are affected.

Nature conservation and ecosystem service delivery
60
what is the right discount rate. The Treasury guidelines (see HM Treasury, 2011) recommend a discount rate of 3.5% and using different declining discount rates over the longer term. 4.3.3 How to communicate the value of designation to stakeholders To our knowledge there are no standard ways of communicating about the value of ecosystem services delivered by designated areas. The World Wide Web can be the basis for advice on this and there are a number of websites that provide helpful information. Although the aim of these websites is on ecosystem services in general, their advice is of course applicable also to designated areas and their associated stakeholders. The Ecological Society of America (ESA) has a website (www.esa.org) that discusses the public dissemination of ecosystem service information: what they are, what they are worth, the role of ecologists, etc. More importantly they also discuss how to communicate effectively with the public and the media (newspapers, radio and TV). Some of their points of advice when dealing with the public: • Know your audience. Tailor your presentation to the appropriate level of your audience.
Remember to keep it simple, but not simplistic.
• Concentrate on the message. Communicate clearly your goals. Having a simple take home message (1-3 points) is much easier to digest.
• Keep it simple and straightforward. Don't get bogged down with too much data or detail. Keep your overheads to a few points with minimum text. Use simple clear graphs and remember the one slide/graphic per minute rule.
• Make a connection. Show the audience how ecosystem services affect their lives and others in the community. Give them a reason to care.
• Empower your audience. Always include solutions ('Things you can do') in your presentation. Motivate them to take personal and political action.
Another website is that of the Union of Concerned Scientists (www.ucsusa.org). This union has developed a project that focuses on the key services that natural systems provide. The goal of the project is to increase the awareness of the public of the importance of ecosystem services, and, by extension, of any country’s biological resources. On their website there are a series of tool kits available and a project website to help achieve this goal. The toolkits are on water purification and pollination. With the toolkit any scientist can give a presentation in an academic setting or to a local community group, meet with or write to your political representatives, or write an “letter to the editor” (LTE) or an “opposite the editorial page” (op-ed) to a local newspaper. Similar advice is provided by the website www.conservationgateway.org. They argue that “The technical, science language or even language that we as ecosystem services experts think is ‘plain’ can often be off-putting and confusing to others. They won’t listen beyond your first sentence.” The website provides a tool called a “message triangle” that is like a “cheat sheet” that serves two purposes: to keep yourself on the message and to keep the focus of communication on a few important points.

Nature conservation and ecosystem service delivery
61
A final tool that is helpful in communicating to the general public the value of ecosystem services in general and designated areas in particular are geospatial information systems (Boyd, 2008). A characteristic feature of ecosystems is that they are unmovable once the ecosystem goods and services are produced. This property then triggers the need for geography. Using geospatial information systems one is able to map and visualize data on designated areas to inform the public.

Nature conservation and ecosystem service delivery
62
5 List of common acronyms AC Avoided cost method
BT Benefit transfer method
CE Cost effectiveness
CS Consumer surplus
CVM Contingent valuation method
Defra Department for Environment, Food and Rural Affairs
DOC Dissolved organic carbon
EIA Environmental Impact
ESA Environmentally sensitive area
GHG Greenhouse gas
MA Millenium Assessment (also called MEA – millennium ecosystem assessment)
ES, ESS Ecosystem Services
ESAC Ecosystem Services for Conservation Assessment
EVRI Environmental Valuation Reference Inventory
FAO Food and Agriculture Organization
FPM Freshwater pearl mussel
GIS Geographical information system
HP Hedonic price methods
JNCC Joint Nature Conservancy Council
MAC Marginal abatement cost
MAEI Method of aggregated ecological indexes
MAUA Multi-attribute utility analysis
MCA Multi-criteria analysis
MEA Millennium Ecosystem Assessment
MFF Multi-functional forestry
NAO National Audit Office
NIDA National Institute of Development Administration
NNR National Nature Reserve
PES Payments for ecosystem services
RA Risk Assessment
RC Replacement costs method; Relocation costs method
RP Revealed preference
RSPB Royal Society for the Protection of Birds
SSSI Sites of Special Scientific Interest
SEPA Scottish Environmental Protection Agency
Nature conservation and ecosystem service delivery
63
SAC Special Areas of Conservation
SEA Strategic Environmental Assessment
SNH Scottish Natural Heritage
SP Stated preference techniques
SPA Special Protection Areas
TC Travel cost method
TEEB The Economics of Ecosystems and Biodiversity
TEV Total economic value
UK NEA United Kingdom National Ecosystem Assessment
UK BAP United Kingdom Biodiversity Action Plan
WTA Willingness to accept compensation
WTP Willingness to pay
VLT Virtual Landscape Theatre

Nature conservation and ecosystem service delivery
64
6 References Adamowicz, W.L. 1995. Alternative valuation techniques: a comparison and movement to a synthesis. In: Willis, K. & Corkindale, J. (eds.), Environmental Valuation: New Directions. CAB International, Wallingford, 160-177.
Anderson, B. J., Armsworth, P. R., Eigenbrod, F., Thomas, C. D., Gillings, S. & Heinemeyer, A. et al (2009) Spatial covariance between biodiversity and other ecosystem service priorities. Journal of Applied Ecology, 46, 888-896.
Argyris, C., Putnam, R. & Smith, D. 1985 Action Science: Concepts, methods and skills for research and intervention. San Francisco: Jossey-Bass.
Arrow, K.J., Solow, R., Portney, P.R., Leamer, E.E., Rander, R. & Schuman, H. 1993. Report of the NOAA Panel on Contingent Valuation. NOAA, US, Department of Commerce.
Balana, B., Mathijs, E. & Muys, B. 2010. Assessing the sustainability of forest management: an application of multi-criteria decision analysis to community forests in northern Ethiopia. Journal of Environmental Management 91, 1294-1304.
Bateman, I. & Willis, K. (eds.) 1999. Contingent Valuation of Environmental Preferences: Assessing Theory and Practice in the USA, Europe and Developing Countries. Oxford University Press.
Bateman, I., Carlson, R., Day, B., Hanemann, M., Hanley, N., Hett, T., Jones-Lee, M., Loomes, G., Mourato, S., Ozdemiroglu, E., Pearce, D., Sugden, R. & Swanson, J. 2002. Economic Valuation with Stated Preferences. Edward Elgar, Cheltenham.
Bateman, I.J., Mace, G.M., Fezzi, C., Atkinson, G. & Turner, K. 2010. Economic Analysis for Ecosystem Service Assessments. Environmental and Resource Economics http://uknea.unep-wcmc.org/LinkClick.aspx?fileticket=0sKywIVUSuM %3d&tabid=38
Bastian, O. 2013. The role of biodiversity in supporting ecosystem services in Natura 2000 sites. Ecological Indicators, 24, 12-22.
Bishop, R.C. 1978. Endangered species and uncertainty: the economics of a safe minimum standard. Am. J. Agric. Econ., 60, 10–18.
Bishop, R. & Romano, D. 1998. Environmental Resource Valuation: Applications of the Contingent Valuation Method in Italy. Boston, Kluwer Academic Publishers: 286
Boyd, J. 2008. The geography ecosystem, www.rff.org/RFF/Documents/Resources-170-Boyd.pdf, accessed on the 15th of April 2013.
Bradbury, R.B., Stoate, C. & Tallowin, J.R.B. 2010. Lowland farmland bird conservation in the context of wider ecosystem service delivery. Journal of Applied Ecology, 47, 986-993.
Brown, K., Pearce, D., Perrings, C. & Swanson, T. 1993. Economics and the conservation of global biological diversity. Global Environment Facility working paper N2, Washington DC: UNDP/UNEP/The World Bank.
Bullock, J.M., Jefferson, R.G., Blackstock, T.H., Pakeman, R.J., Emmett, B.A. & Pywell, R.J. et al. 2011. Chapter 6: Semi-natural grasslands. The UK National Ecosystem Assessment Technical Report (UK National Ecosystem Assessment), pp.161-195. UNEP-WMC, Cambridge.

Nature conservation and ecosystem service delivery
65
Burkhard, B., Kroll, F., Nedkov, S. & Müller, F. 2012. Mapping ecosystem service supply, demand and budgets. Ecological Indicators, 21, 17-29.
Business and Biodiversity Offsets Programme (BBOP). 2009. Biodiversity Offset Design Handbook, Washington, D.C.
Cardinale, B.J., Duffy, J.E., Gonzalez, A., Hooper, D.U., Perrings, C. & Venial, P. et al. 2012. Biodiversity loss and its impact on humanity. Nature, 486, 59-67.
Ciriacy-Wantrup, S.V. 1952. Resource Conservation: Economics and Policies. University of California Press. Berkeley.
Chan, K.M., Satterfield, T. & Goldstein, J. 2012. Rethinking ecosystem services to better address and navigate cultural values. Ecological Economics, 74, 8-18.
Christie, M., Hanley, N. & Hynes, S. 2007. Valuing enhancements to forest recreation using choice experiment and contingent behaviour methods. Journal of Forest Economics 13: 75-102.
Clawson, M. & Knetsch, J. 1966. Economics of Outdoor Recreation. John Hopkins University Press, Baltimore.
Constanza et al. 1997. The value of the world’s ecosystem services and natural capital, Nature, 387, 253-260.
Costanza, R. & Folke, C. 1997. Valuing ecosystem services with efficiency, fairness, and sustainability as goals. Pages 49-68 in Daly GC, ed. Nature's Services: Societal Dependence on Natural Ecosystems. Washington (DC): Island Press.
Cooksley, S.L. 2007. Dee catchment management plan summary. Dee Catchment Partnership, Aberdeen.
Cris, R., Buckmaster, S., Bain, C. & Bonn, A. 2011. Peatland Restoration – Demonstrating Success. IUCN UK National Committee Peatland Programme, Edinburgh.
Cuppen, E. 2009. Putting Perspectives into Participation – Constructive Conflict Methodology for Problem Structuring in Stakeholder Dialogues. Uitgeverij BOXPress: Oisterwijk.
Davis, R. 1963. Recreation planning as an economic problem. Natural Resources Journal, 3, 239-249.
Daniel, T.C., Muhar, A., Arnberger, A., Aznar, O., Boyd, J.W., Chan, K.M., Costanza, R., Elmqvist, T., Flint, C., Gobster, P.H., Gret-Regamey, A., Lave, R., Muhar, S., Penker, M., Ribe, R.G., Schauppenlehner, T., Sikor, T., Soloviy, I., Spierenburg, M., Taczanowska, K., Tam, J. & von der Dunk, A. 2012. Contributions of cultural services to the ecosystem services agenda. Proceedings of the National Academy of Sciences of the United States of America, 109, 8812-8819.
DDSFB. 2009. Aberdeenshire Dee & District Fisheries Management Plan (2009-2015). Dee District Salmon Fishery Board and River Dee Trust.
De Deyn, G., Shiel, R.S., Ostle, N., McNamara, N.P., Oakley, S. & Young, I. et al 2011. Additional carbon sequestration benefits of grassland diversity restoration. Journal of Applied Ecology, 48, 600-608.
Defra. 2007. An introductory guide for valuing of ecosystem services, 68p. http://www.defra.gov.uk/

Nature conservation and ecosystem service delivery
66
Defra. 2010. Payments for ecosystem services: a short introduction. Available at: http://www.defra. gov.uk/environment/policy/natural-environ/documents/payments-ecosystem. pdf
Defra. 2010. Valuing Environmental Impacts: Practical Guidelines for the Use of Value Transfer in Policy and Project Appraisal, eftec. Available at http://archive.defra.gov.uk/environment/policy/ natural-environ/using/valuation/documents/non-tech-summary.pdf
De Groot, R.S., Alkemade, R., Braat, L., Hein, L. & Willemen, L. 2010. Challenges in integrating the concept of ecosystem service and values in landscape planning, management and decision making. Ecological Complexity, 7, 260-272.
Dixon, J., Scura, L., Carpenter, R. & Sherman, P. 1995. Economic analysis of environmental impacts. Earthscan Publications Ltd., London, 200p.
Egoh, B., Reyers, B., Rouget, M., Bode, M. & Richardson, D.M. 2009. Spatial congruence between biodiversity and ecosystem services in South Africa. Biological Conservation, 142, 534-562.
Eigenbrod, F., Anderson, B. J., Armsworth, P. R., Heinemeyer, A., Gillings, S., Roy, D. B., Thomas, C. D. & Gaston, K. J. 2010. Representation of ecosystem services by tiered conservation strategies. Conservation Letters, 3, 184-191.
Eigenbrod, F., Anderson, B. J., Armsworth, P. R., Heinemeyer, A., Jackson, S. F., Parnell, M., Thomas, C. D. & Gaston, K. J. 2009. Ecosystem service benefits of contrasting conservation strategies in a human-dominated region. Proceedings of the Royal Society B-Biological Sciences, 276, 2903-2911.
Environment Bank. 2012. Biodiversity Offsetting: A general guide.
European Environment Agency. 2010. Europe’s Ecological Backbone: recognising the true value of our mountains. EEA Report 6/2010, EEA Copenhagen, 248 pp.
Everard, M., Jones, L. & Watts, B. 2010. Have we neglected the societal importance of sand dunes? An ecosystem services perspective. Aquatic Conservation-Marine and Freshwater Ecosystems, 20, 476-487.
Farber, S., Costanza, R. & Wilson, M. 2002. Economic and ecological concepts for valuing ecosystem services. Ecological Economics 41: 375-392.
Farnsworth, E., Tidrick, T. H., Smathers, W.M. & Jordan, C.F. 1983. A synthesis of ecological and economic theory toward more complete valuation of tropical moist forests. International Journal of Environmental Studies. 21:11-28
Firbank, L., Bradbury, R., McCracken, D., Stoate, C., Goulding, K. & Harmer, R. et al 2011. Chapter 7: Enclosed farmland. The UK National Ecosystem Assessment Technical Report (UK National Ecosystem Assessment), pp.197-239. UNEP-WMC, Cambridge.
Fisher, B., Bradbury, R. B., Andrews, J. E., Ausden, M., Bentham-Green, S., White, S. M. & Gill, J. A. 2011. Impacts of species-led conservation on ecosystem services of wetlands: understanding co-benefits and tradeoffs. Biodiversity and Conservation, 20, 2461-2481.
Forestry Commission Report. 2003. The Social and Environmental Benefits of Forestry in Britain. Available at: http://www.forestry.gov.uk/economics.
Garrod, G.D. & Willis, K.G. 1997. The non-use benefits of enhancing forest biodiversity: a contingent ranking study. Ecological Economics, 21, 45-61.

Nature conservation and ecosystem service delivery
67
Gelan, A., Slee, W., Brown, K. & Shannon, P. 2007. Examining the commercial potential of recreation on the national forest estate in Scotland. Phase 1 Report. Report to Forestry Commission of Scotland, Edinburgh.
Glaves, P., Egan, D., Harrison, K. & Robinson, R. 2009. Valuing Ecosystem Services in the East of England, East of England Environment Forum, East of England Regional Assembly and Government Office East England. Available at: www.gos.gov.uk/ goee/docs/193474/193503/ vesiee1.pdf
Glück, P. 2002. Property rights and multipurpose mountain forest management. Forest Policy and Economics, 4, 125-134.
Goldman, R., Tallis, H., Kareiva, P. & Daily, G.C. 2008. Field evidence that ecosystem service projects support biodiversity and diversity options. Proceedings of the National Academy of Sciences, 105, 9445-9448.
Grand-Clement, E., Anderson, K., Smith, D., Luscombe, D., Gatis, N. & Ross, M. et al. 2013 Evaluating ecosystem goods and services after restoration of marginal upland peatlands in South-West England. Journal of Applied Ecology, 50, 324-334.
Haines-Young, R. & Potschin, M. 2013. Common International Classification of Ecosystem Services (CICES): Consultation on Version 4, August – December 2012. Report to the European Environment Agency.
Hanley, N. & Spash, C. 1998. Cost-Benefit Analysis and the Environment, Edward Elgar, Cheltenham.
Hanley, N., Willis, K., Powe, N. & Anderson, M. 2002. Valuing the Benefits of Biodiversity in Forests. Report to Forestry Commission, Edinburgh.
Hein, L., Koppen, K.V, de Groot, R.S. & Ierland, E. S. 2006. Spatial scales, stakeholders and the valuation of ecosystem services. Ecological Economics , 57, 209– 228
Hermann, A., Schleifer, S. & Wrbka, T. 2011. The Concept of Ecosystem Services Regarding Landscape Research: A Review (Vol. 5).
Hill, G., Courtney, P., Burton, R. & Pots, J. 2003. Forests’ Role in Tourism. Phase 2. Forestry Commission Report, Edinburgh.
HM Treasury. 2011. The Green Book: Appraisal and Evaluation in Central Government.
HM Government. 2011. The Natural Choice: securing the value of nature Available at: www.official-documents.gov.uk.
Kant, S. & Lee, S. 2004. A social choice approach to sustainable forest management: an analysis of multiple forest values in Northwestern Ontario. Forest Policy and Economics, 7, 215-227.
Kearney, A., Bradley, G., Kaplan, R. & Kaplan, S. 1999. Stakeholder perspectives on appropriate forest management in the Pacific Northwest. Forest Science, 45, 62-73.
Keeney, R. & Eppel, T. 1990. Eliciting public values for complex policy decisions. Journal of Management Science 36 (9), 1011-1030.
IEEP. 2006. Value of Biodiversity Available at: http://www.ieep.org.uk/publications/pdfs/2006/ Value_of_biodiversity-June_06.pdf;

Nature conservation and ecosystem service delivery
68
Jacobsson, K.M. & Dragun, A. 1996. Contingent Valuation and Endangered Species. Methodological and Applications. Cheltenham: Edward Elgar, p. 269.
Jones, L., Angus, S., Cooper, A., Doody, P., Everard, M. & Garbutt, A. et al. 2011. Chapter 11: Coastal margins. The UK National Ecosystem Assessment Technical Report (UK National Ecosystem Assessment), pp.411-457. UNEP-WMC, Cambridge.
Larsen, F.W., Turner, W. & Brooks, T.M. 2012. Conserving critical sites for biodiversity provides disproportionate benefits to people. PLoS ONE, 7, e36971.doi:10.1371/journal.pone.0036971
Mace, G. M., Norris, K. & Fitter, A. H. 2012. Biodiversity and ecosystem services: a multilayered relationship. Trends in Ecology & Evolution, 27, 24-31.
Macmillan, D., Philip, L., Hanley, N. & Alvarez-Farizo, B. 2002. Valuing the non-market benefits of wild goose conservation: a comparison of interview and group-based approaches. Ecological Economics 43, 49–59.
MacMillan, D., Hanley, N. & Daw, M. 2004. Costs and benefits of wild goose conservation in Scotland. Biological Conservation, 119, 475-485.
Maltby, E., Ormerod, S., Acreman, M., Blackwell, M., Durance, I. & Everard, M. et al. 2011. Chapter 10: Freshwaters – openwaters, wetlands and flood plains. The UK National Ecosystem Assessment Technical Report (UK National Ecosystem Assessment), pp.295-360. UNEP-WMC, Cambridge.n 119, 475–485.
MEA [Millennium Ecosystem Assessment]. 2005. Ecosystems and Human Well-being: Synthesis. Island Press, Washington, DC. http://www.millenniumassessment.org/en/index.aspx
Miller, D., Morrice, J., Anderson, L., Durozard, Fidalgo, B., Fry, G., Gaspar, J., Gibon, A., Hassan, R., Hislop, M., Horne, P., Huet, B., Ladet, S., Lange, E., Leandro, N., Messager, P., Mottet, A., Nijnik, M., Ode, A., Pascoa, F., Pinto, L., Quine, C., Schroth, O., Schwarz, G., Shepherd, N., Tveit, M., Vitry, A., Watts, K. & Wissen, U. 2005. Visualization Tools for Public Participation in the Management of Landscape Change, Final Report for the European Commission, VisuLands, Macaulay Institute, U.K.
Miller, D., Vogt, N., Nijnik, M., Brondizio, E. & Fiorini, S. 2009. Integrating analytical and participatory techniques for planning the sustainable use of land resources and landscapes. In: S. Geerteman and J. Stillwell (eds.), Planning Support Systems: Best Practises and New Methods, Springer, 317-345.
Morison, J., Vanguelova, E., Broadmeadow, S., Perks, M., Yamulki, S. & Randle, T. 2010. Understanding the GHG implications of forestry on peat soils in Scotland. Forest Research, October 2010.
Naidoo, R., Balmford, A., Costanza, R., Fisher, B., Green, R.E. & Lehner, B. et al. 2008. Global mapping of ecosystem services and conservation priorities. Proceedings of the National Academy of Sciences, 105, 9495-9500.
Naidoo, R. & Ricketts, T. 2006. Mapping economic costs and benefits of conservation. Plos Biol., 4, 2153–2164.
NAO. 2008. Report of the National Audit Office. http://www.nao.org.uk/wp-content/uploads/2008/11/07081043.pdf
Natural England. 2009. Monitor of Engagement with the Natural Environment.

Nature conservation and ecosystem service delivery
69
NIDA. 2004. Measuring and Improving Costs, Cost-Effectiveness and Cost-Benefit for Substance Abuse treatment Programs, as seen on the website http://www.nida.nih.gov/IMPCOST/IMPCOST2.html
Nijkamp, P. & Spronk, J. 1979. Analysis of Production and Location Decisions by Means of Multicriteria Analysis. Engineering and Process Economics, 4, 285-302.
Nijnik, M., Zahvoyska, L., Nijinik, A. & Ode, A. 2008. Public evaluation of landscape content and change: several examples from Europe. Land use Policy, 26, 77-86.
Nijnik, M. & Mather, A. 2008. Analysing public preferences for woodland development in rural landscapes in Scotland. Landscape and Urban Planning, 86, 267–275.
Nijnik, M. & Miller, D. (in press). Targeting sustainable provision of forest ecosystem services with special focus on carbon sequestration. Elsevier.
Nijnik, M., Nijnik, A., Lundin, L., Staszewski, T. & Postolache, C. 2010. Stakeholder attitudes to multi-functional forests in Europe. International Journal Forests, Trees and Livelihoods, 19, 341-358.
Nijnik, M., Miller, D., Nijnik, A., Fiorini, S., Vogt, N., Brondizion, E. & Morrice, J. 2011. Public participation for planning the sustainable use of natural resources and landscape change: methodology development. The International journal of interdisciplinary social sciences, 5, 303-320.
Norris, K. 2008. Agriculture and biodiversity – opportunity knocks. Conservation Letters, 1, 2-11.
Norris, K., Bailey, M., Baker, S., Bradbury, R., Chamberlain, D. & Duck, C. et al 2011. Chapter 4: Biodiversity in the context of ecosystem services. The UK National Ecosystem Assessment Technical Report (UK National Ecosystem Assessment), pp.63-104. UNEP-WMC, Cambridge.
Nunes, P. A. L. D. & van den Bergh, J. C. J. M. 2001, Economic valuation of biodiversity: sense or nonsense?, Ecological Economics, 39, 203-222.
O’Gorman, S. & Bann, C. 2008. Valuing England’s terrestrial ecosystem services, NR0108 Report for Defra.
O’Neill, R. V. 2001. Is it time to bury the ecosystem concept? (with full military honors, of course!). Ecology 82, 3275-3284.
Pakeman, R.J., Huband, S., Kriel, A. & Lewis, R. 2011. Changes in the management of Scottish machair communities and associated habitats from the 1970s to the present. Scottish Geographical Journal, 127, 267-287.
Pearce, D., Atkinson, G. & Mourato, S. 2006. Cost Benefit Analysis and the Environment: Recent developments, Chapter 18. OECD
Phillips, C. & Thompson, G. 2003. What is Cost-Effectiveness? Volume 1 (3), Hayward Medical Communications Publisher, as seen on the website: www.evidence-based-medicine.co.uk
Posthumus, H., Rouqette, J.R., Morris, J., Gowing, D.J.G. & Hess, T.M. 2010. A framework for the assessment of ecosystem goods and services: a case study on lowland floodplains in England. Ecological Economics, 69, 1510-1523.
Nature conservation and ecosystem service delivery
70
Randall, A. 1993. The problem of market failure. In: Dorfman, R., Dorfman, N. (Eds.) Economics of the Environment. third ed. Norton, New York, NY, pp. 144–161.
RDT. 2009. River Don: Fishery Management Plan (2009-2011). River Don Trust.
Rey Benayas, J.M., Newton, A.C., Diaz, A. & Bullock, J.M. 2009. Enhancement of biodiversity and ecosystem services by ecological restoration: a meta-analysis. Science, 325, 1121-1124.
Rittel, H. & Webber, M. 1973. Dilemmas in a General Theory of Planning, Policy Sciences 4, Elsevier Scientific Publishing, Amsterdam, pp. 155-159.
Rosen, S. 1974. Hedonic prices and implicit markets: product differentiation in pure competition. Journal of Political Economy, 82, 34-55.
Ross, L.C., Woodin, S.J., Hester, A.J., Thompson, D.B.A. & Birks, H.J.B. 2012. Biotic homogenization of upland vegetation: patterns and processes at multiple spatial scales over five decades. Journal of Vegetation Science, 23, 755-770.
Schlapfer, F., Roschewitz, A. & Hanley, N. 2004 Validation of stated preferences for public goods: a comparison of contingent valuation survey response and voting behavior. Ecological Economics 51, 1–16.
Slee, B., Balana, B., Glenk, K., Lago, M., Nijnik, M., Pajot, G. & Urama, K. 2008. Public Good Valuation at Macaulay: An Introduction. MLURI working paper.
Spash, C. L. 2008. How Much is that Ecosystem in the Window? The One with the Bio-diverse Trail, Environmental Values, 17, 259–284.
Scott, A. & Shannon, P. 2007. Local landscape designations in Scotland: Opportunity or barrier to effective landscape management, Landscape and Urban Planning, 81, 257-269.
Steelman, T. & Maguire, L. 1999. Understanding Participant Perspectives: Q-Methodology in National Forest Management. Journal of Policy Analysis and Management, 18, 361-88.
Strijker, D., Sijtsma, F. & Wiersma, D. 2000. Evaluation of nature conservation: An application to the Dutch Ecological Network. Environmental and Resource Economics,16, 363– 378.
TEEB. 2009. The Economics of Ecosystems and Biodiversity for National and International Policy Makers.
TEEB, 2010. The Economics of Ecosystems and Biodiversity: Mainstreaming the Economics of Nature: A synthesis of the approach, conclusions and recommendations http://www.teebweb.org/
The Department for Transport. 2002. Economic Valuation with Stated Preference Techniques: A manual. www.communities.gov.uk/documents/corporate/pdf/146871
Turner, R.K., Morse-Jones, S. & Fisher, B. 2010. Ecosystem valuation: a sequential decision support system and quality assessment issues. Ann N Y Acad Sci 1185:79–101.
Turner, R. K., Morse-Jones, S. & Fisher, B. 2010. A sequential decision support system and quality assessment issues, Annals of the New York academy of sciences.
URS Scott Wilson. 2011. Barriers and Opportunities for Use of Payments for Ecosystem Services in England. Report for Defra, 165p
Nature conservation and ecosystem service delivery
71
Wilson, M. A. & Howarth, R. B. 2002. Discourse-based valuation of ecosystem services: establishing fair outcomes through group deliberation, Ecological Economics 41, 431-443.
UK NEA. 2011. The UK National Ecosystem Assessment Technical Report (UK National Ecosystem Assessment). UNEP-WMC, Cambridge.
Van der Wal, R., Bonn, A., Monteith, D., Reed, M., Blackstock, K. & Hanley, N. 2011. Chapter 5: Mountains, moorlands and heaths. The UK National Ecosystem Assessment Technical Report (UK National Ecosystem Assessment), pp.105-159. UNEP-WMC, Cambridge.
Vejre, H., Søndergaard Jensen, F. & Thorsen, B. J. 2010. Demonstrating the importance of intangible ecosystem services from peri-urban landscapes, Ecological Complexity, 7, pp. 338-348.
Vermeulen, S. & Koziell, I. 2002. Integrating global and local values. A review of biodiversity assessment. IIED Natural Resources Issue Paper. IIED, London.
Wilson, E. (ed). 1988. Biodiversity. Washington DC: National Academy press.
Woodin, S.J., van der Wal, R., Summerkorn, M. & Gornall, J.L. 2009. Differential allocation of carbon in mosses and grasses governs ecosystem sequestration: a 13C tracer study in the high Arctic. New Phytologist, 184, 944-949.
WWF. 2008. Weathercocks & Signposts: The environment movement at a crossroads.

Nature conservation and ecosystem service delivery
72
7 Appendices
7.1 Case study 1-9: Ecosystem service delivery matrix See attached appendices.