CONSERVATION OF ECOSYSTEM SERVICES IN RESIDENTIAL ...
111
CONSERVATION OF ECOSYSTEM SERVICES IN RESIDENTIAL DEVELOPMENTS: LESSONS FROM CONSERVATION-ORIENTED SUBDIVISIONS IN THE UNITED STATES AND IN PERU by HUGO G. COLLANTES (Under the Direction of Amy D. Rosemond) ABSTRACT Conservation Subdivisions attempt to preserve green space threatened by urban sprawl. However, many ordinances are not based on quantitative guidelines for protection of ecosystem services. I evaluated ten Conservation Subdivisions in Cherokee County, GA, analyzing design features to protect two ecosystem services: water quality and wildlife biodiversity. I found various conservation opportunities that the current ordinance forfeits. Therefore, I suggested a scoring system to evaluate Conservation Subdivisions, offering flexibility to developers and planners in making design and approval decisions. I also evaluated the only Conservation Subdivision in Peru, located in Cusco. I found that the Peruvian ordinance advanced ecosystem services conservation through management of a dynamic green space. In contrast, the U.S. ordinance seemed to promote the preservation of a static green space. I concluded that both ordinances should include design and management requirements, and economic incentives to developers and residents, in order to sustain the conservation of ecosystem services. INDEX WORDS: Ecosystem services, Ecological design, Green Space, Urban planning, Residential development, Conservation subdivisions, Cherokee County, Servidumbres ecológicas, Peru
Transcript of CONSERVATION OF ECOSYSTEM SERVICES IN RESIDENTIAL ...

CONSERVATION OF ECOSYSTEM SERVICES IN RESIDENTIAL DEVELOPMENTS:
LESSONS FROM CONSERVATION-ORIENTED SUBDIVISIONS IN THE UNITED
STATES AND IN PERU
by
HUGO G. COLLANTES
(Under the Direction of Amy D. Rosemond)
ABSTRACT
Conservation Subdivisions attempt to preserve green space threatened by urban sprawl.
However, many ordinances are not based on quantitative guidelines for protection of ecosystem
services. I evaluated ten Conservation Subdivisions in Cherokee County, GA, analyzing design
features to protect two ecosystem services: water quality and wildlife biodiversity. I found
various conservation opportunities that the current ordinance forfeits. Therefore, I suggested a
scoring system to evaluate Conservation Subdivisions, offering flexibility to developers and
planners in making design and approval decisions. I also evaluated the only Conservation
Subdivision in Peru, located in Cusco. I found that the Peruvian ordinance advanced ecosystem
services conservation through management of a dynamic green space. In contrast, the U.S.
ordinance seemed to promote the preservation of a static green space. I concluded that both
ordinances should include design and management requirements, and economic incentives to
developers and residents, in order to sustain the conservation of ecosystem services.
INDEX WORDS: Ecosystem services, Ecological design, Green Space, Urban planning,
Residential development, Conservation subdivisions, Cherokee County, Servidumbres ecológicas, Peru

CONSERVATION OF ECOSYSTEM SERVICES IN RESIDENTIAL DEVELOPMENTS:
LESSONS FROM CONSERVATION-ORIENTED SUBDIVISIONS IN THE UNITED
STATES AND IN PERU
by
HUGO GUILLERMO COLLANTES
B.S., Universidad Peruana Cayetano Heredia, Peru, 1994
A Thesis Submitted to the Graduate Faculty of The University of Georgia in Partial Fulfillment
of the Requirements for the Degree
MASTER OF SCIENCE
ATHENS, GEORGIA
2007

© 2007
Hugo Guillermo Collantes
All Rights Reserved

CONSERVATION OF ECOSYSTEM SERVICES IN RESIDENTIAL DEVELOPMENTS:
LESSONS FROM CONSERVATION-ORIENTED SUBDIVISIONS IN THE UNITED
STATES AND IN PERU
by
HUGO GUILLERMO COLLANTES
Major Professor: Amy D. Rosemond
Committee: William L. Ramsey C. Ronald Carroll
Electronic Version Approved: Maureen Grasso Dean of the Graduate School The University of Georgia August 2007
iv
ACKNOWLEDGEMENTS
I thank Amy Rosemond for her academic and affective support throughout my studies at
The University of Georgia, and for never losing faith in me. I thank William Ramsey for his
guidance and constant encouragement, as well as for inspiring in me an interest in urban design. I
thank Ronald Carroll for his coaching in writing my thesis, as well as for the many lessons in
conservation I learned in his company. I thank Liz Kramer and the NARSAL lab for their
support at the beginning of my research project. I thank Jeff Watkins, Vicki Taylor, and Priscilla
Hamilton in the Cherokee County government for providing me valuable information and
facilitating my use of development plats. I thank Carlos Rodriguez and Percy Farfán in the Santa
Maria Homeowners Association for providing me important information and guiding my visit of
their property in Cusco, Peru. I thank Krista Haynes and Craig Edelbrock in the Graduate School
for their help in completing my degree. I thank the faculty, students, and staff at the Odum
School of Ecology and at the School of Environmental Design, for the numerous ways in which
they contributed to my academic and personal development. I thank Marshall Darley, Kristen
Miller, William Nelson, Lamara Martin, and the rest of “my people” in the Biological Sciences
Division for their friendship, encouragement, and support. I thank my students in biology for
becoming a source of encouragement and inspiration during difficult times. I thank family and
friends in Peru and in the U.S., and in particular Christie and Michael Moody for their loving
care and support. Finally, I thank Gwyneth Moody for her unconditional love, for becoming a
source of happiness in my life, and preventing me from dying of self-inflicted “cookie-induced”
hyperglycemic shock.

v
TABLE OF CONTENTS
Page
ACKNOWLEDGEMENTS ....................................................................................................... iv
LIST OF TABLES....................................................................................................................vii
LIST OF FIGURES .................................................................................................................viii
CHAPTER
1 INTRODUCTION.....................................................................................................1
1.1 Conservation Subdivisions in the United States ...............................................4
1.2 Ecological Services Subdivisions in Peru.........................................................7
2 EVALUATION OF TEN CONSERVATION SUBDIVISIONS IN CHEROKEE
COUNTY, GA .................................................................................................... 12
2.1 Design Features that Contribute to the Conservation of Water Quality........... 14
2.2 Design Features that Contribute to the Conservation of Wildlife Diversity..... 18
2.3 Methods ........................................................................................................ 28
2.4 Results........................................................................................................... 34
2.5 Discussion ..................................................................................................... 37
2.6 A Scoring System for Evaluation of Conservation Subdivisions .................... 43
2.7 Conclusion .................................................................................................... 47
3 EVALUATION OF AN ECOLOGICAL SERVICES SUBDIVISION IN CUSCO,
PERU.................................................................................................................. 64
3.1 Methods ........................................................................................................ 66
vi
3.2 Results........................................................................................................... 67
3.3 Discussion ..................................................................................................... 70
3.4 Opportunities for Improvement of Ordinances in both Peru and the U.S. ....... 73
3.5 Conclusion .................................................................................................... 76
REFERENCES......................................................................................................................... 80
APPENDICES.......................................................................................................................... 91
A Development plat for Bridgemill Unit 4G, Cherokee County, GA............................ 91
B Development plat for Bridgemill Unit 4G, Cherokee County, GA (continuation)..... 92
C Development plat for Forest Creek, Cherokee County, GA...................................... 93
D Development plat for Governor’s Preserve Unit 4, Cherokee County, GA ............... 94
E Development plat for Hearthstone Unit 2, Cherokee County, GA ............................ 95
F Development plat for Heritage Oaks, Cherokee County, GA.................................... 96
G Development plat for Laurel Trace, Cherokee County, GA...................................... 97
H Development plat for Pebblebrook (f.k.a. Ridgewood), Cherokee County, GA ........ 98
I Development plat for Smithwick Crossing, Cherokee County, GA .......................... 99
J Development plat for Sweetbriar, Cherokee County, GA....................................... 100
K Development plat for Wolf Creek Park, Cherokee County, GA.............................. 101
L Development plat for Santa Maria, Cusco, Peru..................................................... 102

vii
LIST OF TABLES
Page
Table 1.1: Minimum lot size permitted for subdivisions in Cherokee County, GA..................... 11
Table 2.1: Zoning and house lots in Conservation Subdivisions ................................................ 49
Table 2.2: House lots that extend into riparian buffers............................................................... 50
Table 2.3: Ephemeral streams in Conservation Subdivisions ..................................................... 51
Table 2.4: Amount of green space in Conservation Subdivisions............................................... 52
Table 2.5: Regulated and unregulated land designated as green space ....................................... 53
Table 2.6: Edge effects and green space configuration .............................................................. 54
Table 2.7: Difference between the average lot size and the minimum lot size permitted ............ 55
Table 2.8: A scoring system for evaluation of Conservation Subdivisions ................................. 56

viii
LIST OF FIGURES
Page
Figure 2.1: Locations of Conservation Subdivisions in Cherokee County, GA .......................... 57
Figure 2.2: Alternative to a stream crossing in Forest Creek Conservation Subdivision ............. 58
Figure 2.3: Alternative to a stream crossing in Heritage Oaks Conservation Subdivision........... 59
Figure 2.4: Disturbance of ephemeral streams predicted by two green space variables .............. 60
Figure 2.5: Green space configuration in Bridgemill Conservation Subdivision ........................ 61
Figure 2.6: Green space configuration in Sweetbriar Conservation Subdivision ........................ 62
Figure 2.7: Green space configuration in Pebblebrook Conservation Subdivision...................... 63
Figure 3.1: Location of Santa Maria Ecosystems Services Subdivision in Cusco, Peru.............. 78
Figure 3.2: Green space in the Santa Maria Ecosystem Services Subdivision in Cusco, Peru..... 79

1
CHAPTER 1
INTRODUCTION
Ecosystem services are the natural processes that support life and provide for the basic
needs of human societies. Examples include: air and water purification, flood control, soil
fertility, pollination of crops, dispersal of seeds, maintenance of biodiversity (from which we
derive a variety of food, medicinal, and industrial products), and climate regulation, as well as
opportunities for outdoor recreation, aesthetic enjoyment, and intellectual stimulation (Daily
1997a). Furthermore, it can be argued that ecosystem services also include psychological
benefits such as stress relief (Rohde and Kendle 1997) and real estate benefits such as
appreciation of property values (Geoghegan 2002).
Estimating the value of ecosystem services to human societies is a difficult task
(Costanza et al. 1997). However, we know that they are essential to us, that attempting to provide
the same services by substituting engineered systems for natural ecosystems can be prohibitively
expensive or technologically unfeasible, and that we want future generations to enjoy and benefit
from them (Costanza and Folke 1997, Peterson and Reichert 1997). Therefore, the conservation
of ecosystem services should be seen as a primary goal of human endeavor.
The provision of ecosystem services is jeopardized by multiple factors affecting the
integrity of ecosystems. These include over-harvesting of natural resources (e.g. deforestation,
water appropriation), pollution, global warming, and land conversion for agriculture and
urbanization (Barbier et al. 1994, Johnson 2001). Of these, urbanization is the single most
encompassing cause of ecosystem service deterioration (Farber 2005).

2
Urbanization alters the hydrology of watersheds (Arnold and Gibbons 1996) and causes
stream quality deterioration (Miltner et al. 2004, Walsh et al. 2005). Urbanization threatens
biodiversity by means of habitat fragmentation and deterioration (Johnson and Klemens 2005),
as well as by favoring some species over others, leading to biotic homogenization (McKinney
2006). Urbanization also threatens farming and agricultural productivity by converting fertile
soils and farmland to urban and suburban land-uses (Brown et al. 2005).
Urbanization is the most ubiquitous of human activities (Czech et al. 2000). In the next
30 years the world’s population is projected to increase by more than one third, and almost all of
this growth is expected to occur in urban areas (United Nations Population Division 2004). In the
U.S., 30% of the population lives in metropolitan urban areas while 50% lives in suburban areas
(United States Census Bureau 2005). Urbanization in the U.S. is projected to increase by 79% in
the next 25 years, with the total proportion of developed land increasing from 5.2% to 9.2%
(Alig et al. 2004). Currently, rapidly expanding metropolitan areas like Atlanta consume between
370 acres (Bullard et al. 1999) and 500 acres (Lacayo et al. 1999) of undeveloped land a week.
In the U.S., a diverse array of regional planning policies and land development
regulations have been used over the past three decades to try to mitigate the impact of
urbanization on ecosystem services. These include land-use zoning, green-space acquisition,
conservation easements, transferable development rights, conservation subdivisions, riparian
buffers, erosion control restrictions, and stormwater best management practices (Porter 1997,
McElfish 2004). Of these, Conservation Subdivisions have a unique potential to achieve local as
well as regional conservation goals. While conserving a small parcel of land within a residential
subdivision they can contribute to a regional green-space network (Arendt 2004). In addition, by

3
keeping a piece of nature near homes, Conservation Subdivisions have a unique potential to
engage and educate its residents.
The degree to which Conservation Subdivisions can contribute to broader conservation of
ecosystem services depends on the specific regulations established by each local government in
their code of ordinances. In the U.S., Conservation Subdivision ordinances typically regulate the
type and amount of land to be conserved. Thus, emphasis is given to pre-development
compliance and incentives. In other countries, like in Peru, Ecological Services Subdivisions
play the same role as Conservation Subdivisions do in the U.S. The corresponding ordinance
regulates the management of the land conserved in order to provide ecosystem services. Thus,
emphasis is given to post-development compliance and incentives. These two approaches have
much to learn from one another. Sound management would achieve little if a minimum of land
and ecological assets were not set aside for conservation at the onset of development. Similarly,
careful selection of land and ecological assets for conservation would yield diminishing gains if
these were not to be appropriately maintained and even improved once the last house is built and
its buyers move in.
The purpose of this study is to analyze both approaches to conserving ecosystem services
on private residential subdivisions in order to extract lessons that will inform local governments
in both the U.S. and Peru, hopefully inducing positive amendments to their current ordinances.
The analysis of the approach in the U.S. will evaluate the Conservation Subdivision ordinance of
Cherokee County, Georgia. The Peruvian counterpart will be the Ecological Services
Subdivision ordinance of the municipality of San Sebastian, Cusco.

4
1.1 Conservation Subdivisions in the United States
Conservation Subdivisions are an adaptation of Cluster Developments. Proposed as early
as the 1880’s, Cluster Developments aimed to preserve the rural character of countryside
residential developments by clustering the houses in one portion of the property (Whyte 1964).
The remaining land was left undisturbed, thus preserving the original vegetation cover or its
original use as farmland. In the years since, cluster developments have been used in more
urbanized settings, and have more recently been referred to as Open Space or Green Space
developments. Historically, the land set aside has both served a purely aesthetic purpose and
been used to provide recreational amenities, including picnic areas, ball fields, golf courses,
tennis courts, and swimming pools. In contrast, Conservation Subdivisions were proposed in the
mid 1990s as an improved approach to preserving land in private residential developments
(Gillham 2002).
Building upon the concept of cluster developments, the concept of Conservation
Subdivisions calls for careful selection of the land to be preserved according to its significance as
farmland or due to its ecological importance (Arendt 1996). This was a clear response to
concerns raised by the accelerating pace of urban sprawl experienced by different communities
and metropolitan areas in the U.S. during the 1980’s and into the 1990’s (Porter 1997). These
concerns included the loss of productive farmland as well as forestland, along with concerns over
the associated loss of water quality and wildlife species. Furthermore, aesthetic concerns became
more important than in the past, as many small communities saw with alarm the loss of the rural
character of the land.
While this aesthetic value is difficult to define, Conservation Subdivisions have been
variously explicit in proposing to preserve small farms, sizeable tracts of forest, wetlands and

5
riparian areas, as well as land that would constitute a risk to the integrity of natural resources if
developed, such as steep slopes posing an increased risk of erosion (Arendt 1996). Some of
these, like wetlands and steep slopes, are unsuitable for building. Others, like riparian buffers but
also wetlands and steep slopes, may be required to be left undisturbed, either by state or local
regulations. Thus, what is meant to distinguish Conservation Subdivisions from conventional
subdivisions is the voluntary action on the part of the developer to set aside land that, although
perfectly suitable for building, physically and legally, may contribute to ameliorate the negative
impacts of urban sprawl (Johnson 2001).
Various counties in the U.S. have incorporated Conservation Subdivisions into their
development ordinances (Gillham 2002). The implementation of these ordinances varies widely
by county. A common denominator however is a reduction in the minimum size required for
house lots compared to that for conventional subdivisions. Another commonality of these
ordinances is to remain density neutral (McElfish 2004). That is, the number of lots in a
Conservation Subdivision is required to remain the same as if it were to be developed
conventionally; with the maximum number of lots allowed on a parcel of land being determined
by the zoning designation. These two provisions, reduced minimum lot size and density
neutrality, allow developers to preserve land and still develop the same number of lots.
While preserving land is a voluntary action, it is assumed that the developer would
always opt to build lots as small and as close together as possible. This assumption is based on
the potential savings derived from a reduced need for paved roads and a smaller utility network
to service the same number of lots. Thus, a reduction of 50% in the minimum lot size required by
the current ordinance, would in theory promote the development of Conservation Subdivisions
that could designate as much as 50% of the area of the property as green space. This was the

6
rationale followed by Cherokee County, Georgia, when it incorporated Article 23 in its Code of
Ordinances in 1998. According to this Conservation Subdivision Ordinance, developers were
allowed to build lots half the size of that otherwise mandated by the corresponding zoning
designation, with exceptions made for lots requiring a septic system (Table 1).
By the end of 2004, Cherokee County had approved construction of 54 Conservation
Subdivisions. The amount and characteristics of the land preserved in these subdivisions varied
widely, and County Commissioners as well as officials in the Planning and Zoning Department
expressed dissatisfaction with many of these subdivisions (Jeff Watkins, Dir., Cherokee County
Planning and Zoning Dept., pers. comm.). Their concerns included subdivisions that preserved
very little land in addition to what was already mandated, like riparian buffers and buffers in
between subdivisions. They were also concerned about subdivisions that featured fragmented
green space, with isolated patches serving no clear conservation purpose, as well as subdivisions
that provided little access to the green space by its residents. As a result, the county’s Board of
Commissioners approved an amendment to Article 23, which was adopted on April 20, 2005
(Cherokee County Board of Commissioners 2005a, Williams 2005a). This amendment included
regulations aimed at increasing the amount of green space, reducing fragmentation, and
increasing accessibility for the residents of a Conservation Subdivision.
Since the amendment, a total of six Conservation Subdivisions have been approved for
construction as of February 16, 2007. Of these, five had filed the application for construction
approval before the amendment was adopted, so the new regulations do not apply to them. This
means that in almost two years since the amendment of Article 23, only one new Conservation
Subdivision had been approved, in contrast to 25 approved in the two years prior to the
amendment. This has prompted a new wave of concern among county officials, who now believe

7
the new regulations may have been too strict and are contemplating a revision of Article 23 (Jeff
Watkins, Dir., Cherokee County Planning and Zoning Dept., pers. comm.; Williams 2005b).
Many other counties have had a similar experience when implementing different forms of cluster
developments. In most cases, the county reverted to a more relaxed ordinance (Porter 1997,
Shearer 2005).
It should be noted that regulations in the amendment to Article 23 were set rather
arbitrarily, based on consensus of commissioners’ personal opinions (Vicki Taylor, Zoning
Admin., Cherokee County Planning and Zoning Dept., pers. comm.). These include requiring
that green space comprise at least 40% of the property area, that at least 75% of this be in a
contiguous tract, that at least 15% of the green space consist of land suitable for building, and
that at least 75% of the lots abut or be across the street from the green space. These regulations
respond to valid concerns. Moreover, it can be argued that a minimum amount of green space on
a contiguous tract providing access to most of the residents is a desirable thing. However, it is
not clear whether these regulations will contribute to the conservation of land that is more
valuable to the provision of ecosystem services.
This study evaluated a sample of Conservation Subdivisions in Cherokee County in order
to determine whether the regulations included in Article 23 translated into residential
developments that contribute to the conservation of ecosystem services. A set of
recommendations for further improvement of this ordinance is presented.
1.2 Ecological Services Subdivisions in Peru
In Peru, conservation on private lands was made possible in December 2001 with the
promulgation of the Private Conservation Areas Law (Decreto Supremo 038-2001-AG; SPDA

8
2004). For the most part, private conservation of land has been limited to rural areas, usually
within the limits of large tracts of land devoted to farming and forestry. Conversely, land set
aside within urban areas has been limited to public properties and typically is only conceived of
for the creation of parks.
The dense, compact urban growth pattern associated with European cities has been the
norm for most Peruvian cities since the Spanish colonial time (Leonard 2000). It was during the
early 1990’s that major cities in Peru started to experience some of the sprawling pattern of
growth common to many U.S. cities. Combined with an accelerating rate of migration from rural
areas to urban centers, land in the outskirts of cities has been lost to housing developments at an
alarming pace. The metropolitan area of Cusco, Peru experienced a 29.7% population increase in
the period 1993-2005 (Instituto Nacional de Estadísticas e Información 2006). This rate of
growth would place Cusco in between metropolitan areas like Houston, Texas and Atlanta,
Georgia in the U.S., which during the period 1990-2000 grew by 25.2% and 38.9%, respectively
(United States Census Bureau 2005).
The rate of population growth in Cusco has increased the pace of land development.
Agricultural land in the urban periphery has been converted to urban uses, and the trend
continues year after year. Owners of these lands are usually willing to sell, given the sudden
increase in value of their property. Those who would rather keep their land are often forced to
sell in the face of increased property taxes. In the midst of this situation, the Santa Maria
Homeowners Association in the Municipality of San Sebastian, Cusco has managed to hold onto
a 96-acre tract of land they had kept as undisturbed forest since 1964, when they purchased the
220-acre property to build their homes (Villegas 2006).

9
This tract of forest was intentionally left undisturbed as they clustered their homes in a
manner similar to a Conservation Subdivision. Back in 1964 however, no legislation regarding
this type of development existed. The absence of legislation meant that the Santa Maria
Homeowners Association was subject to the same market forces affecting other communities
(Carlos Rodriguez, Pres., Santa Maria Homeowners Association, pers. comm.). Thus, in order to
avoid having to sell this tract of forest, they sought to protect it in perpetuity and declare it
exempt from taxes. To this end, they appealed to Article 1035 of the Peruvian Civil Code, an
ordinance that regulates the creation and transaction of land easements. In this ordinance, land
easements are referred to as “Servidumbres”, a Spanish word meaning “services provider.” The
meaning of this term was of particular interest to Santa Maria Homeowners Association as they
sought tax exemption on the tract of forest they had preserved. They argued that this tract of
forest provided services to the community by controlling erosion, purifying water, maintaining
local biodiversity, and beautifying the landscape surrounding the city of Cusco, thus contributing
to its tourism-dependent economic life.
Their case received support and legal representation from the Peruvian Society of
Environmental Law (SPDA), leading to the inclusion of “Servidumbres Ecológicas” (i.e.
Ecological Services Easements) in the Peruvian Civil Code (Decreto Legislativo 295, SPDA
2004). Under this legal framework, the land owned by Santa Maria Homeowners Association
was recognized in 2005 as the first Ecological Services Subdivision in the nation (Villegas
2006).
This recognition required that a management plan be implemented in order to guarantee
the conservation and long-term provision of ecosystem services. In addition, negotiating tax
exemption for the undisturbed portion of the property necessitated that the homeowners

10
association pursued designation as a non-profit, non-governmental organization. The
Municipality of San Sebastian, where the property is located, required that access to the forest be
provided to the public. Thus, in becoming a non-governmental organization, Santa Maria
Homeowners Association established as its mission the use of their land to host environmental
education and outreach activities for the children of neighboring communities.
The precedent set by Santa Maria Homeowners Association and the Municipality of San
Sebastian will hopefully motivate owners, developers, and governments in other municipalities
to follow in their footsteps. Thus, ordinances regulating Ecological Services Subdivisions are
likely to emphasize the management of the land preserved as well as its use for the benefit of the
larger community. However, it is not clear whether management regulations will suffice to
guarantee the conservation of ecosystem services, or if it necessitates ordinances to include
development regulations as well.
This study evaluated the development and management practices implemented by the
Santa Maria Homeowners Association, in order to determine the degree in which these
contribute to the conservation of ecosystem services. The results of this evaluation are compared
to those obtained in the evaluation of Conservation Subdivisions in Cherokee County, GA.
Recommendations for the improvement of the ordinances in both countries are presented.

11
Table 1.1: Minimum lot size permitted for subdivisions in Cherokee County, GA. The maximum dwelling units per acre (DUA) permitted is the same in Conservation Subdivisions than in conventional developments, and varies according to zoning. The minimum lot size permitted in Conservation Subdivisions is at least one half the minimum in conventional developments.
Minimum lot size permitted (Square foot) Zoning district
Maximum density (DUA)
Conventional development
Conservation subdivision
Conservation on septic system*
AG 0.5 87,120 40,000 40,000 R-80 0.545 80,000 40,000 40,000 R-60 0.726 60,000 30,000 30,000 R-40 1.089 40,000 20,000 25,000 R-30 1.452 30,000 15,000 25,000 R-20 2.178 20,000 10,000 25,000 R-15 2.904 15,000 7,500 25,000
*Minimum lot size permitted on septic system is 21,780sf according to Georgia Law.

12
CHAPTER 2
EVALUATION OF TEN CONSERVATION SUBDIVISIONS IN CHEROKEE COUNTY, GA
Planning and design for conservation of ecosystem services in urbanizing areas has been
advocated for at least four decades (McHarg 1969, Laurie 1979, Lyle 1985, Van der Ryn and
Cowan 1995, Perlman and Milder 2004). Research institutions and regulatory agencies are
starting to incorporate the conservation of ecosystem services as a goal in planning for land-use
change (Peterson et al. 2003), road infrastructure (Brown 2006), and economic development
(Wilcox and Harte 1997, Wainger et al. 2004). This has been made possible by advances in
conservation ecology, showing the impact of land development on ecosystem services (May et
al. 1997, De Marco and Coelho 2004, Scanlon et al. 2005, Huston 2006) and ways in which
ecological principles can be incorporated into planning and land management (Theobald et al.
2000, Kremen 2005). Also, advances in economics and policy, highlighting the value of
ecosystem services (Heal 2000, Salzman et al. 2001, Irwin 2002, Pagiola et al. 2004) and
creating legal instruments for the conservation of ecosystem services (Heal et al. 2001, McElfish
2004, Ruhl et al. 2007). As a result, county governments are increasingly adopting planning and
management programs for the conservation of ecosystem services like water quality (e.g. Fairfax
County, VA 2004), agricultural productivity (e.g. Sheboygan County, WI 2005), fisheries (e.g.
King County, WA 2006), and sustained biodiversity (e.g. Pima County, AZ 2002).
These programs aim at conserving ecosystem services at a regional scale, thus involving
strategies that apply to the level of watersheds or cross-town greenways (Little 1995, Center for
Watershed Protection 1998, Benedict and McMahon 2006). These strategies include the use of

13
planning tools designed to prevent the development of large parcels of land to be designated as
green space (Honachefsky 1999, McElfish 2004, Daly and Klemens 2005). Conservation
Subdivisions were conceived using the same approach. Recommendations for the design of
Conservation Subdivisions call for setting aside green space, composed of land that is worth
protecting due to its importance as an ecological or agricultural asset (Arendt 1996). At the scale
of subdivisions however, the amount of green space that can be afforded is comparatively small,
and the flow of ecosystem services at this scale has not been adequately characterized (Chan et
al. 2006). Furthermore, the constraining effects of topography and property boundaries on the
design of green space are stronger at the scale of a subdivision than at a regional scale (William
Ramsey, Assoc. Prof., School of Environmental Design, University of Georgia, pers. comm.).
The limited ability to provide green space, and the increased difficulty of its design, call
into question the potential of Conservation Subdivisions in contributing to the conservation of
ecosystem services. For instance, recent evidence suggests that Conservation Subdivisions are no
different than conventional subdivisions in sustaining biodiversity (Lenth et al. 2006). The
authors of this study point to the small area, poor design, and lack of management of the green
space in Conservation Subdivisions as the likely explanation for their findings. Moreover, it has
been suggested that for many conservation developments, including Conservation Subdivisions,
it is the name, not the practice, what is different from conventional developments (Feller 2003,
Pejchar et al. 2006).
Conservation Subdivisions do have the potential to contribute effectively to the
conservation of ecosystem services, albeit limited to their size and occurrence of natural features
within its boundaries. To realize this potential, I suggest that ordinances regulating the
development of Conservation Subdivisions must incorporate knowledge derived from the science

14
of ecology and relevant to the design of green space. Ultimately, it is the quality of the green
space what differentiates Conservation Subdivisions from conventional forms of development. In
addition, Conservation Subdivision ordinances must make explicit the specific ecosystem
services to which conservation it attempts to contribute, thus allowing for further improvement
as new knowledge is generated by research in these particular fields.
In this study I evaluated the design of a sample of Conservation Subdivisions in Cherokee
County with regard to their potential for conserving two ecosystem services: water quality and
wildlife diversity. I used current knowledge in ecology to derive specific design features to
evaluate the development plats of these subdivisions. I decided to focus on the development plats
because these are the basis for the approval process of Conservation Subdivisions. Thus, I expect
to identify opportunities for conservation not contemplated in the current ordinance, and provide
new guidelines for the revision of development plats during the approval process.
2.1 Design Features that Contribute to the Conservation of Water Quality
Water quality is one of the most important services provided by freshwater ecosystems
(Postel and Carpenter 1997). Conservation Subdivisions, like any other residential development
in Cherokee County, are required to include design features that contribute to the conservation of
water quality of streams and other freshwater ecosystems like lakes and wetlands. These include
riparian buffers (Cherokee County Board of Commissioners 2005b), storm water management
systems (Cherokee County Board of Commissioners 2005c), and best management practices for
erosion and sedimentation control (Cherokee County Board of Commissioners 2005d).
Because Conservation Subdivisions are explicitly proposed to do more in contributing to
the conservation of ecosystem services, this study suggests design features that complement or

15
improve those already required by the county’s development authorities. These design features
apply to subdivisions in which streams and other surface waters occur. Even where stream
channels are not identifiable, ephemeral streams may still occur (Hansen 2001). Therefore, some
design features may apply to subdivisions where surface waters are not evident.
2.1.1 Wider Riparian Buffers
Riparian buffers contribute to conserving water quality by protecting the physical,
chemical, and biological integrity of streams, lakes, and wetlands (Welsch 1991). They prevent
bank erosion, reduce sediment and nutrient loading, filter pollutants in runoff, and maintain
temperature and light conditions adequate for aquatic organisms (Verry et al. 1999). The ability
of riparian buffers to perform these functions depends on their width and continuity (Schuler
1995). In turn, landscape characteristics such as slope, soil type, vegetation, drainage area,
impervious surfaces, and land use influence the effectiveness of a riparian buffer. After
reviewing the literature on these factors Wenger (1999) concluded that, from a regulatory
standpoint, riparian buffers must be required a minimum width varying from 50ft to 100ft
according to the type of land use expected to occur adjacent to the buffer. The type of land use is
determined by the zoning classification. Thus, land zoned industrial should be required wider
buffers than land zoned residential, because of the higher risk of water pollution in the former
type of land use. In addition, Schuler (1995) has made the case for extending riparian buffers to
the 100-year floodplain, thus ensuring that the benefits derived from riparian buffers will be
maintained over the long-term, rather than suffer a set back when a major flood occurs.
In Georgia, the state mandates 25ft buffers for all streams and 50ft buffers for trout
streams (Georgia Department of Natural Resources 2005). In addition, each county within the

16
State may require wider buffers. For example, Athens-Clarke County mandates 75ft riparian
buffers for all streams (Athens-Clarke County Government 2006), while Cherokee County
mandates 50ft for all streams (Cherokee County Board of Commissioners 2005b).
Given the value of riparian buffers for conserving water quality, Conservation
Subdivisions should be expected to locate green space in a way that extends the effective width
of riparian buffers beyond what is required of conventional developments. Thus, design features
that Conservation Subdivisions could include are: green space located along riparian buffers to
provide at least 50ft of additional buffer, and inclusion of the 100yr floodplain in the green
space.
2.1.2 Fewer Stream Crossings
Benefits derived from riparian buffers can be counteracted by the presence of road stream
crossings. Aside from the direct disturbance of a stream during construction, stream crossings
contribute to streambed modification, bank erosion, and bed scouring downstream (May et al.
1997, Thom 2000). Stream crossings can also constitute insurmountable barriers for fish and
some aquatic invertebrates (Warren and Pardew 1998), particularly if what replaces the natural
channel is a narrow long culvert. In addition, stream crossings become a direct point of entry for
pollutants carried by road runoff into the stream (Perdikaki and Mason 1999, Trombulak and
Frissell 2000).
Stream crossings are an almost inevitable feature of residential developments where a
stream is present. The number of stream crossings on a particular development depends on
whether the topography allows for roads to reach all land suitable for building within the
property. Developers would rationally prefer a road layout that minimizes the number of stream

17
crossings needed, as their construction entails a significant cost (William Ramsey, Assoc. Prof.,
School of Environmental Design, University of Georgia, pers. comm.).
Given these conditions, Conservation Subdivisions should be expected to minimize the
number of stream crossings by presenting a reasonable road layout. Thus, a design feature that
Conservation Subdivisions could include is a road layout that avoids crossing streams when
alternate routes exist.
2.1.3 Less Ephemeral Streams Disturbed
Ephemeral streams are those that occur during a storm event and disappear soon after the
rain ceases. They occur as rainwater saturates the soil on a slope and runoff begins to concentrate
on aligned crenulations of the topography (United States Army Corps of Engineers 2002).
Ephemeral streams then converge into intermittent and or perennial streams. Unlike the latter
two types of streams however, ephemeral streams do not receive protection from riparian
buffers, as ordinances typically overlook hydrogeomorphic considerations at this scale (Marsh
and Marsh 1995).
A survey of stream types in the Chattooga River watershed, which expands over the
states of Georgia, South Carolina and North Carolina, found that about one half of the total
network of streams was comprised of ephemeral streams (Hansen 2001). Therefore, the
contribution of this type of stream to water quality in intermittent and perennial stream can be
presumed to be quite significant.
Inevitably, the development of land for residential subdivisions disturbs existing
ephemeral streams, as these are made evident only when it rains, and ultimately because there is
no regulation requiring their protection. Grading and paving alter the network of ephemeral

18
streams by changing the topography and suppressing some of the streams. In addition, lawn care
and landscaping practices contribute pollutants and sediments to these streams.
Given these conditions, Conservation Subdivisions should be expected to minimize the
number of ephemeral streams disturbed by land development. Thus, design features which
Conservation Subdivisions could include are: green space that contains a high proportion of the
ephemeral streams in the property, and house lots that are close in size to the minimum permitted
rather than occupying excessive land area.
2.2 Design Features that Contribute to the Conservation of Wildlife Diversity
The services provided by ecosystems in a given region require that the functioning of
these ecosystems not be altered. For ecosystems to function normally, the diverse array of wild
species that are part of it must be sustained (Tilman 1997).
The design features that contribute to the conservation of water quality described
previously also contribute to the conservation of wildlife biodiversity. Good water quality
contributes to the water-supply needs of wildlife. Furthermore, riparian buffers protect the
habitat of aquatic species and provide habitat for terrestrial fauna. Riparian buffers 100ft wide
are usually enough to protect habitat for aquatic species (Jackson 2006). Recommendations to
protect habitat for terrestrial species, in particular forest-dwelling birds as well as some small
mammals, reptiles and amphibians, call for riparian buffers up to 100m (328ft) wide (Burke and
Gibbons 1995, Shirley and Smith 2005, McDonald et al. 2006). Lee et al. (2004) found that
about one half of the jurisdictions in the U.S. and Canada acknowledge in their regulations the
importance of riparian buffers for terrestrial wildlife, and 96% require a minimum width between
50 and 100ft. Thus, as is the case for water quality conservation, wider riparian buffers are a

19
desirable design feature for conservation of wildlife biodiversity in Conservation Subdivisions.
The importance of protecting riparian buffers cannot be exaggerated, as the number of terrestrial
and amphibious animal species that occur in a region has been shown to increase by 50% when
undisturbed riparian zones exist (Sabo et al. 2005).
Conservation Subdivisions have the potential to further contribute to the conservation of
terrestrial fauna because the undisturbed portion of the property set aside as green space can
provide suitable habitat for native species that would otherwise be displaced. However, this
potential can only be realized if the design of Conservation Subdivisions takes into account the
habitat requirements of at least some of these species.
Studies along urbanization gradients have shown that abundance and diversity of
terrestrial species including birds, small mammals, predators like coyotes, and even butterflies,
tend to decrease from exurban to urban landscapes (Blair 1996, Maestas et al. 2003, Hansen et al.
2005, Bock et al. 2007). Shrinkage and fragmentation of natural habitat, changes to the structure
and composition of the vegetation, competition from exotic and edge species, and increased
predation and brood parasitism are suggested as causes for this trend (Nilon et al. 1995, Hansen
et al. 2005, McKinney 2006). In addition, some studies have shown that species richness of birds
and butterflies increases in suburban landscapes with well-established tree and shrub vegetation,
providing support to the hypothesis that the number of species will be higher at intermediate
levels of disturbance (Jokimaki and Suhonen 1993, Blair and Launer 1997, Hennings and Edge
2003). These findings can be explained as the result of the interplay between increasing numbers
of synanthropic species (i.e. species associated with human activity) and decreasing numbers of
species that were dominant before development. Thus, Conservation Subdivisions located in
suburbanizing areas like Cherokee County have a unique potential to protect species native to the

20
region (or at least those present prior to development) by providing green space that suits their
habitat needs. These needs vary with species, and it can be expected that at the scale of
residential subdivisions, only the needs of small animal species will be met.
Studies regarding habitat conservation in urbanizing landscapes have focused mostly on
habitat requirements of forest bird species. Factors affecting the quality of bird habitat include
the size and configuration of undisturbed vegetation left, the number of distinct environments
(e.g. patches of forest and grassland), and the intensity of disturbance derived from human
presence (e.g. noise and wandering pets) (Marzluff et al. 1998, Marzluff and Ewing 2001,
Hennings and Edge 2003). These factors however, are not part of Conservation Subdivision
ordinances in regulating the development and design of green space.
Because studies regarding other terrestrial species are scarce, this study emphasizes
design features that contribute to the conservation of bird species. Regulation of these features in
Conservation Subdivision ordinances can be subsequently modified, as research on the habitat
requirements of other species in urbanizing landscapes becomes available.
2.2.1 Larger Green Space Area
Typically, Conservation Subdivision ordinances require that a minimum percentage of
the property be left undisturbed as green space. A percentage requirement (i.e. a fraction of the
total area of the property) however, does not necessarily result in green space that provides
enough area for bird species. That is, the application of a percentage requirement to a given land
property will result in less green space area than that afforded by a larger property.
Specific area recommendations for bird habitat vary with species and type of land (e.g.
grassland, forest, wetland). Some research on bird habitat has focused on riparian zones. Habitat

21
size recommendations in most of these cases is based on buffer widths (Lee et al. 2004, Shirley
and Smith 2005, Smith and Wachob 2006). Wider riparian buffers have already been described
as desirable design features of Conservation Subdivisions. Some of these developments however,
may occur on parcels of land that do not contain riparian zones. Thus, the issue of minimum area
recommendations for green space becomes all the more important.
Most studies regarding habitat requirements of birds have focused on forest species. It
should be noted that area requirements of forest species can be very different from those of
species inhabiting other ecological communities, like grasslands (Johnson and Igl 2001, Winter
et al. 2006) or swamps (Sallabanks et al. 2000). These differences should be taken into account
before including habitat area requirements in Conservation Subdivision ordinances. Each county
should consider the most adequate area requirements according to the ecological community that
is predominant in the region where it is located. Thus, Cherokee County, GA, located in the
north part of the Atlanta metropolitan area, occupies predominantly forested land consisting of
mixed hardwoods and some species of pine. Therefore, pertinent area requirements are those that
apply to forest-interior bird species.
Different species of forest birds have different area requirements for habitat. For
example, Donnelly and Marzluff (2004) looked at reserves of different sizes embedded in
landscapes of varying degrees of urbanization in the metropolitan area of Seattle, WA. They
found that species like the Hutton’s Vireo, the Golden-crowned Kinglet, and the Yellow-rumped
Warbler (the latter two present in north Georgia during their non-breeding season) were most
abundant in reserves of about 35, 21, and 2ha (87, 52, and 5ac), respectively. Furthermore, they
found that bird species associated with native forest habitat tended to be absent in reserves of less

22
than 42ha (104ac) and recommended this as a threshold to plan for reserves in suburban areas
(Donnelly and Marzluff 2004).
Bird species inhabiting denser urban areas may have smaller area requirements. For
example, Smith (2007) studied winter bird species in Ontario, Canada. He found that in forested
parks and natural forest remnants smaller than 6.5ha (16ac), only common resident species were
present. Less common non-resident species could only be found in urban forests larger than 20ha
(49ac) (Smith 2007).
Urban greenways can harbor species with even smaller area requirements. For example,
Mason et al. (2007) looked at forest-breeding birds in greenways in Raleigh and Cary, NC. They
found that of those species sensitive to development (forest-interior species), none were present
in greenways narrower than 50m (164ft) and most were present in greenways wider than 300m
(984ft). The opposite trend was observed for edge-dwelling species and urban adaptors. They
conclude by recommending that greenway corridors should be at least 100m (328ft) wide.
Because their sampling plots where rectangles 100m in length, their recommendation for
greenways 100m in width can be extrapolated to apply to patches of green space that are at least
2.5ac (100mx100m) in size.
As these examples illustrate, area requirements vary widely. Conservation Subdivisions
may not be able to provide the minimum area requirements of many bird species. This will
certainly be the case of Conservation Subdivisions where the total area of the property is less
than that required by most species of birds. However, even green space of a relatively small size
has the potential to provide habitat for at least some bird species. Furthermore, green space that
does not meet the minimum area requirements for breeding habitat can still function as a corridor
23
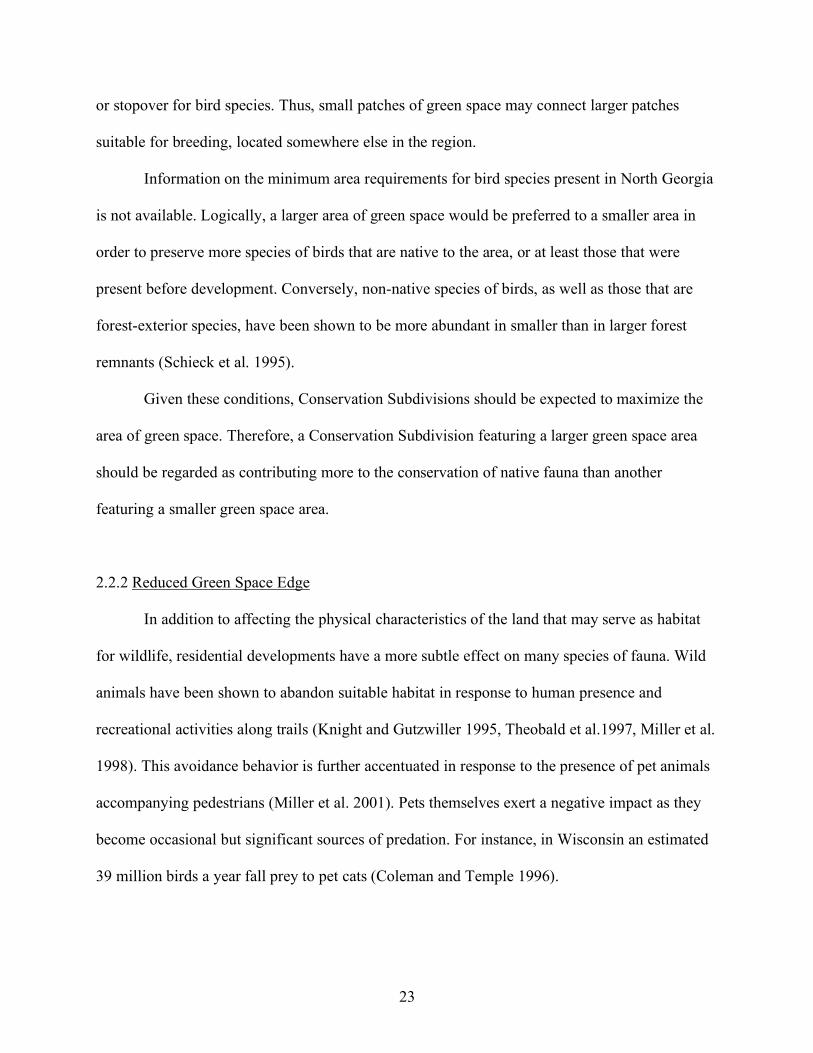
or stopover for bird species. Thus, small patches of green space may connect larger patches
suitable for breeding, located somewhere else in the region.
Information on the minimum area requirements for bird species present in North Georgia
is not available. Logically, a larger area of green space would be preferred to a smaller area in
order to preserve more species of birds that are native to the area, or at least those that were
present before development. Conversely, non-native species of birds, as well as those that are
forest-exterior species, have been shown to be more abundant in smaller than in larger forest
remnants (Schieck et al. 1995).
Given these conditions, Conservation Subdivisions should be expected to maximize the
area of green space. Therefore, a Conservation Subdivision featuring a larger green space area
should be regarded as contributing more to the conservation of native fauna than another
featuring a smaller green space area.
2.2.2 Reduced Green Space Edge
In addition to affecting the physical characteristics of the land that may serve as habitat
for wildlife, residential developments have a more subtle effect on many species of fauna. Wild
animals have been shown to abandon suitable habitat in response to human presence and
recreational activities along trails (Knight and Gutzwiller 1995, Theobald et al.1997, Miller et al.
1998). This avoidance behavior is further accentuated in response to the presence of pet animals
accompanying pedestrians (Miller et al. 2001). Pets themselves exert a negative impact as they
become occasional but significant sources of predation. For instance, in Wisconsin an estimated
39 million birds a year fall prey to pet cats (Coleman and Temple 1996).

24
Both humans and pets are a function of the number of households in the property. In a
Conservation Subdivision, more households translate into more potential users of the green
space, as well as more of their pets. Thus, the relationship between green space and households
can be seen as one of carrying capacity. That is, for a given area of green space, there are a
certain number of people (and their pets) that can be supported before their presence becomes an
unbearable nuisance for the wildlife inhabiting it. In this sense, to increase the potential of
Conservation Subdivisions to harbor wildlife species, ordinances could require a minimum
amount of green space area per household. Establishing this threshold was beyond the scope of
the present study. However, an alternate approach exists.
Theobald et al. (1997) have shown that the cumulative negative effects on green space
derived from human activities (e.g. noise, wandering pets, stormwater runoff, lawn management
practices) are closely related to the pattern in which houses are distributed throughout the
property. In comparing regular, clustered, and random distribution patterns, Theobald et al.
(1997) showed that clustering houses minimized their zone of influence on the green space.
Their findings are consistent with the literature in landscape ecology regarding edge effects on
interior species (Turner et al. 2003). However, it must be noted that this higher degree of
clustering minimizes the zone of influence from houses within the property only. The green
space in Conservation Subdivisions may still be exposed to the zone of influence from houses in
abutting subdivisions. In order to minimize the negative influence from both, houses within the
property and houses in abutting subdivisions, the goal should be to cluster the green space
instead. This would minimize the total edge of the green space, rather than just the edge between
the green space and the house lots within a subdivision.

25
For decades, wildlife managers had prescribed the design of reserves to maximize the
amount of edge (Harris 1988). This prescription was based on ecological studies showing that
the transitional zone separating two distinct communities contained a unique assemblage of
species, thus increasing the total number of species in a region (Harris 1988). However, this is
not the case when the increase in the amount of edge is concomitant with reduced patch size
(Yahner 1988). In this situation, negative edge effects are manifested on the portion of the
landscape that is reduced in size (Donovan et al. 1995). Negative edge effects have been shown
to affect forest-interior bird species in a number of ways. These include reduced nest dispersion
and fledgling success (Gates and Gysel 1978), nest predation and parasitism (Brittingham and
Temple 1983, Andrén and Angelstam 1988), and reduced quality of foraging habitat as well as
decreased prey abundance (Burke and Nol 1998). Habitat quality for birds can be further reduced
by changes in understory plant structure and composition resulting from excessive foraging by
deer. Excessive foraging is caused by an increase in deer density in fragmented landscapes,
where edge is increased and the size of green space patches is reduced (Alverson et al. 1988).
In urbanizing landscapes, green space is reduced to small patches while the amount of
edge is increased. Furthermore, the edge resulting from urbanization is abrupt and permanent
(Suarez et al. 1997). The intensity and extent of the negative effects in this type of edge has been
shown to be higher than in natural transition zones, where the edge is gradual and temporary, as
occurs during ecological succession (Ewers and Didham 2006). Negative edge effects on bird
species can be even stronger on patches of green space located in areas where the majority of the
landscape is deforested (Hartley and Hunter 1998). The negative edge effects are so pervasive
that it has been suggested that the major threat posed by urbanization to migrant neo-tropical bird

26
species is not habitat loss, but edge effects from habitat fragmentation (Faaborg et al. 1993,
Maureer and Heywood 1993).
A clustered configuration minimizes the amount of edge relative to the size of a patch of
green space. A simple way to quantify the degree of clustering of a particular portion of the
landscape is to estimate the perimeter to area ratio (P/A ratio). This ratio has been used in
characterizing the pattern of development in suburban neighborhoods (Song and Knaap 2004), as
well as in characterizing the habitat configuration for passerine birds in grasslands (Davis 2004).
Furthermore, Davis (2004) found that the P/A ratio was a better predictor of the abundance of
bird species than patch size. Abundance of passerine birds was higher in patches with lower P/A
ratios. Conversely, brood-parasites like the Brown-headed Cowbird were more abundant in
irregular patches (i.e. higher P/A ratio).
In addition, the P/A ratio provides an estimate of the degree of fragmentation of the
landscape. A given area will have a lower P/A ratio when it is contiguous than when it is
fragmented into several patches. A contiguous green space is always preferred to one in
fragments, as the former reduces external disturbances for wildlife and provides a more
naturalistic and enjoyable experience for people (Dramstad et al. 1996).
Given these conditions, Conservation Subdivisions should be expected to minimize the
amount of edge relative to the size of the green space. Therefore, a Conservation Subdivision
featuring green space with a lower P/A ratio should be regarded as contributing more to the
conservation of native fauna than another featuring a higher P/A ratio.

27
2.2.3 Smaller House Lots
Conservation Subdivision ordinances allow developers to subdivide a parcel of land in
smaller lots than they would be allowed to in a conventional development zoned for the same
density. The goal of such ordinance is to promote the clustering of the house lots, thus leaving
more land to be designated as green space.
This goal is consistent with findings that showed that the cumulative negative effects
from human activities (e.g. noise, wandering pets, lawn management practices) are reduced when
house lots are clustered, rather than distributed in a regular or random pattern (Theobald et al.
1997).
Presumably, smaller lots entail lower development costs, manifested in savings on land
grading and road construction. Nonetheless, developers may not take full advantage of the
reduced lot sizes permitted. This is because a larger lot would probably sell for a higher price
than a smaller lot, considering all other factors equal. Furthermore, neither the original ordinance
nor the amended ordinance includes a restriction regarding how much bigger than the minimum
a house lot can be. Even a constraint like requiring a minimum percentage of the property area to
be designated as green space may not guarantee house lots as small as possible.
Reduced lot sizes would minimize the zone of influence of the developed portion of the
subdivision on the green space, thus contributing to the preservation of habitat quality for
wildlife species. In addition, smaller lots may prevent developers from locating house lots that
extend inside riparian buffers. It will also contribute to reduce the disturbance of ephemeral
streams. Thus, reduced lot size would contribute to the conservation of water quality as well.
Given these conditions, Conservation Subdivisions should be expected to feature reduced
lot sizes. Therefore, a Conservation Subdivision featuring house lots that are closer in size to the
28
minimum permitted for its zoning classification, should be regarded as contributing more to the
conservation of ecosystem services than another featuring house lots much bigger than the
minimum permitted.
2.3 Methods
2.3.1 Selection of Conservation Subdivisions
A list of all Conservation subdivisions in Cherokee County, GA was provided by the
Planning and Zoning Department on February 16, 2007. According to this list, there had been 72
Conservation Subdivisions approved for construction since Article 23 was implemented in the
Code of Ordinances on October 1998 and the day the list was obtained. Six of these were
approved after the amendment of Article 23 was adopted on April 2005. However, five of those
approved for construction after the amendment were in fact granted the designation of
Conservation Subdivision before the amendment. The delay in final approval for construction
was caused by revisions to the construction plans ordered by either the Planning and Zoning
Department or the Engineering Department of Cherokee County. Therefore, these five
Conservation Subdivisions were subject to regulations contained in the original ordinance, and
not to those set forth in the amended version.
A sample of 10 Conservation Subdivisions (Figure 2.1) were randomly selected from
among all of those approved for construction before April 2005. This sample included
subdivisions located in four of the seven Zoning Districts in Cherokee County, GA. The
maximum densities allowed on these districts ranged from 0.5 to 1.5 dwelling units per acre
(DUA). In turn, the number of lots proposed for these subdivisions ranged from 29 to 249, while
the acreage varied from 34ac to 281ac (Table 2.1).

29
2.3.2 Processing of Development Plats
Access to the development plats for the ten Conservation Subdivi
sions in the sample was provided by Cherokee County’s Engineering Department in Canton, GA. From each set of plats
approved for construction, a limited number of plats were selected. The plats selected consisted
of those depicting the following features:
• Boundary of the subdivision and land survey markers
• Pre-existing topography in 2 ft. contours
• Streams, wetlands, ponds, and other surface water
• Riparian buffer lines and 100yr flood plain line
• Proposed areas for green space (in some plats referred to as “o
pen space” or “common area”)
• Proposed areas to be subdivided, showing individual lot lines
• Street layout, indicating the corresponding rights
-of-way and grading areas.
The plats selected were photocopied and later scanned at a resolution of 400 dpi. In c
ases where the total area of a subdivision was contained in several plats, these were composed into
one single image using Adobe Photoshop® v5.5. The resulting images were rectified for
geographical distortion using ERDAS Imagine® v8.6 (Projection: UTM, Sp
heroid: GRS 1980, Zone: 16, Datum: NAD83) and the U.S. Geological Survey’s Infrared Digital Orthophoto
Quadrangles (Scale 1:24,000) for Cherokee County, GA (United States Geological Survey
1997).

30
Finally, each rectified plat was used as a template to digitize the different design features
for the evaluation of Conservation Subdivisions. Digitizing and analysis of these features was
performed using ESRI ArcView® GIS v3.3.
2.3.3 Analysis of Design Features
2.3.3.1 Wider Riparian Buffers
All surface waters (e.g. streams, wetlands, ponds) were identified and digitized. The
corresponding riparian buffer and 100yr floodplain lines indicated in the development plats were
digitized as well. For each water body, a hypothetical buffer line 50ft outward from the
combined riparian buffer and 100yr floodplain lines was traced. This was done in order to
evaluate the potential of each subdivision to afford wider riparian buffers that also included the
floodplain. The number of proposed house lots affected by the hypothetical buffer line was
tallied for each subdivision, thus providing a measure of the tendency to develop near riparian
zones versus designating these areas as green space.
During the initial inspection of development plats it was noticed that house lots in some
subdivisions were inside of the designated riparian buffers. The number of these lots was tallied
as well, in order to assess the degree to which a mandated measure to protect water quality is
being posed at risk.
2.3.3.2 Fewer Stream Crossings
The road layout on the development plat for each subdivision was digitized and all stream
crossings were identified. Alternate routes for the associated roads were explored in order to
avoid crossing the stream.
31
Alternate routes were indicated only when the topography suggested that no additional
grading would be needed, since additional development costs would be incurred otherwise.
Furthermore, alternate routes were indicated only when none of the house lots proposed were
prevented from being developed. A reduction in the number of lots that could be developed
would likely result in a takings situation, which should be avoided.
The option of not developing an area serviced by a stream crossing was considered when
the number of lots proposed for that area could be located somewhere else on the property and a
feasible road layout could be identified.
2.3.3.3 Less Ephemeral Streams Disturbed
All ephemeral streams occurring in each subdivision were identified on the development
plats showing the topography. Ephemeral streams were deemed to occur where crenulations
were aligned for more than 100ft over the landscape surface. This procedure was adapted from
methods described by Hansen (2001).
According to a postulate of hydrology theory, once the soil is saturated during a storm
event, runoff proceeds downhill as sheet-flow (i.e. very shallow surface flow with no identifiable
course). After approximately 100ft, runoff has concentrated enough to appear as an identifiable
course of water along the crenulations in the topography (Soil Conservation Service 1986). This
course of water, which vanishes soon after rain ceases, is defined as an ephemeral stream (United
States Army Corps of Engineers 2002).
The degree of disturbance to ephemeral streams was assessed by calculating the
percentage of these streams in each subdivision affected by land development. Ephemeral
streams affected by development were defined as those contained within the house-lot lines, the

32
road and right-of-way lines, or the grading zones indicated in the development plats for each
subdivision.
In order to advance regulation that protects ephemeral streams from disturbance caused
by land development, an appropriate predictor is needed. Ephemeral streams are located, for
most of their length, outside regulated land like riparian buffers. Thus, this study sought to
correlate the percentage of ephemeral streams disturbed to the percentage of green space
composed of unregulated land. A regression analysis was performed relating these two variables.
An additional regression was performed using the percentage of the property designated as green
space, in order to determine which of the two green space variables would be a better predictor
of ephemeral stream protection.
2.3.3.4 Larger Green Space Area
The green space proposed in the development plats for each Conservation Subdivision
was identified and digitized. The area occupied by each patch of green space in a subdivision
was calculated. The sum of these areas resulted in the total green space area in the subdivision.
The percentage of the property area occupied by green space was calculated as well. This
was done in order to evaluate how the subdivisions in the sample would fare under Cherokee
County’s new Conservation Subdivision ordinance, which requires that a minimum of 40% of
the property area be designated as green space.
The new Conservation Subdivision ordinance also requires that 75% of the green space
area be contained on a continuous tract of land. In order to evaluate how subdivisions in the
sample would fare under this regulation, the percentage of the total green space area occupied by
the largest patch of contiguous green space was calculated.

33
In addition, the new ordinance requires that 15% of the green space consists of land
suitable for building. In order to evaluate subdivisions with regard to this requirement, the
percentage of the total green space area occupied by regulated and unregulated land was
calculated. Regulated land consisted of surface waters, riparian buffers, and property boundary
buffers. Unregulated land consisted of land suitable for building.
2.3.3.5 Reduced Green Space Edge
The perimeter of each patch of green space in a Conservation Subdivision was calculated.
The sum of these values resulted in the total perimeter of the green space in the subdivision. The
P/A ratio for the green space in each subdivision was calculated by dividing the total perimeter
of the green space, in linear feet, by the total green space area, in acres.
While the P/A ratio is useful in comparing different configurations of green space among
subdivisions, it necessitates a reference value in order to assess the degree of clustering of the
green space in each subdivision. Thus, for any area of green space, the configuration with the
lowest possible P/A ratio is that of a circle.
The P/A ratio for the green space in each subdivision was compared to the P/A ratio that
would result from a circle equal in area to the green space. The perimeter of this circle was
calculated using the formula: P = 2πr. The radius ‘r’ in this formula was calculated using the
formula for the area of a circle: A = πr2, where ‘A’ was equal to the total green space area, in
square feet. The P/A ratio for the circle was calculated by dividing its perimeter, in linear feet, by
the total green space area, in acres.
Furthermore, the amount of edge resulting from a particular configuration of green space
was evaluated by calculating the percentage increase in its perimeter relative to that of a circle.

34
This is the same as calculating the percentage increase in the P/A ratio, given that the area of the
reference circle is the same as the green space.
2.3.3.6 Smaller House Lots
Lot sizes for each subdivision were obtained from the development plats. In cases when
this information was not indicated in the plats, house lots were digitized and the area of each
calculated. The average lot size was calculated for each subdivision.
The percentage difference between the average lot size in each subdivision and the
minimum lot size permitted by its zoning classification was calculated.
2.4 Results
2.4.1 Wider Riparian Buffers
Of the ten Conservation Subdivisions evaluated, only three avoided house lots extending
into riparian buffers (Table 2.2). For the rest of the subdivisions, the number of lots extending
into riparian buffers ranged from 2 to 22.
The number of lots extending into riparian buffers represented a small fraction of the total
number of lots proposed in each subdivision, ranging from 3% to 10% (Table 2.2). The
exception was Hearthstone, which featured 22% of the lots extending into riparian buffers.
The percentage of lots that would be extending into the recommended riparian buffer
(additional 50ft from mandated riparian buffer and 100yr floodplain line) showed a wider range,
from 4% to 40% (Table 2.2).

35
2.4.2 Fewer Stream Crossings
Stream crossings were present in four Conservation Subdivisions. Forest Creek and
Laurel Trace featured 3 and 2 respectively. Heritage Oaks and Smithwick Crossing featured one
crossing each. Forest Creek and Heritage Oaks were found to include one crossing that could be
avoided (Figures 2.2 and 2.3).
2.4.3 Less Ephemeral Streams Disturbed
Ephemeral streams were found in all Conservation Subdivisions, ranging in number from
4 to 19 (Table 2.3). The percentage of these streams disturbed by land development in each
subdivision ranged from 50% to 100% (Table 2.3).
The percentage of ephemeral streams disturbed by land development was found to be
inversely related to the percentage of the green space composed of unregulated land (Figure 2.4).
The regression analysis showed that the percentage of ephemeral streams that would be disturbed
was better predicted by the percentage of the green space composed of unregulated land (R2 =
0.77, P < 0.01) than by the percentage of the property designated as green space (R2 = 0.19, P =
0.24). That is, the dispersion of data points around the regression line is less for the percentage of
green space composed of unregulated land (Figure 2.4).
2.4.4 Larger Green Space Area
The area of green space in each Conservation Subdivision ranged from 7.9ac to 80.6ac,
while the percentage of the property designated as green space varied between 10.8% and 43.4%
(Table 2.4).

36
The largest contiguous patch of green space was 37.1ac, and represented 46% of the total
green space area in the subdivision. Conversely, the smallest contiguous patch of green space in
a subdivision was 7.9ac, which represented 100% of the green space (Table 2.4).
Surface waters were found in all Conservation Subdivisions. In half the subdivisions,
surface waters were limited to small streams comprising less than 0.01% of the green space. The
other half featured between 1.3% and 15.4% of the green space composed of surface waters
(Table 2.5). Riparian buffers and boundary buffers occupied a larger portion of the green space,
ranging from 5% to 62%, and 0% to 50%, respectively (Table 2.5).
Unregulated land was found to vary widely among subdivisions, from 6.2% to 69.8%
(Table 2.5).
2.4.5 Reduced Green Space Edge
Conservation Subdivisions varied in the degree of green space clustering as measured by
the P/A ratio. This variable was found to vary from 432ft/ac to as much as 1,617ft/ac (Table 2.6).
These values differed considerably from the P/A ratio of the circle used as reference for the
configuration of green space in each subdivision. The P/A ratio of the green space in Bridgemill
was 2.8 times that of its reference circle, while in the case of Sweetbriar it was 6.1 times as big
(Table 2.6).
The increase in green space edge relative to the edge of the reference circle ranged from
181.5% to 514.5 % (Table 2.6). The average of the increase in perimeter for each of the
Conservation Subdivisions evaluated was 353%.

37
2.4.6 Smaller House Lots
The average lot size in Conservation Subdivisions varied from 15,648sf to 50,986sf, in
zoning districts where the minimum lot size permitted are 15,000sf and 30,000sf, respectively
(Table 2.7). The smallest percentage increase from the minimum permitted was 4.3%, while the
biggest increase was 82.5% (Table 2.7).
2.5 Discussion
The Conservation Subdivisions evaluated in this study were approved under the original
text of Article 23 of Cherokee County’s Code of Ordinances adopted in 1998. This ordinance
contained no specific requirements regarding the design of Conservation Subdivisions. Instead, it
contained suggestions about the type of landscape features that were desirable to be set aside as
green space. As a result, developers have produced Conservation Subdivisions in which some
opportunities to contribute to the conservation of ecosystem services have been missed.
House lots in Conservation Subdivisions were found to threaten the integrity of riparian
buffers by including a portion of the buffers within their boundaries. Fortunately, these represent
a small portion of the total number of lots proposed in most Conservation Subdivisions (Table
2.2). Thus, it would be possible for the ordinance to require that the full extent of riparian buffers
be designated as green space, and it would be unlikely to significantly affect the ability of
developers to subdivide a parcel of land. Furthermore, because house lots in most subdivisions
were found to be larger than the minimum permitted (Table 2.7), wider riparian buffers could be
afforded by subdividing a parcel of land into house lots that are as close as possible in size to the
minimum permitted. Even the proposed 50ft of additional buffer and inclusion of the 100yr

38
floodplain could be an acceptable demand, given that it affected less than 10% of the lots in four
of the ten subdivisions evaluated (Table 2.2).
To further protect the integrity of riparian buffers, planning authorities may be able to
require a change in the road layout in order to avoid stream crossings. This could apply to the
revision process of development plats prior to approval, but may not be included in the ordinance
except as a suggestion. The reason is that a road layout will typically be such that the number of
lots to be developed is maximized. Hence, an alternate route may result in a case of land taking.
As shown in this study, only in a few instances a change in the road layout may be feasible.
Thus, it is best to leave the matter for consideration on a case-by-case basis during the revision
process.
Conservation Subdivisions present an opportunity to protect the extended network of
streams in a region by preventing disturbance of ephemeral streams. These streams are not
protected by riparian buffers, but are likely to be present even in parcels of land where stream
channels cannot be identified (Hansen 2001). In this study, ephemeral streams were identified in
all subdivisions, particularly in unregulated land suitable for building. In fact, the percentage of
green space composed of unregulated land has been shown to be a good predictor of the number
of ephemeral streams that could be preserved. This finding provides support to one of the
requirements included in the ordinance by the amendment made on April 2005. The new
ordinance requires that at least 15% of the green space be composed of land suitable for building.
But this requirement could be made even more demanding, given that as many as three of the ten
Conservation Subdivisions evaluated featured more than 60% of the green space composed of
land suitable for building, and an additional four featured more than 45% (Table 2.5).

39
Another requirement included in the new ordinance is that at least 40% of the area of the
property be designated as green space. It is important to consider that this requirement may not
result in significant areas of land designated as green space. For instance, Wolf Creek Park
featured the highest percentage of green space among the ten Conservation Subdivisions
evaluated, consisting of 37.7ac in area. In comparison, Forest Creek ranked third to last in
percentage of green space, yet it afforded the highest area at 80.6ac (Table 2.4).
This has important consequences for wildlife diversity, as many species have specific
habitat requirements related to the area of land left undisturbed as green space. Area
recommendations for avian breeding habitat can range from 49ac (Smith 2007) to 104ac
(Donnelly and Marzluff 2004). Only one Conservation Subdivision, Forest Creek, features an
area of green space above 49ac, while another gets close, Heritage Oaks at 44ac (Table 2.4).
Consistent with the new ordinance, these two subdivisions designated more than 40% of their
area as green space. Clearly, only a few Conservation Subdivisions would be able to afford
setting aside as much area of green space. Moreover, providing a contiguous area of green space
to satisfy habitat requirements would be challenging. The largest contiguous patch of green space
among the ten Conservation Subdivisions evaluated was 37.1ac (Table 2.4).
This highlights the limited potential of Conservation Subdivisions to provide suitable
habitat for wildlife species. Conservation Subdivisions in suburban areas seem to be limited to
parcels of land that are small in comparison to the area requirements of some species. The largest
Conservation Subdivision evaluated comprised 280.9ac (Table 2.1). A parcel of land of this size
has considerable potential to provide habitat for different species of wildlife. Among the rest of
the subdivisions evaluated, one comprised an area slightly above 100ac, while the other eight
were below (Table 2.1). The parcels of land that are developed as residential subdivisions in
40
rural areas are typically larger than in suburban areas (Theobald 2004). Thus, Conservation
Subdivisions in rural areas may have a greater potential to provide suitable habitat for more and
bigger species of wildlife.
Despite its limited potential in suburban areas, Conservation Subdivisions can contribute
to form a network of green space patches of different sizes that could serve as stopovers for
passing birds, thus connecting larger areas of green space somewhere else in the region. Even the
smallest patch of green space found among the subdivisions evaluated, 7.9ac (Table 2.4), could
serve as stopover habitat for migratory bird species, as well as for those feeding outside their
breeding habitat (Mason et al. 2007).
While avian species may benefit from patches of green space of different sizes, species of
wildlife that cannot fly would benefit more from green space that is contiguous. Linked patches
of green space across Conservation Subdivisions would create corridors that wildlife could use to
move from one portion of their habitat to another over a region (Arendt 2004). Unfortunately,
Conservation Subdivisions are seldom located next to one another or abutting greenways.
Riparian buffers may serve as corridors, linking patches of green space in Conservation
Subdivisions where streams are present. Thus, it would be desirable that every patch of green
space in a Conservation Subdivision be connected to any riparian buffer within, or abutting, its
boundary. The potential to create this network of patches and corridors is revealed by the
percentage of green space composed of riparian buffers and the percentage of green space that is
contiguous. In six of the ten Conservation Subdivisions evaluated, riparian buffers comprised
more than 20% of the green space (Table 2.5), while in another half the green space was 100%
contiguous (Table 2.4). Unfortunately, these two features do not always overlap. In Laurel Trace
for instance, 36.4% of the green space is composed of riparian buffers (Table 2.5), while only

41
55.1% of it is contiguous (Table 2.4). Fortunately, the new Conservation Subdivision ordinance
requires that at least 75% of the green space be contiguous, although it does not require that it be
connected to riparian buffers. In fact, distinct patches of green space in a Conservation
Subdivision can be linked thru boundary buffers instead. These buffers vary in width between
20ft and 100ft depending on the proposed size for the house lots abutting the adjacent property
and the zoning of this property (Cherokee County Board of Commissioners 2005a). In four of the
ten subdivisions evaluated, the boundary buffer comprised more than 20% of the green space,
and in one of these it was almost 50% (Table 2.5).
The use of boundary buffers to connect patches of green space can be an easy way to
provide contiguous habitat for wildlife species. However, it can also contribute to increase the
amount of edge relative to the area of green space. In fact, the two Conservation Subdivisions
with the highest percentages of green space composed of boundary buffers, Laurel Trace and
Sweetbriar (Table 2.5), are also the two with the highest P/A ratios (Table 2.6). This relationship
seems to be supported by the increase in green space edge relative to the edge of a circle of equal
area. Sweetbriar shows the highest increase in edge, 514.5%, while Bridgemill shows the lowest
increase, 181.5% (Table 2.6). The most striking difference however, can be seen in comparing
their development plats. Bridgemill features four distinct patches of green space, isolated from
one another (Figure 2.5). Sweetbriar features green space consisting of the boundary buffer, and
a distinct patch in the center of the subdivision connected to the boundary buffer by a narrow
strip of land (Figure 2.6). The fact that isolated patches of green space can have less edge
combined than green space that is 100% contiguous, highlights the importance of pattern and
configuration in the design of Conservation Subdivisions. Thus, instead of requiring a minimum

42
percentage of green space to be contiguous, the ordinance could require a maximum percentage
of increase in edge.
Design that minimizes the amount of green space edge would contribute to reduce the
negative influences on wildlife from the developed portion of Conservation Subdivisions.
Unfortunately, competing goals in the design of Conservation Subdivisions can make it difficult
to achieve a green space configuration that minimizes these negative influences. In particular,
design that aims at providing direct access to the green space for most of the house lots in the
subdivision. An example of this type of design can be seen in the development plat of
Pebblebrook (Figure 2.7). In this Conservation Subdivision, a portion of the green space consists
of narrow strips of land located in between rows of house lots. Consistent with this pattern, the
green space in Pebblebrook features one of the highest values, 460.1%, for the increase in
perimeter relative to the perimeter of the reference circle (Table 2.6).
Further gains in reducing the negative influences of the developed portion of
Conservation Subdivisions can be obtained from designing house lots that are as close as
possible in size to the minimum permitted. In the Conservation Subdivisions evaluated, the
average lot size proposed was bigger than the minimum lot size permitted by 4% to 83%, with
six of the ten subdivisions showing a difference of more than 30% (Table 2.7). This wide margin
is indicative of the potential flexibility that developers have to design Conservation Subdivisions
that accommodate as many house lots as conventional developments, and green space that is
effective in contributing to the conservation of ecosystem services.
The amendment of Article 23 of Cherokee County’s Code of Ordinances on April 2005
introduced specific requirements aimed at increasing the quality of the design of Conservation
Subdivisions (Cherokee County Board of Commissioners 2005a). However, the amendment was

43
made without a systematic analysis of design features in Conservation Subdivisions. The
analysis performed in this study suggests that some of the requirements introduced by the
amendment may have been misguided. Interestingly, none of the Conservation Subdivisions
evaluated would have been approved under the current ordinance. Many of these subdivisions
however, were shown to include design features that would contribute, in a small but important
way, to the conservation of ecosystem services. Moreover, these design features varied
considerably among subdivisions and did not always occur simultaneously. Thus, any new
changes to the Conservation Subdivision ordinance must consider this variability, recognizing
that all subdivisions have a potential for conservation and that some parcels of land offer more
opportunities for conservation than others. Furthermore, the ordinance should give developers
enough flexibility to implement alternative design features in order to take advantage of the
different opportunities for conservation found in a parcel of land.
2.6 A Scoring System for Evaluation of Conservation Subdivisions
Regulations that are too strict and ordinances that are too cumbersome to apply have been
found to be the two leading causes developers refrain from adopting innovative designs (Ben-
Joseph 2005). Furthermore, the intrinsic characteristics of a parcel of land may constrain the
ability of a developer to comply with all the requirements included in an ordinance. For instance,
while a proposed Conservation Subdivision may fulfill a requirement for wider riparian buffers,
the topography may make it difficult to fulfill a requirement for a minimum amount of
contiguous green space. It is clear however, that a Conservation Subdivision in this situation has
the potential to contribute to the conservation of at least one important ecosystem service, water
quality. In other situations, a parcel of land may offer better opportunities for conservation of
44
wildlife diversity, and yet another parcel may simply not be suitable for development as a
Conservation Subdivision.
Differences in the intrinsic suitability of parcels of land for the conservation of ecosystem
services have been recognized in land acquisition programs for green space preservation
(Thomas 2003, Backlund et al. 2004). These programs typically use a scoring system for the
screening and valuation of parcels of land that may be considered for acquisition (Kauffman et
al. 2002, McDonald et al. 2005). Thus, a scoring system allows for parcels of land with diverse
features to be compared and then selected, based on a minimum number of points established as
a threshold.
The implementation of a scoring system for the evaluation and approval of Conservation
Subdivisions would provide confidence and flexibility to both, developers and planning
authorities, in making decisions. On the one hand, developers would be able to focus their efforts
on those conservation opportunities for which a parcel of land has the most potential. On the
other hand, planning authorities would be able to assure that the designation of Conservation
Subdivision, and any benefits derived from it, will be granted to developments that may differ in
their design, but are equally meritorious. An example of a scoring system based on the design
features analyzed in this study is proposed on Table 2.8.
All design features considered in this study were included in the scoring system, with the
exception of a reduction in the number of stream crossings. The reason for this is that it would
require proof that the developer had made changes to an original road layout that included a
stream crossing. This is clearly difficult to assess. However, requiring changes in the road layout
for the approval of development plats is common practice, provided that the developer is not
prevented from subdividing the land into the same number of lots (Priscilla Hamilton,

45
Development Coordinator, Cherokee County Engineering Department, pers. comm.). Thus, it
can be expected that this requirement will be applied whenever reason to doubt the need for a
stream crossing exists.
The way in which points for each design feature are scored responds to the goal of
providing a simple and practical mechanism to evaluate Conservation Subdivisions as proposed
in development plats. The scoring system assigns one point for each measurable unit of a
particular design feature, with the exception of the increase in green space perimeter (Table 2.8).
Numerical values for the percentage increase in green space perimeter were found to be at least
one order of magnitude higher than numerical values for other design features (Table 2.6). Thus,
each point corresponds to ten units in percentage increase. The suggested threshold for approval
of a Conservation Subdivision is 100 points. This value is tentative, and may be changed in order
to reflect the conservation priorities set forth by each county’s government.
A Conservation Subdivision may score 100 points by simply providing 100ft of
additional riparian buffer (Table 2.8). This would effectively triple the width mandated by
Cherokee County, clearly an important contribution to the conservation of water quality and
riparian habitat. Moreover, this wider buffer could be achieved by designing house lots that are
very close in size to the minimum permitted, so that no significant number of points would be
deducted. It is important to notice that in cases where a stream forms a natural boundary dividing
two parcels of land, only one side of the stream would be located within the proposed
Conservation Subdivision. Thus, only half a point would be scored for each foot of additional
buffer in this situation. Furthermore, the total length of the streams present in a parcel of land
may differ among subdivisions. A Conservation Subdivision where the total length of streams is
higher than in other subdivisions would have to set aside a larger area of undisturbed land to

46
provide wider riparian buffers. While this may seem an unfair burden on some subdivisions to
score the same number of points, it must be recognized that this burden is imposed not by
development regulations but by the natural occurrence of natural features. Thus, given that
developers are already required to provide riparian buffers when surface waters are present, any
additional increase in width is scored with regard to the existing length of buffers. In addition,
one point is deducted for each house lot that extends into any designated riparian buffer, as well
as into the 100yr floodplain (Table 2.8). The degree in which the boundary of a house lot may
intersect the boundary of a riparian buffer may vary. Arguably, trying to assess the amount of
risk it would pose to the integrity of the buffer would prove to be cumbersome. Thus, assigning
one point to each house lot was deemed the most practical approach to evaluate this feature.
Conservation Subdivisions where surface waters do not occur would not be able to score
points regarding the provision and protection of riparian buffers. Because ephemeral streams
may occur but be difficult to identify (Hansen 2001), these subdivisions may contribute to the
conservation of water quality by designating unregulated land as green space, and benefit from
scoring points assigned to this feature (Table 2.8). Furthermore, while only a few Conservation
Subdivisions would be able to score 100 points by providing 100ac of green space alone, this
threshold can be reached by providing 50ac of green space of which 50% is unregulated land
(Table 2.8). Special attention would have to be given to the configuration of the green space
provided, as points are discounted by increases in edge relative to the perimeter of a circle of
equal area. The average increase in edge for the Conservation Subdivisions evaluated was 353%
(Table 2.6). This would represent a deduction of 35 points (Table 2.8), which could be
counteracted by providing more green space area or designating more unregulated land. These

47
same actions could compensate any point deductions from increases in the average lot size
relative to the minimum permitted (Table 2.8).
The proposed scoring system would allow a more accurate evaluation of the design of
Conservation Subdivisions regarding their contribution to the conservation of ecosystem
services. It would also provide increased flexibility in making decisions, whether these are
design decisions on the part of developers, or approval decisions on the part of the development
authorities. Another advantage of implementing a scoring system is that new knowledge
regarding the conservation of ecosystems services (e.g. habitat requirements for species not
previously considered) could be taken into consideration without having to implement dramatic
changes to the ordinance. Modifying the way in which points are scored, changing the approval
threshold, or adding a new item to the list of features would suffice. Likewise, requirements
included in other ordinances (e.g. storm water management) can be supplemented by adding
design features previously not contemplated (e.g. pervious pavement, green roofs). Furthermore,
post-development management practices can be incorporated in the scoring system, thus
complementing the pre-development design features for which this system was originally
proposed.
2.7 Conclusion
Conservation Subdivisions approved under Article 23 of Cherokee County, GA’s Code of
Ordinances as adopted in 1998, were found to vary widely in the quality of their design
regarding the conservation of ecosystem services. The amendment of Article 23 in 2005
introduced a set of arbitrary requirements. This study shows that these requirements are
misleading in promoting design features that contribute to the conservation of ecosystem

48
services. These features included wider riparian buffers, fewer stream crossings, less ephemeral
streams disturbed, larger green space area, reduced green space edge, and smaller house lots.
Differences in these features among Conservation Subdivisions suggested that the potential for
conservation depends on the quality of their design as well as on the intrinsic characteristics of
each parcel of land. The current Conservation Subdivision ordinance in Cherokee County, as
well as in any other county where regulations do not consider these differences, are likely to
discourage the development of subdivisions where small but important conservation gains can be
achieved. A scoring system to evaluate the design features of Conservation Subdivisions can
provide confidence and flexibility in making decisions, both design decisions by developers, and
approval decisions by development authorities.

49
Table 2.1: Zoning and house lots in Conservation Subdivisions. Number of dwelling units per acre (DUA) permitted varies according to zoning. The number of lots proposed for development depends on the area of the property (Acreage), but may be reduced due to other constraints. Subdivision name Zoning DUA Acreage Lots proposed Bridgemill Unit 4G R30 1.452 78 97 Forest Creek R40 1.089 280.9 249 Governor's Preserve Unit 4 AG* 1.089 61.4 56 Hearthstone Unit 2 R30 1.452 33.9 49 Heritage Oaks R30 1.452 101.4 67 Laurel Trace R40 1.089 58.3 29 Pebblebrook (fka. Ridgewood) R60 0.726 95.4 71 Smithwick Crossing R60 0.726 141.3 102 Sweetbriar R40 1.089 37.3 38 Wolf Creek Park AG 0.5 82.1 41
*Agricultural zone with access to sewer system. More DUA are permitted.

50
Table 2.2: House lots that extend into riparian buffers. Mandated buffer is 50ft wide on either side of all perennial and intermittent streams, and 150ft on either side of the Etowah and Little Rivers. Recommended buffer is at least 50ft in addition to the mandated buffer width.
Number of lots extending into riparian buffers
Percentage of lots extending into riparian buffers
Subdivision name Mandated
buffer Recommended
buffer Mandated
buffer Recommended
buffer Bridgemill Unit 4G 3 16 3.1 16.5 Forest Creek 22 54 8.8 21.7 Governor's Preserve Unit 4 0 3 0 5.4 Hearthstone Unit 2 11 19 22.4 38.8 Heritage Oaks 4 5 6 7.5 Laurel Trace 2 8 6.9 27.6 Pebblebrook 0 3 0 4.2 Smithwick Crossing 8 12 7.8 11.8 Sweetbriar 0 3 0 7.9 Wolf Creek Park 4 10 9.8 24.4

51
Table 2.3: Ephemeral streams in Conservation Subdivisions. Ephemeral streams that are disturbed are located within development areas (house lots, roads and associated right-of-way). Subdivision name Number of ephemeral streams Percentage that are disturbed Bridgemill Unit 4G 17 64.7 Governor's Preserve Unit 4 8 50 Hearthstone Unit 2 5 80 Heritage Oaks 14 64.3 Laurel Trace 7 100 Pebblebrook 10 80 Smithwick Crossing 19 89.5 Sweetbriar 4 100 Wolf Creek Park 9 77.8

52
Table 2.4: Amount of green space in Conservation Subdivisions. Percentage green space is the percentage of the property designated as green space. The area of the largest patch of green space is indicated as contiguous area, while the percentage of the green space occupied by this patch is indicated as percentage contiguous.
Subdivision name Green space area (ac)
Percentage green space
Contiguous area (ac)
Percentage contiguous
Bridgemill Unit 4G 23.2 29.7 8.2 35.2 Forest Creek 80.6 28.7 37.1 46 Governor's Preserve Unit 4 20.6 33.5 11.6 56.4 Hearthstone Unit 2 13.6 40.1 13.6 100 Heritage Oaks 44 43.4 44 100 Laurel Trace 18.3 31.3 10.1 55.1 Pebblebrook 33 34.6 33 100 Smithwick Crossing 15.2 10.8 15.2 100 Sweetbriar 7.9 21.2 7.9 100 Wolf Creek Park 37.7 45.9 16.3 43.1
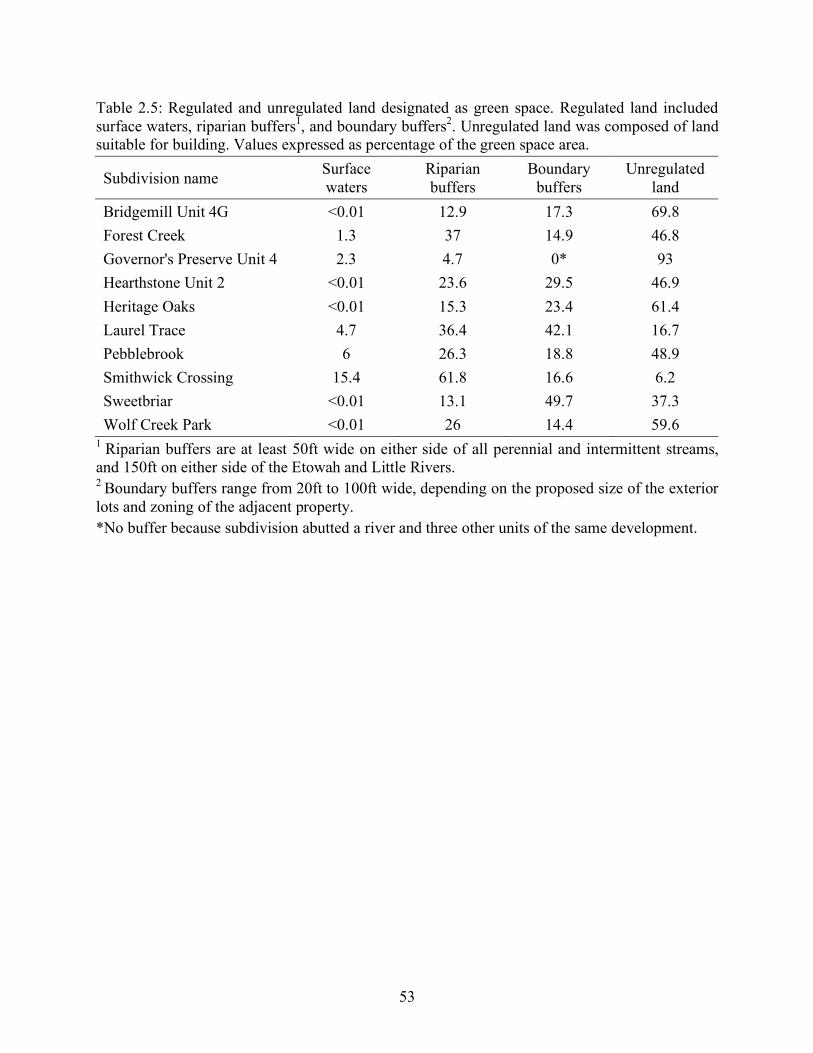
53
Table 2.5: Regulated and unregulated land designated as green space. Regulated land included surface waters, riparian buffers1, and boundary buffers2. Unregulated land was composed of land suitable for building. Values expressed as percentage of the green space area.
Subdivision name Surface waters
Riparian buffers
Boundary buffers
Unregulated land
Bridgemill Unit 4G <0.01 12.9 17.3 69.8 Forest Creek 1.3 37 14.9 46.8 Governor's Preserve Unit 4 2.3 4.7 0* 93 Hearthstone Unit 2 <0.01 23.6 29.5 46.9 Heritage Oaks <0.01 15.3 23.4 61.4 Laurel Trace 4.7 36.4 42.1 16.7 Pebblebrook 6 26.3 18.8 48.9 Smithwick Crossing 15.4 61.8 16.6 6.2 Sweetbriar <0.01 13.1 49.7 37.3 Wolf Creek Park <0.01 26 14.4 59.6
1 Riparian buffers are at least 50ft wide on either side of all perennial and intermittent streams, and 150ft on either side of the Etowah and Little Rivers. 2 Boundary buffers range from 20ft to 100ft wide, depending on the proposed size of the exterior lots and zoning of the adjacent property. *No buffer because subdivision abutted a river and three other units of the same development.

54
Table 2.6: Edge effects and green space configuration. Edge effects are a function of the green space perimeter to area ratio (P/A). The configuration with the lowest P/A is that of a circle of equal area to the green space (Circle P/A). The amount of edge resulting from a particular configuration of green space is evaluated by the increase in perimeter relative to this circle.
Subdivision name Green space P/A (ft/ac)
Circle P/A
Increase in P/A relative to circle
Increase in perimeter relative to circle (%)
Bridgemill Unit 4G 432 154 2.8 181.5 Forest Creek 467 82 5.7 466.4 Governor's Preserve Unit 4 709 163 4.3 334.6 Hearthstone Unit 2 693 200 3.5 245.8 Heritage Oaks 579 112 5.2 419.3 Laurel Trace 903 173 5.2 421.7 Pebblebrook 721 129 5.6 460.1 Smithwick Crossing 570 190 3.0 200.7 Sweetbriar 1,617 263 6.1 514.5 Wolf Creek Park 464 120 3.9 285

55
Table 2.7: Difference between the average lot size and the minimum lot size permitted. Minimum lot size permitted varies according to zoning. Minimum and average lot size are expressed in square feet. Subdivision name Minimum permitted Average Percentage increase Bridgemill Unit 4G 15,000 21,198 41.3 Forest Creek 15,000 19,964 33.1 Governor's Preserve Unit 4 20,000 27,042 35.2 Hearthstone Unit 2 15,000 15,648 4.3 Heritage Oaks 25,000 32,521 30.1 Laurel Trace 25,000 45,637 82.5 Pebblebrook 30,000 34,310 14.4 Smithwick Crossing 30,000 50,986 70 Sweetbriar 25,000 30,505 22 Wolf Creek Park 40,000 42,738 6.8

56
Table 2.8: A scoring system for evaluation of Conservation Subdivisions. Developments seeking approval as Conservation Subdivisions may be required to score at least 100 points. County government officials may change this threshold according to their objectives. Design feature Objective Scoring a. Riparian buffers are wider
than is mandated Protection of surface waters and riparian habitat
+1 point for every additional foot of riparian buffer*
b. House lots do not extend into riparian buffers
Preservation of riparian buffer integrity
-1 point for every lot that extends into a riparian buffer
c. House lots do not extend into the 100yr floodplain
Prevention of risk to surface waters
-1 point for every lot that extends into the floodplain
d. Green space composed of unregulated land
Conservation of ephemeral streams
+1 point for every 1% of green space that is unregulated land
e. Green space area is as large as possible
Provision of habitat for wildlife
+1 point for every acre of green space
f. Green space perimeter is no bigger than that of a circle
Reduction of negative edge effects on wildlife
-1 point for every 10% increase in perimeter
g. House lots are no bigger than the minimum permitted
Reduction of negative influences on wildlife
-1 point for every 1% increase in the average lot size
*0.5 points if only one side of a stream is located within the property.

57
Number Subdivision name Latitude Longitude
1 Bridgemill Unit 4G 34o12’16.00”N 84o33’05.22”W
2 Forest Creek 34o14’04.70”N 84o25’21.64”W
3 Governor's Preserve Unit 4 34o16’26.70”N 84o24’55.80”W
4 Hearthstone Unit 2 34o05’58.25”N 84o32’53.15”W
5 Heritage Oaks 34o21’49.11”N 84o22’50.39”W
6 Laurel Trace 34o12’10.43”N 84o16’16.35”W
7 Pebblebrook 34o13’15.11”N 84o26’17.79”W
8 Smithwick Crossing 34o15’49.24”N 84o19’17.90”W
9 Sweetbriar 34o12’28.34”N 84o26’18.56”W
10 Wolf Creek Park 34o16’36.78”N 84o15’47.93”W Figure 2.1: Locations of Conservation Subdivisions in Cherokee County, GA.

58
Figure 2.2: Alternative to a stream crossing in Forest Creek Conservation Subdivision. Stream crossings have negative effects on water quality and riparian habitat (a, center right). In some instances stream crossings may be avoided by simply rerouting a road (b, center). Roads are depicted in black while streams and riparian buffers are shaded in grey.

59
Figure 2.3: Alternative a stream crossing in Heritage Oaks Conservation Subdivision. Stream crossings have negative effects on water quality and riparian habitat (a, center). In some instances stream crossings may be avoided by simply rerouting a road (b, center). Roads are depicted in black while streams and riparian buffers are shaded in grey.

60
Figure 2.4: Disturbance of ephemeral streams predicted by two green space variables. The percentage of green space composed of unregulated land is better (y = -0.56x + 100, R2=0.77, P<0.01) at predicting the percentage of ephemeral streams that would be disturbed by land development than the percentage of the property designated as green space (y = -0.67x + 100, R2=0.19, P=0.24).
Percentage of the property designated as green space Percentage of green space composed of unregulated land

61
Figure 2.5: Green space configuration in Bridgemill Conservation Subdivision. Despite being composed of four isolated patches of green space, its configuration showed the lowest amount of edge relative to its area (P/A ratio = 432), among all ten Conservation Subdivisions evaluated.

62
Figure 2.6: Green space configuration in Sweetbriar Conservation Subdivision. While there were no isolated patches of green space, its configuration showed the highest amount of edge relative to its area (P/A ratio = 1,617), among all ten Conservation Subdivisions evaluated.

63
Figure 2.7: Green space configuration in Pebblebrook Conservation Subdivision. The use of boundary buffers to connect patches of green space, as well as the design of narrow strips of green space to provide direct access to all the house lots, contributed to the high amount of edge relative to its area (P/A = 721).

64
CHAPTER 3
EVALUATION OF AN ECOLOGICAL SERVICES SUBDIVISION IN CUSCO, PERU
The regulation of conservation-oriented subdivisions in the U.S. differs from regulation
in Peru in two important aspects. First, ordinances in the U.S. vary among counties, while in
Peru it is one national ordinance. Second, while the ordinance in Cherokee County, GA focuses
on the pre-construction phase, the ordinance in Peru focuses on the post-construction phase.
Thus, while the former includes design regulations, the latter includes management regulations.
In addition, the Peruvian ordinance is explicit in its intent to conserve ecosystem services.
Chapter 1 described how legislation allowing the creation of Ecosystem Services
Subdivisions in Peru was achieved. Under the ordinance introduced by Legislative Decree 295 in
the Peruvian Civil Code, the property owned by the Santa Maria Homeowners Association in the
Municipality of San Sebastian in Cusco, became the first Ecosystem Services Subdivision in
Peru, long after it was originally developed (Villegas 2006). This unusual situation occurred
because the Santa Maria Homeowners Association sought this recognition after the fact, in order
to obtain a tax exemption on the tract of forest they had purposely set aside for conservation
when they purchased the land in 1964 (Carlos Rodriguez, President, Santa Maria Homeowners
Association, pers. comm.). This is the reason why the regulation of Ecological Services
Subdivisions in Peru focuses on the post-construction phase. Having preserved a portion of the
land in a subdivision from development, the ordinance requires that adequate management be
implemented for this land in order to ensure the conservation of ecosystem services (Sociedad
Peruana de Derecho Ambiental 2004).

65
Typically, Conservation Subdivision ordinances in the U.S. do not regulate the
management of the green space after construction has taken place (McElfish 2004). Chapter 2
has shown that flexible ordinances regulating specific design features may result in Conservation
Subdivisions that effectively contribute to the conservation of ecosystem services. However, pre-
construction regulations that lead to good design in Conservation Subdivisions, cannot assure
that their contribution to ecosystem services conservation will be sustained over the long-term.
Some degree of maintenance would have to be provided in order to prevent the degradation of
the green space as a result of environmental changes and the effects of development on
neighboring parcels of land. Conversely, the degree in which the management plan for the green
space in a subdivision would contribute to conserve ecosystem services will depend on the
conservation opportunities created before construction through good design. Therefore, while
Conservation Subdivision ordinances in the U.S. can be improved by including management
regulations, the Ecosystem Services Subdivision ordinance in Peru would be improved by the
inclusion of design regulations to ensure that post-construction management of the green space
in these subdivisions will be successful.
This study is concerned with both the design and management of Ecosystem Services
Subdivisions in Peru. Given that Santa Maria is the only subdivision of this kind to date, its
design features were evaluated and compared to those of Conservation Subdivisions in Cherokee
County, GA. The management practices implemented by the Santa Maria Homeowners
Association were evaluated as well, with regard to their contribution to the conservation of
ecosystem services in Cusco, and the potential for implementation in Conservation Subdivision
ordinances in the U.S.

66
3.1 Methods
3.1.1 Development Plat
The Santa Maria Ecosystem Services Subdivision was located in the Municipality of San
Sebastian in Cusco, Peru (Figure 3.1). The development plat for this subdivision was obtained
from the municipality’s Land Registers Office on October 30th, 2006.
The Santa Maria subdivision consisted of 101 house lots on 220ac of land, with a density
of 0.46 dwelling units per acre.
This plat did not include topographic nor hydrographic information for the green space,
and no other source was available at the time. It should be noted that because the land occupied
by the green space was not proposed for development, the Land Registers Office did not require
that such information be included.
3.1.2 Design Features
This study intended to evaluate the development plat for the Santa Maria subdivision
with regard to the same design features described in Chapter 2. However, because no layer
containing topographic or hydrographic information for the green space was obtained, the
number of features was limited to green space area, green space configuration, and house lot
size.
In addition, a visual inspection of the Santa Maria subdivision was conducted on
November 6, 2006, in order to identify the presence of surface waters, riparian zones, and stream
crossings.

67
3.1.3 Management Practices
Information about the management practices implemented for the green space in the
Santa Maria subdivision was obtained from direct experience during the visit to the subdivision
on November 6, 2006, as well as thru personal communication with authorities of the Santa
Maria Homeowners Association and e-mail correspondence with biologists from the San
Antonio Abad University in Cusco, Peru. Authorities of the Santa Maria Homeowners
Association included Carlos Rodriguez, President, and Percy Farfán, General Manager.
Biologists of the San Antonio Abad University included Rafael de la Colina, Gloria Calatayud,
and Patricia Guerra, Research Associates in the Department of Biological Sciences.
In order to grant the designation of Ecosystem Services Subdivision, the Municipality of
San Sebastian where the Santa Maria subdivision is located, required that green space
management practices be implemented to fulfill two objectives: conservation of native species of
wildlife, and recreation or education opportunities for people other than the residents of Santa
Maria.
3.2 Results
3.2.1 Design Features that Contribute to the Conservation of Water Quality
During the visual inspection of the green space in the Santa Maria subdivision, three first-
order streams were identified, each originating on a separate spring. All three streams were
located at least 100ft from the nearest edge of the green space.
No stream crossings were found on the streams located in the green space, and no streams
were present in the developed portion of the Santa Maria subdivision. No other surface waters
were identified.

68
Because hydrographic information was not available, it was not possible to identify the
100yr floodplain. In addition, because topographic information was not available, it was not
possible to identify the occurrence of ephemeral streams. Likewise, it was not possible to
identify slopes within the green space that may have been too steep for building.
3.2.2 Design Features that Contribute to the Conservation of Wildlife Diversity
The green space in the Santa Maria subdivision comprised 96.4ac of land. This acreage
represented 43.6% of the total area of the property.
The configuration of the green space showed a P/A ratio of 109ft/ac, and the percentage
increase in perimeter, relative to the perimeter of a circle of equal area to the green space, was
40.4%.
The average lot size for the subdivision was 33,706sf, while the smallest lot was
12,928sf. At the time in which the Santa Maria subdivision was proposed for development there
was no minimum lot size required. For this reason, calculating the percentage increase in lot size
did not apply.
3.2.3 Management of Green Space for the Conservation of Native Wildlife
3.2.3.1 Species Survey
The Santa Maria Homeowners Association commissioned a survey of wildlife species
present in the green space. This survey was carried out by biologists from the San Antonio Abad
University of Cusco in 2005. It found more than 200 species of plants, including some of
traditional and medicinal value for indigenous communities in the region (Gloria Calatayud,
Research Associate, Department of Biological Sciences, San Antonio Abad University of Cusco,
69
Peru, pers. comm.). It also found 38 species of birds, 7 of which are hummingbirds, all native to
the region (Rafael de la Colina, Research Associate, Department of Biological Sciences, San
Antonio Abad University of Cusco, Peru, pers. comm.).
Data on the number of species of invertebrates was not available. However, the presence
and breeding of a culturally important species of butterfly was verified. Known by the quichua
name of “Wayt’ampo” (Metardaris cosinga), the larval stage of this lepidopteran has been
recognized as an important source of protein in the diet of the Inca people that occupied the
region in pre-Columbian times (Patricia Guerra, Research Associate, Department of Biological
Sciences, San Antonio Abad University of Cusco, Peru, pers. comm.).
Further studies are expected to inform the development and implementation of specific
management practices for the conservation of some of the wildlife species found in the green
space of the Santa Maria subdivision.
3.2.3.2 Restoration of Native Forest
A reforestation program for the green space of the Santa Maria subdivision was
implemented in August 2005 (Percy Farfán, General Manager, Santa Maria Homeowners
Association, pers. comm.). It includes the removal of Eucalyptus sp. trees, an invasive species,
and planting of two native tree species: Chachacomo (Escallonia resinosa) and Queuña
(Polylepis sp.). These two species were dominant in natural forests of the region before the
introduction of Eucalyptus sp. (Gloria Calatayud, Research Associate, Department of Biological
Sciences, San Antonio Abad University of Cusco, Peru, pers. comm.).

70
3.2.4 Management of Green Space for Outdoor Recreation and Environmental Education
3.2.4.1 Outdoor Recreation Facilities
Access to the green space in the Santa Maria subdivision has been provided thru the
construction of walking trails. Other facilities built for recreation include a campground and a
picnic area. In addition, particular attention was given to visitors interested in bird watching,
resulting in the construction of two observation shelters along the walking trails.
3.2.4.2 Environmental Education Program
An environmental education and outreach program has been implemented to serve
children from neighboring communities. This program is conducted by volunteers, consisting of
residents of the Santa Maria subdivision and students from the San Antonio Abad University of
Cusco. The program includes formal lessons in ecology as well as interpretive visits and
activities in the green space (Percy Farfán, General Manager, Santa Maria Homeowners
Association, pers. comm.). Supplies for these activities are donated by local businesses. In
addition, an old school bus was purchased by the Santa Maria Homeowners Association. It was
installed at the entrance to the green space and its interior was modified to serve as an outdoor
classroom.
3.3 Discussion
The green space in the Santa Maria subdivision showed a number of design features that
are a positive indication of its contribution to the conservation of ecosystem services. For
example, because the three streams identified in the green space were located at least 100ft from
71
its edge, these streams can be seen as benefiting from an effective riparian buffer at least twice
the width mandated in Cherokee County, GA (Cherokee County Board of Commissioners
2005b). In addition, the risk posed by house lots extending into riparian buffers does not exist for
the streams in the Santa Maria subdivision. This feature is particularly important, because
riparian buffers are not required for residential developments in Peru (Carlos Cáceres, Architect,
Santa Maria Homeowners Association, pers. comm.).
The area of green space in the Santa Maria subdivision, 96.4ac, was 20% larger than the
largest green space area among the Conservation Subdivisions evaluated in Chapter 2 (Table
2.4). In terms of percentage of the property area however, the green space in the Santa Maria
subdivision was slightly below the highest value among the subdivisions evaluated in Chapter 2,
43.6% versus 45.9%, respectively (Table 2.4). But the most important difference between the
Santa Maria subdivision and any of the Conservation Subdivisions evaluated in Cherokee
County was the configuration of the green space. The P/A ratio of the green space in the Santa
Maria subdivision, 109ft/ac, was approximately one fourth of the lowest value found among the
Conservation Subdivisions evaluated (Table 2.6). The low P/A ratio resulted in a percentage
increase in perimeter of only 40.4%, relative to a circle of the same area. This value is less than
one fourth the lowest value found for the subdivisions evaluated in Chapter 2 (Table 2.6). These
results indicate that negative edge effects occurring in the green space of the Santa Maria
subdivision are greatly reduced. This can be appreciated in the design of the Santa Maria
subdivision, where the forest tract that the homeowners intended to protect was located on one
end of the elongated parcel of land (Figure 3.2). Thus, it should be recognized that the location of
this forest was the most important factor in achieving the design of green space with great
potential to provide habitat for wildlife. This highlights the importance of having an ordinance

72
that takes into consideration the intrinsic differences among parcels of land, and that therefore
shows flexibility in requiring design features that contribute to the conservation of ecosystem
services.
Given the size of the smallest lot in the Santa Maria subdivision, 12,928sf, it could be
compared to a Conservation Subdivision zoned R20 in Cherokee County (Table 1.1). This
zoning allows a maximum density of 2.18 dwelling units per acre. However, the density in the
Santa Maria subdivision is 0.46 dwelling units per acre. This density is not only lower than that
allowed on land zoned R20, but lower than the lowest density allowed for any zoning district in
Cherokee County (Table 1.1). These two findings, small lot sizes and low density, indicate that
house lots in the Santa Maria subdivision are highly clustered (Figure 3.2), thus minimizing the
negative influences associated with household activities that may affect wildlife inhabiting the
green space.
The results of the survey of wildlife species inhabiting the green space in the Santa Maria
subdivision indicate that there are a number of native species that are worth protecting through
management practices that enhance their habitat. Thus, the reforestation program implemented to
restore the original tree species composition of the green space, is expected to provide more
suitable habitat for native species of animals. Moreover, reforestation is planned to take place in
stages, so that there will be trees of different ages, thus restoring the age structure of the forest as
well. These actions are consistent with studies that have found that bird species are highly
sensitive to changes in habitat composition and structure (Savard et al. 2000, Marzluff and
Ewing 2001, Hennings and Edge 2003, Sallabanks et al. 2006).
Management for conservation of native wildlife, and conservation of bird species in
particular, provides an additional ecosystem service: opportunities for ecotourism. Bird watchers

73
are among the thousands of tourist that arrive in the city of Cusco every month. Thus, providing
a place where to observe birds so close to the city contributes not only to ecological
conservation, but also to the economic development of the region. Other facilities for outdoor
recreation offer opportunities for people to gain an appreciation of nature near to where they live,
which may indirectly contribute to raise awareness and support for conservation initiatives in
other urbanizing areas.
Citizens with an even higher appreciation of nature are likely to result from the
environmental education program offered to the children of neighboring communities. Thus, in a
sense, the management practices aimed at conserving the native wildlife and natural
characteristics of the green space also contribute to the conservation of another ecosystem
service: education. It should be noted that providing this kind of educational opportunities has
been recognized as equally important to the conservation of ecosystem services as direct
interventions in the design and management of protected land (Nilon et al. 1999, Savard et al.
2000).
3.4 Opportunities for Improvement of Ordinances in both Peru and the U.S.
The Santa Maria subdivision has been shown to possess several design features that
would contribute to the conservation of ecosystem services. This was a serendipitously
occurrence however, given that its development was planned without any specific guidelines,
and regulation for Ecosystem Services Subdivisions was introduced after the fact. There is no
reason to expect that other residential developments wanting to obtain the designation of
Ecosystem Services Subdivision will be able or willing to include similar design features. Thus,
in Peru, it is imperative that municipalities considering the implementation of ordinances to

74
regulate this kind of subdivisions include design requirements similar to those recommended in
Chapter 2. The implementation of a scoring system such as the one described in Chapter 2 is
recommended as well.
In turn, in the U.S., county governments should consider including specific green space
management requirements in their ordinances. Currently, Cherokee County’s Conservation
Subdivision ordinance requires that a homeowners association be formed to take charge of
maintaining the green space, or otherwise arrange for a land trust or government agency to
assume this responsibility (Cherokee County Board of Commissioners 2005a). It also requires
that the homeowners association develop a long-term conservation plan for the green space.
However, it recommends –rather than requiring- that at least one member of the association be
trained -or be conversant- in wildlife habitat conservation. Clearly, this kind of provision cannot
assure that an adequate management plan would be developed. Furthermore, the ordinance does
not indicate specific management objectives, like habitat for a particular type of wildlife, or
eradication of invasive plant species. Thus, these two omissions bear the risk that poor
management would undermine the capacity of the green space to contribute to the conservation
of ecosystem services.
It is therefore recommended that Conservation Subdivision ordinances in the U.S. include
specific management requirements, according to the conservation objectives established by each
county. Furthermore, in developing a management plan, the homeowners association must be
required to have the assistance of an individual or institution with adequate credentials in
biological conservation or ecological restoration. This may not apply when the responsibility is
transferred to a land trust or government agency. Alternatively, the responsibility of developing a
management plan could be placed on the developer. This alternative is likely to be more

75
effective, because the developer of a Conservation Subdivision is in the advantageous position to
adequately integrate the design of the subdivision with the management of the green space that
would take place after construction. The homeowners association would still be responsible for
the implementation and sustainability of the management plan.
The development of a management plan could be incorporated into the scoring system
proposed in Chapter 2. This would provide developers an additional opportunity to meet the
score needed for approval of a Conservation Subdivision. In the same way that a flexible
ordinance based on a scoring system would offer an incentive to developers, it must also provide
incentives to the homeowners in order to ensure sustained management of the green space.
The case of the Santa Maria Homeowners Association offers a potential incentive for
implementation in Conservation Subdivisions in the U.S. The reason this association of
homeowners sought legislation regulating the development of Ecosystem Services Subdivisions
was to obtain tax exemption on the portion of their property designated as green space. In turn,
the local government demanded that the green space be managed for the benefit of the
community, even requiring some level of public access. For the Santa Maria Homeowners
Association, the tax exemption was enough an incentive to comply with the local government’s
demands. Moreover, they saw an opportunity to generate some economic return, as they are not
prevented from charging a fee for camping in their property for instance (Carlos Rodriguez,
President, Santa Maria Homeowners Association, pers. comm.). The good will of these
homeowners should not be diminished however, as they seem truly committed to the goals of
conservation and environmental education.
The lesson from the experience of Santa Maria is that active participation of the residents
of a subdivision in the conservation of green space necessitates an incentive. Homeowners in

76
Conservation Subdivisions in the U.S. can be said to be passive participants in the conservation
of green space. An incentive to purchase a home in a Conservation Subdivision is likely to be the
green space itself, because of its aesthetic and recreational value. Thus, homeowners are likely to
care about maintaining the green space at least to a minimum that would satisfy their needs.
However, the implementation of management practices aimed at enhancing the habitat for other
species will most likely require an economic incentive. As in the case of the Santa Maria
Homeowners Association, some form of tax benefit is likely to be a good incentive. Currently,
the state of Georgia has a Conservation Tax Credit Program, which offers exemption from state
taxes on a property designated as green space and donated to a land trust or similar organization
(Georgia Department of Natural Resources 2006). The types of green space considered in the
program do not include green space in Conservation Subdivisions. However, this program may
serve as a precedent for counties like Cherokee County to consider legislation that may exempt
or reduce property taxes on the portion occupied by green space in Conservation Subdivisions.
This tax benefit would be granted in exchange for the active participation of its residents in
enhancing the characteristics of the green space that contribute to the conservation of ecosystem
services.
3.5 Conclusion
Regulation of Ecosystem Services Subdivisions in Peru focuses on green space
management practices that would take place after construction. No requirements regarding the
design of these subdivisions are currently included in local ordinances. The Santa Maria
subdivision was shown to exhibit design features that would contribute to the conservation of
ecosystem services. However, it cannot be expected that other subdivisions will exhibit the same

77
quality of design. Therefore, it is recommended that ordinances regulating Ecosystem Services
Subdivisions include specific design requirements. The same design features and scoring system
proposed for Conservation Subdivisions in the U.S. are recommended for implementation in
Peru. Conversely, its is recommended that Conservation Subdivision ordinances in the U.S.
include management requirements, given that design alone is unlikely to sustain the contribution
of the green space to the conservation of ecosystem services. Some of the management practices
implemented in the Santa Maria subdivision represent conservation objectives that are applicable
to Conservation Subdivisions in the U.S. These include restoration of native flora and habitat for
native wildlife, as well as the eradication of invasive species. Based on the experience of Santa
Maria Homeowners Association, incentives to the homeowners in Conservation Subdivisions are
recommended. Regulation that offers some form of property tax benefit is suggested, in
exchange for management of the green space in a way that enhances its contribution to the
conservation of ecosystem services. Furthermore, active participation of the residents of
Conservation Subdivisions should be preferred, as this would also contribute to enhance their
appreciation of nature and educate them in being better stewards of their land.

78
Figure 3.1: Location of Santa Maria Ecosystems Services Subdivision in Cusco, Peru (Latitude: 13o31’27.70”S, Longitude: 71o53’58.01”W).

79
Figure 3.2: Green space in the Santa Maria Ecosystem Services Subdivision in Cusco, Peru. The location, size, and configuration of the green space (black) represent design features that contribute to the conservation of ecosystem services.

80
REFERENCES
Andrén, H. and P. Angelstam. 1988. Elevated predation rates as an edge effect in habitat islands: experimental evidence. Ecology 69: 544-547.
Alig, R.J., J.D. Kline, and M. Lichtenstein. 2004. Urbanization on the U.S. landscape: looking ahead in the 21st century. Landscape and Urban Planning 69: 219-234.
Alverson, W.S., D.M. Waller, and S.L. Solheim. 1988. Forests too deer: edge effects in northern Wisconsin. Conservation Biology 2 (4): 348-358.
Arendt, R.G. 1996. Conservation Design for Subdivisions: A Practical Guide To Creating Open Space Networks. Island Press, Washington, D.C.
Arendt, R.G. 2004. Linked landscapes: creating greenway corridors through conservation subdivision design strategies in the northeastern and central United States. Landscape and Urban Planning 68: 241-269.
Arnold, C.L. and C.J. Gibbons. 1996. Impervious surface coverage: the emergence of a key environmental indicator. Journal of the American Planning Association 62: 243-258.
Athens-Clarke County Government. 2006. Planning Code - Protected Environmental Areas, Article 2: Riparian Buffers and Floodplains. http://www.accstormwater.com/public/112307Env_Areas_Chapter_8-6.pdf Last accessed: May 21, 2007.
Backlund, E.A., W.P. Stewart, C. McDonald, and C. Miller. 2004. Public evaluation of open space in Illinois: Citizen support for natural area acquisition. Environmental Management 34 (5): 634-641.
Barbier, E.B., J.C. Burgess, and C. Folke. 1994. Paradise Lost? The Ecological Economics of Biodiversity. Earthscan, London.
Ben-Joseph, E. 2005. The Code of the City: Standards and the Hidden Language of Place Making. MIT Press, Cambridge, MA.
Benedict, M.A. and E.T. McMahon. 2006. Green Infrastructure: Linking Landscapes and Communities. Island Press, Washington, D.C.
Blair, R.B. 1996. Land-use and avian species-diversity along an urban gradient. Ecological Applications 6(2): 506-519.
81
Blair, R.B. and A.E. Launer. 1997. Butterfly diversity and human land-use: Species assemblages along and urban gradient. Biological Conservation 80(1): 113-125.
Bock, C.E., R.A. Bailowitz, D.W. Danforth, Z.F. Jones, and J.H. Bock. 2007. Butterflies and exurban development in southeastern Arizona. Landscape and Urban Planning 80: 34-44.
Boyd, J. and L. Wainger. 2003. Measuring Ecosystem Service Benefits: The Use of Landscape Analysis to Evaluate Environmental Trades and Compensation. Discussion Paper 02-63. Resources for the Future, Washington, D.C.
Brittingham, M.C. and S.A. Temple. 1983. Have cowbirds caused forest songbirds to decline? BioScience 33: 31-35.
Brown, J.W. 2006. Eco-logical: An Ecosystem Approach to Developing Infrastructure Projects. U.S. Department of Transportation, Research and Innovative Technology Administration, Cambridge, MA. (http://www.environment.fhwa.dot.gov/ecological/ecological.pdf)
Brown, D.G., K.M. Johnson, T.R. Loveland, and D.M. Theobald. 2005. Rural land-use trends in the conterminous United States, 1950-2000. Ecological Applications 15 (6): 1851-1863.
Bullard, R.D., G.S. Johnson, and A.O. Torres. 1999. Atlanta megasprawl. Forum for Applied Research and Public Policy 14 (3): 17-23.
Burke, V.J. and J.W. Gibbons. 1995. Terrestrial buffer zones and wetland conservation: A case study of freshwater turtles in a Carolina Bay. Conservation Biology 9(6): 1365-1369.
Burke, D.M. and D.R. Nol. 1998. Influence of food abundance, nest-site habitat, and forest fragmentation on breeding Ovenbirds. Auk 115: 96-104.
Center for Watershed Protection. 1998. Rapid Watershed Planning Handbook: A Comprehensive Guide for Managing Urbanizing Watersheds. CWP, Ellicott City, MD.
Chan, K.M.A., M.R. Shaw, D.R. Cameron, E.C. Underwood, and G.C. Daily. 2006. Conservation Planning for Ecosystem Services. PLoS Biology 4 (11): 2138-2152.
Cherokee County Board of Commissioners. 2005a. Zoning Ordinance, Article 23: Conservation Subdivision Ordinance. http://stormwater.cherokeega.com/forms/Conservation_Subdivision.pdf Last accessed: May 21, 2007.
Cherokee County Board of Commissioners. 2005b. Ordinance 2005-Z-003: Stream Buffer Protection Ordinance. http://stormwater.cherokeega.com/forms%5CStream_Buffer_Ordinance.pdf Last accessed: May 21, 2007.
Cherokee County Board of Commissioners. 2005c. Development Ordinance, Section 5.0: Storm Water Management. http://stormwater.cherokeega.com/forms/Dev_Regs_SEC5_rev.pdf Last accessed: May 21, 2007.
82
Cherokee County Board of Commissioners. 2005d. Ordinance 2005-O-002: Soil Erosion and Sedimentation Control Ordinance. http://stormwater.cherokeega.com/forms/Soil_Erosion_Sedimentation_Control_Ordinance_2005.pdf Last accessed: May 21, 2007.
Coleman, J.S. and S.A. Temple. 1996. On the prowl. Wisconsin Natural Resources 20: 4-8.
Costanza, R., R. d’Arge, R. de Groot, S. Farber, M. Grasso, B. Hannon, K. Limburg, S. Naeem, R.V. O’Neill, J. Paruelo, R.G. Raskin, P. Sutton, and M. van den Belt. 1997. The value of the world’s ecosystem services and natural capital. Nature 387 (May 15): 253-260.
Costanza, R. and C. Folke. 1997. Valuing Ecosystem Services with Efficiency, Fairness, and Sustainability as Goals. In: Daily, G.C. (Ed.) Nature’s Services: Societal Dependence on Natural Ecosystems. Island Press, Washington, D.C., pp. 49-68.
Czech, B., P.R. Krausman, and P.K. Devers. 2000. Economic associations among causes of species endangerment in the United States. BioScience 50: 593-601.
Daily, G.C. 1997a. Introduction: What are Ecosystem Services? In: Daily, G.C. (Ed.) Nature’s Services: Societal Dependence on Natural Ecosystems. Island Press, Washington, D.C., pp. 1-10.
Daily, G.C. 1997b. Nature’s Services: Societal Dependence on Natural Ecosystems. Island Press, Washington, D.C.
Daly, J. and M.W. Klemens. 2005. Integrating Conservation of Biodiversity into Local Planning. In: Johnson, E.A. and M.W. Klemens (Eds.) Nature in Fragments: The Legacy of Sprawl. Columbia University Press, New York, pp. 313-334.
Davis, S.K. 2004. Area sensitivity in grassland passerines: Effects of patch size, patch shape, and vegetation structure on bird abundance and occurrence in southern Saskatchewan. The Auk 121 (4): 1130-1145.
De Marco, P. and F.M. Coelho. 2004. Services performed by the ecosystem: Forest remnants influence agricultural cultures' pollination and production. Biodiversity Conservation 13: 1245–1255.
Donnelly, R. and J.M. Marzluff. 2004. Importance of reserve size and landscape context to urban bird conservation. Conservation Biology 18(3): 733-745.
Donovan, T.M., F.R. Thompson III, J. Faaborg, and J.R. Probst. 1995. Reproductive success of migratory birds in habitat sources and sinks. Conservation Biology 9 (6): 1380-1395.
Dramstad, W., J.D. Olson, and R.T.T. Forman. 1996. Landscape Ecology Principles in Landscape Architecture and Land-Use Planning. Island Press, Washington, D.C.
Ewers, R.M. and R.K. Didham. 2006. Continuous response functions for quantifying the strength of edge effects. Journal of Applied Ecology 43 (3): 527-536.

83
Faaborg, J., M. Brittingham, T. Donovan, and J. Blake. 1993. Habitat Fragmentation in the Temperate Zone: A Perspective for Managers. In: Finch, D.M. and P.W. Stangel (Eds.) Status and Management of Neotropical Migratory Birds. USDA General Technical Report RM-229.
Fairfax County, VA. 2004. Watershed Planning Project. http://www.fairfaxcounty-watersheds.net Last accessed: May 21, 2007.
Farber, S. 2005. The Economics of Biodiversity in Urbanizing Ecosystems. In: Johnson, E.A. and M.W. Klemens (Eds.) Nature in Fragments: The Legacy of Sprawl. Columbia University Press, New York, pp. 263-283.
Feller, W.V. 2003. Urban Impostures: How Two Neighborhoods Reframed Suburban Sprawl as a New Urbanist Paradise without Changing a Thing. In: Lindstrom, M.J. and H. Bartling (Eds.) Suburban Sprawl: Culture, Theory, and Politics. Rowman & Littlefield, Lanham, MD.
Frumkin, H., L. Frank, and R. Jackson. 2004. Urban Sprawl and Public Health: Designing, Planning, and Building for Healthy Communities. Island Press, Washington, D.C.
Gates, J.E. and L.W. Gysel. 1978. Avian nest dispersion and fledgling success in field-forest ecotones. Ecology 59: 871-883.
Geoghegan, J. 2002. The value of open spaces in residential land use. Land Use Policy 19: 91-98.
Georgia Department of Natural Resources. 2005. Erosion and Sedimentation Control Rule 391-3-7-.05: Buffer Variance Procedures and Criteria. http://rules.sos.state.ga.us/docs/391/3/7/05.pdf Last accessed: May 21, 2007.
Georgia Department of Natural Resources. 2006. Georgia Conservation Tax Credit Program. http://www.gadnr.org/pdf/GCTCP_policies.pdf Last accessed: July 3, 2007.
Gillham, O. 2002. The Limitless City: A Primer on the Urban Sprawl Debate. Island Press, Washington, D.C.
Hansen, A.J., R.L. Knight, J.M. Marzluff, S. Powell, K. Brown, P.H. Gude, and K. Jones. 2005. Effects of exurban development on biodiversity: Patterns, mechanisms, and research needs. Ecological Applications 15(6): 1893-1905.
Hansen, W.F. 2001. Identifying stream types and management implications. Forest Ecology and Management 143: 39-46.
Harris, L.D. 1988. Edge effects and conservation of biotic diversity. Conservation Biology 2 (4): 330-332.
Hartley, M.J. and M.L. Hunter Jr. 1998. A meta-analysis of forest cover, edge effects, and artificial nest predation rates. Conservation Biology 12 (2): 465-469.

84
Heal, G. 2000. Nature and the Marketplace: Capturing the Value of Ecosystem Services. Island Press, Washington, D.C.
Heal, G., G.C. Daily, P.R. Ehrlich, J. Salzman, C. Boggs, J. Hellamnn, J. Hughes, C. Kremen, and T. Ricketts. 2001. Protecting natural capital through ecosystem service districts. Stanford Environmental Law Journal 20: 333–364.
Hennings, L.A. and W.D. Edge. 2003. Riparian bird community structure in Portland, Oregon: Habitat, urbanization, and spatial scale patterns. Condor 105(2): 288-302.
Honachefsky, W.B. 1999. Ecologically Based Municipal Land Use Planning. CRC, Boca Raton, FL.
Huston, M.A. 2006. The three phases of land-use change: Implications for biodiversity. Ecological Applications 15: 1864-1878.
Instituto Nacional de Estadísticas e Información. 2006. Censos Nacionales 2005. http://www.inei.gob.pe Last accessed: February 12, 2007.
Irwin, E.G. 2002. The effects of open space on residential property values. Land Economics 78: 465-480.
Jackson C.R. 2006. Considerations in Prescribing Riparian Buffer Widths with Emphasis on Georgia Warm-water Streams. Georgia Department of Natural Resources, Coastal Resources Division. http://crd.dnr.state.ga.us/assets/documents/jrgcrddnr/ripbuffsum.pdf Last accessed: April 16, 2007.
Johnson, M.P. 2001. Environmental impacts of urban sprawl: A survey of the literature and proposed research agenda. Environment and Planning A, 33: 717-735.
Johnson, D.H. and L.D. Igl. 2001. Area requirements of grassland birds: A regional perspective. Auk 118: 24-34.
Johnson, E.A. and M.W. Klemens (Eds.) 2005. Nature in Fragments: The Legacy of Sprawl. Columbia University Press, New York.
Jokimaki, J. and J. Suhonen. 1993. Effects of urbanization on the breeding bird species richness in Finland: A biogeographical comparison. Ornis Fennica 70(2): 71-77.
Kauffman, M.M., D.L. Wigston, and E.B. Perlman. 2002. Environmental evaluation of subdivision site developments. Environmental Management 29 (6): 801-812.
King County, WA. 2006. Watershed Planning for Salmon Habitat. http://dnr.metrokc.gov/wrias Last accessed: May 21, 2007.
Knight, R.L. and K.J. Gutzwiller (eds.) 2001. Wildlife and Recreationists. Island Press, Washington, D.C.

85
Kremen, C. 2005. Managing ecosystem services: What do we need to know about their ecology? Ecology Letters 8: 468–479.
Lacayo, R., W. Cole, D. Cray, D.S. Levy, T. Murphy, and T. Roche. 1999. The brawl over sprawl. Time 153 (11): 42-48.
Laurie, I.C. (Ed.) 1979. Nature in Cities: The Natural Environment in the Design and Development of Urban Green Space. John Wiley & Sons, New York.
Lee, P., C. Smyth, and S. Boutin. 2004. Quantitative review of riparian buffer width guidelines from Canada and the United States. Journal of Environmental Management 70: 165-180.
Lenth, B.A., R.L. Knight, and W.C. Gilbert. 2006. Conservation value of clustered housing developments. Conservation Biology 20 (5): 1445-1456.
Leonard, J.B. 2000. Lima. Cities 17 (6): 443-445.
Little, C.E. 1995. Greenways for America. Johns Hopkins University Press, Baltimore, MD.
Lyle, J.T. 1985. Design for Human Ecosystems: Landscape, Land Use, and Natural Resources. Van Nostrand Reinhold, New York.
Maestas, J.D., R.L. Knight, and W.C. Gilbert. 2003. Biodiversity across a rural land use gradient. Conservation Biology 17: 1425-1234.
Marsh, W.M. and N.L. Marsh. 1995. Hydrogeomorphic considerations in development planning and stormwater management, Central Texas Hill County, USA. Environmental Management 19 (5): 693-702.
Marzluff, J.M. and K. Ewing. 2001. Restoration of fragmented landscapes for the conservation of birds: A general gramework and specific recommendations for urbanizing landscapes. Restoration Ecology 9(3): 280-292.
Marzluff, J.M., F.R. Gehlbach, and D.A. Manuwal. 1998. Urban environments: Influences on avifauna and challenges for the avian conservationist. In: J.M. Marzluff and R. Sallabanks (Eds.) Avian Conservation: Research and Management. Island Press, Washington, D.C., pp. 83-299.
Mason, J., C. Moorman, G. Hess, and K. Sinclair. 2007. Designing suburban greenways to provide habitat for forest-breeding birds. Landscape and Urban Planning 80: 153-164.
Maureer, B.A. and S.G. Heywood. 1993. Geographic range fragmentation and abundance in neo-tropical migratory birds. Conservation Biology 7: 501-509.
May, C., R. Horner, J. Karr, B. Mar, and E. Welch. 1997. Effects of urbanization on small streams in the Pudget Sound lowland ecoregion. Watershed Protection Techniques 2(4): 483-494.

86
McDonald, L., W. Allen, M. Benedict, and K. O’Connor. 2005. Green infrastructure plan evaluation frameworks. Journal of Conservation Planning 1 (1): 12-43.
McElfish, J.M., Jr. 2004. Nature-Friendly Ordinances: Local Measures to Conserve Biodiversity. Environmental Law Institute, Washington, D.C.
McHarg, I.L. 1969. Design with Nature. Natural History Press, Garden City, NY.
McKinney, M.L. Urbanization as a major cause of biotic homogenization. Biological Conservation 127: 247-260.
Millennium Ecosystem Assessment. 2005. Ecosystems and Human Well-being: Our Human Planet: Summary for Decision Makers. Island Press, Washington, D.C.
Miller, S.G., R.L. Knight, and C.K. Miller. 2001. Wildlife responses to pedestrians and dogs. Wildlife Society Bulletin 29(1): 124-132.
Miltner, R.J., D. White, and C. Yoder. 2004. The biotic integrity of streams in urban and suburbanizing landscapes. Landscape and Urban Planning 69: 87-100
Nilon, C.H., C.N. Long, and W.C. Ziperer. 1995. Effects of wildland development on forest bird communities. Landscape and Urban Planning 32: 81-92.
Nilon, C.H., A.R. Berkowitz, and K.S. Hollweg. 1999. Introduction: Ecosystem Understanding is a Key to Understanding Cities. In: Nilon, C.H., A.R. Berkowitz, and K.S. Hollweg (Eds.) Understanding Urban Ecosystems: A New Frontier for Science and Education. Springer, New York, pp. 1-13.
Pagiola, S., K. von Ritter, and J. Bishop. 2004. Assessing the Economic Value of Ecosystem Conservation. World Bank Environment Department, Washington, D.C.
Pejchar, L., P.M. Morgan, M.R. Caldwell, C. Palmer, and G.C. Daily. 2006. Evaluating the potential for conservation development: Biophysical, economic, and institutional perspectives. Conservation Biology 21 (1): 69-78.
Perdikaki, K. and C.F. Mason. 1999. Impact of road run-off on receiving streams in western England. Water Resources 33(7): 1627-1633.
Perlman, D.L. and J.C. Milder. 2004. Practical Ecology for Planners, Developers, and Citizens. Island Press, Washington, D.C.
Peterson, G.D., T.D.Jr. Beard, B.E. Beisner, E.M. Bennett, S.R. Carpenter, G.S. Cumming, C.L. Dent, and T.D. Havlicek. 2003. Assessing future ecosystem services: A case study of the Northern Highlands Lake District, Wisconsin. Conservation Ecology 7(3): 1 (http://www.consecol.org/vol7/iss3/art1)
87
Peterson, J. and J.S. Reichert. 1997. Perspectives on Nature’s Services. In: Daily, G.C. (Ed.) Nature’s Services: Societal Dependence on Natural Ecosystems. Island Press, Washington, D.C., pp. xvii-xx.
Pima County, AZ. 2002. Sonoran Desert Conservation Plan. http://www.co.pima.az.us/cmo/sdcp Last accessed: May 21, 2007.
Porter, D.R. 1997. Managing Growth in America’s Communities. Island Press, Washington, D.C.
Postel, S. and S. Carpenter. 1997. Freshwater Ecosystem Services. In: Daily, G.C. (Ed.) Nature’s Services: Societal Dependence on Natural Ecosystems. Island Press, Washington, D.C., pp. 195-214.
Rohde, C.L.E. and A.D. Kendle. 1997. Nature for People: Psychological Value of Nature for People in Urban Areas. In: Kendle, T. and S. Forbes (Eds.) Urban Nature Conservation: Landscape Management in the Urban Countryside. E & FN Spon, New York, pp. 319-335.
Ruhl, J.B., S.E. Kraft, and C.L. Lant. 2007. The Law and Policy of Ecosystem Services. Island Press, Washington, D.C.
Sabo, J.L., R. Sponseller, M. Dixon, K. Gade, T. Harms, J. Hefferman, A. Jani, G. Katz, C. Soykan, J. Watts, and J. Welter. 2005. Riparian zones increase regional species richness by harboring different, not more, species. Ecology 86 (1): 56-62.
Sallabanks, R., J.R. Walters, and J.A. Collazo. 2000. Breeding bird abundance in bottomland hardwood forests: habitat, edge, and patch size effects. The Condor 102: 748-758.
Sallabanks, R., R.A. Riggs, L.E. Cobb, and S.W. Dodson. 2006. Bird-habitat relationships in Grand Fir forests of the Blue Mountains, Oregon. Forest Science 52 (5): 489-502.
Salzman, J., B.H.Jr. Thompson, and G.C. Daily. 2001. Protecting ecosystem services: Science, economics, and law. Stanford Environmental Law Journal 20: 309–332.
Suarez, A.V., K.S. Pfenning, and S.K. Robinson. 1997. Nesting success of a disturbance-dependent songbird on different kinds of edges. Conservation Biology 11 (4): 928-935.
Savard, J.P.L, P. Clergeau, and G. Mennechez. 2000. Biodiversity concepts and urban ecosystems. Landscape and Urban Planning 48: 131-142.
Scanlon B.R., R.C. Reedy, D.A. Stonestrom, D.E. Prudic, and K.F. Dennehy. 2005. Impact of land use and land cover change on groundwater recharge and quality in the southwestern US. Global Change Biology 11: 1577–1593.
Schieck, J., K. Lertzman, B. Nyberg, and R. Page. 1995. Effects of patch size on birds in old-growth montane forests. Conservation Biology 9 (5): 1072-1084.

88
Schuler, T. 1995. The architecture of urban stream buffers. Watershed Protection Techniques 1(4): 155-163.
Shearer, L. 2005. Conservation subdivision ordinance redeveloped. Athens Banner-Herald, Georgia. June 15, p. A9.
Sheboygan County, WI. 2005. Farmland Preservation Plan. http://www.co.sheboygan.wi.us/html/d_planning_farm_pres_plan.htm Last accessed: May 21, 2007.
Shirley, S.M. and J.N.M. Smith. 2005. Bird community structure across riparian buffer strips of varying width in a coastal temperate forest. Biological Conservation 125: 475-489.
Smith, P.G.R. 2007. Characteristics of urban natural areas influencing winter bird use in southern Ontario, Canada. Environmental Management 39 (3): 338-352.
Smith, C.M. and D.G. Wachob. 2006. Trends associated with residential development in riparian breeding bird habitat along the Snake river in Jackson hole, WY, USA: Implications for conservation planning. Biological Conservation 128: 431-446.
Sociedad Peruana de Derecho Ambiental. 2004. Manual de Instrumentos Legales para la Conservación Privada en el Perú. SPDA, Lima.
Soil Conservation Service. 1986. Technical Release 55: Urban Hydrology for Small Watersheds – Second Edition. United States Department of Agriculture, Washington, D.C.
Song, Y. and G. Knaap. 2004. Measuring urban form. Journal of the American Planning Association 70(2): 210-225.
Tilman, D. 1997. Biodiversity and Ecosystem Functioning. In: Daily, G.C. (Ed.) Nature’s Services: Societal Dependence on Natural Ecosystems. Island Press, Washington, D.C., pp. 93-112.
Theobald, D.M. 2004. Placing exurban land-use change in a human modification framework. Frontiers in Ecology and the Environment 2 (3): 139-144.
Theobald, D.M., J.R. Miller, and N.T. Hobbs. 1997. Estimating the cumulative effects of development on wildlife habitat. Landscape and Urban Planning 39: 25-36.
Theobald, D.M., N.T. Hobbs, T. Bearly, J.A. Zack, T. Shenk, and W. E. Riebsame. 2000. Incorporating biological information in local land-use decision-making: Designing a system for conservation planning. Landscape Ecology 15: 35-45.
Thom, T.A. 2000. Land Use and Aquatic Ecosystem Health in the Andean Slopes of Northwestern Ecuador. M.S. Thesis. University of Georgia, Athens, GA.

89
Thomas, M.R. 2003. The use of ecologically based screening criteria in a community-sponsored open space preservation programme. Journal of Environmental Planning and Management 46 (5): 691-714.
Trombulak, D.M. and C.A. Frissell. 2000. Review of ecological effects of roads on terrestrial and aquatic communities. Conservation Biology 14:18-30.
Turner, M., R.H. Gardner, and R.V. O’Neill. 2003. Landscpae Ecology in Theory and Practice: Pattern and Process. Springer-Verlag, New York.
United Nations Population Division. 2004. World Urbanization Prospects. U.N. Department of Economic and Social Affairs, New York.
United States Army Corps of Engineers. 2002. Nationwide Permit Definitions. http://www.usace.army.mil/cw/cecwo/reg/2002nwps_def.pdf Last accessed: May 21, 2007.
United States Census Bureau. 2005. U.S. Census 2000. http://www.census.gov/main/www/cen2000.html Last accessed: May 21, 2007.
United States Geological Survey. 1997. Digital Orthophoto Quadrangles. http://edc.usgs.gov/products/aerial/doq.html Last accessed: February 23, 2007.
Van der Ryn, S. and S. Cowan. 1995. Ecological Design. Island Press, Washington, D.C.
Verry, E.S., J.W. Hornbeck, and C.A. Dollof (Eds.) 1999. Riparian Management in Forests of the Continental Eastern United States. CRC, Boca Raton.
Villegas, Y. 2006. El Cusco que no se conoce: Associación Santa María; un ejemplo a seguir. Wiñay (September/October): 3-4.
Wainger, L.A., D.M. King,, J.A. Cantrell, and S.L. Bird. 2004. Development of Indicators to Assess Economic Vulnerabilities to Changes in Ecosystem Services: Case Study of Counties in Maryland, USA. Environmental Management 34 (5): 730-747.
Walsh, C.J., A.H. Roy, J.W. Feminella, P.D. Cottingham, P.M. Groffman, and R.P. Morgan II. 2005. The urban stream syndrome: current knowledge and the search for a cure. Journal of the National Benthological Society 24 (3): 706-723.
Warren M.L. and M.G. Pardew. 1998. Road crossings as barriers to small-stream fish movement. Transactions of the American Fisheries Society 127: 637-644.
Welsch, D.J. 1991. Riparian Forest Buffers: Function and Design for Protection and Enhancement of Water Resources. U.S. Department of Agriculture, Radnor, PA.
Wenger, S. 1999. A Review of the Scientific Literature on Riparian Buffer Width, Extent and Vegetation. Office of Public Service and Outreach, Institute of Ecology, University of Georgia.

90
Wilcox, A. and J. Harte. 1997. Ecosystem Services in a Modern Economy: Gunnison County, Colorado. In: Daily, G.C. (Ed.) Nature’s Services: Societal Dependence on Natural Ecosystems. Island Press, Washington, D.C., pp. 311-328
Williams, C. 2005a. Protecting land to get tighter rein. The Atlanta Journal-Constitution, Georgia. March 10, p. 1JQ.
Williams, C. 2005b. Builders say new revision too strict. The Atlanta Journal-Constitution, Georgia. April 28, p. 1JQ.
Winter, M., D.H. Johnson, J.A. Shaffer, and T.M. Donovan, and W.D. Svedarsky. 2006. Patch size and landscape effects on density and nesting success of grassland birds. Journal of Wildlife Management 70 (1): 158-172.
Whyte, W.H. 1964. Cluster Development. American Conservation Association, New York.
Yahner, R.H. 1988. Changes in wildlife communities near edges. Conservation Biology 2 (4) 333-339.

91
APPENDICES
Appendix A: Development plat for Bridgemill Unit 4G, Cherokee County, GA.
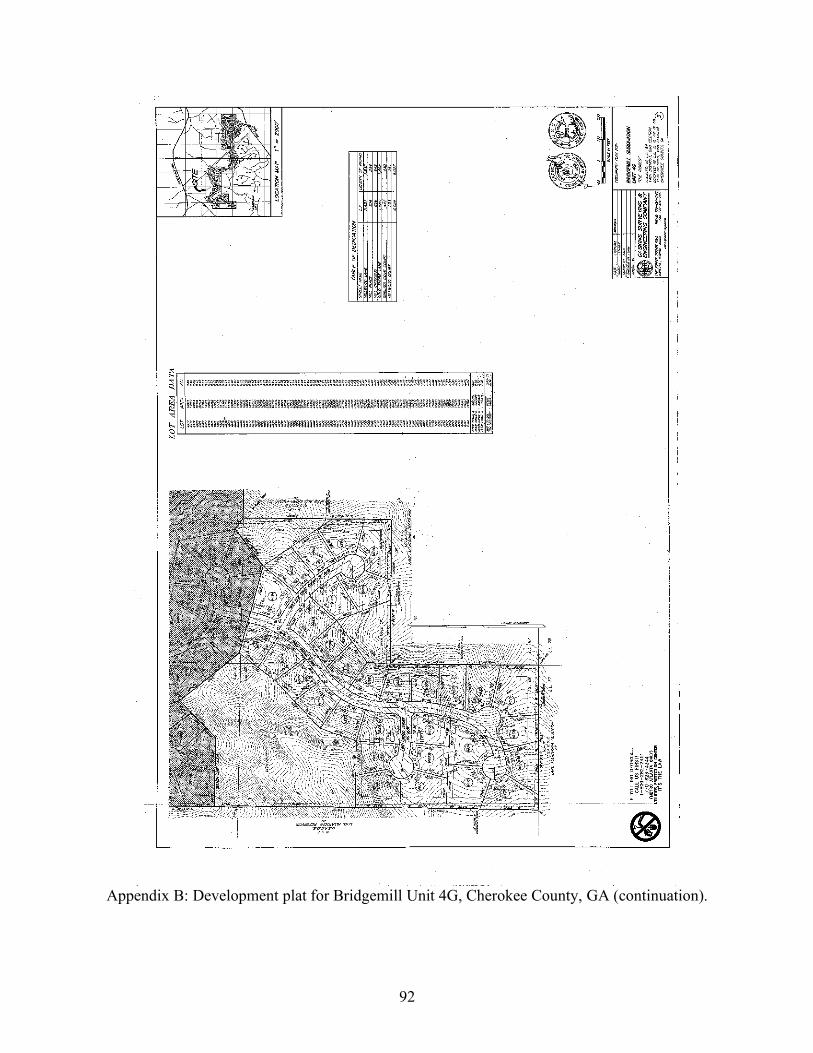
92
Appendix B: Development plat for Bridgemill Unit 4G, Cherokee County, GA (continuation).

93
Appendix C: Development plat for Forest Creek, Cherokee County, GA.

94
Appendix D: Development plat for Governor’s Preserve Unit 4, Cherokee County, GA.

95
Appendix E: Development plat for Hearthstone Unit 2, Cherokee County, GA.

96
Appendix F: Development plat for Heritage Oaks, Cherokee County, GA.

97
Appendix G: Development plat for Laurel Trace, Cherokee County, GA.

98
Appendix H: Development plat for Pebblebrook (f.k.a. Ridgewood), Cherokee County, GA.

99
Appendix I: Development plat for Smithwick Crossing, Cherokee County, GA.

100
Appendix J: Development plat for Sweetbriar, Cherokee County, GA.

101
Appendix K: Development plat for Wolf Creek Park, Cherokee County, GA.

102
Appendix L: Development plat for Santa Maria, Cusco, Peru.