Natural Dynamics: understanding natural dynamics of ...
55
Natural Dynamics: understanding natural dynamics of seagrasses of the north west of Western Australia Mat Vanderklift 1,4 , Douglas Bearham 1,4 , Mick Haywood 2,4 , Hector Lozano-Montes 1,4 , Roisin McCallum 3,4 , James McLaughlin 1,4 , Kathryn McMahon 3,4 , Nick Mortimer 1,4 and Paul Lavery 3,4 1 CSIRO Marine and Atmospheric Research, Floreat, Western Australia, Australia 2 CSIRO Marine and Atmospheric Research, Brisbane, Queensland, Australia 3 Edith Cowan University, Joondalup, Western Australia 4 Western Australian Marine Science Institution, Perth, Western Australia, Australia WAMSI Dredging Science Node Report Theme 5 |Project 5.3 January 2017
Transcript of Natural Dynamics: understanding natural dynamics of ...

Natural Dynamics: understanding natural dynamics of seagrasses of the north west of Western Australia Mat Vanderklift1,4, Douglas Bearham1,4, Mick Haywood2,4, Hector Lozano-Montes1,4, Roisin McCallum3,4, James McLaughlin1,4, Kathryn McMahon3,4, Nick Mortimer1,4 and Paul Lavery3,4 1 CSIRO Marine and Atmospheric Research, Floreat, Western Australia, Australia 2 CSIRO Marine and Atmospheric Research, Brisbane, Queensland, Australia 3 Edith Cowan University, Joondalup, Western Australia 4 Western Australian Marine Science Institution, Perth, Western Australia, Australia
WAMSI Dredging Science Node Report
Theme 5 |Project 5.3 January 2017

WAMSI Dredging Science Node
The WAMSI Dredging Science Node is a strategic research initiative that evolved in response to uncertainties in the environmental impact assessment and management of large-scale dredging operations and coastal infrastructure developments. Its goal is to enhance capacity within government and the private sector to predict and manage the environmental impacts of dredging in Western Australia, delivered through a combination of reviews, field studies, laboratory experimentation, relationship testing and development of standardised protocols and guidance for impact prediction, monitoring and management.
Ownership of Intellectual property rights
Unless otherwise noted, any intellectual property rights in this publication are owned by the Western Australian Marine Science Institution, the Commonwealth Scientific & Industrial Research Organisation (CSIRO) and Edith Cowan University.
Copyright
© Western Australian Marine Science Institution
All rights reserved.
Unless otherwise noted, all material in this publication is provided under a Creative Commons Attribution 3.0 Australia Licence. (http://creativecommons.org/licenses/by/3.0/au/deed.en)
Funding Sources
The $20million Dredging Science Node is delivering one of the largest single issue environmental research programs in Australia. This applied research is funded by Woodside Energy, Chevron Australia, BHP Billiton and the WAMSI Partners and designed to provide a significant and meaningful improvement in the certainty around the effects, and management, of dredging operations in Western Australia. Although focussed on port and coastal development in Western Australia, the outputs will also be broadly applicable across Australia and globally.
This remarkable collaboration between industry, government and research extends beyond the classical funder-provider model. End-users of science in regulator and conservation agencies, and consultant and industry groups are actively involved in the governance of the node, to ensure ongoing focus on applicable science and converting the outputs into fit-for-purpose and usable products. The governance structure includes clear delineation between end-user focussed scoping and the arms-length research activity to ensure it is independent, unbiased and defensible.
And critically, the trusted across-sector collaboration developed through the WAMSI model has allowed the sharing of hundreds of millions of dollars worth of environmental monitoring data, much of it collected by environmental consultants on behalf of industry. By providing access to this usually confidential data, the Industry Partners are substantially enhancing WAMSI researchers’ ability to determine the real-world impacts of dredging projects, and how they can best be managed. Rio Tinto's voluntary data contribution is particularly noteworthy, as it is not one of the funding contributors to the Node.
Funding and critical data Critical data

Legal Notice
The Western Australian Marine Science Institution advises that the information contained in this publication comprises general statements based on scientific research. The reader is advised and needs to be aware that such information may be incomplete or unable to be used in any specific situation. This information should therefore not solely be relied on when making commercial or other decision. WAMSI and its partner organisations take no responsibility for the outcome of decisions based on information contained in this, or related, publications.
Year of publication: 2017
Metadata: http://catalogue.aodn.org.au/geonetwork/srv/eng/metadata.show?uuid=0224a83a-6cc9-4b3f-e053-08114f8ce23d
Citation: Vanderklift M, Bearham D, Haywood M, Lozano-Montes H, McCallum R, Mc Laughlin J, McMahon K, Mortimer N and Lavery P (2017) Natural dynamics: understanding natural dynamics of seagrasses of the north west of Western Australia. Report of Theme 5 - Project 5.3 prepared for the Dredging Science Node, Western Australian Marine Science Institution, Perth, Western Australia, 55 pp.
Author Contributions: MV, PL, KM and MH conceived the study, analysed the data and wrote the report. DB, HL-M, JM, RM, NM, KM and PL collected and analysed data. All authors read and approved the final manuscript.
Corresponding author and Institution: Mat Vanderklift (CSIRO Oceans & Atmosphere, Perth, WA, Australia). Email: [email protected]
Competing Interests: The commercial investors and data providers had no role in the data analysis, data interpretation, the decision to publish or in the preparation of the manuscript. The authors have declared that no competing interests exists.
Acknowledgements: The authors acknowledge the assistance of Paul Armstrong, Kevin Crane, Ben Kelly, Udhi Hernawan, Marta Sánchez and Simone Strydom during the field surveys, Jim Greenwood for a constructive review and Jo Myers for help with preparation of the report.
Dr Ray Masini, Dr Ross Jones and Kevin Crane (WAMSI Dredging Science Node, Node Leadership Team) for their advice and assistance during the project and the preparation of this report.
Collection permits/ethics approval: No collection occurred in the production of this report.
Front cover images (L-R)
Image 1: Trailing Suction Hopper Dredge Gateway in operation during the Fremantle Port Inner Harbour and Channel Deepening Project. (Source: OEPA)
Image 2: Halophila spinulosa has large fleshy rhizomes which contain abundant starch reserves. These plants are an important food resource for both dugongs and turtles. (Source: Kathryn McMahon)
Image 3: Dredge plume at Barrow Island. Image produced with data from the Japan Aerospace Exploration Agency (JAXA) Advanced Land Observing Satellite (ALOS) taken on 29 August 2010.
Image 4: Halophila ovalis meadow at Thevenard Is, Pilbara Region. (Source: Kathryn McMahon)

Dredging Science Node | Theme 5 | Project 5.3
Contents EXECUTIVE SUMMARY ...................................................................................................................................... I
CONSIDERATIONS FOR PREDICTING AND MANAGING THE IMPACTS OF DREDGING ........................................ II
RESIDUAL KNOWLEDGE GAPS .......................................................................................................................... V
1 INTRODUCTION ....................................................................................................................................... 1
2 MATERIALS AND METHODS ..................................................................................................................... 1
2.1 SURVEY DESIGN AND DATA COLLECTION............................................................................................................1 2.1.1 Seagrass percentage cover ...............................................................................................................3 2.1.2 Seagrass biomass .............................................................................................................................4 2.1.3 Stable isotope ratios .........................................................................................................................4 2.1.4 Seagrass seeds ..................................................................................................................................5 2.1.5 Sediment grain size ...........................................................................................................................5 2.1.6 Photosynthetic photon flux density, conductivity and temperature.................................................5 2.1.7 Water Quality ...................................................................................................................................6
3 RESULTS ................................................................................................................................................... 6
3.1 SEAGRASS DISTRIBUTION ...............................................................................................................................6 3.2 PILBARA-WIDE SURVEYS ................................................................................................................................6 3.3 SEAGRASS PERCENTAGE COVER .......................................................................................................................9 3.4 BIOMASS .................................................................................................................................................11 3.5 SHOOT CHARACTERISTICS ............................................................................................................................14
3.5.1 Halophila ovalis ..............................................................................................................................14 3.5.2 Halophila spinulosa ........................................................................................................................14 3.5.3 Halodule uninervis ..........................................................................................................................14 3.5.4 Cymodocea angustata ....................................................................................................................14 3.5.5 Thalassia hemprichii .......................................................................................................................15
3.6 FLOWERS .................................................................................................................................................20 3.7 SEEDS ......................................................................................................................................................22 3.8 STABLE ISOTOPE RATIOS ..............................................................................................................................22 3.9 LIGHT INTENSITY ........................................................................................................................................26 3.10 SEDIMENT GRAIN SIZE AND LOSS ON IGNITION (LOI) ........................................................................................27
4 DISCUSSION AND CONCLUSIONS ........................................................................................................... 33
4.1 ABUNDANCE .............................................................................................................................................35 4.2 REPRODUCTION .........................................................................................................................................38 4.3 LIGHT ......................................................................................................................................................40
5 CONCLUSIONS ........................................................................................................................................ 40
6 REFERENCES ........................................................................................................................................... 41

Dredging Science Node | Theme 5 | Project 5.3

Natural Dynamics: understanding natural dynamics of seagrasses of the north west of Western Australia
Dredging Science Node | Theme 5 | Project 5.3 i
Executive Summary
Relatively little is known of the spatial and temporal dynamics of seagrass meadows in the north west of Western Australia, but such knowledge is needed when designing and evaluating studies that aim to detect potential dredging-related impacts on seagrass, and when making predictions about the likelihood of, and speed of recovery from, such impacts. This study was undertaken to improve our understanding of the spatial and temporal patterns in seagrass composition, abundance and reproductive phenology in the Pilbara. We also characterised key environmental parameters, especially light, that influence seagrass survival and can be altered by dredging.
From August 2013 to March 2015 (18 months), surveys of seagrass abundance were undertaken in the Exmouth Gulf region. The locations surveyed (South Muiron Island, Bundegi and Exmouth Gulf) encompassed a range in water clarity from clear to turbid. Less frequent surveys were undertaken at other locations in the Pilbara: Thevenard Island, Rosemary Island and Balla. Measurements of seagrass abundance were also obtained from monitoring conducted as part of the dredging and dredge-spoil management plan for Chevron Australia’s Wheatstone Liquefied Natural Gas (LNG) Project (Chevron, 2014).
We found that the abundance and composition of seagrass in the region is dynamic and highly variable. Seven species were recorded during the surveys: Halodule uninervis, Halophila ovalis, Halophila spinulosa, Thalassia hemprichii, Syringodium isoetifolium, Cymodocea angustata and Thalassodendron ciliatum. H. ovalis was the most ubiquitous species, occurring at all locations. Exmouth Gulf had the highest species richness (five species), and the lowest species richness (two species) was recorded at South Muiron Island, Bundegi and Thevenard Island.
Patterns in abundance of seagrass, measured as percentage cover, were extremely variable, and two main patterns were apparent. First, the pattern of intra-annual variation in total percentage cover (i.e. of all seagrasses combined) varied among locations. Bundegi and Exmouth Gulf had similar trends in cover, which tended to be highest in late summer (Exmouth Gulf: 57.0% ± 1.67, Bundegi: 25.3% ± 3.05) and lowest in winter, while at South Muiron Island cover remained low during the study, peaking in December 2014 at 9.44% (± 2.71). Second, different species displayed different patterns of temporal variation in abundance. At Bundegi, H. ovalis was dominant and followed a regular pattern in which highest cover was recorded in February. In contrast, at Exmouth Gulf, the cover of H. ovalis was highest in November 2013 and February 2014 and then declined, while the cover of H. spinulosa increased from November 2013 to March 2015, when it was the most abundant species present. At South Muiron Island, the cover of H. ovalis increased monotonically until November 2014 and then declined. At Thevenard Island, cover was highest in December 2014 (23.7% ± 3.27) then was entirely absent in June 2015 — after the passage of Tropical Cyclone Olwyn (March 2015). Seagrass cover at Rosemary Island (69.2 ± 0.14%) and Balla Balla (17.7 ± 3.11%) was within the range observed at other locations.
Percentage cover of seagrass obtained by monitoring conducted as part of the dredging and dredge-spoil management plan for Chevron Australia’s Wheatstone LNG Project tended to be lower than the locations we surveyed — from 0 to 3.45% — and was generally highest during December 2012.
The results indicate that there is no consistent pattern in the species composition of seagrass through the Pilbara, or in the temporal patterns of abundance. However, where a regular pattern was observed at a location (at Exmouth Gulf and Bundegi), total seagrass cover was highest in summer and lowest in winter.
Flowering was recorded for three species: H. ovalis, H. spinulosa, and S. isoetifolium. Flowers were observed mainly in November but also in February, though not for every species in every year, and only at some places. H. ovalis fruits and H. uninervis seeds were present, but in very low abundances, and were not recorded at every site. Flowering does not occur at all places each year and the abundance of seeds in the sediment is generally very low, so recovery via recruitment from seed cannot be assumed (see also Vanderklift et al. 2016).
Light intensity (as photosynthetic photon flux density – PPFD) near the seafloor was highest at Bundegi and South Muiron Island, and lowest at Exmouth Gulf. At all sites the highest light intensities occurred in summer

Natural Dynamics: understanding natural dynamics of seagrasses of the north west of Western Australia
ii Dredging Science Node | Theme 5 | Project 5.3
(December) and lowest light intensities occurred in winter (June). At all locations there were few days when light intensity failed to exceed thresholds considered necessary to maintain maximum rates of photosynthesis (<1% of days at Bundegi and South Muiron Island and < 6% of days at Exmouth Gulf).
The most common species of seagrasses in this region have colonising or opportunistic life histories, but do not exhibit the same patterns of spatial or temporal variation in abundance and reproduction at all places where they occur. We recommend that seagrass surveys (both prior to any development and during dredging monitoring) should be designed to ensure that the sites that are surveyed are as comparable as possible in percentage cover and composition (including reference and dredging sites). Because of the potential for significant temporal variability within sites, the selection of sites should be based on contemporary field-based reconnaissance surveys, not historical maps or records of seagrass presence. Those pre-development surveys should be repeated on several occasions, preferably over more than one year, to increase the likelihood of capturing intra- and inter-annual variability in seagrass composition and abundance.
The project has provided a set of baseline light intensities (PPFD) that characterise sites supporting seagrass assemblages in the region. The observed light intensities exceeded the likely requirements to saturate photosynthesis for almost all days outside of winter, which is consistent with the presence of seagrasses at these sites throughout the year. The low light intensities known to induce adverse physiological and growth responses in H. uninervis, H. ovalis and C. angustata under laboratory conditions rarely occurred at our study locations.
Considerations for predicting and managing the impacts of dredging
The key overall finding of this study is that the temporal dynamics of Pilbara seagrass meadows are likely to be less predictable than those in adjacent regions — the Kimberley and the Gascoyne. The arid tropical environment of the Pilbara is defined by episodic weather events of high intensity (e.g. tropical cyclones) and highly variable environmental conditions. Given these conditions, it is not surprising that the species composition and abundance of seagrasses are also highly variable. Consequently, it is important to recognise that natural spatial and temporal variability, likely responses to dredging, and opportunities for environmental windows (i.e. times of the year or particular sites where key species or ecological communities or critical processes may be particularly vulnerable to pressures from dredging) in the Pilbara and the Kimberley are likely to be different and the seagrasses in these regions should not be viewed as a single ‘northern’ seagrass assemblage.
In Western Australia, the Technical Guidance: Environmental Impact Assessment of Marine Dredging Proposals (EPA 2016) is used to guide prediction and management of the impacts of dredging. A similar framework is applied (in modified forms) elsewhere in Australia. The framework has three phases which benefit from information on biological components of marine ecosystems: a Pre-development phase, which includes surveys and studies to describe the system in which dredging might occur; an Impact Assessment phase, in which predictions are made about dredging-generated pressure fields and the spatial extent, severity and duration of potential effects on sensitive components of the environment, and during which monitoring and management plans are developed; and finally a Post-approval phase, in which monitoring programs are implemented at potentially impacted and reference sites to inform adaptive management and demonstrate compliance with conditions of approval. Below, we consider the implications of the findings of this project in the context of the various phases of the framework contained in EPA (2016).
Pre-development Surveys
When to conduct surveys
Our findings indicate that the timing of pre-development habitat surveys will influence the likelihood of detecting seagrasses and correctly identifying seagrass habitat. Patterns in species composition, and intra- and inter-annual patterns in seagrass abundance, vary substantially among places in the Pilbara region. This makes it difficult to predict which species will occur at a given location, when they will be there and when they will be most abundant. It is also difficult to identify a single period during the year when pre-development surveys should be undertaken to maximize the probability of detecting seagrass. While this is more critical for transient meadows, conclusions

Natural Dynamics: understanding natural dynamics of seagrasses of the north west of Western Australia
Dredging Science Node | Theme 5 | Project 5.3 iii
are the same for enduring meadows, because percentage cover and biomass can be extremely low, making detection of seagrass difficult, especially when relying on remotely-captured video or photos. Even places in close proximity (hundreds of metres to tens of kilometres) can host different species composition and phenology. We recommend that pre-development surveys focus on identifying areas with similar species composition and abundance — preferably on several (at least two) occasions. Despite the high variability, however, the likelihood of detecting seagrass is highest at most places if surveys are undertaken between November and February. Where there are regular intra-annual patterns of higher and lower abundance, the period from November to February appears to be when seagrasses have the highest cover. This is also the time of year when plants are likely to reproduce and surveys during this period will increase the chances of detecting flowers and fruits.
Pilot surveys
Our recommended approach is likely to involve significant effort and resources, so we also recommend pilot surveys encompassing a wider area using rapid assessment methods to identify suitable locations for pre-development surveys. Pilot surveys could take advantage of existing information to help identify potential locations. For example, we found no seagrass at Exmouth Gulf when we first visited the area. However, earlier published and unpublished data suggested that the area previously supported substantial seagrass meadows, and that these meadows had previously recovered from extreme reductions in abundance. A subsequent visit confirmed that seagrass was recolonising the area, and surveys over the next 18 months demonstrated a substantial increase in seagrass abundance. In the absence of information on seagrasses, information on presence of large herbivores known to feed on seagrass (e.g. dugong) or predictive habitat modelling might help identify potential sites. Based on our experience during this study, we recommend that places where seagrass abundance has been reduced by cyclone activity are not used as reference sites for at least 6 to12 months; the absence of seagrass at those sites probably does not reflect the long-term condition.
Accounting for cyclones and other natural disturbances
Even at places where there appear to be predictable patterns in species composition and abundance of seagrass, stochastic events can strongly influence seagrass dynamics over longer (2 to 5 years) periods. The design of pre-development surveys should take into account known history of the area, particularly major disturbances such as cyclones. For example, our data suggest that cyclone-affected places can host little or no visible seagrass for a few months after the cyclone has passed, but can develop a more diverse and abundant seagrass assemblage over several years. The initial survey in a pre-development survey will potentially establish the baseline condition for future monitoring comparisons. Therefore, we recommend that when selecting reference sites, any disturbance history, and its potential to have influenced seagrass condition, is taken into account. The temporal dynamics in abundance following disturbance is context-specific, so we do not make specific recommendations about how long after disturbance is appropriate, but quantifying the initial conditions and following subsequent trajectories will allow more meaningful comparisons with areas potentially impacted by dredging.
Survey methods
Even when seagrass is present it can be difficult to detect if inappropriate methods are used. This is due to a combination of low biomass, sparse cover, small leaf size, presence of fine sediment on leaves, and low water clarity. Photographs allowed us to detect seagrass, but the images had to be taken very close to the seafloor (within 1 m) to allow identification of the smaller forms of many species. Visual observations by divers, gently clearing the surface sediments was often required to definitively confirm the presence of seagrass. Based on the experience gained in this project, we recommend that satellite or airborne remote-sensing methods are unlikely to be useful tools for mapping or monitoring the distribution of seagrasses in the Pilbara region. Similarly, images from remotely-deployed videos or cameras might not detect seagrass at some places and there is a higher probability of detection using scientific divers or from analysis of diver-captured still photographs.

Natural Dynamics: understanding natural dynamics of seagrasses of the north west of Western Australia
iv Dredging Science Node | Theme 5 | Project 5.3
Measure light intensity
Our study has provided the first comprehensive characterisation of the light intensities experienced by seagrasses in areas of the Pilbara not affected by dredging. Other studies within the WAMSI Dredging Science Node (DSN) are determining tolerances of Pilbara seagrasses to light reduction in laboratory studies (Statton et al. 2017a, Statton et al. 2017b, Statton et al. 2017c). There is concordance between the thresholds of light intensity that the laboratory studies indicate limit seagrass growth and the light intensities measured in our surveys. Although light intensity varied among locations, intensities rarely fell below thresholds known to cause sub-lethal impacts on three seagrass species from the region (H. uninervis, H. ovalis and Cymodocea serrulata). Obtaining continuous measurements of light intensity during a year prior to dredging would provide baseline information on the light intensities typically experienced by seagrasses.
Impact Assessment
Predictions of recovery
Our surveys found that seeds were not abundant, implying that recovery from a seed bank cannot be assumed; recovery might be primarily via rhizome extension (this prediction was supported by the results of experimental clearances, see Vanderklift et al. 2016). We recommend that predictions about recovery do not assume rapid recovery from seed banks. At times this assumption has been used to justify the exclusion of seagrasses from assessments. Although observations indicate that seagrasses can recover after substantial reductions in abundance caused by cyclones, we found no evidence of persistent seed banks and the mechanisms of recovery remain unclear.
Environmental windows
The consistency in the timing, but not frequency, of flowering indicates that there is a potential environmental window when dredging could occur, but that this may vary from year to year, and so is difficult to predict. Through carefully-designed pre-development surveys it would be possible to confirm whether flowers, fruits and seeds are produced at predictable times of year in locations that might be affected by dredging (our results indicate that this is most likely to occur in late spring-summer). If so, consideration could be given to scheduling dredging at other times of year (or at other locations) to avoid stressing seagrass communities at the time of seed development.
Post-Approval
Selection of reference sites
Most of the variance in percentage cover of seagrass was due to differences among locations, which were separated by tens of kilometres and which all experienced different light intensities at the seafloor. Earlier studies (McMahon et al. 2017a – WAMSI DSN Project 5.1.1) showed that — in the absence of dredging — wind speed and prevailing wind direction influenced light intensity, which is known to influence seagrass abundance. Based on the findings in this and the previous study (McMahon et al. 2017a – WAMSI DSN Project 5.1.1), we recommend that reference sites should, if possible, be located within 20 kilometres of sites potentially affected by dredging activity. Reference sites should be as similar as possible to potentially-affected sites in water clarity, fetch, prevailing wind direction, sediment type and water depth (Note: this should not override decisions based on the predicted spatial extent and direction of dredging-induced sediment plumes if those predictions suggest plumes could extend for more than 20 km). In addition, initial surveys should be conducted to confirm that the species composition of seagrasses at potentially-affected and reference site are comparable.

Natural Dynamics: understanding natural dynamics of seagrasses of the north west of Western Australia
Dredging Science Node | Theme 5 | Project 5.3 v
Residual Knowledge Gaps
While this project has significantly increased our understanding of the natural dynamics of seagrasses in the north west of Western Australia, and especially the Pilbara, it has also highlighted a number of enduring knowledge gaps.
Reproductive and Seed Biology
Our presumptions about the timing, frequency and importance of sexual reproduction were not always supported by the findings of this study. It was widely assumed that meadows dominated by colonising species of seagrasses would rely heavily on sexual reproduction (via germination from seeds) for recovery following disturbance. We found no consistency in the timing or the frequency of flowering, and flowers were recorded for only two species. We did not find seeds in the sediment at times of year when it would be reasonable to expect them to be present.
Understanding the mechanisms of reproduction by seagrass is important to management of dredging because:
• it can indicate the likelihood of rapid (within one year) recovery following disturbance and loss of a meadow;
• it can indicate whether connectivity to other populations will be critical for maintenance or recovery of meadows; and
• it can define potential environmental windows where seagrass may be vulnerable to dredging pressures.
Our results highlighted the poor knowledge of how Pilbara seagrasses reproduce and showed that assumptions that mechanisms would be similar to the Kimberley and Gascoyne could not be supported. Although our knowledge has improved, it is based on very limited observations. The findings of this project, together with those of WAMSI DSN Project 5.4 (Vanderklift et al. 2017), indicate that our knowledge is insufficient to confidently predict when and where flowering and seed production will occur, what determines these processes, what determines the abundance and viability of seeds, and what determines successful germination and recruitment of seeds.
Long term monitoring of seagrass
The findings of this study, together with those of earlier studies (Loneragan et al. 2013) suggest that there are regular inter-annual patterns in seagrass composition and abundance at some sites. These appear to be related to extreme disturbance events, such as cyclones. Initial loss of seagrass due to extreme disturbance events, such as cyclones, appears to be followed by complex changes in the abundance of several species over a number of years. The nature of these changes, and the length of time they take, remains poorly understood. Understanding the nature of these changes, and the processes that cause them, is important contextual information for pre-development surveys, impact prediction and post-approval management of dredging. Continued long-term studies would improve this understanding.
Contemporaneous measurements of seagrass abundance and light
This project has produced the first continuous measurements of light intensity at seagrass meadows unaffected by dredging. At some of the sites where we measured light intensity, there were distinct intra-annual patterns in seagrass cover, with lower cover during autumn/winter and higher cover in summer. Together, these data provide an opportunity to compare the abundance and presence of seagrasses with patterns in light intensity, informing knowledge about light thresholds below which seagrasses decline. We measured seagrass abundance less frequently (approximately every three to four months), and so were unable to identify precisely when seagrass abundance declined and increased. However, to more fully understand this requires light intensity and seagrass presence to be measured at comparable frequencies (e.g. continuous for light intensity, and daily or weekly for seagrass presence).

Natural Dynamics: understanding natural dynamics of seagrasses of the north west of Western Australia
vi Dredging Science Node | Theme 5 | Project 5.3
Grazer-seagrass interactions
Our findings revealed spatial patterns in the phenology of seagrasses that might have been influences by consumption of seagrass by herbivores (e.g. Thalassia spp. at South Muiron Island). Herbivory is a potentially significant influence on the composition, abundance and phenology of seagrasses in the Pilbara, and might be a significant additional pressure at places where seagrasses also experience dredging-related pressures. Yet we have almost no understanding of how multiple stressors act on seagrasses, and in particular how herbivory interacts with light reduction or increased sedimentation. Similarly, one potential cause of the low abundance of seeds we observed is consumption. We suggest that knowledge of Pilbara seagrasses would benefit from greater understanding of the role that herbivores play in determining the abundance and phenology of seagrass and their seeds.
Deeper seagrass meadows
Our study focussed almost exclusively on relatively shallow water seagrass meadows (≤ 6 m). The only deeper meadows were those surveyed as part of the Wheatstone LNG Project — those meadows had lower cover than most of the shallow water meadows. Studies elsewhere (Rasheed et al. 2014, York et al. 2015) have also reported significant differences between deep and shallow meadows in abundance, temporal patterns, and ability to recover from disturbance. Because dredging-related disturbances are likely to extend over spatial extents that encompass both deep and shallow meadows, better understanding of deeper meadows using the same methods used for shallow meadows would provide important contextual information that might help predict impacts of dredging and guide the development of pre-dredging surveys and post-approval monitoring programs.

Natural Dynamics: understanding natural dynamics of seagrasses of the north west of Western Australia
Dredging Science Node | Theme 5 | Project 5.3 1
1 Introduction
Seagrasses provide vital ecosystem services that include provision of food and habitat, stabilisation of sediment, and sequestration of carbon (Constanza et al. 1997, Orth et al. 2006, Lavery et al. 2013). Seagrasses in the north west of Western Australia are diverse, and include more than ten species with a range of life histories, including species with enduring and transitory meadows (see McMahon et al. 2017b – WAMSI DSN Project 5.1.2). Enduring meadows persist over long periods (years to decades or more), although they can vary in species composition and abundance. In contrast, transitory meadows are present for short periods (months), are formed by ephemeral and opportunistic species, and their species composition and abundance can vary considerably.
The main effects of dredging on seagrass are physical removal, burial, and reduction of the light necessary for photosynthesis (Erftemeijer & Lewis 2006). The variation in life histories of seagrasses renders simple predictions about responses to these pressures unfeasible — responses will depend on the life history of the species involved, and whether meadows are enduring or transitory. These features will determine how resistant (i.e. able to withstand disturbance) or resilient (i.e. able to recover after disturbance-induced reductions in abundance) meadows are. As a result, development of robust predictions about the effects of dredging-induced pressures requires knowledge about the identity of species in an area, and temporal patterns in composition and abundance.
In addition, predictions about the rate and magnitude of recovery from disturbance-induced reductions in abundance depend on the mechanisms by which species recover. For seagrasses, there are two main mechanisms: colonisation of unoccupied space through extension of rhizomes from existing plants, and recruitment of new individuals. In the latter case, this can occur through germination from seeds, or attachment of dispersed fragments (McMahon et al. 2014). The potential for recovery from seeds will be determined by the quantity of viable seeds present, which is in turn determined by the numbers of flowers, and the subsequent development and survival of seeds. If flowering is successful and survival of seeds is adequate, a ‘bank’ of dormant seeds can form in the sediment, providing a potential mechanism for recovery via recruitment. In some cases, the same species may form meadows with different characteristics at different sites, which likely leads to differences in the mechanisms of, and potential for, recovery (Rasheed et al. 2014, York et al. 2015).
The most widespread species of seagrasses in the Pilbara are Halophila ovalis and Halodule uninervis, but other species recorded include Halophila spinulosa and Halophila decipiens (typically in deeper waters), Cymodocea serrulata, C. angustata, Syringodium isoetifolium and Thalassia hemprichii (Walker & Prince 1987). McMahon et al. 2017b (WAMSI DSN Project 5.1.2) reviewed the understanding of seagrass ecology in the Pilbara, and highlighted that little is known about the ecology or spatial and temporal patterns of seagrasses in the region. One study (Loneragan et al. 2013) demonstrated the high temporal variability that can occur: they found that little seagrass was present in a large area of Exmouth Gulf in November 1999 (eight months after the passage of a category 5 cyclone), but seagrass was widespread two years later. They also documented a change in species composition across the duration of the study. In a study in the same area five years earlier, McCook et al. (1995) found that seagrass was present but abundance was low, further illustrating the high variability that can occur in the region.
The objectives of this project were therefore to improve our understanding of the spatial and temporal patterns in species composition, abundance and reproductive phenology of seagrasses in the Pilbara, and of key environmental parameters (especially light) that influence seagrass survival and that can be altered by dredging.
2 Materials and Methods
2.1 Survey design and data collection
Surveys were conducted every three months from August 2013 to March 2015 at three locations: South Muiron Island, Bundegi, and Exmouth Gulf (Table 1, Figure 1). At each location, two sites separated by about 200 m were surveyed. In November 2014, the surveys were expanded to include Thevenard Island, approximately 100 km

Natural Dynamics: understanding natural dynamics of seagrasses of the north west of Western Australia
2 Dredging Science Node | Theme 5 | Project 5.3
northeast of Exmouth. Opportunistic surveys at Rosemary Island and Balla Balla during November-December 2013 provided an opportunity to evaluate whether species composition and abundance at places we surveyed regularly were similar to those found elsewhere in the Pilbara. All work was completed in accordance with the Health Safety and Environment (HSE) policies of CSIRO and Edith Cowan University.
Data for seagrass abundance (as percentage cover) were also provided from monitoring conducted as part of the dredging and dredge-spoil management plan for Chevron Australia’s Wheatstone LNG Project (Chevron Australia 2014), including sites in the predicted Zone of Moderate Impact and Zone of Influence (as per EPA 2016). The methods used to collect the data are described in RPS (2011). Briefly, images encompassing approximately 60 x 80 cm were taken every 3 seconds from a camera attached to a frame towed behind a boat travelling at 1.5 to 3 knots. Images were spaced approximately 2 to 3 m apart. The presence or absence of seagrass was recorded for 30 points on each of approximately 12 images per 100 m transect using the free software Photo Grid 1.0.
Table 1: List of the locations and sites surveyed, with their latitude and longitude (decimal degrees).
Location Site Latitude Longitude
South Muiron Island M1 -21.68633 114.33097 M2 -21.68461 114.33186
Exmouth Gulf G1 -22.31613 114.35373 G2 -22.31444 114.35344
Bundegi B1 -21.85084 114.16372 B2 -21.84871 114.16499
Thevenard Island East T1 -21.46212 115.02539 T2 -21.46129 115.02578
Thevenard Island West 1 -21.44983 114.98889 2 -21.44884 114.99092
Balla Balla 1 -20.64498 117.686233 2 -20.6455 117.687567
Rosemary Island 1 -20.45776 116.610594 2 -20.4618 116.609229
During each survey measurements were made in the field, photographs were taken or samples were collected in order to measure the following variables:
• percentage cover of seagrass and other benthos; • above- and below-ground biomass, shoot density, leaf length, leaf width and number of flowers; • density of seagrass seeds; • sediment grain size; • stable isotope ratios (δ13C and δ15N) of seagrass leaf tissue; and • water quality (light, conductivity, temperature, salinity, nutrients, suspended particulate matter and
chlorophyll).

Natural Dynamics: understanding natural dynamics of seagrasses of the north west of Western Australia
Dredging Science Node | Theme 5 | Project 5.3 3
Figure 1. Locations surveyed during the study. Sites surveyed as part of Wheatstone LNG Project monitoring program are shown in the inset. Two sites were sampled in each location, each separated by about 200 m except at Wheatstone where the distance among sites was variable.
2.1.1 Seagrass percentage cover
During each survey at each site, five 50 m transects (haphazardly-spaced and perpendicular to a 50 m baseline which was parallel to the shore) were established. Quadrats (0.25 m2) were photographed at 2 m intervals along each transect. The selection of a 0.25 m2 quadrat facilitated species identification during analysis of the photographs. Photographs were taken directly above the quadrat to minimise parallax error, and included the entire quadrat frame. Each photograph was analysed using TransectMeasure (® SeaGIS) software. The software superimposed a regular grid of 20 dots on the photograph and the operator (R. McCallum) identified the seagrass species (or coarser taxonomic resolution if species could not be distinguished), sediment, epibenthos or macroalgae immediately beneath the dot and noted any bioturbation (Figure 2). The data were stored in an Oracle database and R (R Development Core Team 2014) software was used to extract and analyse the data as percentage cover.

Natural Dynamics: understanding natural dynamics of seagrasses of the north west of Western Australia
4 Dredging Science Node | Theme 5 | Project 5.3
Figure 2. An example screenshot of the TransectMeasure software used to analyse photographs. The image shows a 0.25 m2 metal quadrat with four sub-quadrats placed on a H. ovalis meadow. The 20 red dots are superimposed on one sub-quadrat and the percentage cover of seagrass estimated as the percentage of dots that overlay seagrass.
2.1.2 Seagrass biomass
During each survey at each site, five cores (diameter: 11 cm; area: 95 cm2; depth: 5 cm where possible) were taken within meadows of each of the seagrass species present: T. hemprichii and H. ovalis at South Muiron Island; H. ovalis, C. angustata, H. uninervis and H. spinulosa (from November 2013 onwards) at Exmouth Gulf; H. ovalis and H. uninervis at Bundegi; H. ovalis and H. uninervis at Balla Balla; H. ovalis and H. uninervis at Rosemary Island; and H. ovalis and H. uninervis (December 2013 only) at Thevenard Island. H. ovalis was the only species found at all locations. The core was placed over the selected shoots, making sure that leaves rooted in the circle encompassed by the core were inside the core and those rooted outside the core were outside. The cores were frozen at -20°C.
In the laboratory, the cores were thawed and sediment was washed from the samples. The plant material was separated into leaves, stems, and root-plus-rhizome. After rinsing in freshwater the number of shoots, leaves, flowers and nodes were counted. Leaves were counted for each shoot as well as for the entire core. Epiphytes were scraped off the leaves using a razor blade and put into crucibles. All leaves were placed on waterproof paper with a scale and photographed. Photographs of the leaves were analysed with Image (rsb.info.nih.gov/ij/) software to measure leaf length, width and area. Each sample was divided into below-ground (roots, horizontal rhizomes, vertical rhizomes if appropriate), and above-ground components (sheaths and leaves or petioles and leaves, depending on the species). These were placed in paper bags and dried at 60°C then weighed to five decimal places.
2.1.3 Stable isotope ratios
For each species of seagrass present at a site, five samples of leaf material were collected by hand, and frozen at -20°C. In the laboratory, samples were thawed then dried in an oven at 60°C before being ground into a fine powder using a mixer mill (Retsch MM200, Dusseldorf, Germany) at 25 Hz for one minute. Stable isotope ratios were measured at the West Australian Biogeochemistry Centre using a continuous-flow system consisting of a Delta V Plus mass spectrometer connected with a Thermo Flush elemental analyser. A description of the analytical technique can be found in Skrzypek and Paul (2006). Stable isotope ratios are expressed in ‰ using conventional delta (δ) notation δ X (‰) = [(Rsample/Rstandard)-1] × 1000; where X is δ13C or δ15N, and R is the 15N/14N (nitrogen) or 13C/12C (carbon) ratio in the sample and standards (Vienna PDB equivalent for carbon and the IAEA international standard of atmospheric N2 for nitrogen).

Natural Dynamics: understanding natural dynamics of seagrasses of the north west of Western Australia
Dredging Science Node | Theme 5 | Project 5.3 5
2.1.4 Seagrass seeds
To measure the density of seeds, ten sediment cores (11 cm diameter) were collected, five inside seagrass patches and 5 outside seagrass patches. All ten samples were collected from outside the area encompassed by the photographic transects in November 2013. Each core was taken to a depth of 5 cm or, where the sediment depth was less than 5 cm, to the maximum depth possible. Each core was placed into a calico bag and frozen at -20°C. In the laboratory sediment was thawed and sieved into 1 mm, 0.5 mm and 0.25 mm fractions. The 1 mm fraction was visually assessed for seeds, taking note of the species and number found. Seed presence and counts in the smaller sediment size fractions were assessed using density separation. In this method, sediment was centrifuged in a Ludox solution: because seagrass seeds are a different density than the solution they can be easily separated from the sediment (Burgess 2001, Hammerstrom & Kenworthy 2003). To determine whether the method would detect seeds if they were present, a known number of H. ovalis seeds were placed within sediment known to have no seeds. On average, 90% of the seeds were retrieved, providing confidence that seeds would be found if they were present.
2.1.5 Sediment grain size
During each survey at each site, five cores (2 cm diameter × 5 cm depth) were collected. The samples were frozen at -20°C. In the laboratory, the samples were thawed then dried in an oven at 60°C for at least 48 hours. Grain size was determined by sieving the dried sediment through a standard set of sieves (sizes: 4 mm, 2 mm, 1 mm, 0.5 mm, 0.25 mm, 0.125 mm, 0.063 mm and <0.063 mm). Loss on ignition (LOI) was measured by placing dried sediment in pre-burnt and pre-weighed crucibles. They were weighed again and placed in a furnace at 550°C for four hours. Once cooled, the crucibles were weighed again and organic content was calculated by subtracting the post-burn crucible weight from the pre-burn weight. Crucibles of sugar placed into the furnace were used to assess burn efficiency: all sugar crucibles had 99% burn efficiency. This rate was used to correct Loss of Ignition (LOI) %, by multiplying the LOI% by 1/0.99.
2.1.6 Photosynthetic photon flux density, conductivity and temperature
RBR Concerto submersible conductivity, temperature and depth recorders with a Licor 192SA PPFD sensor (fitted with a Zebra-Tech Hydro-Wiper H) were moored approximately 15 cm above the substrate and programmed to record data every 30 s. During each survey, the loggers were retrieved and the data immediately downloaded via the interface software Ruskin (version 1.10.0). Using the supplied graphical interface of Ruskin, data (conductivity, temperature, pressure, depth, salinity and PPFD) were briefly checked to verify the instrument had worked correctly during the deployment then archived. Each unit was cleaned and batteries replaced. Some errors and gaps in the PPFD data were identified due to the failure of the cleaning wipers or due to severing of the cable due to unknown causes (probably fish bite). The cleaning wipers were reprogrammed to wipe every 45 min, instead of every 30 min, to prolong battery life.
A script (in R software) was developed to remove ‘out of water’ data from the records by detecting the absence of a tide signal from the pressure sensor, which indicated the pressure sensor was immersed. This method does not require an absolute pressure offset, which would have varied over the deployment period. Corrections were also made for the differences in height between the three sensors. Once anomalous data had been tagged and removed, 30 s interval data were averaged over a 15 min period. A script for assessing the quality of the PPFD data was developed to identify days where the sensor did not function correctly by checking that the sensor returned to <5 µmol m-2 s-1 during the night and had a value of >5 µmol m-2 s-1 at some point during the day.
The PPFD data were used to calculate day length using a threshold of 5 µmol m-2 s-1. Once day length was calculated, daily values were determined for the daylight period, specifically, the mean PPFD, mean PPFD 30 minutes either side of solar noon, and the number of hours of PPFD exceeding 50 and 300 µmol m-2 s-1 which correspond to the upper and lower reported values of PPFD required to reach the onset of light-saturated photosynthesis for H. uninervis, i.e. Ek (Bite et al. 2007, Campbell et al. 2007, Collier et al. 2012).

Natural Dynamics: understanding natural dynamics of seagrasses of the north west of Western Australia
6 Dredging Science Node | Theme 5 | Project 5.3
2.1.7 Water Quality
During each survey at each site, surface water samples (10 ml, unfiltered) were collected for analyses of nutrients. Water samples were collected in triplicate and frozen immediately for transport to the laboratory. Analysis was undertaken for dissolved inorganic nutrients, nitrate + nitrite (hereafter nitrate), phosphate and silicate using an AutoAnalyser (Lachat QuickChem 8000 series flow injection) with detection by absorbance at specific wavelengths using the Quikchem Method 31-107-04-1-A, QuikChem Method 31-115-01-1-G and QuikChem Method 31-114-27-1-D respectively. Ammonia was measured with a Shimadzu RF-10Axl Fluorescence detector following Watson et al. (2005). Detection limits were 0.02 µM for all inorganic nutrients with a standard error of < 0.7%.
Additional surface water samples were collected for measurements of chlorophyll a (chl a) and phaeopigment concentrations. For total chl a, a 1 L surface water sample was vacuum-filtered through a Whatman 25mm diameter GF/F filter (nominal pore size of 0.7 µm) in low light conditions on the deck of the boat. The filters were snap frozen in liquid nitrogen then transferred to a -80°C freezer. In the laboratory, pigments were extracted in 90% acetone overnight and measured on a calibrated Turner Designs model 10AU fluorometer following the acidification technique of Parsons et al. (1989).
For measurement of suspended particulate matter concentration (SPM) a known volume of sample water was vacuum-filtered immediately after collection onto a 47-mm diameter Whatman GFF glass fibre filter (nominal pore size of 0.7 µm) that had been pre-dried at 60°C for 48 h and pre-weighed on a Sartorius RC210D analytical balance with an accuracy of 0.01 mg. After filtration the filters were washed with Milli-Q water and stored at -20°C. In the laboratory filters were dried (at 60°C) and weighed (Neukermans et al. 2012).
3 Results
3.1 Seagrass distribution
Six species of seagrass from five genera were recorded within the transects during the surveys: H. uninervis, H. ovalis, H. spinulosa, T. hemprichii, S. isoetifolium and C. angustata. A seventh species (Thalassodendron ciliatum) was observed outside the transects at Bundegi. Only H. ovalis was found at all locations; in contrast C. angustata was found only at Exmouth Gulf and T. hemprichii was found only at South Muiron Island. The highest species richness was recorded at Exmouth Gulf (5 species, only T. hemprichii was not recorded). Two species were recorded from South Muiron Island: H. ovalis and T. hemprichii. At Bundegi two species were recorded, H. ovalis and H. uninervis, although T. ciliatum was seen outside the transects. At Thevenard Island, two species were recorded, H. ovalis (west and east) and H. uninervis (east only).
3.2 Pilbara-wide surveys
Percentage cover of seagrass at Thevenard Island West (13.7 ± 1.69%), Rosemary Island (17.7 ± 3.11%) and Balla Balla (69.2 ± 0.14%) was similar to that observed at the regularly-surveyed sites. However, percentage cover of seagrass at sites surveyed during the Wheatstone monitoring surveyed tended to be lower: at the Wheatstone ‘offshore’ site percentage cover ranged from 0 to 3.45% (± 0.54%) while at the Wheatstone ‘inshore’ site it ranged from 0 to 1.94% (± 1.15%) (Figure 3, Figure 4). Within the Wheatstone zone of moderate impact, percentage cover varied from 0 to 2.62% (± 0.91%) (Figure 3, Figure 4). Percentage cover of seagrass was generally highest during December 2012 at all Wheatstone monitoring sites.
At Thevenard Island East, percentage cover peaked in December 2014 (at 23.7% ± 3.27) but dropped after the passage of Tropical Cyclone (TC) Olwyn to 0% in June 2015 (Figure 4).
Mean total biomass at the Pilbara locations, including Thevenard Island (east: 0.29 ± 0.11 g core-1, west: 0.68 ± 0.58 g core-1), Rosemary Island (0.41 ± 0.10 g core-1) and Balla Balla (0.54 ± 0.07 g core-1) were within the range observed at other locations (Figure 5).

Natural Dynamics: understanding natural dynamics of seagrasses of the north west of Western Australia
Dredging Science Node | Theme 5 | Project 5.3 7
Figure 3. Map indicating geographical coordinates of all locations, indicated by inset plots showing the percentage cover of seagrass at each location. Site abbreviations: ExmthGlf = Exmouth Gulf; Thevenrd = Thevenard Island; WhtsnMd = Wheatstone zone of moderate impact; WhstI-o = Wheatstone zone of influence – offshore; WhtstI-I = Wheatstone zone of influence – inshore.

Natural Dynamics: understanding natural dynamics of seagrasses of the north west of Western Australia
8 Dredging Science Node | Theme 5 | Project 5.3
Figure 4. Patterns in percentage cover of seagrass among locations and surveys. Plots show the mean percentage cover (± SE) of seagrass (all species pooled) observed on photographic transects. Balla Balla and Rosemary Island were surveyed once only. ‘Wheatstone’ data were collected by RPS as part of the marine monitoring program commissioned by Chevron Australia. Data from Exmouth Gulf, Bundegi, South Muiron Island (‘Muiron’), Balla Balla, Rosemary Island and Thevenard Island (‘Thevenard’) represent means calculated from five 25 m transects at each of two sites at each location in each survey. Data from the Wheatstone monitoring sites represent the estimates derived from a single 100 m transect at each location in each survey. Dredging at Wheatstone occurred from 10/4/13 to 12/1/15.

Natural Dynamics: understanding natural dynamics of seagrasses of the north west of Western Australia
Dredging Science Node | Theme 5 | Project 5.3 9
Figure 5. Biomass of seagrass. Data are mean total seagrass biomass (± SE) at each of the locations surveyed, Exmouth Gulf (‘Gulf’), Bundegi, South Muiron Island (‘Muiron Location’), Thevenard West and Thevenard East. The means encompass different survey durations, and therefore different sample sizes, for the different sites, as described in the methods. Thevenard East and West are shown separately as they are at different depths and have potentially different dynamics.
3.3 Seagrass percentage cover
Percentage cover of seagrass was extremely variable among locations and among survey dates, with analyses of variance indicating statistically significant differences among locations, dates and sites (Table 2). Variation among locations accounted for most of the variation (ω2= 73%; Table 2). Variation among transects (the residual term in the analysis) accounted for 8% of the total variation.
Two patterns emerged during the study:
• mean percentage cover and patterns of temporal variation in percentage cover, varied considerably among locations. Similar temporal patterns were observed at two locations (Bundegi and Exmouth Gulf) but a contrasting pattern was observed at the third (South Muiron Island). At both Exmouth Gulf and Bundegi, percentage cover was highest in March 2015 (Exmouth Gulf: 57.0% ± 1.67, Bundegi: 25.3% ± 3.05). At South Muiron Island cover remained low during all surveys, peaking in December 2014 at 9.44% (± 2.71; Figure 6); and
• pattern of temporal variation in the percentage cover of different species at Exmouth Gulf were asynchronous: the highest cover of H. ovalis (31.6% ± 1.53) was recorded in in November 2013 (summer), then it declined to 2.5% (± 0.34) in June 2015 (winter), while cover of H. spinulosa increased from 4.9% (± 1.01) in November 2013 to 37.7% (± 1.59) in March 2015 (Figure 6).

Natural Dynamics: understanding natural dynamics of seagrasses of the north west of Western Australia
10 Dredging Science Node | Theme 5 | Project 5.3
Separate analyses of variance were performed for H. ovalis, H. spinulosa and H. uninervis. Statistically-significant differences among dates and sites were observed for all three species, and variation among locations was also significant for H. spinulosa, but the main source of variation was not consistent among species (Table 3). Variation among transects accounted for the highest proportion of variation for H. ovalis (residual ω2 = 65%), while for H. spinulosa the largest proportion of the overall variation was explained by variation among sites (56%); for H. uninervis differences among locations (59%) accounted for most of the variance. In other words, the species have patchy distributions, but the patchiness is greatest at different spatial scales for each species, from very small scales (tens of metres) in H. ovalis, to medium scales (hundreds of metres) in H. spinulosa, to large scales (tens of kilometres) in H. uninervis.
Table 2. Results of analyses of variance testing for spatial and temporal patterns in percentage cover of seagrass. ω2= relative magnitude of effects. Bold indicates significance at p<0.05. VC = variance components.
Source df MS F P VC ω2 Location 2 21822.65 50.50 <0.001 297.75 0.729
Date 6 979.9243 13.46 <0.001 25.91 0.063 Site 3 432.1274 5.93 <0.001 11.97 0.029
Residual 197 72.74919 72.74 0.178
Table 3. Results of analyses of variance testing for spatial and temporal patterns in percentage cover of each species of seagrass. ω2= relative magnitude of effects. Bold indicates significance at p<0.05. VC = variance components.
Source df MS F P VC ω2
Halophila ovalis
Location 2 1463.79 3.82 0.15 11.30 0.10 Date 6 673.12 9.30 <0.001 17.17 0.15 Site 3 382.75 5.29 0.002 10.35 0.09
Residual 197 72.34 72.34 0.65
Halophila spinulosa
Location 2 8174.86 11.63 0.038 108.61 0.56 Date 6 572.31 12.20 <0.001 15.01 0.08 Site 3 703.05 14.99 <0.001 21.87 0.11
Residual 197 46.91 46.91 0.24
Halodule uninervis
Location 2 1027.02 6.79 0.076 14.23 0.59 Date 6 31.18 7.34 <0.001 0.77 0.03 Site 3 151.31 35.60 <0.001 4.90 0.20
Residual 197 4.25 4.25 0.18

Natural Dynamics: understanding natural dynamics of seagrasses of the north west of Western Australia
Dredging Science Node | Theme 5 | Project 5.3 11
Figure 6. Percentage cover of each of the seagrass species identified on photographic transects at Bundegi, Exmouth Gulf and South Muiron Island (‘Muiron’) from August 2013 to June 2015. The data are means (± SE) of ten transects (five transects at each of two sites within each location). Species not recorded at a location are not plotted.
3.4 Biomass
Total seagrass biomass was highest at Exmouth Gulf (1.6 ± 0.2 g core-1) and lowest at Bundegi (0.23 ± 0.02 g core-1); at South Muiron Island, biomass was intermediate (1.15 ± 0.16 g core-1) (Figure 7). Variation among individual cores accounted for most of the overall variance (residual ω2 = 85%: Table 4). Among location differences explained 13% of the remaining variation and were the only statistically significant result (Table 4).
Variation among individual cores accounted for almost all variation in biomass of H. ovalis, which was the only species collected from all three locations (Table 5). Temporal variation accounted for a trivial and statistically insignificant amount of variation in biomass (Table 5).
Variation among individual cores also accounted for most of the variation for H. spinulosa, which was only found at Exmouth Gulf (residual ω2 = 80%; Table 5), but variation among locations accounted for a statistically significant proportion of variation (21%; Table 5). When surveys began in August 2013, H. spinulosa was not recorded, but biomass increased during the study, except for a decline in August 2014 (Figure 7). The highest biomass occurred in February 2015 (0.78 ± 0.07 g core-1).
A similar result was obtained for H. uninervis, with variation among individual cores accounting for most of the overall variation (residual ω2 = 82%), and variation among locations accounting for a statistically significant proportion of the remaining variation (18%; Table 5). However, unlike H. spinulosa, H. uninervis was present at all three locations. No consistent temporal trends were observed, and this accounted for a minor proportion of overall variation (Table 5, Figure 7).

Natural Dynamics: understanding natural dynamics of seagrasses of the north west of Western Australia
12 Dredging Science Node | Theme 5 | Project 5.3
Table 4. Results of analyses of variance testing for spatial and temporal patterns in total seagrass biomass. ω2 = relative magnitude of effects. Bold indicates significance at p<0.05. VC = variance components.
Source df MS F P VC ω2 Location 2 43.46 22.08 0.016 0.52 0.13
Date 6 7.35 2.16 0.075 0.11 0.03 Site 3 1.97 0.58 0.633 0 0
Residual 30 3.40 3.40 0.85
Table 5. Results of analyses of variance testing for spatial and temporal patterns in biomass for each species of seagrass. ω2
= relative magnitude of effects. Bold indicates significance at p<0.05. VC = variance components.
Source df MS F P VC ω2
Halophila ovalis
Location 2 0.21 1.50 0.358 0.00 0.00 Collection month 6 0.31 1.14 0.366 0.00 0.00
Site 3 0.14 0.52 0.673 0.00 0.00 Residual 30 0.27 0.27 1.02
Halophila spinulosa
Location 2 17.04 316.20 <0.001 0.22 0.21 Collection month 6 1.32 1.54 0.199 0.01 0.01
Site 3 0.05 0.06 0.979 0.00 0.00 Residual 30 0.85 0.85 0.80
Halodule uninervis
Location 2 0.46 641.44 <0.001 0.01 0.18 Collection month 6 0.06 2.11 0.082 0.00 0.03
Site 3 0.00 0.03 0.994 0.00 0.00 Residual 30 0.03 0.03 0.82

Natural Dynamics: understanding natural dynamics of seagrasses of the north west of Western Australia
Dredging Science Node | Theme 5 | Project 5.3 13
Figure 7. The biomass (dry weight, in g per 95 cm2 core, ± SE, n=10) of each species of seagrass. The timing of the May 2014 flood event is indicated for each survey location, Exmouth Gulf (‘Gulf’), Bundegi, South Muiron Island (‘Muiron’), Thevenard West and Thevenard East.

Natural Dynamics: understanding natural dynamics of seagrasses of the north west of Western Australia
14 Dredging Science Node | Theme 5 | Project 5.3
3.5 Shoot characteristics
3.5.1 Halophila ovalis
Exmouth Gulf and Bundegi displayed similar patterns in shoot density of H. ovalis with minima observed in August 2014 (Figure 8) (Exmouth Gulf: 3.5 ± 2.2 shoots core-1; Bundegi: 16.1 ± 11.5 shoots core-1) and maxima in summer (Exmouth Gulf: 20.6 ± 9.43 shoots core-1 in November 2014; Bundegi 54.2 ± 10.6 shoots core-1 in March 2014). At South Muiron Island, shoot density generally increased throughout the study but declined in March 2015. At Thevenard East, shoot density also increased during the surveys, but the duration of surveys at Thevenard East was shorter. At Thevenard West shoot density was 29.8 ± 13.32 shoots core-1 during the single survey conducted, which is within the range observed at other locations.
The number of leaves per shoot was similar at all of the sampling locations throughout the study period.
Similar to patterns observed for biomass and shoot density, leaf area index (LAI) was highest for H. ovalis in summer (February) at Bundegi (0.14 ± 0.04) and Exmouth Gulf (0.11 ± 0.03) (Figure 10). LAI was lowest during winter at Bundegi (November 2014: 0.02 ± 0.01) and Exmouth Gulf (August 2014: 0.05 ± 0.02). A steady increase in LAI was observed at South Muiron Island during the surveys. LAI at Thevenard West (0.21 ± 0.09) and Thevenard East (0.20 ± 0.09 in October 2014; 0.29 ± 0.12 in February 2015) were within the range observed at other locations (Figure 10).
The biomass of epiphytes on H. ovalis ranged from 0.0001 g core-1 (± 0.0015) in November 2014, at Bundegi and South Muiron Island to 0.029 g core-1 (± 0.068) in August 2014 at Bundegi (Figure 11). The biomasses recorded at Exmouth Gulf, Thevenard West and Thevenard East (Figure 11) were within this range.
3.5.2 Halophila spinulosa
The density of H. spinulosa shoots at Exmouth Gulf (the only location where it occurred during our surveys) increased monotonically from absence in August 2013 to almost 13.1 (± 6.2) shoots core-1 in November 2014, before declining to around 8.9 (± 3.9) shoots core-1 in March 2015 (Figure 8). Similarly, the numbers of leaves per shoot increased monotonically during the study, except for a decline in August 2014 (to 17.7 ± 3.92 leaves shoot-1), and was highest in February 2015 (31.5 ± 5.5) leaves shoot-1) (Figure 9).
In contrast, LAI increased until August 2014 (0.9 9± 0.41) before declining to 0.3 (± 0.4) in February 2015 (Figure 10). The biomass of epiphytes on H. spinulosa (Figure 11) followed a similar pattern to LAI, with a maximum in August 2014 (0.03 ± 0.02 g core-1) followed by a decline to 0.01 (± 0.008) g core-1 in February 2015.
3.5.3 Halodule uninervis
The density of H. uninervis shoots at Bundegi initially increased from August 2013 (6.0 ± 1.7 shoots core-1) to May 2014 (8.7 ± 4.8 shoots core-1), then declined to 4.9 (± 2.2) shoots core-1 in August 2014 (after a major flood event), and then increased to February 2015 (7.5 ± 4.3 shoots core-1) (Figure 8). A similar pattern was observed at Exmouth Gulf with an initial increase followed by a decline observed in August 2014 (4.3 ± 2.1 shoots core-1), and then an increase to 11.6 ± 7.4 shoots core-1 in November 2014.
H. uninervis had around two leaves per shoot, with little or no change at any location during the surveys (Figure 9). Similarly, there was little variation in LAI during the study (Figure 10). The temporal trends in biomass of epiphytes were asynchronous, with maximum biomass measured at Exmouth Gulf in November 2014 (0.003 ± 0.003 g core-1) and maximum biomass at Bundegi in February 2015 (0.01 ± 0.01g core-1) (Figure 11).
3.5.4 Cymodocea angustata
C. angustata was only present at Exmouth Gulf, and there was little variation in the biomass over time, with the exception of February 2015, which was higher than other surveys. Shoot density remained relatively constant during the study, ranging from 1.6 ± 0.5 shoots core-1 in November 2014 to 2.5 ± 1.1 shoots core-1 in February 2015 (Figure 8).
The number of leaves per shoot varied little, but was highest in November 2013 (3.8 ± 2.04 leaves shoot-1)

Natural Dynamics: understanding natural dynamics of seagrasses of the north west of Western Australia
Dredging Science Node | Theme 5 | Project 5.3 15
(Figure 9). LAI (Figure 10) was highest in summer (February 2014: 0.15 ± 0.06; February 2015 = 0.08 ± 0.07) and lowest in winter (August 2013: 0.05 ± 0.04; August 2014: 0.04 ± 0.02). Temporal trends in epiphyte biomass were irregular, with highest biomass in November 2013 (0.08 ± 0.12 g core-1) and lowest biomass in August 2014 (0.008 ± 0.01 g core-1) (Figure 11).
3.5.5 Thalassia hemprichii
T. hemprichii was observed only at South Muiron Island. The biomass of T. hemprichii fluctuated irregularly during the survey, possibly due to varying proportions of rhizome within some samples (including February 2014; Figure 7). Shoot density was relatively stable throughout study (at about 5 shoots core-1) although lower densities were recorded in August (2.3 ± 0.9 shoots core-1) and November 2013 (0.8 ± 1.1 shoots core-1; Figure 8).
The number of leaves per shoot also fluctuated irregularly, and were highest in November 2014 (4.5 ± 1.8 leaves shoot-1) and lowest in November 2013 (1.1 ± 1.5 leaves shoot-1) (Figure 9). Similarly, LAI varied irregularly, with a maximum in February 2014 (0.3 ± 0.2 m2 m-1) and a minimum in November 2013 and February 2015 (both 0.1 ± 0.1) (Figure 10). Epiphyte biomass was highest in May 2014 (0.027 ± 0.026 g core-1) and lowest in November 2014 (0.005 ± 0.009 g core-1) (Figure 11).

Natural Dynamics: understanding natural dynamics of seagrasses of the north west of Western Australia
16 Dredging Science Node | Theme 5 | Project 5.3
Figure 8. Density of seagrass shoots. Data are mean (±SE) density of shoots for each species surveyed at each survey location, Exmouth Gulf (‘Gulf’), Bundegi, South Muiron Island (‘Muiron’), Thevenard West and Thevenard East.

Natural Dynamics: understanding natural dynamics of seagrasses of the north west of Western Australia
Dredging Science Node | Theme 5 | Project 5.3 17
Figure 9. Number of leaves per seagrass shoot. Data are mean (±SE) number of leaves per shoot for each species surveyed at each location, Exmouth Gulf (‘Gulf’), Bundegi, South Muiron Island (‘Muiron’), Thevenard West and Thevenard East.

Natural Dynamics: understanding natural dynamics of seagrasses of the north west of Western Australia
18 Dredging Science Node | Theme 5 | Project 5.3
Figure 10. The LAI of seagrass. Data are mean (±SE) LAI for each species surveyed at each location, Exmouth Gulf (‘Gulf’), Bundegi, South Muiron Island (‘Muiron’), Thevenard West and Thevenard East. LAI is the surface area of leaf per m2 of meadow.

Natural Dynamics: understanding natural dynamics of seagrasses of the north west of Western Australia
Dredging Science Node | Theme 5 | Project 5.3 19
Figure 11. The abundance of epiphytic organisms on seagrasses at each survey location, Exmouth Gulf (‘Gulf’), Bundegi, South Muiron Island (‘Muiron’), Thevenard West and Thevenard East. Data are mean (±SE) biomass of epiphytes (g per core) for each species surveyed.

Natural Dynamics: understanding natural dynamics of seagrasses of the north west of Western Australia
20 Dredging Science Node | Theme 5 | Project 5.3
3.6 Flowers
Flowering was observed for three species of seagrass during the study: H. ovalis, H. spinulosa and S. isoetifolium (Figure 12). H. ovalis flowers were observed at all three locations in the Exmouth region (Exmouth Gulf, Bundegi, South Muiron Island), but were not always observed at the same time. At Exmouth Gulf flowers were observed in November 2013 and November 2014 (means = 0.13 and 0.25 flowers node-1 respectively). At Bundegi, flowers were observed in November 2013 (mean = 0.26 flowers node-1) and February 2014 (mean = 0.05 flowers node-1) but not during November 2014. At South Muiron Island, H. ovalis flowers were observed in November 2014 (mean = 0.05 flowers node-1) but not in November 2013. Among locations in the Pilbara, H. ovalis was the only species observed flowering, at Thevenard East in November 2014 (mean = 0.18 flowers node-1) and February 2015 (mean = 0.05 flowers node-1).
H. spinulosa flowers were observed at Exmouth Gulf in November 2014 (mean = 1.5 flowers node-1), as were flowers of S. isoetifolium (mean = 0.2 flowers node-1).
In summary, flowers occurred at different times for different species, and inconsistently among locations and years for each species. Where flowering did occur, it occurred during November or February, suggesting it is likely to occur mainly during summer months.

Natural Dynamics: understanding natural dynamics of seagrasses of the north west of Western Australia
Dredging Science Node | Theme 5 | Project 5.3 21
Figure 12. The intensity and timing of flowering in Pilbara seagrass meadows at each survey location, Exmouth Gulf (‘Gulf’), Bundegi, South Muiron Island (‘Muiron’), Thevenard West and Thevenard East. Data are mean number of flowers per shoot sampled from 2013–2015 (error bars = standard error).

Natural Dynamics: understanding natural dynamics of seagrasses of the north west of Western Australia
22 Dredging Science Node | Theme 5 | Project 5.3
3.7 Seeds
Pilot studies yielded a 90% recovery of seeds from sediment cores using density separation in Ludox, providing confidence that if seeds were present they would be recovered. However, examination of sediment cores for seeds was discontinued after February 2014 due to the extremely low numbers of seeds retrieved (Table 6), combined with the significant time required to process the samples. Halophila fruits were observed at Exmouth Gulf and Halodule seeds were observed at Exmouth Gulf and Bundegi, but only in ≤10% of cores. A larger number of fruits and seeds were observed at Balla Balla, and the proportion of cores in which they were found was also higher, up to 70%. However, all of the Halodule seeds had small holes drilled into them and were hollow, indicating that they had been consumed by invertebrates.
Table 6. The total number of seeds of Halodule uninervis or fruits of Halophila ovalis in sediment cores collected at each site. The number in parentheses indicates the percentage (%) of cores in which seeds were found.
Site Total number Halophila ovalis fruits (n = 10 cores)
Total number Halodule uninervis seeds (n = 10 cores)
Exmouth Gulf G1 1 (10%) 1 (10%) Exmouth Gulf G2 0 1 (10%)
Bundegi B1 0 0 Bundegi B2 0 1(10%)
South Muiron Island M1 0 0 South Muiron Island M2 0 0
Balla Balla 1 15 (50%) 17 (70%)* Balla Balla 2 13 (30%) 1 (10%)*
* All Halodule seeds had small holes drilled into them and were hollow, indicating that they had been consumed by invertebrates.
3.8 Stable isotope ratios
δ13C of the two most ubiquitous species, H. ovalis and H. uninervis, encompassed similar ranges and followed similar temporal patterns, tending to be higher at most places in summer months, and lower in winter months. δ13C of H. spinulosa tended to be lower than H. ovalis and H. uninervis, while δ13C of S. isoetifolium and T. hemprichii tended to be higher, but most species tended to follow broadly similar temporal trends.
δ15N of H. uninervis tended to be slightly lower than H. ovalis, and neither showed temporal patterns that could be clearly interpreted as seasonal increases or decreases (Figure 15). Notably, around 10% of δ15N were negative, and this was particularly pronounced for H. ovalis and H. uninervis (around 10% and 15% of δ15N, respectively). δ15N of H. spinulosa, S. isoetifolium and T. hemprichii were typically within the ranges encompassed by H. ovalis and H. uninervis.
Statistical analyses focussed on H. ovalis and H. uninervis, as these were the most widely-distributed species. To enable balanced analyses, we included only data from locations where collections were made during each survey: Bundegi, Exmouth Gulf and South Muiron Island for H. ovalis, and Bundegi and Exmouth Gulf for H. uninervis. Broad spatial patterns (differences among locations) were important for δ13C of both species, and δ15N of H. ovalis (but not δ15N of H. uninervis) (Table 7). In contrast, differences among sites tended to account for a relatively low proportion of the variability (≤15%), although this was statistically significant in some cases. Temporal trends also tended to account for a lower proportion of the variability (≤21%), and this tended to be statistically significant.
Overall the patterns were consistent with a hypothesis that environmental influences that varied more among locations than between sites determined δ13C and δ15N. The most likely influences are light (for δ13C) and the form of nitrogen available in the sediment (for δ15N).

Natural Dynamics: understanding natural dynamics of seagrasses of the north west of Western Australia
Dredging Science Node | Theme 5 | Project 5.3 23
Figure 13. Isotopic signatures of seagrasses in Pilbara seagrass meadows. Data are mean δ13C and δ15N (± SE) values for each species at each of the sites on each of the dates surveyed.

Natural Dynamics: understanding natural dynamics of seagrasses of the north west of Western Australia
24 Dredging Science Node | Theme 5 | Project 5.3
Figure 14. The carbon isotopic signatures of seagrasses on different sampling dates in Pilbara seagrass meadows. Data are mean δ13C (± SE) for each species at each location, Exmouth Gulf, Bundegi, South Muiron Island (‘Muiron’), Balla Balla, Rosemary Island, Thevenard West and Thevenard East and Thevenard West, on each of the dates surveyed.

Natural Dynamics: understanding natural dynamics of seagrasses of the north west of Western Australia
Dredging Science Node | Theme 5 | Project 5.3 25
Figure 15. The nitrogen isotopic signatures of seagrasses on different sampling dates in Pilbara seagrass meadows. Data are mean δ15N (± SE) for each species at each location, Exmouth Gulf, Bundegi, South Muiron Island (‘Muiron’), Balla Balla, Rosemary Island, Thevenard West and Thevenard East and Thevenard West, on each of the dates surveyed.

Natural Dynamics: understanding natural dynamics of seagrasses of the north west of Western Australia
26 Dredging Science Node | Theme 5 | Project 5.3
Table 7. Results of analyses of variance testing for spatial and temporal patterns in δ13C and δ15N of Halophila ovalis and Halodule uninervis in each individual species. ω2= relative magnitude of effects. Bold indicates significance at p<0.05. VC = variance components.
Source df MS F P VC ω2
δ13C Halophila ovalis
Location 2 37.02 8.9 0.055 0.38 0.29 Collection month 6 10.10 18.5 <0.001 0.27 0.21
Site 3 4.15 7.6 <0.001 0.12 0.09 Residual 114 0.55 0.55 0.41
δ15N Halophila ovalis
Location 2 134.94 42.98 <0.001 1.86 0.42 Collection month 6 4.84 1.92 0.08 0.07 0.01
Site 3 3.14 1.24 0.30 0.02 0.004 Residual 114 2.52 2.52 0.56
δ13C Halodule uninervis
Location 1 126.35 184.94 <0.001 1.74 0.60 Collection month 6 4.14 3.84 <0.001 0.09 0.03
Site 2 0.68 0.63 0.53 -0.01 0 Residual 74 1.08 1.08 0.37
δ15N Halodule uninervis
Location 1 4.35 0.42 0.58 0 0 Collection month 6 12.53 8.87 <0.001 0.32 0.17
Site 2 10.27 7.27 0.001 0.30 0.15 Residual 74 1.41 1.41 0.74
3.9 Light intensity
The PPFD (also referred to as photosynthetically active radiation or PAR) near the seafloor was highest at Bundegi and South Muiron Island, and lowest at Exmouth Gulf (Figure 17). At each site there was a pronounced temporal pattern, with maxima in summer (December) and minima in winter (June): at Exmouth Gulf, summer maxima were lower than other locations, but winter minima were comparable at all sites (Figure 17).
To provide a biologically meaningful reference point for these measurements, the PPFD was compared against reported values for the onset of saturating light intensities for photosynthesis in H. uninervis (Ek). At light intensities above Ek the plants will not be light-limited. For H. uninervis, reported Ek values span a wide range, from approximately 50 to 300 µmol m-2 s-1 (Campbell et al. 2007, Lee et al. 2007, Collier et al. 2012, Ow et al. 2015). At all sites there were some days when the maximum instantaneous measurement of PPFD did not exceed 300 µmol m-2 s-1; this occurred most often in winter and at Exmouth Gulf (30 to 33 days: Figure 18, Table 8). At Bundegi and South Muiron Island, there were 3 to 5 days during the 529 days our study encompassed (i.e. <1% of days) when PPFD did not exceed 300 µmol m-2 s-1 at any time. PPFD always exceeded 50 µmol m-2 s-1 for at least part of the day at Bundegi and South Muiron Island, and failed to reach this level on 0.1% of days at Exmouth Gulf.
Because the range of Ek reported in the literature is large, we also compared the PPFD measurements with light intensities used during experimental shading studies being undertaken as part of WAMSI DSN Project 5.5 (Statton et al. 2017a, Statton et al. 2017b, Statton et al. 2017c). In that project, seagrasses have been subjected to six different light intensities: 21, 13, 9, 5, 2.3 and 0.9 mol m-2 d-1. The seafloor at the three locations for which we have 529 days of continuous measurements each experience proportions of time at these light intensities (Figure 19). At Exmouth Gulf, most measurements were in the range 9–21 mol m-2 d-1, at South Muiron Island most measurements were in the range 21 to 30 mol m-2 d-1, and at Bundegi most measurements were in the range 30 to 40 mol m-2 d-1 (Table 9).
The frequency of consecutive days during which light did not exceed the intensities used in the experiments also varied among locations (Figure 19, Table 9). At Exmouth Gulf, light intensities exceeded 21 mol m-2 d-1 on only 3 of 529 days, compared with 80 and 139 days at Bundegi and South Muiron Island, respectively. Light intensities failed to exceed 13 mol m-2 d-1 at Exmouth Gulf for durations of 1 to 129 consecutive days. Days during light intensity failed to reach which 13 mol m-2 d-1 were less frequent at South Muiron Island and Bundegi (Figure 19)

Natural Dynamics: understanding natural dynamics of seagrasses of the north west of Western Australia
Dredging Science Node | Theme 5 | Project 5.3 27
and tended to persist for only 1 to 3 days. At Exmouth Gulf, light intensity failed to exceed 9 mol m-2 d-1 on 23 occasions; 6 of these lasted for more than 9 days and the longest event lasted for 31 days. There were far fewer occasions when light intensity failed to reach 9 mol m-2 d-1 at Bundegi or South Muiron Island, and when they did occur they persisted for 1 to 4 days. At Exmouth Gulf, light intensities failed to exceed 5 mol m-2 d-1 on 15 occasions (for a total of 25 days or 6% of the time), with all but one persisting for no more than three consecutive days. At Bundegi light intensities only ever fell below 5 mol m-2 d-1 for more than 1 day at a time (on 4 occasions); light intensities almost always exceeded 5 mol m-2 d-1 at South Muiron Island (it failed to do so on a maximum two consecutive days on three separate occasions).
3.10 Sediment grain size and Loss on Ignition (LOI)
Generally, the proportions of sediment in different size classes were similar among locations, and varied little during the survey (Figure 20). Most of the sediment at Bundegi and Exmouth Gulf (~60-80% by dry weight) comprised very fine and fine sand fractions (i.e. between 0.063 and 0.25 mm). At South Muiron Island a larger proportion of sediment was coarser, dominated by fine and medium sands (between 0.125 and 0.5 mm).
The percentage Loss on Ignition (LOI), an indicator of the amount of organic matter in the sediment, tended to be low (Figure 21). Most measurements were between 3 to 5% for each size fraction at Bundegi (64% of location x survey means), Exmouth Gulf (51% of location x survey means) and South Muiron Island (55% of location x survey means). Most of the other measurements yielded LOI less than 2%, indicating a low amount of organic matter in the sediment at all sites.
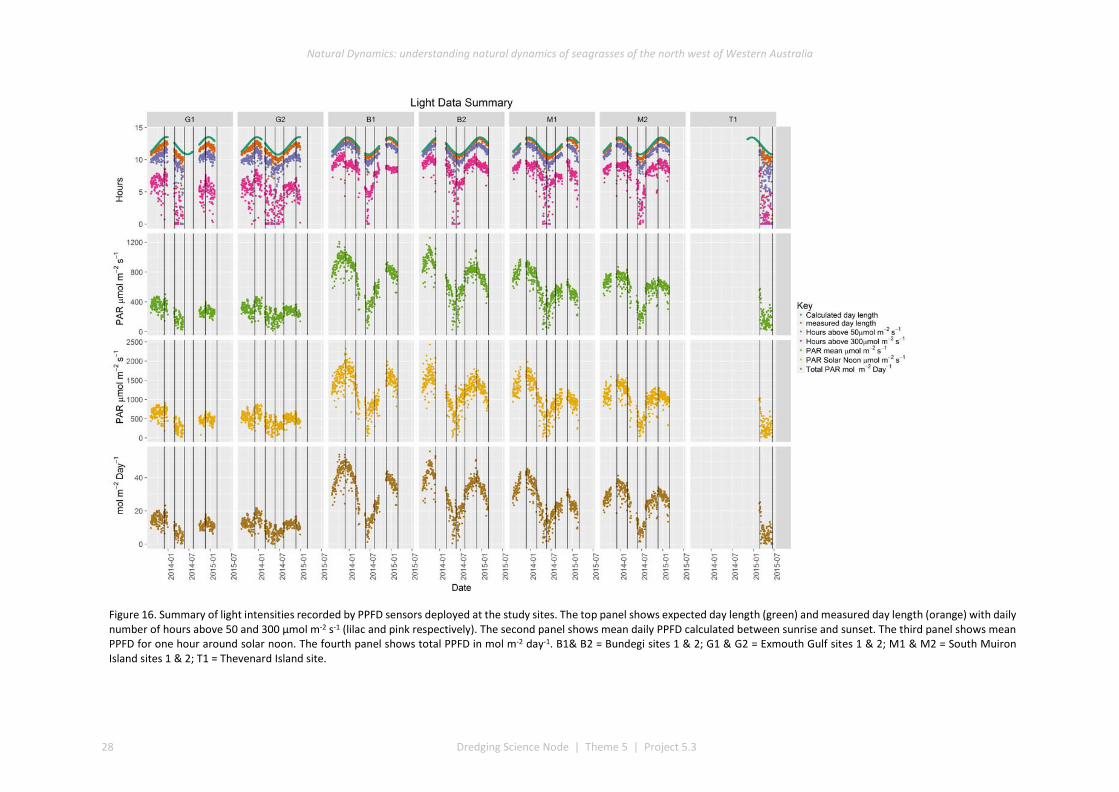
Natural Dynamics: understanding natural dynamics of seagrasses of the north west of Western Australia
28 Dredging Science Node | Theme 5 | Project 5.3
Figure 16. Summary of light intensities recorded by PPFD sensors deployed at the study sites. The top panel shows expected day length (green) and measured day length (orange) with daily number of hours above 50 and 300 µmol m-2 s-1 (lilac and pink respectively). The second panel shows mean daily PPFD calculated between sunrise and sunset. The third panel shows mean PPFD for one hour around solar noon. The fourth panel shows total PPFD in mol m-2 day-1. B1& B2 = Bundegi sites 1 & 2; G1 & G2 = Exmouth Gulf sites 1 & 2; M1 & M2 = South Muiron Island sites 1 & 2; T1 = Thevenard Island site.
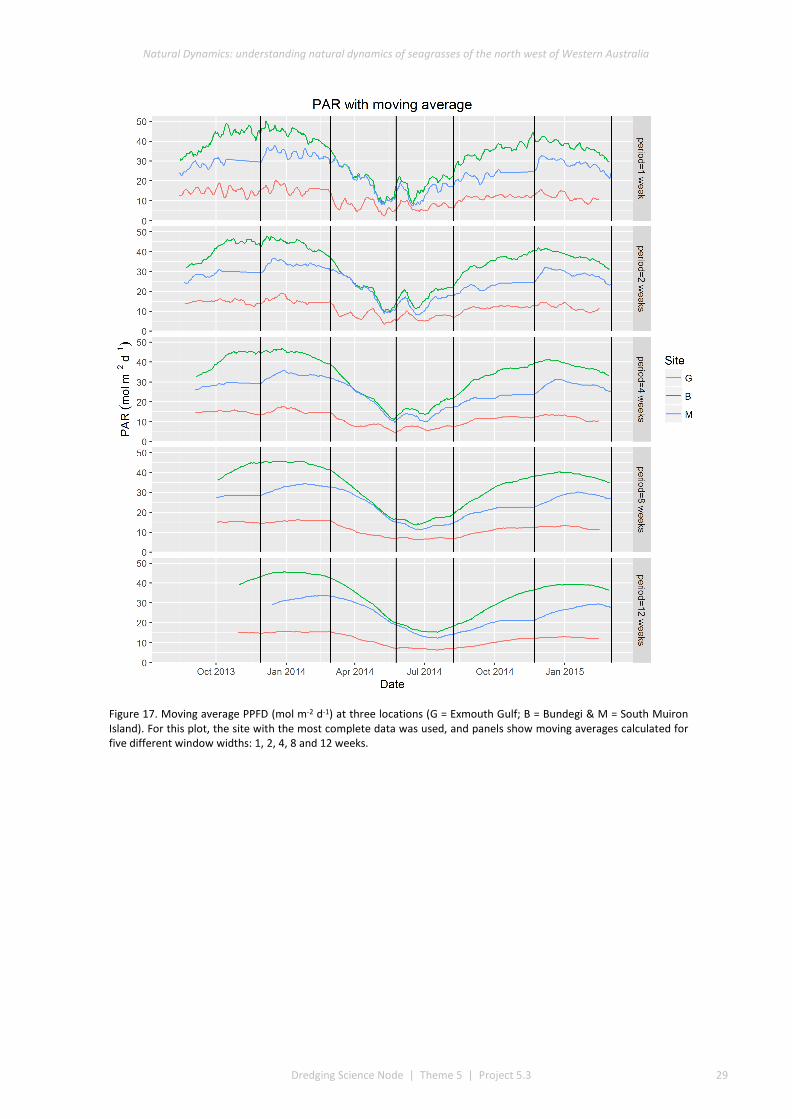
Natural Dynamics: understanding natural dynamics of seagrasses of the north west of Western Australia
Dredging Science Node | Theme 5 | Project 5.3 29
Figure 17. Moving average PPFD (mol m-2 d-1) at three locations (G = Exmouth Gulf; B = Bundegi & M = South Muiron Island). For this plot, the site with the most complete data was used, and panels show moving averages calculated for five different window widths: 1, 2, 4, 8 and 12 weeks.

Natural Dynamics: understanding natural dynamics of seagrasses of the north west of Western Australia
30 Dredging Science Node | Theme 5 | Project 5.3
Figure 18. Proportion of measurements of light intensity 0.5 m above the seafloor at three location in each of eight bin widths of PPFD: 0.9, 2.3, 5, 9, 13, 21, 30, 40, 50 mol m-2 d-1. The bin widths reflect the light intensities used in laboratory experiments in WAMSI DSN Project 5.5 (Statton et al. 2017a, Statton et al. 2017b, Statton et al. 2017c). Data were pooled across the two sites at each location (G = Exmouth Gulf; B = Bundegi & M = South Muiron Island). (Note: that there were no readings in the 0–0.9 bin after excluding measurements recorded during the night).

Natural Dynamics: understanding natural dynamics of seagrasses of the north west of Western Australia
Dredging Science Node | Theme 5 | Project 5.3 31
-
Figure 19. Frequency (count) of instances of consecutive days at each location that were below each of four light intensities: 5, 9, 13, and 21 mol m-2 d-1. The light intensities used reflect those used in laboratory experiments in WAMSI DSN Project 5.5 (Statton et al. 2017a, Statton et al. 2017b, Statton et al. 2017c). Data were pooled across sites at each location (G = Exmouth Gulf; B = Bundegi & M = South Muiron Island).

Natural Dynamics: understanding natural dynamics of seagrasses of the north west of Western Australia
32 Dredging Science Node | Theme 5 | Project 5.3
Table 8. The number of days at each location when instantaneous light intensities (PPFD) exceeded Ek, for Halodule uninervis for 30 min or less. Two values of Ek are used, covering the range reported in the published literature.
Location Site Number of days PPFD > Ek of
300 µmol m-2 s-1 for Number of days PPFD > Ek of
50 µmol m-2 s-1 for <30 min <1 min 0 min <30 min <1 min 0 min
Bundegi B1 6 4 3 0 0 0 B2 7 3 3 1 0 0
Exmouth Gulf G1 38 31 30 2 1 1 G2 52 34 33 2 1 1
South Muiron Island M1 9 5 5 0 0 0 M2 8 3 3 0 0 0
Table 9. Summary statistics of the duration (in consecutive days) at each location when PPFD exceeded one of four light intensities (<5, <9, <13 or <21 mol m-2 d-1), which reflect those used in WAMSI DSN Project 5.5 (Statton et al. 2017a, Statton et al. 2017b, Statton et al. 2017c) experiments testing the effects of light reduction on seagrasses.
Location Daily PPFD (mol m-2 d-1) Min Max Mean Mode Median
Bundegi
21 1 34 7.00 1 2 13 1 6 2.50 1 2 9 1 3 1.66 1 1 5 1 1 1.00 1 1
Exmouth Gulf
21 3 208 131 3 158 13 1 116 7 1 2.5 9 1 31 5.7 1 1 5 1 8 2.1 1 2
South Muiron Isla
21 1 70 7 1 1 13 1 12 4.4 1 2.5 9 1 4 1.8 1 1.5 5 1 2 1.4 1 1
Figure 20. Grain size distribution (as % of dry weight) for sediments surrounding the seagrass communities surveyed during August, November 2013 and May 2014 at survey locations Bundegi, Exmouth Gulf (‘Gulf’) and South Muiron Island (‘Muiron’). LT = Less than; GT = Greater than. The sediments were classified as silt (< 63 µm), very fine sand (63-125 µm), fine sand (125–250 µm), medium sand (250–500 µm) and coarse sand (>500 µm).

Natural Dynamics: understanding natural dynamics of seagrasses of the north west of Western Australia
Dredging Science Node | Theme 5 | Project 5.3 33
Figure 21. Loss of Ignition (used here as an indicator of organic matter) surrounding seagrasses communities surveyed in August, November 2013 and May 2014 at survey locations Bundegi, Exmouth Gulf (Gulf) and South Muiron Island (Muiron).
4 Discussion and Conclusions
The objective of this project was to understand spatial and temporal patterns in abundance, reproductive phenology and selected biological parameters of seagrasses in the Pilbara; we also sought to understand patterns in key environmental parameters (especially light). The surveys encompassed 18 months during 2013 to 2015, and revealed that the abundance and composition of seagrasses in the Pilbara is highly variable. The key findings from the surveys are:
• six species were recorded, and species composition was variable among the locations surveyed. H. ovalis was the most ubiquitous species, occurring at all locations;
• patterns in seagrass abundance (measured as percentage cover of all seagrasses combined) were extremely variable in space and through time: variation among places separated by tens of kilometres was the main source of variation for total seagrass cover. There was a consistent temporal pattern in seagrass cover at two of the three locations (Exmouth Gulf and Bundegi), where highest cover was observed during November to February and lowest cover was observed in July;
• the main sources of variation in percentage cover were not consistent for the three most abundant species (variation was greatest among transects separated by a few metres for H. ovalis, among sites separated by hundreds of metres for H. spinulosa, and among locations for H. uninervis);
• temporal patterns in seagrass cover were asynchronous among species: at Bundegi H. ovalis was the main species present and followed a regular temporal pattern with highest cover recorded in March, at Exmouth Gulf H. ovalis followed a similar temporal pattern to that observed at Bundegi but was replaced by H. spinulosa as the main species present during the survey, and at south Muiron Island the cover of H. ovalis increased monotonically until the penultimate survey (December 2014) after which it declined;
• the more limited data collected from other locations in the Pilbara indicates that the percentage cover of seagrass at the sites surveyed during the Wheatstone Project Dredging and Dredge Spoil Placement Environmental Monitoring and Management Plan, and at Thevenard Island and Balla Balla, were generally

Natural Dynamics: understanding natural dynamics of seagrasses of the north west of Western Australia
34 Dredging Science Node | Theme 5 | Project 5.3
within the range recorded at other locations. The cover recorded at Wheatstone monitoring sites was at the lowest end of the range recorded at the locations we surveyed and lacked the clear temporal patterns that were observed at the locations we surveyed. There was no consistent pattern in the timing of seagrass absence;
• patterns in abundance (measured as biomass) were highly variable, and the main source of variation for all species was variation among individual cores (separated by a few metres);
• flowers of three species were recorded: H. ovalis, H. spinulosa and S. isoetifolium. Flowers were observed in warmer months (mainly in November, but also in February), but not for every species in every year, and only at some places. For H. ovalis the number of flowers per node was relatively high at most sites, > 0.2 flowers shoot-1;
• H. ovalis fruits and H. uninervis seeds were found in sediment cores, but only at three and five of the eight sites respectively. At three sites (including both sites at south Muiron Island) no seeds or fruits were observed. Even where seeds and fruits were present, their abundances tended to be low. The only location where fruits or seeds were observed in a large proportion of cores was Balla Balla (H. uninervis seeds). Few of the seeds recorded were viable;
• light intensities (PPFD) showed a typical temporal pattern with maxima in late spring and minima in early winter, but PPFD varied among locations; PPFD was lower at Exmouth Gulf in summer, but comparable across sites in winter; and
• at all sites, it was rare for PPFD to not reach the estimated half-saturating light intensities for photosynthesis.
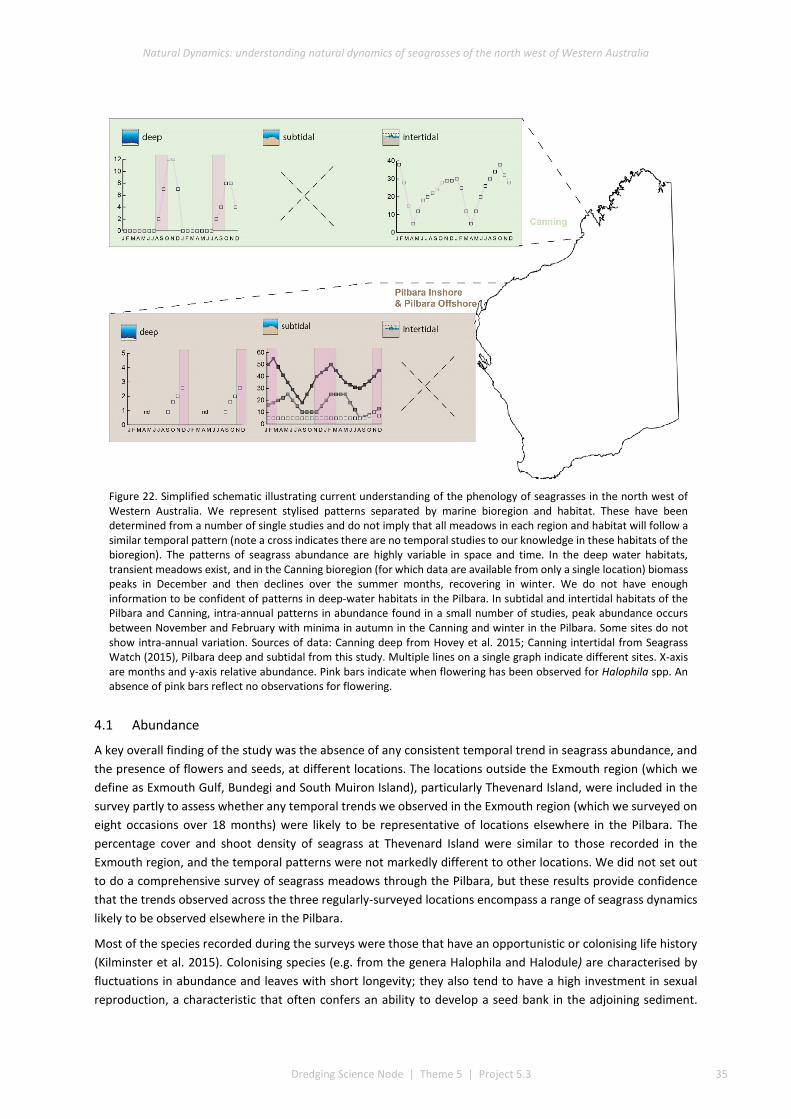
Natural Dynamics: understanding natural dynamics of seagrasses of the north west of Western Australia
Dredging Science Node | Theme 5 | Project 5.3 35
Figure 22. Simplified schematic illustrating current understanding of the phenology of seagrasses in the north west of Western Australia. We represent stylised patterns separated by marine bioregion and habitat. These have been determined from a number of single studies and do not imply that all meadows in each region and habitat will follow a similar temporal pattern (note a cross indicates there are no temporal studies to our knowledge in these habitats of the bioregion). The patterns of seagrass abundance are highly variable in space and time. In the deep water habitats, transient meadows exist, and in the Canning bioregion (for which data are available from only a single location) biomass peaks in December and then declines over the summer months, recovering in winter. We do not have enough information to be confident of patterns in deep-water habitats in the Pilbara. In subtidal and intertidal habitats of the Pilbara and Canning, intra-annual patterns in abundance found in a small number of studies, peak abundance occurs between November and February with minima in autumn in the Canning and winter in the Pilbara. Some sites do not show intra-annual variation. Sources of data: Canning deep from Hovey et al. 2015; Canning intertidal from Seagrass Watch (2015), Pilbara deep and subtidal from this study. Multiple lines on a single graph indicate different sites. X-axis are months and y-axis relative abundance. Pink bars indicate when flowering has been observed for Halophila spp. An absence of pink bars reflect no observations for flowering.
4.1 Abundance
A key overall finding of the study was the absence of any consistent temporal trend in seagrass abundance, and the presence of flowers and seeds, at different locations. The locations outside the Exmouth region (which we define as Exmouth Gulf, Bundegi and South Muiron Island), particularly Thevenard Island, were included in the survey partly to assess whether any temporal trends we observed in the Exmouth region (which we surveyed on eight occasions over 18 months) were likely to be representative of locations elsewhere in the Pilbara. The percentage cover and shoot density of seagrass at Thevenard Island were similar to those recorded in the Exmouth region, and the temporal patterns were not markedly different to other locations. We did not set out to do a comprehensive survey of seagrass meadows through the Pilbara, but these results provide confidence that the trends observed across the three regularly-surveyed locations encompass a range of seagrass dynamics likely to be observed elsewhere in the Pilbara.
Most of the species recorded during the surveys were those that have an opportunistic or colonising life history (Kilminster et al. 2015). Colonising species (e.g. from the genera Halophila and Halodule) are characterised by fluctuations in abundance and leaves with short longevity; they also tend to have a high investment in sexual reproduction, a characteristic that often confers an ability to develop a seed bank in the adjoining sediment.

Natural Dynamics: understanding natural dynamics of seagrasses of the north west of Western Australia
36 Dredging Science Node | Theme 5 | Project 5.3
They tend to have low physiological resistance to disturbance but can recover quickly. In contrast, persistent species (e.g. Thalassia) tend to have lower fluctuations in abundance and leaves with greater longevity; investment in sexual reproduction does not compromise vegetative growth and they do not tend to develop seed banks. They have high physiological resistance but are slower to recover from disturbance. Opportunistic species (e.g. from the genera Syringodium and Cymodocea) are intermediate between colonising and persistent species, and tend to have an ability to colonise, produce seeds or seedlings and also maintain a high biomass. The most widespread species found in our surveys were the colonisers H. ovalis (found at all locations) and H. uninervis (found everywhere except South Muiron Island). The greatest abundances were attained by H. spinulosa — another colonising species — at Exmouth Gulf (where it reached 45% cover). The abundance of H. spinulosa at Exmouth Gulf, which was the deepest location surveyed and with the least PPFD at the seabed, is consistent with observations by other investigators that this species tends to occur in deeper (5 to 15 m) water (McCook et al. 1995, Anderson 1994). We note, however, that H. spinulosa was not recorded at the sites surveyed during the Wheatstone Project Dredging and Dredge Spoil Placement Environmental Monitoring and Management Plan, which were mostly 8 to 15 m deep. Opportunistic species (C. angustata and S. isoetifolium) were only found at Exmouth Gulf. The only persistent species was T. hemprichii, which was recorded in relatively low abundance at South Muiron Island.
Seagrasses form two functional meadow types: transient meadows (in which abundance fluctuates from no seagrass to variable cover) and enduring meadows (in which seagrass is present at all times but abundance and species composition can fluctuate). However, episodic events such as cyclones can remove enduring meadows — this was observed at Thevenard Island during our study and also at Exmouth Gulf during our pilot surveys (in March 2013), when no seagrass was observed. Kilminster et al. (2015) recommended that a meadow should be considered enduring when seagrass is present for five years or more: our study was only carried out for two years, so we cannot equivocally say that the meadows we surveyed are enduring. However, previous studies in Exmouth Gulf identified a loss of seagrass followed by recovery over seven years, during which time seagrass was always detected (Loneragan et al. 2013) indicating that enduring meadows do form in Exmouth Gulf. Based on this information, we suggest that the majority of the meadows we surveyed should be considered enduring, with highly variable cover at some locations (e.g. Exmouth Gulf, Bundegi) or with little variation at other locations (South Muiron Island). In contrast, the deeper meadows surveyed as part of Wheatstone monitoring appear to be transient. Kilminster et al. (2015) recommend that different variables should be measured, depending on whether meadows are transient or enduring. For transient meadows, measurements of sexual reproduction (numbers of flowers and fruits, and seed production) are most important, because this will be the main mechanism for recovery. For enduring meadows, measurements of distribution, abundance and composition, as well as environmental conditions, are perhaps more useful. We recommend that these measurements of sexual reproduction should be incorporated into monitoring programs for all Pilbara seagrasses.
Recovery dynamics will also vary according to a species’ life history and meadow type. Meadows comprised of colonising and opportunistic species will typically be less resistant to disturbance but are likely to have a variety of mechanisms that permit recovery — such as recovery from seed banks, or advected seeds or vegetative fragments. On the other hand, persistent species that rely more heavily on vegetative growth might recover more slowly and rely more heavily on the presence of adjacent populations. These are general models, and there will likely be context-specific patterns of recovery: for example, not all meadows formed by colonising species will recover quickly because some meadows are highly clonal (McMahon et al. 2017b – WAMSI DSN Project 5.1.2), indicating that sexual reproduction is not important for their persistence.
The abundance of seagrasses at our locations was highly variable. This variability could be due to several causes, including environmental conditions, herbivory or extreme episodic events such as cyclones. Light intensities at all locations followed a regular seasonal cycle, and where regular intra-annual patterns were observed they reflected patterns in light intensity. However, the abundance of seagrass at some locations — such as South Muiron Island — did not follow regular intra-annual patterns, and abundance could be determined by other influences — perhaps herbivory or limiting nutrients. Dugong grazing trails were observed regularly at Exmouth

Natural Dynamics: understanding natural dynamics of seagrasses of the north west of Western Australia
Dredging Science Node | Theme 5 | Project 5.3 37
Gulf, Bundegi and Thevenard Island, and were also observed at Balla Balla, and there was some evidence of turtle grazing at South Muiron Island, where the shoots of Thalassia were often shredded and only just extending above the surface of the sediment. Loneragan et al. (2013) suggested that TC Vance (Category 5) was directly responsible for the low seagrass abundance they observed in Exmouth Gulf; they observed increases in abundance and a shift in species composition within two years. Our observations at Thevenard Island are consistent with this — a precipitous decline in seagrass cover was observed (from ~20% cover to zero) after the passage of TC Olwyn (Category 3). Elsewhere, large-scale loss of similar seagrass meadows have occurred following extreme events; for example in Queensland floods have caused loss of meadows of Zostera capricorni, H. spinulosa, H. ovalis and H. uninervis (Campbell & McKenzie 2004, Preen et al. 1995). As the Pilbara is dominated by highly episodic weather events, and the frequency of cyclones is greater than the Kimberley and Gascoyne, these episodic events are likely to have a greater impact on the dynamics of seagrasses in this region.
Most meadows we surveyed comprised 1 to 2 species; however, at Exmouth Gulf we recorded up to six species in a meadow, and the different temporal patterns exhibited by each species interacted to create complex patterns in total percentage cover. The different temporal patterns of each species might indicate a successional pattern in recovery. Loneragan et al. (2013) observed shifts in species composition following the impact to seagrass meadows from TC Vance (Category 5), and we observed similar patterns in species composition during our study. The general changes in abundance and species composition following a disturbance found by both Loneragan et al. (2013) and this study are demonstrated in Figure 23.
Figure 23. Changes in species composition over time in Exmouth Gulf, a site with high seagrass species diversity. Each dotted vertical line indicates a year, with two years prior to a disturbance and eight years following a disturbance. This conceptual diagram was developed from the data of Loneragan et al. 2013 and this study. Total seagrass cover is indicated by the line plot and species presence and abundance is indicated by the horizontal bars; a darker colour indicates greater abundance. Following a disturbance the abundance of seagrass declined to undetectable levels, then slowly increased over time to reach maximum abundance after approximately three years. This biomass was maintained and then dropped back to levels similar to pre-disturbance. Following disturbance, the colonising species H. uninervis and H. ovalis were the first present, followed by H. spinulosa which increased in abundance concurrently with H. uninervis.

Natural Dynamics: understanding natural dynamics of seagrasses of the north west of Western Australia
38 Dredging Science Node | Theme 5 | Project 5.3
Overall, we observed highly variable seagrass composition and abundance, and most species of seagrasses present have opportunistic or colonising life histories and form enduring meadows with variable cover and biomass. The key implications of these findings are:
• responses to, and recovery from, dredging-related disturbances will depend on the species present and meadow type;
• monitoring programs should include carefully-selected ‘control’ locations that match the species composition at potentially disturbed locations;
• monitoring programs should include multiple control locations, and the number should be congruent with a specified level of power to detect a difference;
• monitoring between November and February is likely to maximize the chance of observing high percentage cover and flowers of many species, and we recommend that this should be the preferred time for undertaking pre-development surveys; and
• extreme events have the potential to dramatically reduce cover. The location of multiple control locations separated by large distances will reduce the risk of choosing control sites that all experience loss of seagrass. Noting that the large differences in species composition and abundance we found between locations separated by tens of kilometres led to a recommendation that reference sites should be located within approximately 20 km of a dredging plume, this might mean that a nested design is appropriate, in which groups of reference sites at different locations serve as controls for dredging-related impacts and impacts of extreme disturbances.
4.2 Reproduction
Any increase in abundance following a disturbance-induced reduction will be determined by the life history strategies of the species involved. The most ubiquitous and abundant species recorded during our surveys all have fast rates of horizontal growth through rhizome extension, and can produce large quantities seeds with a hard seed coat and distinct period of dormancy (McMahon et al. 2017b - WAMSI DSN Project 5.1.2). These two features provide two possible mechanisms for recovery: via existing plants through vegetative growth, and via new recruitment from seeds.
Flowers were observed for three species (H. ovalis, H. spinulosa, and S. Isoetifolium) and the timing, but not the frequency, of flowering was consistent, occurring mainly in November–February. Fruits of H. ovalis and seeds of H. uninervis were also observed but abundances were ubiquitously low, except at Balla Balla. H. uninervis seeds were observed in a large proportion of cores at Balla Balla, but were hollow and not viable. In laboratory trials, seeds were successfully recovered from sediment into which they had been placed, so we are confident that our results accurately reflect that seeds are generally present in low abundance. Because flowers were observed, the absence of seeds likely indicates the presence of processes that hamper the development and dispersal of seeds, poor seed survival, or both. Understanding of these mechanisms is poor, with almost no published studies on the processes that determine seed, persistence and abundance. Some recent studies suggest that environmental conditions can influence seed germination and early-stage seedling development, including salinity and temperature (Kaldy et al. 2015, Stafford-Bell et al. 2016), light (Orth et al. 2006), sediment grain size and depth of burial (Jarvis et al. 2015) or the absence of environmental cues (e.g. changes in light quantity and quality) to enhance germination (Jarvis & Moore 2015). Jarvis et al. (2014) found that time, and not environmental conditions, was critical, with seed banks generally being non-viable 12 months after seed production. However, these would be expected to influence the viability, not the presence of seeds. Marion et al. (2012) observed significant loss of seeds from the sediment due to physical disturbance of the sediment, while a large number of studies report predation on seeds by macro-invertebrates (Wassenberg 1990, Wigand & Churchill 1988, Fishman & Orth 1996, Holbrook et al. 2000, Nakaoka 2002, Piazzi et al. 2000, Orth et al. 2002, 2006, 2007). There are reports of herbivory on the inflorescences of seagrasses (Vergés et al. 2007, Reynolds et al. 2012), and predators

Natural Dynamics: understanding natural dynamics of seagrasses of the north west of Western Australia
Dredging Science Node | Theme 5 | Project 5.3 39
of fruits are capable of removing all fruits from a meadow within 1 to 3 weeks. For H. uninervis, we found few seeds, and in places where seeds did occur they had clearly been eaten by an herbivore. It is possible that these mechanisms could influence the abundance of viable seeds in H. ovalis and H. uninervis meadows. All but one of the previously published studies cited above were performed on persistent, temperate seagrasses (species of Zostera, Posidonia and Phyllospadix); only two studies (Orth et al. 2006, 2007) examined a species of Halophila (H. ovalis), though those studies were in temperate meadows. Understanding of these processes in tropical and sub-tropical regions, where herbivory is generally considered to be greater than in temperate zones (Heck & Valentine 2006), is poor.
The low abundances of seeds imply a low probability of recovery from disturbance via recruitment. However, few data exist to evaluate this prediction. The patterns of recovery of seagrass meadows reported in Loneragan et al. (2013) — for example no H. spinulosa was recorded in November 1999 but it was widespread in December 2001 — imply that recovery from seeds is likely. However, our understanding of the most important mechanisms supporting such large-scale increases in abundance is poor, including whether it is possible through vegetative growth alone (Walker et al. 2006). A companion study on genetic variation in seagrass in the Pilbara (McMahon et al. 2017c – WAMSI Project 5.2), recorded a large degree of variability in the clonal diversity of these seagrasses at the same sites. Low clonal diversity implies a low reliance of sexual reproduction for recovery, which contrasts with the generally accepted (but unproven) view that these seagrass populations are likely to recover from seed banks (e.g. Jarvis et al. 2015, Kilminster et al. 2015, Smith et al. 2016).
The main implications of these findings for management are:
• The relative consistency in the time of year that we observed flowers offers the potential for identification of environmental windows. Within the context of the framework contained in EPA (2016), environmental windows are times of year when, or places where, key species, ecological communities or critical processes may be particularly vulnerable to pressures from dredging and, therefore, where dredging would ideally not occur (NB: this differs to the interpretation of the term in some other places, where environmental windows refer to times when dredging could occur). Flowering, seed set and seedbank formation are key ecological processes that maintain seagrass meadows, and enhance their recovery after disturbance; dredging activities that might disrupt these processes should not occur during periods when, or at places where, flowers are present or seeds are being formed. In addition, such activities should not occur during periods immediately preceding the development of flowers or seeds, when plants will be accumulating the reserves necessary for reproduction. In the case of the western Pilbara, where our study was focused, the environmental window would occur during spring to early summer.
• Environmental windows should be considered in the context of the duration of dredging activities. For short-term dredging, such as maintenance dredging programs which typically last from a few days to several weeks, it should be possible to schedule dredging to avoid environmental windows. However, for longer dredging programs, such as capital dredging programs which can extend for months to years, attempts to avoid spring-summer environmental windows might cause dredging to be delayed until winter, when light availability is at its lowest (see Fig. 17). It is possible that the small amounts of light that plants receive in winter are critical for maintaining persistent seagrass meadows, so dredging at this time could also cause negative impacts. Therefore, longer-term dredging programs will likely need to consider multiple environmental windows. Noting the significant spatial variation in seagrass composition and abundance, the identification of environmental windows should be done within the potentially-affected areas, and should not be inferred from patterns observed elsewhere.
• Because the abundance of fruits and seeds was low, despite flowering by multiple species, it cannot be assumed that a seed bank is always present, even after flowering. Following from this, it is not clear whether initial post-disturbance recovery will be from a seed bank or whether recovery from re-growth of vegetative material will be more important. The results of experimental clearances (see Vanderklift et al. 2016) indicated no recovery from seed or from advected vegetative fragments, but significant recovery

Natural Dynamics: understanding natural dynamics of seagrasses of the north west of Western Australia
40 Dredging Science Node | Theme 5 | Project 5.3
from vegetative regrowth from surrounding meadows. Predictions about recovery should not assume that there would be rapid recovery from a seed bank.
4.3 Light
We observed regular seasonal fluctuations in light intensity (PPFD) at all locations, although there were differences among locations in light intensity, particularly during warmer months. These differences tended to match patterns in water depth (Exmouth Gulf, which was the deepest location, typically had lower light intensities). We compared observed light intensities with the reported half-saturating light intensities for photosynthesis (Ek) of key species. There are few reported values of Ek for H. ovalis, but several studies have reported Ek values for H. uninervis, which range from 50 to 300 µmol m-2 s-1. This is a wide range, which might reflect adaptation to the conditions in which the plants were growing. There were days at all sites when the upper estimate (300 µmol m-2 s-1) was not reached, implying that photosynthesis would be prone to light-limitation. This tended to occur during winter (June) when PPFD was lowest, and occurred most frequently at Exmouth Gulf, where PPFD tended to be lowest all year. PPFD reached 50 µmol m-2 s-1 for at least some time on every day, with the exception of a single day at a single site at Exmouth Gulf. We infer that PPFD exceeds the level below which photosynthesis would be light-limited for most days of the year at most places. This might not occur during winter at some deeper (>4 m) meadows. This inference relies on the assumption that published Ek values apply to Pilbara seagrasses. However, given the very broad range of Ek values used here, and the likelihood that seagrasses are adapted to the light conditions that occur where they are growing, it is reasonable to assume that the plants at the three locations are receiving light conditions that would not limit photosynthesis some of the time during most days.
Similar inferences are yielded by comparison of PPFD with known thresholds derived from WAMSI DSN Project 5.5 (Statton et al. 2017a, Statton et al. 2017b, Statton et al. 2017c). For the majority of time seagrass at our study locations received light above critical thresholds for growth. WAMSI DSN Project 5.5. (Statton et al. 2017b) imposed different levels of light reduction on H. ovalis, H. uninervis and C. serrulata. In all cases, a daily total PPFD of between and 5 and 9 mol m-2 d-1 appears to be an important threshold, with plants displaying physiological and growth responses after 3 weeks at these intensities. These conditions were exceeded regularly at all sites — although light intensities at Exmouth Gulf failed to exceed 5 mol m-2 d-1 on 15 occasions; on 14 of those occasions those conditions persisted for 3 or fewer days, for a total of 32 days (6% of the study duration).
Our PPFD data provide an initial baseline for light requirements for seagrasses in the Pilbara that, in the absence of site-specific data, might help model and predict impacts. For example, on the basis of observations from Exmouth Gulf, a condition likely to be suitable for maintenance of seagrass meadows is PPFD of at least 5 mol m-2 d-1 for 94% of the year, with no occurrences below this for more than three consecutive days. Such baselines would be best developed from site-specific data and would only apply for the species recorded at our sites during this study.
5 Conclusions
The composition and abundance of seagrasses in the Exmouth region and at Thevenard Island are highly variable. The most widespread and abundant species have colonising or opportunistic life histories. The seagrasses did not tend to have similar patterns of spatial or temporal variation in abundance and reproduction. The abundance of seeds in the sediment is generally very low. Lessons from these observations include: the design of monitoring programs needs to account for the considerable spatial and temporal variability in composition and abundance, dredging in the vicinity of seagrass meadows should avoid summer periods when flowering and seed development occurs, and recovery via recruitment cannot be assumed.
The project provides baseline light intensities (PPFD) for places that support seagrasses in the Exmouth region. Those places appear to have few days per year when light intensity at the seafloor does not exceed levels that other studies have shown adversely affect photosynthesis and growth of the species of seagrasses that occur there.

Natural Dynamics: understanding natural dynamics of seagrasses of the north west of Western Australia
Dredging Science Node | Theme 5 | Project 5.3 41
6 References
Anderson PK (1994) Dugong Distribution, the Seagrass Halophila spinulosa, and Thermal Environment in Winter in Deeper Waters of Eastern Shark Bay, Western Australia. Wildlife Research 21:381-388
Bite JS, Campbell SJ, McKenzie LJ, Coles RG (2007) Chlorophyll fluorescence measures of seagrasses Halophila ovalis and Zostera capricorni reveal differences in response to experimental shading. Marine Biology 152:405-414
Burgess R (2001) An improved protocol for separating meiofauna from sediments using colloidal silica sols. Marine Ecological Progress Series 214:161-165
Campbell SJ, McKenzie LJ, Kerville SP, Bite JS (2007) Patterns in tropical seagrass photosynthesis in relation to light, depth and habitat. Estuarine Coastal and Shelf Science 73:551-562
Campbell SJ, McKenzie LJ (2004) Flood related loss and recovery of intertidal seagrass meadows in southern Queensland, Australia. Estuarine, Coastal and Shelf Science 60:477-490.
Chevron Australia (2014) Dredging and Dredge Spoil Placement Environmental Monitoring and Management Plan. Chevron Australia Pty Ltd. Perth, Western Australia. Revision 3 (WS0-0000-HES-RPT-CVX-000-00086-000). https://www.chevronaustralia.com/docs/default-source/default-document-library/dredging_and_dredge_spoil_placement_environmental_monitoring_and_management_plan.pdf?sfvrsn=0
Collier CJ, Waycott M, McKenzie LJ (2012) Light thresholds derived from seagrass loss in the coastal zone of the northern Great Barrier Reef, Australia. Ecological Indicators 23:211-219
Collier CJ, Waycott M, Ospina AG (2012) Responses of four Indo-West Pacific seagrass species to shading. Marine Pollution Bulletin 65:342-354
Constanza R (1997) The value of the World’s ecosystem services and natural capital. Nature 387:253-260
Erftemeijer PLA, Lewis RRR (2006) Environmental impacts of dredging on seagrasses: a review. Marine pollution Bulletin 52:1553-1572
Environment Protection Authority (2016) Technical Guidance: Environmental Impact Assessment of Marine Dredging Proposals. EPA, Western Australia
Fishman JR, Orth RJ (1996) Effects of predation on Zostera marina L. seed abundance. Journal of Experimental Marine Biology and Ecology 198:11−26
Hammerstrom KK, Kenworthy WJ (2003) A new method for estimation of Halophila decipiens Ostenfeld seed banks using density separation. Aquatic Botany 76:79-86
Holbrook SJ, Reed DC, Hansen K, Blanchette CA (2000) Spatial and temporal patterns of predation on seeds
of the surfgrass Phyllospadix torreyi. Marine Biology 136:739-747
Heck KL, Valentine JF (2006) Plant-herbivore interactions in seagrass meadows. Journal of Experimental Marine Biology and Ecology 330(1):420-436
Jarvis JC, Moore KA (2015) Effects of seed source, sediment type, and burial depth on mixed-annual and perennial Zostera marina L. seed germination and seedling establishment. Estuaries & Coasts 38:964-978
Jarvis JC, Moore KA, Kenworthy WJ (2014) Persistence of Zostera marina L. (eelgrass) seeds in the sediment seed bank. Journal of Experimental Marine Biology and Ecology 459:126-136
Kaldy JE, Shafer DJ, Ailstock, MS, Magoun, AD (2015) Effects of temperature, salinity and seed age on induction of Zostera japonica germination in North America, USA. Aquatic Botany126:73-79
Kilminster K, McMahon K, Waycott M, Kendrick GA, Scanes P, McKenzie L, O’Brien RO, Lyons M, Ferguson A, Maxwell P, Glasby T, Udy J (2015) Unravelling complexity in seagrass systems for management: Australia as a microcosm. Science of the Total Environment 534:97-109
Lavery PS, Mateo M-A, Serrano O, Rozaimi M (2013) Variability in the carbon storage of seagrass habitats and its implications for global estimates of Blue Carbon ecosystem service PLoS ONE 8(9): e73748. doi:10.1371/journal.pone.0073748
Lee KS, Park SR, Kim YK (2007) Effects of irradiance, temperature, and nutrients on growth dynamics of seagrasses: A review. Journal of Experimental Marine Biology And Ecology 350:144-175
Loneragan NR, Kangas M, Haywood MDE, Kenyon RA, Caputi N, Sporer E (2013) Impacts of cyclones and aqautic macrophytes on recruitment and landings of tider prawns Penaeus esculentus in Exmouth Gulf, Western Australia. Estuarine, Coastal and Shelf Science 127:46-58
Marion SR, Orth RJ (2010) Innovative techniques for large-scale seagrass restoration using Zostera marina (eelgrass) seeds. Restoration Ecology 18:514–526.
McCook LJ, Klumpp DW, McKinnon AD (1995) Seagrass communities in Exmouth Gulf, Western Australia: A preliminary survey. Journal of the Royal Society of Western Australia 78:81-87
McMahon K, Lavery P, Statton J, McCallum R and Hernawan U (2017a) Current state of knowledge regarding the effects of dredging-related ‘pressure’ on seagrasses. Report of Theme 5 – Project 5.1.1 prepared for the Dredging Science Node, Western Australian Marine Science Institution, WAMSI, Perth, Western Australia, 64 pp.

Natural Dynamics: understanding natural dynamics of seagrasses of the north west of Western Australia
42 Dredging Science Node | Theme 5 | Project 5.3
McMahon K, Statton J and Lavery P (2017b) Seagrasses of the north west of Western Australia: biogeography and considerations for dredging-related research. Report of Theme 5 - Project 5.1.2 prepared for Dredging Science Node, Western Australian Marine Science Institution, Perth, Western Australia. 39 pp.
McMahon K, Hernawan U, van Dijk K, Waycott M, Biffen E, Evans R and Lavery P (2017c) Genetic variability within seagrass of the north west of Western Australia. Report of Theme 5 – Project 5.2 prepared for the Dredging Science Node, Western Australian Marine Science Institution, WAMSI, Perth, Western Australia, 41 pp.
McMahon K, van Dijk K-j, Ruiz-Montoya L, Kendrick GA, Krauss SL, Waycott M, Verduin J, Lowe R, Statton J, Brown E, Duarte C (2014) The movement ecology of seagrasses. Proceedings of the Royal Society B Biological Sciences 281:20140878 doi: 10.1098/rspb.2014.0878
Nakaoka M (2002) Predation on seeds of seagrasses Zostera marina and Zostera caulescens by a tanaid crustacean Zeuxo sp. Aquatic Botany 72:99−106
Neukermans G, Loisel H, Meriaux X, Astoreca R, McKee D (2012) In Situ variability of mass-specific beam attenuation and backscattering of marine particles with respect to particle size, density and composition. Limnology and Oceanography 5:124-144
Orth RJ, Carruthers TJB, Dennison WC, Duarte CM, Fourqurean JW, Heck KL Jnr, Hughes AR, Kendrick GA, Kenworthy WJ, Olyarnik S, Short FT, Waycott M Williams S (2006) A global crisis for seagrasses. BioScience 56:987-996
Orth RJ, Harwell MC , Inglis GJ (2006) Ecology of seagrass seeds and seagrass dispersal processes. In: Larkhum, AWD, Orth, RJ, Duarte, CM (Eds.) Seagrasses: Biology, Ecology and Conservation. Springer, Dordrecht, pp.111–133
Orth RJ, Heck KL Jr, Tunbridge DJ (2002) Predation on seeds of the seagrass Posidonia australis in Western Australia. Marine Ecology Progress Series 244: 81−88
Orth RJ, Kendrick GA, Marion SR (2006) Predation on Posidonia australis seeds in seagrass habitats of Rottnest Island, Western Australia: patterns and predators. Marine Ecology Progress Series 313:105−114
Orth RJ, Kendrick GA, Marion SR (2007) Posidonia australis seed predation in seagrass habitats of Two Peoples Bay, Western Australia Aquatic Botany 86:83-85
Ow YX, Collier CJ, Uthicke S (2015) Responses of three tropical seagrass species to CO2 enrichment. Marine Biology 162:1005-1017
Parsons TR, Maita Y, Lalli CM (1989) A Manual of Chemical and Biological Methods for Seawater Analysis. Pergamon Press, Toronto
Piazzi L, Balestri E, Cinelli F (2000) Grazing of inflorescences of the seagrass Posidonia oceanica (L.) Delile. Botanica Marina 43:581−584
Preen A (1998) Marine protected areas and dugong conservation along Australia’s Indian Ocean Coast. Environmental Management 22:173-181
Preen AR, Lee Long, WJ, Coles RG (1995) Flood and cyclone related loss, and partial recovery, of more than 1000 km2 of seagrass in Hervey Bay, Queensland, Australia. Aquatic Botany 52:3-17
Rasheed MA, McKenna SA, Carter AB, Coles RG (2014) Contrasting recovery of shallow and deep water seagrass communities following climate associated losses in tropical north Queensland, Australia. Marine Pollution Bulletin 83:491-499
R Development Core Team (2014) R: A Language and Environment for Statistical Computing. R Foundation for Statistical Computing, Vienna, Austria
Reynolds LK, Carr LA, Boyer KE (2012) A non-native amphipod consumes eelgrass infloresences in San francisco Bay. Marine Ecology Progress Series 451:107-118
RPS (2011) Seagrass filter feeder and macroalgae survey. Wheatstone Project. December 2011. Report prepared for Chevron Australia Pty Ltd by RPS, Perth, December 2011
Skrzypek G, Paul, D (2006) δ13C analyses of calcium carbonate: comparison between the GasBench and elemental analyzer techniques. Rapid Communications in Mass Spectrometry 20: 2915-2920
Smith TM, York PH, Macreadie PI, Keogh MJ, Ross DJ Sherman CDH (2016) Recovery pathways form small-scale disturbance in a temperate Australian seagrass. Marine Ecology Progress Series 542:97-108
Stafford-Bell RE, Chariton AA, Robinson RW (2016) Germination and early-stage development in the seagrass, Zostera muelleri Irmisch ex Asch in response to multiple stressors. Aquatic Botany 128:18-25
Statton J, McMahon K, McCallum R, Armstrong P, Dunham N, Strydom S, Kendrick G and Lavery P (2017a) Determining light stress bio-indicators and thresholds for a tropical multi-species seagrass assemblage. Report of Theme 5 - Project 5.5.1 prepared for the Dredging Science Node, Western Australian Marine Science Institution, Perth, Western Australia.
Statton J, McMahon KM, McCallum R, Kendrick G and Lavery P (2017b) Response and recovery of a mixed tropical seagrass assemblage to variation in the frequency and magnitude of light deprivation. Report of Theme 5 - Project 5.5.3 prepared for the Dredging Science Node, Western Australian Marine Science Institution, Perth, Western Australia.
Natural Dynamics: understanding natural dynamics of seagrasses of the north west of Western Australia
Dredging Science Node | Theme 5 | Project 5.3 43
Statton J, McMahon KM, McCallum R, Vivanco Bercovich M, Kendrick G and Lavery P. (2017c) Response of a mixed tropical seagrass assemblage to burial by inorganic and organic sediments under low light. Report of Theme 5 - Project 5.5.4 prepared for the Dredging Science Node, Western Australian Marine Science Institution, Perth, Western Australia.
Reynolds LK, Carr LA, Boyer KE (2012) A non-native amphipod consumes eelgrass inflorescences in San Francisco Bay. Marine Ecology Progress Series 451:107-118
Vanderklift M, Bearham D, Haywood M, Lavery P, McCallum R, McLaughlin J, McMahon K and Mortimer N (2017) Recovery mechanisms: understanding mechanisms of seagrass recovery following disturbance. Report of Theme 5 - Project 5.4 prepared for the Dredging Science Node, Western Australian Marine Science Institution, Perth, Western Australia, 25 pp.
Vergés A, Becerro MA, Alcoverro T, Romero J (2007) Variation in multiple traits of vegetative and reproductive seagrass tissues influences plant-herbivore interactions. Oecologia 151:675−686
Walker DI, Kendrick GA, McComb (2006) Decline and Recovery of Seagrass Ecosystems – The Dynamics of Change, in Larkum AWD, Orth RJ, Duarte CM (eds),
Seagrasses: Biology, Ecology and Conservation. Springer, The Netherlands, pp. 551-565
Walker DI, Prince RIT (1987) Distribution and biogeography of seagrass species on the northwest coast of Australia. Aquatic Botany 29:19-32
Wassenberg TJ (1990) Seasonal feeding on Zostera capricorni seeds by juvenile Penaeus esculentus (Crustacea: Decapoda) in Moreton Bay, Queensland. Australian Journal of Marine and Freshwater Biology 41:301−310
Watson RJ, Edwards C, Butller V, Clementson A, Berry K (2005) Flow-injection analysis with fluorescence detection for determination of trace levels of ammonium in seawater. The Royal Society of Chemistry 7:37-42
Wigand C, Churchill AC (1988) Laboratory studies on eelgrass seed and seedling predation. Estuaries 11:180−183
York PH, Carter AB, Chartrand K, Sankey T, Wells L, Rasheed MA (2015) Dynamics of a deep-water seagrass population on the Great Barrier Reef: annual occurrence and response to a major dredging program. Scientific Reports 5:13167 doi: 10.1038/srep13167