NATIONAL RABI CONFERENCE 2010-11 17 TH & 18 TH SEPTEMBER 2010 NEW DELHI KARNATAKA STATE
39
NATIONAL RABI CONFERENCE 2010-11 17 TH & 18 TH SEPTEMBER 2010 NEW DELHI KARNATAKA STATE
-
Upload
mannix-sanford -
Category
Documents
-
view
34 -
download
2
description
NATIONAL RABI CONFERENCE 2010-11 17 TH & 18 TH SEPTEMBER 2010 NEW DELHI KARNATAKA STATE. Month-wise Normal & Actual Rainfall Kharif 2010 (Unit: mm). Agricultural Scenario –Kharif 2010. Area of Major Kharif Crops - 2008-09 to 2010-11 (Area in lakh hectares). - PowerPoint PPT Presentation
Transcript of NATIONAL RABI CONFERENCE 2010-11 17 TH & 18 TH SEPTEMBER 2010 NEW DELHI KARNATAKA STATE

NATIONAL RABI CONFERENCE2010-11
17 TH & 18 TH SEPTEMBER 2010NEW DELHI
KARNATAKA STATE

Sl. No. Month Normal Actual % Dep.
1 April 35 47 +34
2 May 85 81 -5
3 June 183 170 -7
4 July 267 284 +6
5 August 196 252 +29
6 Sept. (1st- 14th) 59 65 +11
SWM (1st June – 14th Sept.) 704 771 +9
Month-wise Normal & Actual RainfallKharif 2010 (Unit: mm)

Agricultural Scenario –Kharif 2010

Area of Major Kharif Crops - 2008-09 to 2010-11(Area in lakh hectares)
Sl. NoCrop
Group2008-09 2009-10
2010-11 Target
2010-11 (likely Ach.)
1 Cereals 34.00 35.14 35.50 34.70
2 Pulses 11.90 13.41 13.50 16.30
Total Foodgrains 45.90 48.55 49.00 51.00
3 Oilseeds 13.74 13.07 16.00 11.55
4 Cotton 2.70 3.09 3.00 3.95
5 Sugarcane 3.66 4.06 3.50 4.25
6 Tobacco 1.08 1.16 1.00 1.15
Grand Total 67.08 69.93 72.50 71.90

Production of Major Kharif Crops - 2008-09 to 2010-11(in lakh tonnes, Cotton in lakh bales)
Sl. NoCrop Group
2008-09 2009-102010-11 (Target)
2010-11 (likely Ach.)
1 Cereals 72.17 69.37 80.90 82.12
2 Pulses 5.10 4.71 6.37 8.82
Total Foodgrains 77.27 74.08 87.27 90.94
3 Oilseeds 7.52 6.13 11.60 9.20
4 Cotton (Annual)8.66
(Lakh bales)
8.65(Lakh bales)
7.06(Lakh bales)
9.29(Lakh bales)
5 Sugarcane 233.28(Annual)
291.12(Annual)
205.00 (Annual)
*
6 Tobacco 0.52(Annual)
0.91(Annual)
0.85 0.98
* Sugarcane production to be calculated based on harvestable area ascertained by DE&S

Productivity of Kharif Crops - 2008-09 to 2010-11(Yield in Kgs/ha., S.cane yield in Tonnes/ha.)
Sl. NoCrop Group
2008-09 2009-102010-11Target
2010-11 (Anticipated)
1 Cereals 2234 2078 2279 23662 Pulses 451 370 471 541
Total Foodgrains 1772 1606 1781 1783
3 Oilseeds 576 494 725 7974 Cotton (Annual) 379 340 400 4005 Sugarcane (Annual) 87 94 90 95
6 Tobacco 509 810 850 850

Area of Major Rabi/Summer Crops – 2008-09 to 2010-11 (Area in lakh hectares)
Sl. NoCrop
Group2008-09 2009-10
2010-11 (Target)
1 Cereals 19.72 19.44 20.20
2 Pulses 8.97 10.93 10.20
Total Foodgrains 28.70 30.37 30.40
3 Oilseeds 8.03 6.90 8.98
4 Cotton 1.39 1.46 1.50
5 Sugarcane 0.93 1.06 0.60
6 Tobacco - 0.02 -
Grand Total 39.05 39.81 41.48

Production of Major Rabi/Summer Crops – 2008-09 to 2010-11 (in lakh tonnes, Cotton in lakh bales)
Sl. NoCrop Group
2008-09 2009-10 2010-11 (Target)
1 Cereals 30.86 26.16 31.78
2 Pulses 4.62 6.29 5.72
Total Foodgrains
35.48 32.45 37.50
3 Oilseeds 4.60 4.24 6.00
* Sugarcane production to be calculated based on harvestable area ascertained by DE&S

Productivity of Major Rabi /Summer Crops – 2008-09 to 2010-11 (Yield in Kgs/ha.,)
Sl. NoCrop Group
2008-09 2009-10 2010-11 (Target)
1 Cereals 1565 1346 1575
2 Pulses 515 575 650
Total Foodgrains
1236 1068 1275
3 Oilseeds 573 615 668

Dibbling of Redgram - 5000ha. In Gulbarga & Bidar Districts

NATIONAL FOOD SECURITY MISSION- PROGRAMME & PROGRESS-2010-11
SL. NO
PARTICULARSBUDGET
PROVISION(2010-11)
UNSPENT BALANCE(2009-10)
GRANTS RELEASED
TOTAL GRANTS
AVAILABLE(4+5)
EXPENDITURE
1 NFSM-Rice 1802.99 598.78 963.22 1562.00 639.00
2 NFSM-Pulses 4009.68 44.18 2046.65 2090.82 1672.20
3Local
InitiativeRice
150.00 - - - 1.98
Pulses 172.00 - - - 6.14
4 A3P 2077.08 - 2077.08 2077.08 1182.40
Total 8211.75 642.96 5086.95 5729.90 3501.72
Rs. in lakhs
INNAVATIVE APPROACHES UNDER NFSM &A3P

Custom Hire Center – 20 established in the state

Drip irrigation Plot of transplanted Red gram – 1000ha. In Gulbarga District

Redgram Inter- crop with Green gram – 25000 ha. in Bidar District

Redgram sesamum inter crop(1:1) – 5000ha. In Gulbarga District

Transplanted Redgram – 2000ha. In Gulbarga & Bidar Districts

ACCELERATED PULSES PRODUCTION PROGRAMME (A3P) – KHARIF 2010

Interventions under A3P during Kharif - 2010
INM Components were provided through regular
NFSM(Pulses) provision and other schemes of the
Department2.00 lakh IPM kits (1 acre) have been supplied to six
districts during kharif 2010
Contents of IPM kits 1)Prophenophos50% EC-500m
2) Ha NPV-100ml 3)NSKE-1500 ppm-1 Ltr.
4)Indoxacarb14.5 % SC-100ml

ACCELERATED PULSES PRODUCTION PROGRAMME (A3P) – RABI 2010

RASHTRIYA KRISHI VIKASA YOJANA (RKVY)

ABSTRACT OF THE PROJECTS APPROVED - RKVY 2010-11
(Rs. In Crores)
Sl. No. Departments Budget approved during 5th SLSC
1 Agriculture 107.002 Horticulture 20.003 Animal Husbandry 12.005 Fisheries 6.006 UAS, Bangalore 3.007 UAS, Dharwad 2.008 UAS, Raichur 1.60
Total 151.60

PROGRAMME & EXPENDITURE -RKVY
Year Amount Sanctioned
by GOI
Amount Released by GOI
Amount utilized by the State ( As on 31.08.2010)
2007-08 154.30 154.30 154.30
2008-09 314.14 314.14 314.14
2009-10 410.00 410.00 382.50
2010-11 251.03 156.90 56.77
Rs. in Crores

ATMA MODEL OF AGRICULTURAL EXTENSION SYSTEM IN KARNATAKA
Programme & Expenditure since 2005-06
ATMA MODEL OF AGRICULTURAL EXTENSION SYSTEM IN KARNATAKA
Programme & Expenditure since 2005-06
Year SEWPAdmn.
sanction by GOI
Amount released
Expenditure RemarksGOI GOK Total
2005-06 464.12 246.04 180.00 - 180.00 - -
2006-07 1028.15 517.33 155.00 - 155.00 144.84 -
2007-08 1731.69 1217.55 339.00 74.88 413.88 141.21 -
2008-09 2952.64 1865.55 452.00 50.22 502.22 410.18 -
2009-10 2792.40 1857.80250.00
27.78 277.78 692.45 -
2010-11 2613.31 1587.52 634.63 - 634.63 38.03
OB as on 1.4.2010 is Rs. 140.20
lakhs.
(Amount in Lakh Rs)

Programme Unit 2006-07 2007-08 2008-09 2009-10
Exposure visit of Farmers
No of farmers benefited
6305 5908 7970 16082
Demonstrations Numbers 1979 1840 1995 4922
Training-
1.Farmers
2. Extension workers
Numbers
Beneficiaries
Numbers
Beneficiaries
215
8450
10
240
310
18510
26
490
259
16200
46
1149
377
19790
75
2302
Farm Schools Numbers - - 36 45
IMPORTANT ACHIEVEMENTS UNDER ATMA

Training to Farmers under ATMA
Conducted 377 Trainings to 19790 farmers

Demonstrations under ATMA
Conducted 4922 Demonstrations

Farm schools 45 nos
Tur DemonstrationTur Demonstration
Demonstration – cum – Farmschool on Transplanting in Tur (Kolar Dist) ATMADemonstration – cum – Farmschool on Transplanting in Tur (Kolar Dist) ATMA

Demonstration on sericulture
Fields Activities under ATMA in Chickmagalore District
Group activity on Poultry Farming
Field visit to Sericulture unitAzolla production as a supplementary Feed to Animals

Seed distribution

State SRR replacement rate (%) achieved during 2009-10 & Target for 2010-11
Sl.No. Crop
2009-102010-11 Target
Target Achvt.1 Paddy 31 40 422 Ragi 29 30 323 Jowar--Var. 24 31 324 Bajra-- Var 28 29 305 Wheat 21 25 266 Redgram 24 12 257 Greengram 21 16 228 Blackgram 21 28 299 Cowpea 21 28 29
10 Bengalgram 23 40 4111 Groundnut 14 26 2812 Safflower 19 25 2613 Soybean 65 84 8614 Cotton--Var. 16 20 21

SEED TREATMENT - KHARIF 2010
Sl. No. Crop Targeted Area (lakh ha.)
Treated area (lakh ha.)
1. Paddy 10.55 9.732. Ragi 7.52 3.813. Ground nut 7.40 6.214. Tur 6.76 4.985. Sugarcane 3.66 2.766. Jowar 2.53 2.157. Soybean 2.25 1.97
Total 40.67 31.61

Seed samples analysed in the Seed Testing Laboratories during 2010-11
(up to the end of August 2010)
Sl No. Name of Laboratory Samples Analysed
1 STL, Hebbal 2107
2 STL, Dharwad 3607
3 STL, Davanagere 3295
4 STL, Gangavathi 766
Total 9775
In Numbers

COMPONENT WISE APPROVED PROGRAMME AND
PROGRESS OF MICRO-IRRIGATION DURING 2009-10 No. Component
Physical (ha) Financial Allocation (Lakhs) Expenditure (Lakhs)
Target Ach GoI GoK Total GoI GoK Total
1. Drip 7408 3884 1475.67 775.17 2250.84 775.59 504.52 1280.11
2. Sprinkler 126212 91542 7204.18 3784.00 10988.18 4884.73 3487.72 8372.45
3. Drip Demonstrations
6 2 2.21 0.00 0.00 0.40 0.00 0.4
4. Admin 86.82 0.00 0.00 2.20 0.00 2.20
Total 133620 95426 8768.92 4559.53 13328.44 5662.92 3992.24 9655.16

MICRO IRRIGATION PROGRAMME 2010-11
Sl. No.
Scheme Allocation (Rs. Lakhs)
1 Govt. of Karnataka 6087.62
2 Govt. of India 5400.00
Total 11487.62


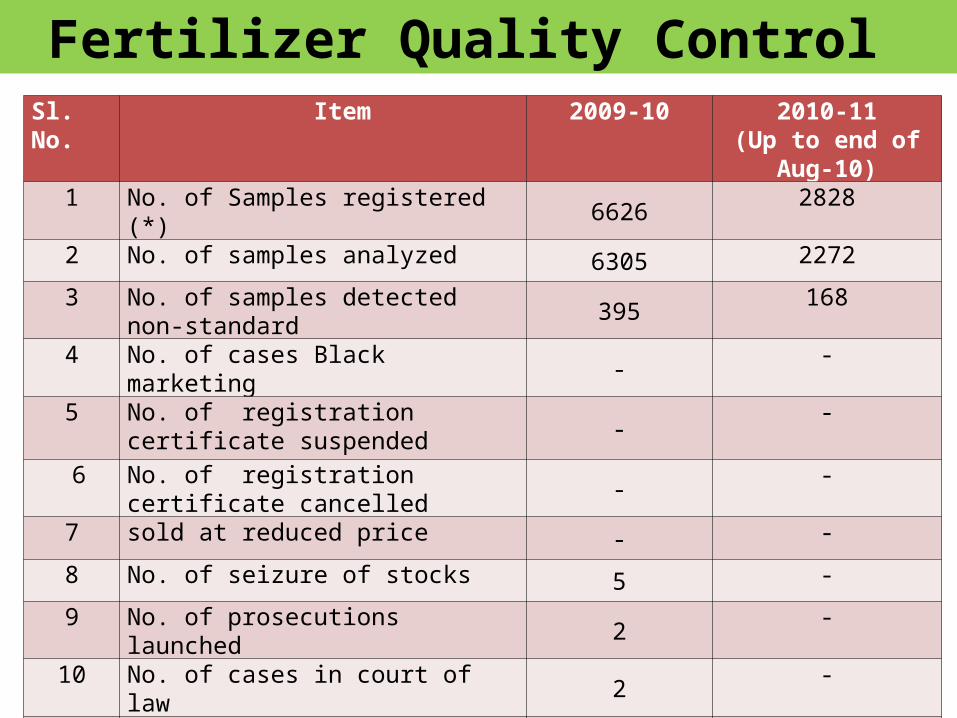
Sl. No. Item 2009-10 2010-11(Up to end of Aug-10)
1 No. of Samples registered (*) 6626 2828
2 No. of samples analyzed 6305 2272
3 No. of samples detected non-standard 395 168
4 No. of cases Black marketing - -
5 No. of registration certificate suspended -
-
6 No. of registration certificate cancelled - -
7 sold at reduced price - -
8 No. of seizure of stocks 5 -
9 No. of prosecutions launched 2 -
10 No. of cases in court of law 2 -
11 No. of Administrative action taken*** 294 149
12 No. of cases pending for initiating action - -
Fertilizer Quality Control

ISSUES FOR CONSIDERATIONCrop Insurance

THANKSTHANKS