NATIONAL EDUCATION CENSUS BOOKLET-2018 (EXTRACT …
71
NATIONAL EDUCATION CENSUS BOOKLET-2018 (EXTRACT OF KEY INDICATORS)
Transcript of NATIONAL EDUCATION CENSUS BOOKLET-2018 (EXTRACT …

NATIONALEDUCATIONCENSUSBOOKLET-2018(EXTRACTOFKEYINDICATORS)

EMIS 2018 NATIONAL EDUCATION STATISTICAL BOOKLET 1
FOREWORD
On behalf of the Ministry of General Education and Instruction (MoGEI), I am delighted to present The National Education Statistics Booklet, 2018, of the Republic of South Sudan (RSS). It is the 11th in a series of publications initiated in 2006, with interruptions in 2014 and 2017 when census did not take place. Unlike the past years, the 2018 AEC managed to have 98% coverage of schools in the country, which has not been the case in the past. This is a significant milestone considering that it is the first time to be handled by MOGEI through EMIS. The purpose of the booklet is to provide a detailed compilation of statistical information covering key indicators of South Sudan’s education sector, from ECDE to Higher Education. It reports the results of the data gathered from the Annual Education Census (AEC) carried out by the Data and Statistics Unit (DSU) of the Directorate of Planning and Budgeting of the MoGEI, which operates the Education Management Information System (EMIS), in collaboration with State Ministries of Education (SMoE). In order to plan and manage our education system effectively, South Sudan needs reliable and credible data. We need information about how the system is developing and changing over time, how learning outcomes and gender disparities vary across the country and how South Sudan compares vis-à-vis its neighbours or countries facing similar socio-economic situations. The General Education Act, 2012, makes specific provisions in this regard: Section 8 (1): The National Ministry of General Education shall exercise and carry out the following roles and functions: (O) Conduct educational research to determine the quality of education system in South Sudan and use the results of such research findings for planning purposes. EMIS provides systematic and quality knowledge to education stakeholders about the status of the education system as a whole and the learning outcomes in the country and, in so doing, assists the Government of South Sudan (GoSS) to identify education needs and priorities, and to design appropriate interventions. EMIS also assists the Ministry and other relevant agencies by providing critical information to monitor our performance against the key indicators of the Education for All (EFA) and the new Sustainable Development Goals (SDGs). Enrolment and intake rates, student-teacher ratios, gender parity, and access to learning materials, among other data, can help the government and development agencies to identify where to most effectively allocate limited resources in the face of competing priorities. This publication would not have been possible without the cooperation and support from the SMoE, County and Payam Education Offices, and all the schools, centres, institutions, colleges, and universities across the RSS. I want to seize this opportunity to commend the dedication, hard work and professionalism of the EMIS team and State Focal Points, County Education Directors, Payam Education Supervisors, County Education Inspectors and Head Teachers, who were crucial in increasing the education census coverage and in assuring the quality of the information gathered. We also thank our partners, especially the Global Partnership for Education (GPE), UNICEF and the individual consultants as well as data collection personnels in hard to reach areas for their continuous support in improving South Sudan’s EMIS. Sincerely, Deng Deng Hoc Yai Minister of General Education and Instruction

EMIS 2018 NATIONAL EDUCATION STATISTICAL BOOKLET 2
Contact Information www.goss.org © Ministry of General Education & Instruction 2019 Photo Courtesy of UNICEF This publication may be used as a part or as a whole, provided that the MoGEI is acknowledged as the source of information. The map used in this document is not the official maps of the Republic of South Sudan and are for illustrative purposes only. This publication has been produced with financial assistance from the Global Partnership for Education (GPE) and technical assistance from two individual consultants contracted by MOGEI. Soft copies of the complete National and State Education Statistic Booklets, along with the EMIS baseline list of schools and related documents, can be accessed and downloaded at: www.mogei.org For inquiries or requests, please use the following contact information: - George Mogga / Director General of Planning and Budgeting / MoGEI [email protected] - Victor Dut Chol / Director for research and Policy Development /MoGEI [email protected]
- Giir Mabior Cyerdit / Deputy Director for Data & Statistics/EMIS Manager/MoGEI [email protected] - Data & Statistics Unit / MoGEI [email protected] - Pawan Kucita/ Chief of Education / UNICEF [email protected] - Yiming Qu / Education officer / UNICEF [email protected]
EMIS 2018 NATIONAL EDUCATION STATISTICAL BOOKLET 3
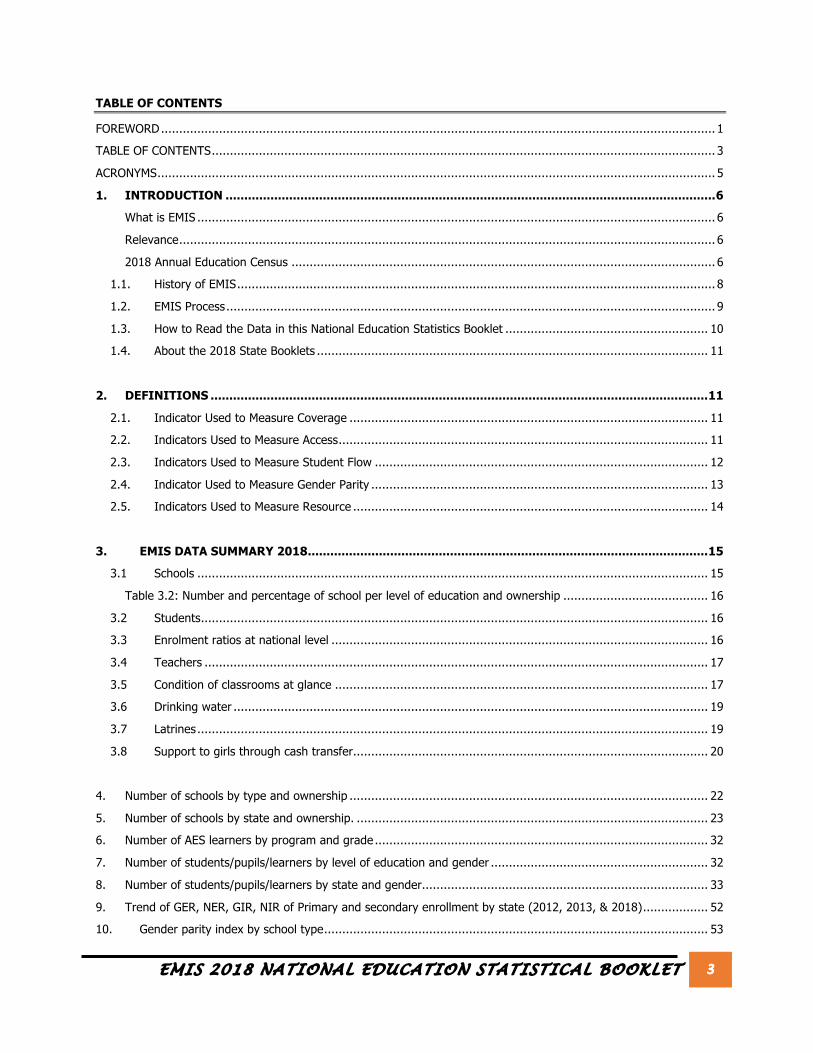
TABLE OF CONTENTS
FOREWORD ......................................................................................................................................................... 1
TABLE OF CONTENTS ........................................................................................................................................... 3
ACRONYMS .......................................................................................................................................................... 5
1. INTRODUCTION ................................................................................................................................... 6
What is EMIS ............................................................................................................................................... 6
Relevance .................................................................................................................................................... 6
2018 Annual Education Census ..................................................................................................................... 6
1.1. History of EMIS .................................................................................................................................... 8
1.2. EMIS Process ....................................................................................................................................... 9
1.3. How to Read the Data in this National Education Statistics Booklet ........................................................ 10
1.4. About the 2018 State Booklets ............................................................................................................ 11
2. DEFINITIONS ..................................................................................................................................... 11
2.1. Indicator Used to Measure Coverage ................................................................................................... 11
2.2. Indicators Used to Measure Access ...................................................................................................... 11
2.3. Indicators Used to Measure Student Flow ............................................................................................ 12
2.4. Indicator Used to Measure Gender Parity ............................................................................................. 13
2.5. Indicators Used to Measure Resource .................................................................................................. 14
3. EMIS DATA SUMMARY 2018 ........................................................................................................... 15
3.1 Schools ............................................................................................................................................. 15
Table 3.2: Number and percentage of school per level of education and ownership ........................................ 16
3.2 Students ............................................................................................................................................ 16
3.3 Enrolment ratios at national level ........................................................................................................ 16
3.4 Teachers ........................................................................................................................................... 17
3.5 Condition of classrooms at glance ....................................................................................................... 17
3.6 Drinking water ................................................................................................................................... 19
3.7 Latrines ............................................................................................................................................. 19
3.8 Support to girls through cash transfer .................................................................................................. 20
4. Number of schools by type and ownership ................................................................................................... 22
5. Number of schools by state and ownership. ................................................................................................. 23
6. Number of AES learners by program and grade ............................................................................................ 32
7. Number of students/pupils/learners by level of education and gender ............................................................ 32
8. Number of students/pupils/learners by state and gender ............................................................................... 33
9. Trend of GER, NER, GIR, NIR of Primary and secondary enrollment by state (2012, 2013, & 2018) .................. 52
10. Gender parity index by school type .......................................................................................................... 53

EMIS 2018 NATIONAL EDUCATION STATISTICAL BOOKLET 4
11. Number of dropouts for secondary and primary level of education ............................................................. 53
12. Number and condition of classrooms by education level, 2018 ................................................................... 58
13. Number of permanent and semi-permanent classrooms by state, 2018 ...................................................... 59
14. Teachers by level of education and qualification status ............................................................................. 60
15. Qualification of teachers by state ............................................................................................................ 61
16. Accessibility to drinking water ................................................................................................................. 65
17. Accessibility to latrines ........................................................................................................................... 66
18. HIV, Sexuality and peace education ......................................................................................................... 67

EMIS 2018 NATIONAL EDUCATION STATISTICAL BOOKLET 5
ACRONYMS
AA Administrative Area AEC Annual Education Census AET Africa Education Trust AES Alternative Education System ALP Accelerated Learning Programme CED County Education Director CGS Community Girls School CPA Comprehensive Peace Agreement DSU Data and Statistics Unit ECDE Early Childhood Development and Education (previously referred to as Pre-Primary or PPR) EFA Education for All EMIS Education Management Information System EU European Union FHI360 Family Health International 360 GER Gross Enrolment Rate GIR Gross Intake Rate GPE Global Partnership for Education GPI Gender Parity Index GUN Greater Upper Nile MoGEI Ministry of General Education & Instruction NBS National Bureau of Statistics NER Net Enrolment Rate NIR Net Intake Rate PCR Pupil-Classroom Ratio PRI Primary PTR Pupil -Teacher Ratio (also known as the Student-Teacher Ratio [STR]) PTextR Student-Textbook Ratio RALS Rapid Assessment of Learning Spaces RSS Republic of South Sudan SBEP Sudan Basic Education Programme SDGs Sustainable Development Goals SEC Secondary SMC School Management Committee SMoE State Ministry of Education SoE Secretariat of Education SPLM Sudan People’s Liberation Movement SSSAMS South Sudan School Attendance Monitoring System TTI Teacher Training Institute TVET Technical Vocational Education and Training UIS UNESCO Institute of Statistics UNI University UNICEF United Nations International Children’s Education Fund USAID United States Agency for International Development

EMIS 2018 NATIONAL EDUCATION STATISTICAL BOOKLET 6
1. INTRODUCTION
“We cherish education for all our people equally and aim to provide a life-long education of quality for all children, youth and adults of Southern Sudan; an education that is relevant and affordable based on the needs and aspirations of the people, to enable them to become responsible and productive citizens.”
RSS MoGEI mission, 1994
What is EMIS The EMIS is a government owned and led programme of the South Sudan MoGEI, which is managed by the Directorate of Planning and Budgeting’s Data and Statistics Unit (DSU). Established in 2006, EMIS facilitates information-driven policy discussions and decision-making by collecting, processing, analysing, storing and disseminating education statistical information. The Unit is primarily responsible for conducting the national Annual Education Census (AEC) of all public and private educational establishments in the country (ECDE [PPR], Primary, Secondary, AES, TTIs, TVET, and Universities), in close coordination with counterparts and stakeholders at state, county, payam, and school levels.
Relevance By collecting and disseminating detailed statistical information and quality knowledge covering key indicators of South Sudan’s education sector, from ECDE to higher education, EMIS assists the government and donors in identifying educational needs and priorities, designing appropriate interventions, allocating limited resources in the face of competing priorities, and monitoring the sector’s performance. EMIS also assists the Ministry and other relevant agencies and donors in providing critical information to monitor progress against key targets of the Education for All (EFA), the GPE, and the new SDGs, among others. When institutionalised and guided by a clear vision and strategy, EMIS has the potential to help policy makers manage an education system, which is able to produce quality and equitable outputs. 2018 Annual Education Census Data collection was carried out from November 2018 to January 2019. Unlike the previous AEC exercises, the current exercise was fully managed by the DSU of MoGEI. All the 32 (plus one) states, akathe 10 former states, were visited in the data collection exercise. Yet information collected could not be compared with what was collected in 2015 and 2016 because in those two years, data collection did not cover all the states. The partial coverage in 2015 and 2016 was because there were states that still had conflict by then and it posed challenges for accessibility. The comparative data used in this report is hence, that of 2012 and 2013 when data was collected throughout all the 10 former states (32 plus one states). The added value to have comparative data is to establish the trend of events regarding the performance of various key indicators in the education sector over time. These include access to education, flow of students and/or learners as well as qualification of teachers over time. Such comparison helps to indicate improvement, stagnation of decline in performance and inform relevant actions or decision-making Considering that DSU was conducting this exercise independently for the first time in the history of its existence, a number of challenges were encountered. These challenges include, but not limited to, the following:
i) Delay in the funding of the AEC project due to delay in the release of GPE’s ESPIG funds ii) Delay of the return of questionnaires from the field due to insufiffient coordination mechanism at the state level. iii) More time than planned was spent in editting questionnaires that were found with errors, which resulted from
limited capacity of some head-teachers. iv) Data entry or data processing challenges relating to:
a. School codes not pre-printed on the questionnaire forms b. Counties/payams were not correctly listed by teachers c. Data entry clerks made many mistakes due to new interface of the data entry tool &
some limitations on daily monitoring & supervision of the clerks All these challenges led to the significant delay in the release of the 2018 AEC report. Lessons from the challenges have been noted for application in the next AEC that DSU will carry out.
EMIS 2018 NATIONAL EDUCATION STATISTICAL BOOKLET 7
About the MoGEI
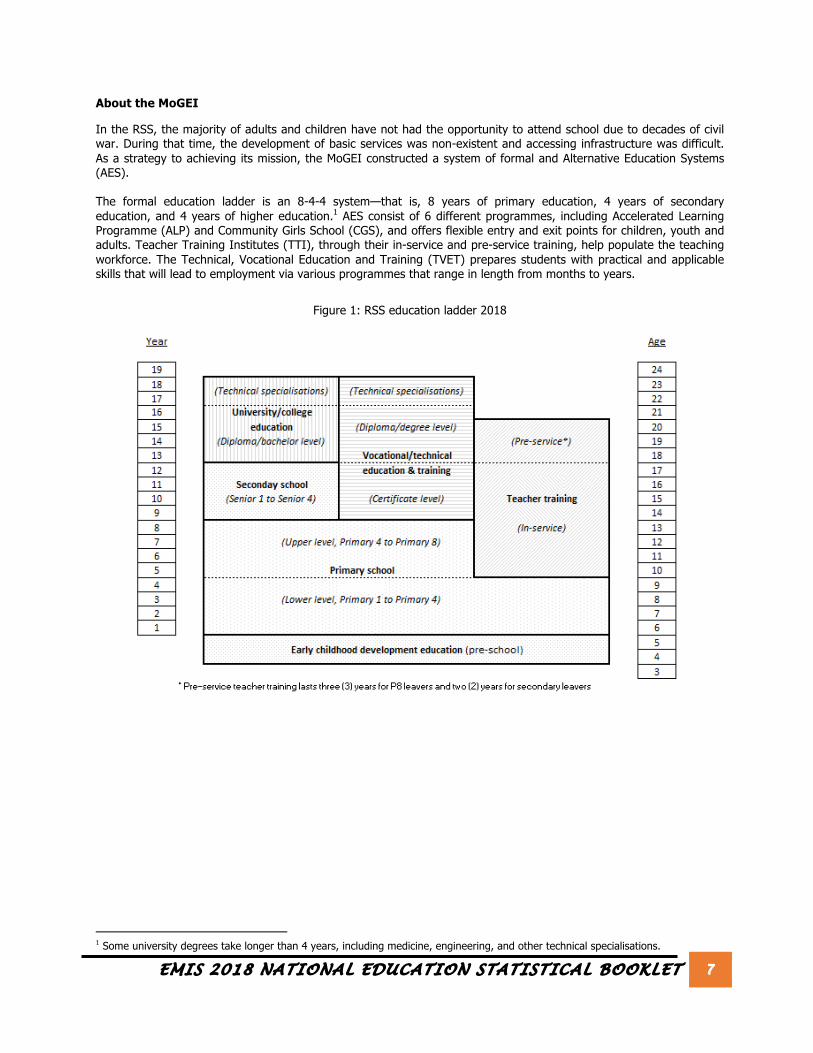
In the RSS, the majority of adults and children have not had the opportunity to attend school due to decades of civil war. During that time, the development of basic services was non-existent and accessing infrastructure was difficult. As a strategy to achieving its mission, the MoGEI constructed a system of formal and Alternative Education Systems (AES). The formal education ladder is an 8-4-4 system—that is, 8 years of primary education, 4 years of secondary education, and 4 years of higher education.1 AES consist of 6 different programmes, including Accelerated Learning Programme (ALP) and Community Girls School (CGS), and offers flexible entry and exit points for children, youth and adults. Teacher Training Institutes (TTI), through their in-service and pre-service training, help populate the teaching workforce. The Technical, Vocational Education and Training (TVET) prepares students with practical and applicable skills that will lead to employment via various programmes that range in length from months to years.
Figure 1: RSS education ladder 2018
1 Some university degrees take longer than 4 years, including medicine, engineering, and other technical specialisations.

EMIS 2018 NATIONAL EDUCATION STATISTICAL BOOKLET 8
Figure 2: Structure of the MoGEI, 2018
The GoSS set 2022 as the target for achieving EFA (GESP 2017). To this end, the Ministry is focusing on developing the education sector through 1) teacher education and professional development, 2) the implementation of new funding mechanisms to support schools and girls’ education, 3) development of AES with a focus on adult literacy and education for hard to reach children, and 4) capacity enhancement of education institutions. The Ministry’s main aim is to increase access to quality education and to promote equity. In order to facilitate the implementation of education reforms, the Ministry wants to build institutional and human capacity both at state and central levels, and at county, payam, and school levels. The Ministry is also working on improved partnerships among key stakeholders in education. With the successes having already been achieved, including the setting up of a transfer system to send salaries, capitation grants and operating costs to states and counties, capitation grants to schools and TTIs, as well as the development of a new curriculum and related textbooks, continuingly having access to credible and reliable education data through EMIS will help to realise future ambitions and reform processes.
1.1. History of EMIS
EMIS in the RSS has come a long way. During the decades of conflict in South Sudan, the Sudan People’s Liberation Movement (SPLM) authorities together with development partners on the ground did not forget education, which was managed by the Secretariat of Education (SoE). In 1998, UNICEF, in collaboration with the SoE, contracted the African Education Trust (AET) to collect and compile data on primary education in rebel-held areas. Data was analysed and documented in a booklet entitled Schools Baseline Assessment (SBA) released in 2002. After the signing of the Comprehensive Peace Agreement (CPA) in 2005, the SoE decided to expand the programme and initiated the first collection of EMIS raw data in 2005, thanks to the support of the Sudan Basic Education Programme (SBEP) funded by the United States Agency for International Development (USAID). In 2006, additional baseline data was collected through the Rapid Assessment of Learning Spaces (RALS). From 2006 to 2013, EMIS activities were

EMIS 2018 NATIONAL EDUCATION STATISTICAL BOOKLET 9
supported by UNICEF through funding from various donors, with contribution from the government, and technically assisted by FHI360. From 2014, EMIS activities have been funded by the EU and then GPE, managed by UNICEF, and Altai Consulting has been providing technical assistance with a key focus on decentralisation, ownership, and sustainability. Although no census was done in 2014 as a result of delays in resource mobilisation, a comprehensive baseline exercise was conducted in October 2014 to prepare for the 2015 census. The exercise consisted of assembling as complete a list of schools as possible from a variety of sources and verified through a combination of methods, including ground verification of 993 schools for which the data available needed to be confirmed. Data collection for the 2015 census was completed between February and April 2015 across 7 states, with more than 6,000 Head Teachers having been involved. This was followed by data entry from April to June 2015, including the verification of about 7,500 questionnaires and decentralised data entry centres in Central Equatoria and Western Bahr el Ghazal states. Between June and September 2015, for the first time, data analysis was performed by the EMIS team in South Sudan. The 2016 census was completed between May and December 2016 throughout 2 phases of fieldwork, reaching 18 of 29 states (including Abyei AA), covering 4,950 individual schools and continuingly seeking to empower state authorities as much as possible. Data was verified as it came back from the field, entered in January 2017 and analysed in February 2017. As there was no AEC conducted in 2017, the 2018 AEC was initiated with a focus to cover all the states in South Sudan. The planning for the 2018 census started in February 2018. However, the data collection didn’t take place until Novemeber 2018. The data collection was completed between November 2018 and January 2019. The data was collected from all the 10 former states (33 new states). The data entry exercise was carried out between February and April 2019. Between April 2019 and July 2019, data cleaning exercise took place as a result of the inconsistencies established in the data provided for analysis. The actual analysis commences in late July and by August 2019; the first draft of the AEC 2018 was issued for review. The second draft was issued in October 2019. This second draft was updated to include a correct list of counties that belong to the different states of South Sudan. The final draft for validation got issued for review in November 2019 and the report validation and publication was done in December 19, 2019
1.2. EMIS Process
The “EMIS process” consists of 5 steps: 1) Fieldwork planning: Designing, reviewing, and printing of the AEC questionnaires, verifying the EMIS baseline list
of schools, and preparing the schedules, budgets, and other necessary administrative and logistical arrangements. 2) Data collection: Firstly, running workshops that ‘train the trainers’ – those sent to the field to subsequently
conduct the training of Head Teachers on questionnaire completion, verifying the data through the Payam and County Education Offices (CEO) and SMOE (some), and retrieval of the completed questionnaires.
3) Data processing: Entering of data into the EMIS database and final data cleaning, verification, analysis and interpretation.
4) Data dissemination: Production of tools for distribution and use in education planning and management. The 2018 State Education Statistic Booklets are such tools, along with other outreach activities at regional and state levels.
5) Data utilisation: Series of training sessions that guide national, state, and county education officials and their partner organisations on the application of EMIS data in building short-, mid-, and long-term strategic plans and budgets.
Each step requires extensive coordination with stakeholders at state, county, payam, and school levels, as illustrated below.
Fieldwork Planning Data Collection Data Processing Data
Dissemination Data Utilisation

EMIS 2018 NATIONAL EDUCATION STATISTICAL BOOKLET 10
Figure 3: 2018 AEC Workflow
For quality control, data verification measures were put in place by the EMIS team. The first level of verification was carried out at payam and county level from the local education authorities, followed by further data verification at state and then national levels. At national level, verification took place via a “call centre” by reaching out to Head Teachers for data checks and rectifications.
1.3. How to Read the Data in this National Education Statistics Booklet
This national level booklet is a reference document for government and other relevant organisations, agencies, and individuals. Its purpose is to present a summary of the data that was reported by individual schools’ Head Teachers and verified by their respective Payam Supervisor, County Education Directors (CED), County Education Inspectors (CEIs) and SMoE. The booklet displays information in three ways: 1) tables, 2) graphs with numbers and 3) graphs with percentages. At the national and state level, ratios are derived from aggregate data, which lowers the margin of error. At the school level, however, data is more prone to errors given the potential risk of misreporting. Two types of data have been used in the compilation of this booklet: 1) 2012 and 2013 AEC data were years for comparisons because of the need to use years with full coverage in the census, 2) population projections based on the 2008 population data and the Population Projections for South Sudan, 2015-2020, from the National Bureau of Statistics (NBS), which were provided as unadjusted and did not include migration estimates.2 In 5 instances, data could only be computed according to the former 10 state breakdown. These instances happened when computing the following indicators;- Net Enrolment Rate (NER),Net Intake Rate (NIR), Gross Enrolment Rate (GER), Gross Intake Rate (GIR) and Gender Parity Index (GPI). This is due to population data for the new states not being available by age categories. Considering that GPI is based on gender, it is presented in both, 10 and 33 states. In instances when the questionnaire was not fully completed by the Head Teacher and questions were left blank, the total sample number for that particular indicator may change to reflect this.
2 Population growth rates provided to calculate the 2016 education statistics have not been verified by the UNESCO Institute of Statistics (UIS).

EMIS 2018 NATIONAL EDUCATION STATISTICAL BOOKLET 11
1.4. About the 2018 State Booklets
The results and analysis presented in this National Education Statistics Booklet are disaggregated by former and new states. As part of the 2018 AEC, 33 individual State Booklets have also been printed – 1 for each state covered – and we encourage readers to request their State Booklet from either their local education authority or by emailing [email protected]. Within state publication the results are presented uniquely at that state level. 2. DEFINITIONS
2.1. Indicator Used to Measure Coverage
Coverage rate refers to the percentage of “known” schools reached out to and accounted for in the AEC. For instance, a coverage rate of 90% means 90% of known schools received the AEC questionnaire, responded, and the completed questionnaire was entered into the EMIS database. “Known” schools include schools for which a reference exists in the database, a questionnaire was printed, and attempted to be delivered. Among these, “missing” schools did not return a questionnaire to the DSU, either because the school was not operational or because the school simply did not or could not return the questionnaire (for logistical or security reasons for example). Schools that confirmed they were out of operation were not included in coverage rate calculations, as well as schools yet to be identified and entered into the EMIS database. The AEC exercise discovers and registers with a unique EMIS code new schools each year. In 2018, the overall coverage rate against the updated 2016 baseline was 98%.
2.2. Indicators Used to Measure Access
Gross Enrolment Rate (GER) is used to show the general level of participation in a given level of education. A GER value of 100% indicates that a country is, in principle, able to accommodate all of its school-aged population. The “official school-age” for Primary education in South Sudan is 6-13, and Secondary education 14-17. The formulas for Primary GER and Secondary GER are:
Primary GER =
Total number of students of all ages in Primary school
X 100% Population of ages 6-13 children
Secondary GER =
Total number of students of all ages in Secondary school
X 100% Population of ages 14-17 children
Gross Intake Rate (GIR) indicates the general level of access to primary education. It also indicates the capacity of the education system to provide access to P1 for the official school entrance age population. This rate can be over 100%, when the number of over-aged and under-aged children in P1 is excessive, relative to the children of the right age of admission. The “official Primary school entrance age” in South Sudan is age 6. The formula for GIR is:
GIR =
Total number of new entrants of all ages in P1
X 100% Population of all age 6 children
New Entrants refer to new students of any age entering P1 for the first time in a school year. Entrants include students who have attended school elsewhere but are beginning P1 in a new school. Students who have left school but returned to school in P1 are also considered new entrants. Students attending P1 at the same school since the previous year are NOT new entrants; they are considered “repeaters” (further defined below). Net Enrolment Rate (NER) shows the proportion of children of school age who are enrolled in school. NER applies only to children of official school age. NER below 100% provides a measure of school age children who are not enrolled in school. As NER only accounts for students of “official school-age,” NER is always less than or equal to GER. The “official school-age” for Primary education in South Sudan is 6-13, and Secondary education 14-17. The formulas for primary NER and secondary NER are:

EMIS 2018 NATIONAL EDUCATION STATISTICAL BOOKLET 12
Primary NER =
Total number of students in school of ages 6-13
X 100% Population of ages 6-13 children
Secondary NER =
Total number of students in school of ages 14-17
X 100% Population of ages 14-17 children
Net Intake Rate (NIR) shows the level of access to Primary education of the eligible population of those with a Primary school-entrance age. A high NIR indicates a high degree of access to Primary education for children of the official Primary school entrance age. For countries wanting to achieve the goal of universal Primary education, a NIR of 100% is the ultimate objective. The “official Primary school entrance age” in South Sudan is age 6. In previous years, the NIR was calculated using the number of “new entrants" (not including repeaters); given that the number of new entrants of a certain age was not assessed in this year’s study, the number of new entrants of age 6 in P1 was replaced with the total number of students of age 6 in P1. Therefore, the formula for NIR is:
NIR =
Total number of students of age 6 in P1
X 100% Population of all age 6 children
GIR and NIR are useful when used in combination, as the difference between these two ratios indicates the rate of deviation from the official age intake.
2.3. Indicators Used to Measure Student Flow
Dropouts refer to students who have withdrawn (for any reason) from the school system without completing a given grade in a given school year. The distinction made between dropouts and repeaters was that while repeaters were not promoted to the next grade level in the following year, they did remain in the school system, whereas dropouts were considered to no longer be in the system at all.
Cohort dropout count
= Enrolment in cohort in y
– Enrolment in cohort in y +1
– Repeaters in cohort in y +1
Dropout Rate monitors education system coverage and student progression by measuring the proportion of students in a given cohort dropping out of—or leaving—the system altogether. The formula for dropout rate is:
Dropout Rate =
Dropouts in cohort in y+1
X 100% Enrolment in cohort in y
NB: Though the dropout rate is presented here, it is not computed in this report. This is as a result of insufficient information present.

EMIS 2018 NATIONAL EDUCATION STATISTICAL BOOKLET 13
Repeaters refer to students who have not been promoted to the next grade level from one year to the next, ending up in the same grade in the current year as they were in last year. A student in P3 last year should be in P4 this year. If the student has stayed in P3 for this year, the student is considered a repeater. The diagram below illustrates this scenario (see Figure 5 and 6 below). Figure 6: Student promoted to next grade, 2015-2016 Figure 7: Student repeating a grade 2015-2016
2015 2016 2015 2016 P3
P3 P3
P3
P4 P4
P4 P4
Repetition Rate measures the phenomenon of students from a cohort repeating a grade, and its effect on the internal efficiency of education systems. It is one of the key indicators for analysing and projecting student flows from grade to grade within the education cycle. Repetition rate should ideally be 0%; a high repetition rate signals problems in the internal efficiency of the education system. An increasing repetition rate serves as an early warning that the system is experiencing capacity constraints. When compared across grades, the patterns can indicate specific grades for which there is higher repetition, and where a more in depth study of causes and possible remedies should be undertaken.
Repetition Rate =
Repeaters in cohort in y+1
X 100% Enrolment in cohort in y
NB: Though the repetition rate is presented here, it is not computed in this report. This is as a result of insufficient information present.
2.4. Indicator Used to Measure Gender Parity
Gender Parity Index (GPI) measures the relative access to education of boys and girls. It is calculated as the ratio of the number of female students enrolled at different levels of education to the number of male students in each level. To standardise the effects of the population structure of the appropriate age groups, the GPI of the GER for each level of education is used. A GPI of 1 indicates parity between the sexes; a GPI that varies between 0 and 1 typically means a disparity in favour of males; whereas a GPI greater than 1 indicates a disparity in favour of females. The indicator is an imperfect measure of the accessibility of schooling for girls because it does not allow a determination of whether improvements in the ratio reflect an increase in girls’ school enrolment (desirable) or a decrease in boys’ school enrolment (undesirable). It also does not show whether the overall level of participation in education is now lower or higher.
GPI =
Female Gross Enrolment Ratio
Male Gross Enrolment Ratio

EMIS 2018 NATIONAL EDUCATION STATISTICAL BOOKLET 14
2.5. Indicators Used to Measure Resource
Pupil-Teacher Ratio (PTR) measures the level of human resources input in terms of number of teachers in relation to the number of students. A high PTR suggests that each teacher is responsible for a large number of students; the higher the PTR, the lower the relative access of students to teachers. It is generally assumed that a low PTR signifies smaller classes, which enables the teacher to pay more attention to individual students, which will likely in the long run result in a better performance of students. The formula for PTR is:
PTR =
Total number of students
Total number of teachers
Pupil-Classroom Ratio (PCR) measures the level of basic facilities available in terms of the number of classrooms in relation to the size of the student population. The higher the PCR, the lower the relative access of students to classrooms. It is generally assumed that a low PCR signifies an environment more conducive to learning, likely in the long run to result in a better performance from students. To support the education reform towards providing all students with stable learning spaces, this report counts only permanent and semi-permanent classrooms in the calculation.3 The formula for PCR is:
PCR =
Total number of students
Total number of perm. and semi-perm. classrooms
3Permanent classrooms refer to those constructed of bricks or cement. Semi-permanent classrooms refer to those constructed of mud or similar material.
EMIS 2018 NATIONAL EDUCATION STATISTICAL BOOKLET 15
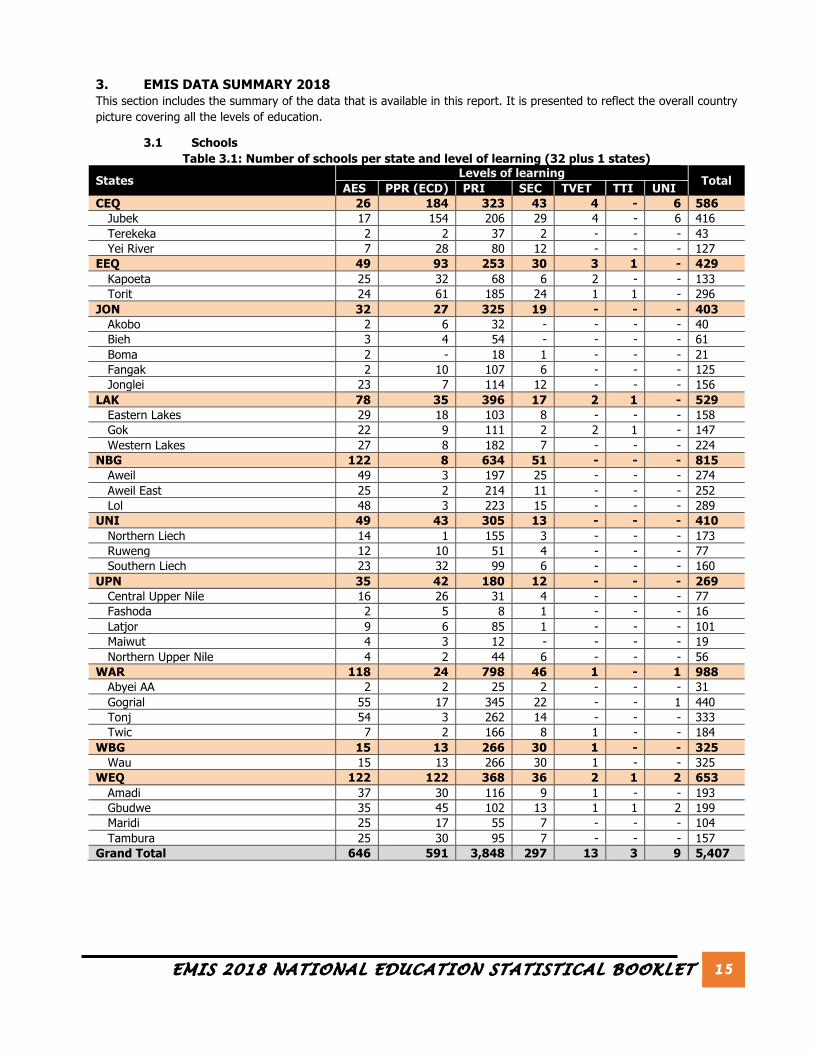
3. EMIS DATA SUMMARY 2018 This section includes the summary of the data that is available in this report. It is presented to reflect the overall country picture covering all the levels of education.
3.1 Schools Table 3.1: Number of schools per state and level of learning (32 plus 1 states)
States Levels of learning
Total AES PPR (ECD) PRI SEC TVET TTI UNI
CEQ 26 184 323 43 4 - 6 586 Jubek 17 154 206 29 4 - 6 416 Terekeka 2 2 37 2 - - - 43 Yei River 7 28 80 12 - - - 127
EEQ 49 93 253 30 3 1 - 429 Kapoeta 25 32 68 6 2 - - 133 Torit 24 61 185 24 1 1 - 296
JON 32 27 325 19 - - - 403 Akobo 2 6 32 - - - - 40 Bieh 3 4 54 - - - - 61 Boma 2 - 18 1 - - - 21 Fangak 2 10 107 6 - - - 125 Jonglei 23 7 114 12 - - - 156
LAK 78 35 396 17 2 1 - 529 Eastern Lakes 29 18 103 8 - - - 158 Gok 22 9 111 2 2 1 - 147 Western Lakes 27 8 182 7 - - - 224
NBG 122 8 634 51 - - - 815 Aweil 49 3 197 25 - - - 274 Aweil East 25 2 214 11 - - - 252 Lol 48 3 223 15 - - - 289
UNI 49 43 305 13 - - - 410 Northern Liech 14 1 155 3 - - - 173 Ruweng 12 10 51 4 - - - 77 Southern Liech 23 32 99 6 - - - 160
UPN 35 42 180 12 - - - 269 Central Upper Nile 16 26 31 4 - - - 77 Fashoda 2 5 8 1 - - - 16 Latjor 9 6 85 1 - - - 101 Maiwut 4 3 12 - - - - 19 Northern Upper Nile 4 2 44 6 - - - 56
WAR 118 24 798 46 1 - 1 988 Abyei AA 2 2 25 2 - - - 31 Gogrial 55 17 345 22 - - 1 440 Tonj 54 3 262 14 - - - 333 Twic 7 2 166 8 1 - - 184
WBG 15 13 266 30 1 - - 325 Wau 15 13 266 30 1 - - 325
WEQ 122 122 368 36 2 1 2 653 Amadi 37 30 116 9 1 - - 193 Gbudwe 35 45 102 13 1 1 2 199 Maridi 25 17 55 7 - - - 104 Tambura 25 30 95 7 - - - 157
Grand Total 646 591 3,848 297 13 3 9 5,407

EMIS 2018 NATIONAL EDUCATION STATISTICAL BOOKLET 16
Table 3.2: Number and percentage of school per level of education and ownership Level of education Total Gov Non-gov Gov % Non-gov % AES 646 476 170 73.7% 26.3% PPR (ECD) 591 189 402 32.0% 68.0% PRI 3,848 2,581 1,267 67.1% 32.9% SEC 297 139 158 46.8% 53.2% TTI 3 1 2 33.3% 66.7% TVET 13 5 8 38.5% 61.5% UNI 9 3 6 33.3% 66.7% Total 5,407 3,394 2,013 62.8% 37.2%
3.2 Students
Table 3.3: Number and percentage of students per level of education and gender Level of education Total Male Female % Male % Female AES 133,628 73,024 60,604 54.6% 45.4% PPR (ECD) 113,824 61,251 52,573 53.8% 46.2% PRI 1,605,091 916,336 688,755 57.1% 42.9% SEC 84,562 54,744 29,818 64.7% 35.3% TTI 183 146 37 79.8% 20.2% TVET* 3,935 2,451 1,484 62.3% 37.7% UNI 8,199 6,332 1,867 77.2% 22.8% Total 1,949,422 1,114,284 835,138 57.2% 42.8%
*There are two types of TVETs; Formal and informal. Total for formal is 2,957 and that for informal is 978. Total for both
is therefore 3,935. Details of this are presented in chapter 8 of this report.
3.3 Enrolment ratios at national level This reflects that Gross Enrolment Rate (GER), Net Enrolment Rate (NER), Gross Intake Rate (GIR) and Net Intake Rate (NIR).
Table 3.4: National enrolment rates Level of Education GER NER GIR NIR PPR (ECD) 8.1% 5.4% 0.8% 0.2% PRI 61.8% 42.3% 13.1% 0.6% SEC 7.9% 3.5% 6.6% 0.3%
Table 3.5: Trend of Enrolment rates Level of Education Year GER NER GIR NIR
PRI 2018 61.8% 42.3% 13.1% 0.6% 2013 61.9% 41.5% 68.0% 11.9% 2012 63.6% 42.1% 65.9% 9.8%
SEC 2018 7.9% 3.5% 6.6% 0.3% 2013 5.1% 1.9% 5.7% 0.4% 2012 6.6% 2.5% 6.6% 0.8%

EMIS 2018 NATIONAL EDUCATION STATISTICAL BOOKLET 17
3.4 Teachers
Table 3.7: Number and % of teachers per school type and professional training
Level of Education Total Trained Untrained Unknown status
Count % of total Count % of total Count % of total AES 4,801 896 19% 3,616 75% 289 6% PPR [ECD] 2,911 835 29% 2,076 71% - - PRI 40,850 7,149 18% 30,371 74% 3,330 8% SEC 4,012 2,413 60% 1,599 40% - - TTI 30 29 97% - - 1 3% TVET 119 56 47% 58 49% 5 4% UNI 800 800 100% - - - - Total 53,523 12,178 23% 37,720 70% 3,625 7%
3.5 Condition of classrooms at glance Table 3.8: Number and percentage of classrooms and PCR per school and classroom types 2018
Level of education Total Perm Semi-Perm Roof only Tent Open Air PCR
AES 2,208 841 364 91 184 728
110.9 100% 38% 16% 4% 8% 33%
PPR [ECD] 2,175 748 754 128 57 488
75.8 100% 34% 35% 6% 3% 22%
PRI 25,092 6,865 5,198 1,541 608 10,880
133.1 100% 27% 21% 6% 2% 43%
SEC 1,979 1,411 399 88 27 54
46.7 100% 71% 20% 4% 1% 3%
TTI* 12 12 - - - -
15.3 100% 100% 0% 0% 0% 0%
TVET* 25 17 - - - 8
231.5 100% 68% 0% 0% 0% 32%
Total 31,509 9,910 6,716 1,849 876 12,158
117.3 100% 31% 21% 6% 3% 39%
The formula below was used when computing the PCR (Pupil-Classroom-Ratio)
!"# = !"#$% !"#$%&!"' !" ! !"#$% !"#$ !" !"#$$%!" !" !"#$ !"#$$%&&'$ + !" !" !"#$ − !"#$ !"#$$%&&'$
*This data is present only in aggregate form. The details of these per state are not available.
Data related to Universities was not provided in this report. This is also the reason why the classroom data for universities is not presented in chapter 10 of this report.
Table 3.6:Population of teachers
Level of Education Total Male Female % Male % Female PTR AES 4,801 4,323 478 90.04% 9.96% 27.8 PPR [ECD] 2,911 1,558 1,353 53.52% 46.48% 39.1 PRI 40,850 36,037 4,813 88.22% 11.78% 39.3 SEC 4,012 3,792 220 94.52% 5.48% 21.1 TTI 30 23 7 76.67% 23.33% 6.1 TVET 119 109 10 91.60% 8.40% 33.1 UNI 800 718 82 89.75% 10.25% 10.2 Total 53,523 46,560 6,963 86.99% 13.01% 36.4

EMIS 2018 NATIONAL EDUCATION STATISTICAL BOOKLET 18
Table 3.9: Level of damage of schools States Total Not damaged Partially damaged Completely damaged Unknown status CEQ 586 209 219 35 123
Jubek 416 163 144 9 100 Terekeka 43 18 16 4 5 Yei River 127 28 59 22 18
EEQ 429 94 187 37 111 Kapoeta 133 29 59 5 40 Torit 296 65 128 32 71
JON 403 62 184 99 58 Akobo 40 3 21 9 7 Bieh 61 5 22 24 10 Boma 21 2 16 2 1 Fangak 125 18 43 46 18 Jonglei 156 34 82 18 22
LAK 529 178 131 28 192 Eastern Lakes 158 53 36 13 56 Gok 147 46 52 6 43 Western Lakes 224 79 43 9 93
NBG 815 295 180 39 301 Aweil 274 92 70 12 100 Aweil East 252 76 68 14 94 Lol 289 127 42 13 107
UNI 410 71 161 81 97 Northern Liech 173 19 64 36 54 Ruweng 77 18 40 7 12 Southern Liech 160 34 57 38 31
UPN 269 65 105 31 68 Central Upper Nile 77 18 36 11 12 Fashoda 16 - 10 2 4 Latjor 101 23 24 11 43 Maiwut 19 5 11 3 - Northern Upper Nile 56 19 24 4 9
WAR 988 332 291 39 326 Abyei AA 31 6 17 2 6 Gogrial 440 156 118 16 150 Tonj 333 96 90 16 131 Twic 184 74 66 5 39
WBG 325 104 100 44 77 Wau 325 104 100 44 77
WEQ 653 121 217 75 240 Amadi 193 20 69 18 86 Gbudwe 199 42 59 32 66 Maridi 104 28 39 11 26 Tambura 157 31 50 14 62
Grand Total 5,407 1,531 1,775 508 1,593

EMIS 2018 NATIONAL EDUCATION STATISTICAL BOOKLET 19
3.6 Drinking water Table 3.10: Number and % of schools with/without access to drinking water per level of education, 2018
Level of education
Total Total response
Access No access %Total response
%Access %No access
AES 646 436 379 57 67.5% 58.7% 8.8% PPR [ECD] 591 488 424 64 82.6% 71.7% 10.8% PRI 3,848 3,612 2,994 618 93.9% 77.8% 16.1% SEC 297 287 234 53 96.6% 78.8% 17.8% TTI 3 2 2 - 66.7% 66.7% - TVET 13 8 7 1 61.5% 53.8% 7.7% Total 5,398 4,833 4,040 793 89.5% 74.8% 14.7%
Table 3.11: Sources of drinking water (2018)
Source of drinking Percentage of schools that have access Borehole 53% Well 16% River 18% Rain water 13%
3.7 Latrines Table 3.12a: Number and % of schools with access to latrines for pupils
Level of education Total Total Resp.
Access No access %Total Resp.
% Access % No access
AES 646 357 247 110 55.3% 38.2% 17.1% PPR (ECD) 591 488 410 78 82.6% 69.4% 13.2% PRI 3848 3038 1835 1203 79.0% 47.7% 31.3% SEC 297 264 236 28 88.9% 79.5% 9.4% Total 5382 4147 2729 1418 77.1% 50.7% 26.4%
Table 3.12b: Number and % of schools with access to latrines for teachers Level of education Total Total
Resp. Access No access %Total
Resp. % Access % No access
AES 646 379 276 103 58.7% 42.7% 15.9% PPR (ECD) 591 492 410 82 83.2% 69.4% 13.9% PRI 3848 2873 1767 1106 74.7% 45.9% 28.7% SEC 297 273 247 26 91.9% 83.2% 8.8% Total 5382 4017 2699 1318 74.6% 50.1% 24.5%

EMIS 2018 NATIONAL EDUCATION STATISTICAL BOOKLET 20
3.8 Support to girls through cash transfer Table 3.13: Number of schools that received cash transfer for girls by state (2018)
States PRI SEC Total CEQ 201 13 214
Jubek 147 10 157 Terekeka 23 - 23 Yei River 31 3 34
EEQ 142 13 155 Kapoeta 40 1 41 Torit 102 12 114
JON 151 8 159 Akobo 11 - 11 Bieh 16 - 16 Boma 9 1 10 Fangak 33 2 35 Jonglei 82 5 87
LAK 276 4 280 Eastern Lakes 75 3 78 Gok 72 - 72 Western Lakes 129 1 130
NBG 382 21 403 Aweil 114 14 128 Aweil East 129 4 133 Lol 139 3 142
UNI 144 4 148 Northern Liech 65 - 65 Ruweng 25 1 26 Southern Liech 54 3 57
UPN 82 2 84 Central Upper Nile 15 1 16 Fashoda 3 - 3 Latjor 32 - 32 Maiwut 2 - 2 Northern Upper Nile 30 1 31
WAR 497 14 511 Abyei AA 5 1 6 Gogrial 208 5 213 Tonj 162 4 166 Twic 122 4 126
WBG 179 9 188 Wau 179 9 188
WEQ 199 11 210 Amadi 60 2 62 Gbudwe 59 4 63 Maridi 27 3 30 Tambura 53 2 55
Grand Total 2,253 99 2,352

EMIS 2018 NATIONAL EDUCATION STATISTICAL BOOKLET 21
Table 3.14: Number of girls supported through cash transfer in 2018 States PRI SEC Total CEQ 13,923 1,087 15,010
Jubek 12,414 1,087 13,501 Terekeka 660 - 660 Yei River 849 - 849
EEQ 5,394 740 6,134 Kapoeta 946 37 983 Torit 4,448 703 5,151
JON 4,142 161 4,303 Akobo 143 - 143 Bieh 125 - 125 Boma 48 - 48 Fangak 254 - 254 Jonglei 3,572 161 3,733
LAK 19,117 175 19,292 Eastern Lakes 4,471 150 4,621 Gok 4,665 - 4,665 Western Lakes 9,981 25 10,006
NBG 19,345 1,218 20,563 Aweil 7,606 1,096 8,702 Aweil East 4,545 29 4,574 Lol 7,194 93 7,287
UNI 9,035 20 9,055 Northern Liech 4,719 - 4,719 Ruweng 1,026 - 1,026 Southern Liech 3,290 20 3,310
UPN 4,061 14 4,075 Central Upper Nile 305 14 319 Fashoda - - - Latjor 2,129 - 2,129 Maiwut - - - Northern Upper Nile 1,627 - 1,627
WAR 25,488 779 26,267 Abyei AA - - - Gogrial 13,239 414 13,653 Tonj 5,058 9 5,067 Twic 7,191 356 7,547
WBG 10,244 995 11,239 Wau 10,244 995 11,239
WEQ 6,386 409 6,795 Amadi 1,118 - 1,118 Gbudwe 2,924 191 3,115 Maridi 952 211 1,163 Tambura 1,392 7 1,399
Grand Total 117,135 5,598 122,733

EMIS 2018 NATIONAL EDUCATION STATISTICAL BOOKLET 22
4. Number of schools by type and ownership
Table 4.1: Number and percentage of schools per level of education and ownership Level of education Total Gov Non-gov Gov % Non-gov % AES 646 476 170 73.7% 26.3% PPR [ECD] 591 189 402 32.0% 68.0% PRI 3,848 2,581 1,267 67.1% 32.9% SEC 297 139 158 46.8% 53.2% TTI 3 1 2 33.3% 66.7% TVET 13 5 8 38.5% 61.5% UNI 9 3 6 33.3% 66.7% Total 5,407 3,394 2,013 62.8% 37.2%
Figure 4.1: Ownership of institutions, 2018.
476
189
2,58
1
139
1 5 3
170 40
2
1,26
7
158
2 8 6
AES PPR [ECD] PRI SEC TTI TVET UNI
Type and ownership of schools/institutions, 2018
Gov Non-gov

EMIS 2018 NATIONAL EDUCATION STATISTICAL BOOKLET 23
5. Number of schools by state and ownership. This is presented in terms of the different levels of learning.
a) Early child development education (Pre-primary level of learning)
Table 5.1a: PPR [ECD] school ownership by state (2012, 2013 & 2018) Name of state Year Total Gov Non-gov Gov % Non-gov %
Former Central Equatoria 2018 184 21 163 11.4% 88.6% 2013 246 52 194 21.1% 78.9% 2012 219 43 176 19.6% 80.4%
Former Eastern Equatoria 2018 93 43 50 46.2% 53.8% 2013 93 46 47 49.5% 50.5% 2012 106 58 48 54.7% 45.3%
Former Jonglei 2018 27 14 13 51.9% 48.1%
2013 27 16 11 59.3% 40.7% 2012 36 19 17 52.8% 47.2%
Fromer Lakes 2018 35 23 12 65.7% 34.3% 2013 38 32 6 84.2% 15.8% 2012 37 30 7 81.1% 18.9%
Fomer Northen Bahr El Ghazal 2018 8 1 7 12.5% 87.5% 2013 37 16 21 43.2% 56.8% 2012 10 2 8 20.0% 80.0%
Former Unity 2018 43 27 16 62.8% 37.2% 2013 10 9 1 90.0% 10.0% 2012 6 4 2 66.7% 33.3%
Former Upper Nile 2018 42 20 22 47.6% 52.4%
2013 43 17 26 39.5% 60.5% 2012 47 14 33 29.8% 70.2%
Former Warrap 2018 24 7 17 29.2% 70.8% 2013 21 13 8 61.9% 38.1% 2012 9 3 6 33.3% 66.7%
Former Western Bahr El Ghazal 2018 13 3 10 23.1% 76.9%
2013 69 38 31 55.1% 44.9% 2012 54 32 22 59.3% 40.7%
Former Western Equatoria 2018 122 30 92 24.6% 75.4% 2013 68 28 40 41.2% 58.8% 2012 47 18 29 38.3% 61.7%
Total 2018 591 189 402 32.0% 68.0% 2013 652 267 385 41.0% 59.0% 2012 571 223 348 39.1% 60.9%
Basing on the overview, there was an increase in the proportion of non-government schools in 2018 as compared to 2013 and 2012. The same is reflected in the absolute increments in the number of total non-government schools (from 385 to 402). This is further reflected by increments per schools at state level. Out of 10 states, only four (4) had declining numbers of schools in absolute terms. These are Central Equatoria (CEQ), Northern Bahr El Ghazal (NBG), Upper Nile (UPN) and Western Bahr El Ghazal (WBG).
Unlike the non-government schools, the government owned schools declined between 2013 and 2018 (267 to 189). Only three states indicated increase in the number of government owned schools. These are Unity (UNI) Upper Nile (UPN) and Western Equatoria (WEQ). This therefore explains the overall decline in the number of government schools

EMIS 2018 NATIONAL EDUCATION STATISTICAL BOOKLET 24
Table 5.1b: Ownership of PPR [ECD] school by new states, 2018 States Total Gov Non-gov %Gov %Non-gov CEQ 184 21 163 11.4% 88.6%
Jubek 154 13 141 8.4% 91.6% Terekeka 2 - 2 - 100.0% Yei River 28 8 20 28.6% 71.4%
EEQ 93 43 50 46.2% 53.8% Kapoeta 32 24 8 75.0% 25.0% Torit 61 19 42 31.1% 68.9%
JON 27 14 13 51.9% 48.1% Akobo 6 6 - 100.0% - Bieh 4 1 3 25.0% 75.0% Fangak 10 4 6 40.0% 60.0% Jonglei 7 3 4 42.9% 57.1%
LAK 35 23 12 65.7% 34.3% Eastern Lakes 18 12 6 66.7% 33.3% Gok 9 8 1 88.9% 11.1% Western Lakes 8 3 5 37.5% 62.5%
NBG 8 1 7 12.5% 87.5% Aweil 3 - 3 - 100.0% Aweil East 2 1 1 50.0% 50.0% Lol 3 - 3 - 100.0%
UNI 43 27 16 62.8% 37.2% Northern Liech 1 1 - 100.0% - Ruweng 10 2 8 20.0% 80.0% Southern Liech 32 24 8 75.0% 25.0%
UPN 42 20 22 47.6% 52.4% Central Upper Nile 26 16 10 61.5% 38.5% Fashoda 5 2 3 40.0% 60.0% Latjor 6 2 4 33.3% 66.7% Maiwut 3 - 3 - 100.0% Northern Upper Nile 2 - 2 - 100.0%
WAR 24 7 17 29.2% 70.8% Abyei AA 2 - 2 - 100.0% Gogrial 17 7 10 41.2% 58.8% Tonj 3 - 3 - 100.0% Twic 2 - 2 - 100.0%
WBG 13 3 10 23.1% 76.9% Wau 13 3 10 23.1% 76.9%
WEQ 122 30 92 24.6% 75.4% Amadi 30 9 21 30.0% 70.0% Gbudwe 45 9 36 20.0% 80.0% Maridi 17 2 15 11.8% 88.2% Tambura 30 10 20 33.3% 66.7%
Grand Total 591 189 402 32.0% 68.0%
Information in Table 5.1b indicates that there are some schools that are either entirely owned by government or entirely owned by non-government entities. This is reflected in Abyei AA, Akobo, Aweil, Lol, Maiwut, Northern Liech, Northern Upper Nile, Terekeka, Tonj and Twic. The other states have schools owned by both government and non-governemnt entities. Overall however, there are more states with non-government owned schools than government owned schools in South Sudan.

EMIS 2018 NATIONAL EDUCATION STATISTICAL BOOKLET 25
b) Primary level of education
Table 5.2a: Number of primary schools per state 2011 – 2018 Name of state Year Total Gov Non-gov Gov % Non-gov %
Former Central Equatoria 2018 323 128 195 39.6% 60.4% 2013 515 292 223 56.7% 43.3% 2012 473 270 203 57.1% 42.9%
Former Eastern Equatoria 2018 253 178 75 70.4% 29.6% 2013 298 220 78 73.8% 26.2% 2012 302 225 77 74.5% 25.5%
Former Jonglei 2018 325 217 108 66.8% 33.2% 2013 430 349 81 81.2% 18.8% 2012 462 346 116 74.9% 25.1%
Fromer Lakes 2018 396 363 33 91.7% 8.3% 2013 317 276 41 87.1% 12.9% 2012 306 263 43 85.9% 14.1%
Fomer Northen Bahr El Ghazal 2018 634 459 175 72.4% 27.6% 2013 475 344 131 72.4% 27.6% 2012 442 325 117 73.5% 26.5%
Former Unity 2018 305 256 49 83.9% 16.1% 2013 284 246 38 86.6% 13.4% 2012 300 257 43 85.7% 14.3%
Former Upper Nile 2018 180 96 84 53.3% 46.7% 2013 418 305 113 73.0% 27.0% 2012 398 296 102 74.4% 25.6%
Former Warrap 2018 798 512 286 64.2% 35.8% 2013 508 383 125 75.4% 24.6% 2012 459 349 110 76.0% 24.0%
Former Western Bahr El Ghazal 2018 266 141 125 53.0% 47.0% 2013 186 121 65 65.1% 34.9% 2012 178 126 52 70.8% 29.2%
Former Western Equatoria 2018 368 231 137 62.8% 37.2% 2013 335 249 86 74.3% 25.7% 2012 319 216 103 67.7% 32.3%
Total 2018 3,848 2,581 1,267 67.1% 32.9% 2013 3,766 2,785 981 74.0% 26.0% 2012 3,639 2,673 966 73.5% 26.5%
Information in Table 5.2a indicates that there is a general increase in the number of schools between 2013 and 2018. Precisely, there is an increment of about 2.2% of total schools between 2013 and 2018. There is also an increase in the total number of primary schools between 2012 and 2013 amounting to 127 schools (3.5%). Basing on this therefore, the increment in number of primary schools between 2013 and 2018 is less than the increment between 2012 and 2013.
Though the overall number of primary schools has been increasing over the years, the number of government schools declined between 2013 and 2018 from 2,785 schools to 2,581 schools. This represents a decline of 7.3%. During the same period, the non-government schools increased by 286 (29.2%). There was therefore a significant increase in the number of non-government schools between 2013 and 2018. This increment is existent in Jonglei, Northern Bahr El Ghazal, Unity, Warrap, Western Bahr El Ghazal and Western Equatoria.
For purposes of reflecting the ownership level of schools in both new and old states, Table 5.2b is presented.

EMIS 2018 NATIONAL EDUCATION STATISTICAL BOOKLET 26
Table 5.2b: Ownership of PRI school by states, 2018 States Total Gov Non-gov %Gov %Non-gov CEQ 323 128 195 39.6% 60.4%
Jubek 206 60 146 29.1% 70.9% Terekeka 37 19 18 51.4% 48.6% Yei River 80 49 31 61.3% 38.8%
EEQ 253 178 75 70.4% 29.6% Kapoeta 68 56 12 82.4% 17.6% Torit 185 122 63 65.9% 34.1%
JON 325 217 108 66.8% 33.2% Akobo 32 26 6 81.3% 18.8% Bieh 54 16 38 29.6% 70.4% Boma 18 16 2 88.9% 11.1% Fangak 107 65 42 60.7% 39.3% Jonglei 114 94 20 82.5% 17.5%
LAK 396 363 33 91.7% 8.3% Eastern Lakes 103 90 13 87.4% 12.6% Gok 111 108 3 97.3% 2.7% Western Lakes 182 165 17 90.7% 9.3%
NBG 634 459 175 72.4% 27.6% Aweil 197 153 44 77.7% 22.3% Aweil East 214 139 75 65.0% 35.0% Lol 223 167 56 74.9% 25.1%
UNI 305 256 49 83.9% 16.1% Northern Liech 155 133 22 85.8% 14.2% Ruweng 51 28 23 54.9% 45.1% Southern Liech 99 95 4 96.0% 4.0%
UPN 180 96 84 53.3% 46.7% Central Upper Nile 31 21 10 67.7% 32.3% Fashoda 8 6 2 75.0% 25.0% Latjor 85 24 61 28.2% 71.8% Maiwut 12 7 5 58.3% 41.7% Northern Upper Nile 44 38 6 86.4% 13.6%
WAR 798 512 286 64.2% 35.8% Abyei AA 25 23 2 92.0% 8.0% Gogrial 345 170 175 49.3% 50.7% Tonj 262 208 54 79.4% 20.6% Twic 166 111 55 66.9% 33.1%
WBG 266 141 125 53.0% 47.0% Wau 266 141 125 53.0% 47.0%
WEQ 368 231 137 62.8% 37.2% Amadi 116 72 44 62.1% 37.9% Gbudwe 102 59 43 57.8% 42.2% Maridi 55 36 19 65.5% 34.5% Tambura 95 64 31 67.4% 32.6%
Grand Total 3,848 2,581 1,267 67.1% 32.9%
General information in both tables (Table 5.2a and 5.2b) indicate that government schools are more than non-government schools (67.1% government, 32.9% Non-government). The state with the highest number of non-government owned schools is Gogrial (175 Non-government owned primary schools) while the state with the highest number of government owned schools is Tonj (208 government owned primary schools).
EMIS 2018 NATIONAL EDUCATION STATISTICAL BOOKLET 27
c) Secondary level of education
Table 5.3a: No & % of SEC ownership by state (2018, 2013 & 2012) Name of state Year Total Gov Non-gov % Gov % Non-Gov
Former Central Equatoria 2018 43 11 32 25.6% 74.4% 2013 46 23 23 50.0% 50.0% 2012 65 30 35 46.2% 53.8%
Former Eastern Equatoria 2018 30 16 14 53.3% 46.7% 2013 24 19 5 79.2% 20.8% 2012 26 19 7 73.1% 26.9%
Former Jonglei 2018 19 12 7 63.2% 36.8% 2013 14 7 7 50.0% 50.0% 2012 11 5 6 45.5% 54.5%
Fromer Lakes 2018 17 10 7 58.8% 41.2% 2013 9 5 4 55.6% 44.4% 2012 12 9 3 75.0% 25.0%
Fomer Northen Bahr El Ghazal 2018 51 20 31 39.2% 60.8% 2013 25 11 14 44.0% 56.0% 2012 23 11 12 47.8% 52.2%
Former Unity 2018 13 10 3 76.9% 23.1% 2013 12 12 - 100.0% - 2012 12 11 1 91.7% 8.3%
Former Upper Nile 2018 12 5 7 41.7% 58.3% 2013 34 19 15 55.9% 44.1% 2012 34 23 11 67.6% 32.4%
Former Warrap 2018 46 26 20 56.5% 43.5% 2013 19 14 5 73.7% 26.3% 2012 17 9 8 52.9% 47.1%
Former Western Bahr El Ghazal 2018 30 12 18 40.0% 60.0% 2013 24 15 9 62.5% 37.5% 2012 21 13 8 61.9% 38.1%
Former Western Equatoria 2018 36 17 19 47.2% 52.8% 2013 29 23 6 79.3% 20.7% 2012 21 16 5 76.2% 23.8%
Totals 2018 297 139 158 46.8% 53.2% 2013 236 148 88 62.7% 37.3% 2012 242 146 96 60.3% 39.7%
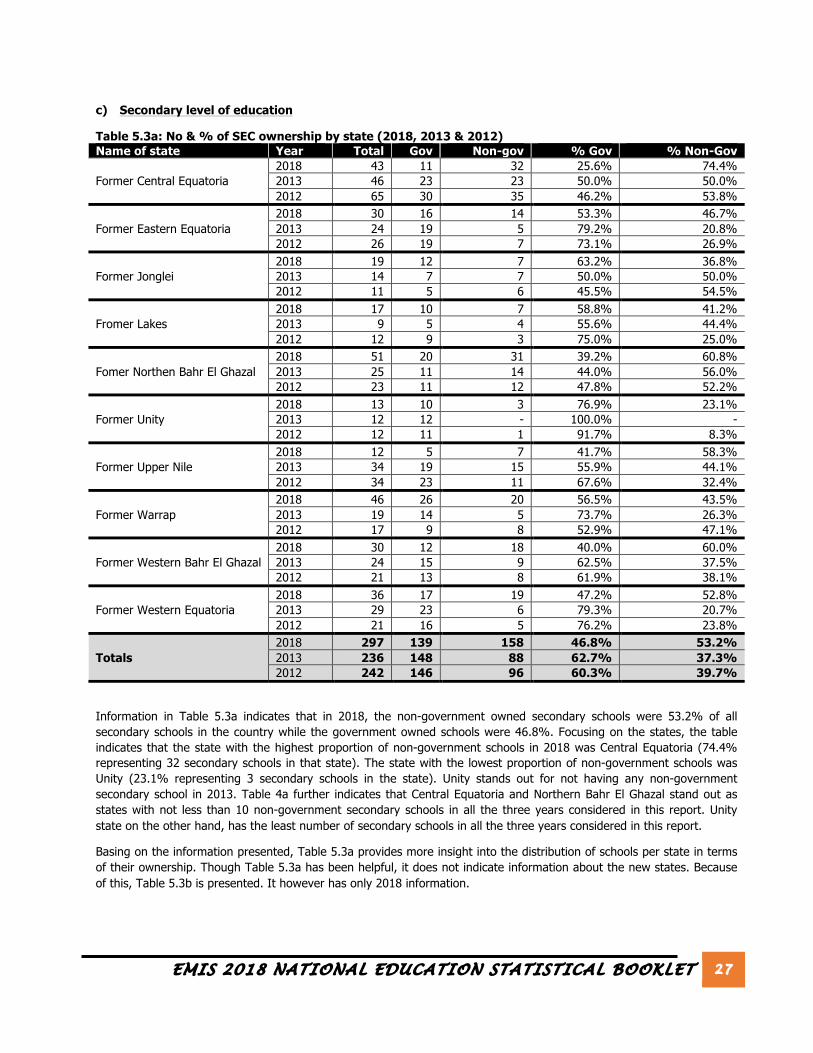
Information in Table 5.3a indicates that in 2018, the non-government owned secondary schools were 53.2% of all secondary schools in the country while the government owned schools were 46.8%. Focusing on the states, the table indicates that the state with the highest proportion of non-government schools in 2018 was Central Equatoria (74.4% representing 32 secondary schools in that state). The state with the lowest proportion of non-government schools was Unity (23.1% representing 3 secondary schools in the state). Unity stands out for not having any non-government secondary school in 2013. Table 4a further indicates that Central Equatoria and Northern Bahr El Ghazal stand out as states with not less than 10 non-government secondary schools in all the three years considered in this report. Unity state on the other hand, has the least number of secondary schools in all the three years considered in this report.
Basing on the information presented, Table 5.3a provides more insight into the distribution of schools per state in terms of their ownership. Though Table 5.3a has been helpful, it does not indicate information about the new states. Because of this, Table 5.3b is presented. It however has only 2018 information.

EMIS 2018 NATIONAL EDUCATION STATISTICAL BOOKLET 28
Table 5.3b: No & % of Gov and Non-gov secondary schools, 2018 States Total Gov Non-gov %Gov %Non-gov CEQ 43 11 32 25.6% 74.4%
Jubek 29 8 21 27.6% 72.4% Terekeka 2 1 1 50.0% 50.0% Yei River 12 2 10 16.7% 83.3%
EEQ 30 16 14 53.3% 46.7% Kapoeta 6 5 1 83.3% 16.7% Torit 24 11 13 45.8% 54.2%
JON 19 12 7 63.2% 36.8% Boma 1 1 - 100.0% - Fangak 6 6 - 100.0% - Jonglei 12 5 7 41.7% 58.3%
LAK 17 10 7 58.8% 41.2% Eastern Lakes 8 4 4 50.0% 50.0% Gok 2 1 1 50.0% 50.0% Western Lakes 7 5 2 71.4% 28.6%
NBG 51 20 31 39.2% 60.8% Aweil 25 10 15 40.0% 60.0% Aweil East 11 5 6 45.5% 54.5% Lol 15 5 10 33.3% 66.7%
UNI 13 10 3 76.9% 23.1% Northern Liech 3 3 - 100.0% - Ruweng 4 1 3 25.0% 75.0% Southern Liech 6 6 - 100.0% -
UPN 12 5 7 41.7% 58.3% Central Upper Nile 4 2 2 50.0% 50.0% Fashoda 1 1 - 100.0% - Latjor 1 - 1 - 100.0% Northern Upper Nile 6 2 4 33.3% 66.7%
WAR 46 26 20 56.5% 43.5% Abyei AA 2 2 - 100.0% - Gogrial 22 11 11 50.0% 50.0% Tonj 14 8 6 57.1% 42.9% Twic 8 5 3 62.5% 37.5%
WBG 30 12 18 40.0% 60.0% Wau 30 12 18 40.0% 60.0%
WEQ 36 17 19 47.2% 52.8% Amadi 9 8 1 88.9% 11.1% Gbudwe 13 4 9 30.8% 69.2% Maridi 7 3 4 42.9% 57.1% Tambura 7 2 5 28.6% 71.4%
Grand Total 297 139 158 46.8% 53.2%
Information in Table 5.3b provides a more detailed view of secondary school ownership in 2018. There are more states identified that did not have any non-government owned secondary school in 2018. These are Boma, Fangak, Northern Liech, Southern Liech, Fashoda and Abyei AA. Latjor is the only state that did not have any government owned secondary schools in 2018.
Wau state takes a lead with the highest number of government owned schools in 2018. Jubek takes a lead in having the highest number of non-government owned schools in 2018 followed by Wau state. Wau also stands out for having the highest total number of secondary schools in the country. States with the least total number of secondary schools are Fashoda, Latjor and Boma. These states have only 1 secondary school each.

EMIS 2018 NATIONAL EDUCATION STATISTICAL BOOKLET 29
d) Alternative Education System (AES)
Table 5.4: No & % of Gov and Non-gov AES centers, 2018 States Total Gov Non-gov %Gov %Non-gov CEQ 26 14 12 53.8% 46.2%
Jubek 17 6 11 35.3% 64.7% Terekeka 2 1 1 50.0% 50.0% Yei River 7 7 - 100.0% -
EEQ 49 35 14 71.4% 28.6% Kapoeta 25 19 6 76.0% 24.0% Torit 24 16 8 66.7% 33.3%
JON 32 23 9 71.9% 28.1% Akobo 2 2 - 100.0% - Bieh 3 1 2 33.3% 66.7% Boma 2 - 2 - 100.0% Fangak 2 2 - 100.0% - Jonglei 23 18 5 78.3% 21.7%
LAK 78 66 12 84.6% 15.4% Eastern Lakes 29 26 3 89.7% 10.3% Gok 22 20 2 90.9% 9.1% Western Lakes 27 20 7 74.1% 25.9%
NBG 122 110 12 90.2% 9.8% Aweil 49 43 6 87.8% 12.2% Aweil East 25 24 1 96.0% 4.0% Lol 48 43 5 89.6% 10.4%
UNI 49 39 10 79.6% 20.4% Northern Liech 14 14 - 100.0% - Ruweng 12 7 5 58.3% 41.7% Southern Liech 23 18 5 78.3% 21.7%
UPN 35 14 21 40.0% 60.0% Central Upper Nile 16 7 9 43.8% 56.3% Fashoda 2 1 1 50.0% 50.0% Latjor 9 2 7 22.2% 77.8% Maiwut 4 1 3 25.0% 75.0% Northern Upper Nile 4 3 1 75.0% 25.0%
WAR 118 83 35 70.3% 29.7% Abyei AA 2 - 2 - 100.0% Gogrial 55 36 19 65.5% 34.5% Tonj 54 42 12 77.8% 22.2% Twic 7 5 2 71.4% 28.6%
WBG 15 8 7 53.3% 46.7% Wau 15 8 7 53.3% 46.7%
WEQ 122 84 38 68.9% 31.1% Amadi 37 21 16 56.8% 43.2% Gbudwe 35 27 8 77.1% 22.9% Maridi 25 18 7 72.0% 28.0% Tambura 25 18 7 72.0% 28.0%
Grand Total 646 476 170 73.7% 26.3%
Information in Table 5.4 indicates that 73.7% of the AES centers are owned by government and 26.3% of them are owned by the non-government entities. The states with the highest proportion of government owned AES centers are Akobo, Yei River, Fangak and Northern Liech states. The AES centers in these states are 100% owned by government. The states with the highest proportion of non-government entities are Abyei AA and Boma states. The AES centers in these states are also 100% owned by the non-government entities.
Relating the former states with the new states, information in Figure 5.1 is presented. It helps to indicate the number of government and non-government AES centers by the former states.

EMIS 2018 NATIONAL EDUCATION STATISTICAL BOOKLET 30
Figure 5.1: Gov and Non-gov AES centers by state, 2018
Information in Figure 5.1 indicates that Northern Bahr El Ghazal state has the highest number of AES centers followed by Warrap and Western Equatoria. The state with the lowest number of government owned AES centers is Western Bahr El Ghazal. Comparing the government and non-government owned AES centers across the different states indicates that government owned AES centers are more than the non-government owned AES centers in all the former states. This same information is presented in Table 5.4 though the table (Table 5.4) has a mixture of both new and former states.
Presenting number of AES centers per former states is good but it does not indicate the proportion ownership at state level. The percentages are already presented in Table 5.4. They are however presented once again in Figure 5.2 focusing only on the former states.
Figure 5.2: Gov and Non-gov AES centers by state (Percentages), 2018
Information in Figure 5.2 helps to confirm what is presented in Table 5.4 in the sense that the proportion of government owned AES centers is higher than the proportion for non-government owned AES centers in all the former states with an exception of Upper Nile state. This presentation however does not take into account the cases of AES centers being wholly owned by non-government entities in new states such as Abyei AA. This therefore means that information in Table 5.4 and that in Figure 5.2 complement each other.
14
35
23
66
11
0
39
14
83
8
84
12
14
9 12
12
10
21
35
7
38
CEQ EEQ JON LAK NBG UNI UPN WAR WBG WEQ
Number of Gov and Non-gov AES centers, 2018
Gov Non-Gov 53
.8%
71.4
%
71.9
%
84.6
%
90.2
%
79.6
%
40.0
% 70
.3%
53.3
%
68.9
%
46.2
%
28.6
%
28.1
%
15.4
%
9.8%
20.4
%
60.0
%
29.7
%
46.7
%
31.1
%
CEQ EEQ JON LAK NBG UNI UPN WAR WBG WEQ
Percentage of Gov and Non-gov AES centers by state, 2018
Gov Non-Gov

EMIS 2018 NATIONAL EDUCATION STATISTICAL BOOKLET 31
e) Technical Vocational Education and Training
Table 5.5: No & % formal and non-formal TVETs by ownership, 2018 States Total Gov Non-gov %Gov %Non-gov CEQ 4 3 1 75% 25%
Jubek 4 3 1 75% 25% EEQ 3 1 2 33% 67%
Kapoeta 2 - 2 - 100% Torit 1 1 - 100% -
LAK 2 - 2 - 100% Gok 2 - 2 - 100%
WAR 1 - 1 - 100% Twic 1 - 1 - 100%
WBG 1 - 1 - 100% Wau 1 - 1 - 100%
WEQ 2 1 1 50% 50% Amadi 1 - 1 - 100% Gbudwe 1 1 - 100% -
Grand Total 13 5 8 38% 62%
f) Teacher Training Institutes (TTIs)
Table 5.6: No & % of Gov and Non-gov TTIs, 2018 States Total Gov Non-gov %Gov %Non-gov EEQ 1 1 - 100% -
Torit 1 1 - 100% - LAK 1 - 1 - 100%
Gok 1 - 1 - 100% WEQ 1 - 1 - 100%
Gbudwe 1 - 1 - 100% Grand Total 3 1 2 33% 67%
g) Universities
Table 5.7: No & % of Gov and Non-gov universities, 2018 States Total Gov Non-gov %Gov %Non-gov CEQ 6 2 4 33% 67%
Jubek 6 2 4 33% 67% WAR 1 1 - 100% -
Gogrial 1 1 - 100% - WEQ 2 - 2 - 100%
Gbudwe 2 - 2 - 100% Grand Total 9 3 6 33% 67%

EMIS 2018 NATIONAL EDUCATION STATISTICAL BOOKLET 32
6. Number of AES learners by program and grade
Table 6.1: Number of AES learners by grade and program, 2018 AES programs L/G 1 L/G 2 L/G 3 L/G 4 Total ALP 49,401 39,895 28,515 11,630 129,441 BALP 539 257 130 155 1,081 CGS 923 688 445 217 2,273 FALP 309 80 21 16 426 IEC - - 69 - 69 PEP 181 73 59 25 338 Total 51,353 40,993 29,239 12,043 133,628
Figure 6.1: AES learners by program and grade, 2018
7. Number of students/pupils/learners by level of education and gender
Table 7.1: Number and percentage of learners per level of education and gender Level of education Total Male Female % Male % Female AES 133,628 73,024 60,604 54.6% 45.4% PPR [ECD] 113,824 61,251 52,573 53.8% 46.2% PRI 1,605,091 916,336 688,755 57.1% 42.9% SEC 84,562 54,744 29,818 64.7% 35.3% TTI 183 146 37 79.8% 20.2% TVET* 3,935 2,451 1,484 62.3% 37.7% UNI 8,199 6,332 1,867 77.2% 22.8% Total 1,949,422 1,114,284 835,138 57.2% 42.8%
*There are two types of TVETs; Formal and informal. Total for formal is 2,957 and that for informal is 978. Total for both is therefore 3,935. Details of this are presented in chapter 8 of this report.
49,4
01
539
923
309
- 181
39,8
95
257
688
80
- 73
28,5
15
130
445
21
69
59
11,6
30
155
217
16
- 25
ALP BALP CGS FALP IEC PEP
AES learners by grade and program, 2018
L/G 1 L/G 2 L/G 3 L/G 4

EMIS 2018 NATIONAL EDUCATION STATISTICAL BOOKLET 33
8. Number of students/pupils/learners by state and gender
This is presented for every school type in the subsections below. a) Pre – primary level of education (Early Childhood Development Education)
Table 8.1: Number and % of PPR [ECD] enrolment by state and gender (2012,2013 & 2018) Name of state Year Total Male Female %Male %Female
Former Central Equatoria 2018 35,417 18,221 17,196 51.4% 48.6% 2013 28,992 14,638 14,354 50.5% 49.5% 2012 27,262 13,957 13,305 51.2% 48.8%
Former Eastern Equatoria 2018 15,573 8,376 7,197 53.8% 46.2% 2013 12,127 6,035 6,092 49.8% 50.2% 2012 15,034 7,869 7,165 52.3% 47.7%
Former Jonglei 2018 8,689 5,094 3,595 58.6% 41.4% 2013 4,805 2,764 2,041 57.5% 42.5% 2012 6,635 3,560 3,075 53.7% 46.3%
Fromer Lakes 2018 7,760 4,513 3,247 58.2% 41.8% 2013 4,256 2,764 1,492 64.9% 35.1% 2012 4,770 2,948 1,822 61.8% 38.2%
Fomer Northen Bahr El Ghazal 2018 708 376 332 53.1% 46.9% 2013 5,294 2,562 2,732 48.4% 51.6% 2012 1,038 602 436 58.0% 42.0%
Former Unity 2018 10,046 5,832 4,214 58.1% 41.9% 2013 1,366 765 601 56.0% 44.0% 2012 1,492 773 719 51.8% 48.2%
Former Upper Nile 2018 8,251 4,755 3,496 57.6% 42.4% 2013 4,417 2,277 2,140 51.6% 48.4% 2012 7,318 3,890 3,428 53.2% 46.8%
Former Warrap 2018 2,557 1,381 1,176 54.0% 46.0% 2013 3,332 2,003 1,329 60.1% 39.9% 2012 1,909 1,101 808 57.7% 42.3%
Former Western Bahr El Ghazal 2018 2,373 1,348 1,025 56.8% 43.2% 2013 4,911 2,634 2,277 53.6% 46.4% 2012 4,315 2,275 2,040 52.7% 47.3%
Former Western Equatoria 2018 22,450 11,355 11,095 50.6% 49.4% 2013 7,813 4,094 3,719 52.4% 47.6% 2012 5,204 2,593 2,611 49.8% 50.2%
Grand Total 2018 113,824 61,251 52,573 53.8% 46.2% 2013 77,313 40,536 36,777 52.4% 47.6% 2012 74,977 39,568 35,409 52.8% 47.2%
The results indicate that there has been a significant increase of about 47% (from 77,313 to 113,824) in the overall enrolment at pre-primary schools level between 2013 and 2018. There was also increase in enrolment between 2012 and 2013 of about 3% (from 74,977 to 77,313). Considering the period between 2013 and 2018, all the former states also registered increase in enrolment of pupils except for Western Bahr El Ghazal (WBG), Warrap (WAR) and Northern Bahr El Ghazal (NBG). Significant increase in enrolments at state level are visible in Western Equatoria (WEQ) and Unity (UNI). The number of males enrolled into pre-primary schools has consistently been higher than that of females for all the three years considered in the analysis. The gap is however small.

EMIS 2018 NATIONAL EDUCATION STATISTICAL BOOKLET 34
Table 8.2: Enrolment of PPR [ECD] pupils by new states, 2018 States Total Males Females %Males %Females CEQ 35,417 18,221 17,196 51.4% 48.6%
Jubek 31,107 16,070 15,037 51.7% 48.3% Terekeka 206 130 76 63.1% 36.9% Yei River 4,104 2,021 2,083 49.2% 50.8%
EEQ 15,573 8,376 7,197 53.8% 46.2% Kapoeta 4,397 2,518 1,879 57.3% 42.7% Torit 11,176 5,858 5,318 52.4% 47.6%
JON 8,689 5,094 3,595 58.6% 41.4% Akobo 1,866 1,151 715 61.7% 38.3% Bieh 863 489 374 56.7% 43.3% Boma 452 247 205 54.6% 45.4% Fangak 3,422 2,094 1,328 61.2% 38.8% Jonglei 2,086 1,113 973 53.4% 46.6%
LAK 7,760 4,513 3,247 58.2% 41.8% Eastern Lakes 3,638 2,153 1,485 59.2% 40.8% Gok 2,096 1,056 1,040 50.4% 49.6% Western Lakes 2,026 1,304 722 64.4% 35.6%
NBG 708 376 332 53.1% 46.9% Aweil 88 47 41 53.4% 46.6% Aweil East 415 213 202 51.3% 48.7% Lol 205 116 89 56.6% 43.4%
UNI 10,046 5,832 4,214 58.1% 41.9% Northern Liech 697 390 307 56.0% 44.0% Ruweng 1,755 984 771 56.1% 43.9% Southern Liech 7,594 4,458 3,136 58.7% 41.3%
UPN 8,251 4,755 3,496 57.6% 42.4% Central Upper Nile 5,055 2,784 2,271 55.1% 44.9% Fashoda 297 138 159 46.5% 53.5% Latjor 1,037 507 530 48.9% 51.1% Maiwut 1,420 1,098 322 77.3% 22.7% Northern Upper Nile 442 228 214 51.6% 48.4%
WAR 2,557 1,381 1,176 54.0% 46.0% Abyei AA 438 240 198 54.8% 45.2% Gogrial 1,444 768 676 53.2% 46.8% Tonj 495 276 219 55.8% 44.2% Twic 180 97 83 53.9% 46.1%
WBG 2,373 1,348 1,025 56.8% 43.2% Wau 2,373 1,348 1,025 56.8% 43.2%
WEQ 22,450 11,355 11,095 50.6% 49.4% Amadi 4,097 2,109 1,988 51.5% 48.5% Gbudwe 10,785 5,423 5,362 50.3% 49.7% Maridi 3,590 1,787 1,803 49.8% 50.2% Tambura 3,978 2,036 1,942 51.2% 48.8%
Grand Total 113,824 61,251 52,573 53.8% 46.2% Information in Table 8.2 indicates that most of the states have less that 10,000 pupils enrolled to pre-primary schools. This is with the exception of Gbudwe, Jubek and Torit. The district with the lowest number of pupils is Aweil with only 88 pupils enrolled.
In relation to gender, the overall enrolment of the female pupils is less than that of male pupils. The gap is about 7.6% (8,678 pupils). Considering that it is less that 10%, it is a small gap. Fashoda, Latjoor, Maridi and Yei River have more female pupils enrolled into pre-primary schools than the other states in South Sudan. The enrolment in these states has significantly contributed to reduction in the gap between female and male pupil enrolments in pre-primary schools in South Sudan.

EMIS 2018 NATIONAL EDUCATION STATISTICAL BOOKLET 35
Table 8.3 Disabled pupils in PPR [ECD] in 2018
States Baby class Middle class Top class
Grand Total Males Females Males Females Males Females
CEQ 70 41 40 29 44 22 246 Jubek 47 24 34 23 33 11 172 Yei River 23 17 6 6 11 11 74
EEQ 77 38 57 37 62 43 314 Kapoeta 35 10 27 13 28 17 130 Torit 42 28 30 24 34 26 184
JON 7 6 20 9 8 5 55 Akobo 1 - 17 5 7 4 34 Bieh 3 1 1 - - 1 6 Fangak - 1 - - - - 1 Jonglei 3 4 2 4 1 - 14
LAK 21 12 18 12 9 7 79 Eastern Lakes 3 2 1 3 - 1 10 Gok 5 4 5 5 2 2 23 Western Lakes 13 6 12 4 7 4 46
NBG - 1 - - - - 1 Lol - 1 - - - - 1
UNI 27 23 16 15 15 21 117 Northern Liech 1 - 1 - - 2 4 Ruweng 1 3 1 6 1 - 12 Southern Liech 25 20 14 9 14 19 101
UPN 35 29 23 24 25 12 148 Central Upper Nile 19 16 9 12 7 9 72 Latjor 8 4 5 8 12 1 38 Maiwut 6 7 9 4 6 2 34 Northern Upper Nile 2 2 - - - - 4
WAR - 1 5 4 2 1 13 Abyei AA - - 1 - 1 - 2 Gogrial - 1 2 1 - 1 5 Tonj - - 2 3 - - 5 Twic - - - - 1 - 1
WBG 2 3 5 5 7 7 29 Wau 2 3 5 5 7 7 29
WEQ 56 39 49 39 37 40 260 Amadi 7 13 10 7 9 12 58 Gbudwe 25 10 19 13 20 19 106 Maridi 8 6 10 6 7 9 46 Tambura 16 10 10 13 1 - 50
Grand Total 295 193 233 174 209 158 1,262
EMIS 2018 NATIONAL EDUCATION STATISTICAL BOOKLET 36
Table 8.4: Number of refugees enrolled into PPR[ECD] education level, 2018
States Baby class Middle class Top class Total Grand
Total Male Female Male Female Male Female Male Female CEQ 164 153 131 109 133 113 428 375 803
Jubek 135 128 103 94 113 99 351 321 672 Yei River 29 25 28 15 20 14 77 54 131
EEQ - - - - 1 - 1 - 1 Torit - - - - 1 - 1 - 1
JON 1 1 - - - - 1 1 2 Boma - - - - - - - - - Jonglei 1 1 - - - - 1 1 2
LAK 1 6 2 - - - 3 6 9 Eastern Lakes 1 5 2 - - - 3 5 8 Gok - 1 - - - - - 1 1
NBG 33 24 - - - - 33 24 57 Aweil 33 24 - - - - 33 24 57
UNI 88 77 72 78 86 101 246 256 502 Ruweng 88 77 72 78 86 101 246 256 502
WAR 2 1 2 2 - - 4 3 7 Gogrial 2 1 - - - - 2 1 3 Tonj - - 2 2 - - 2 2 4
WBG 14 9 7 7 5 6 26 22 48 Wau 14 9 7 7 5 6 26 22 48
WEQ 95 98 43 50 6 20 144 168 312 Amadi 2 2 - - - - 2 2 4 Gbudwe 62 79 27 30 6 17 95 126 221 Tambura 31 17 16 20 - 3 47 40 87
Grand Total 398 369 257 246 231 240 886 855 1,741 Source: EMIS Data
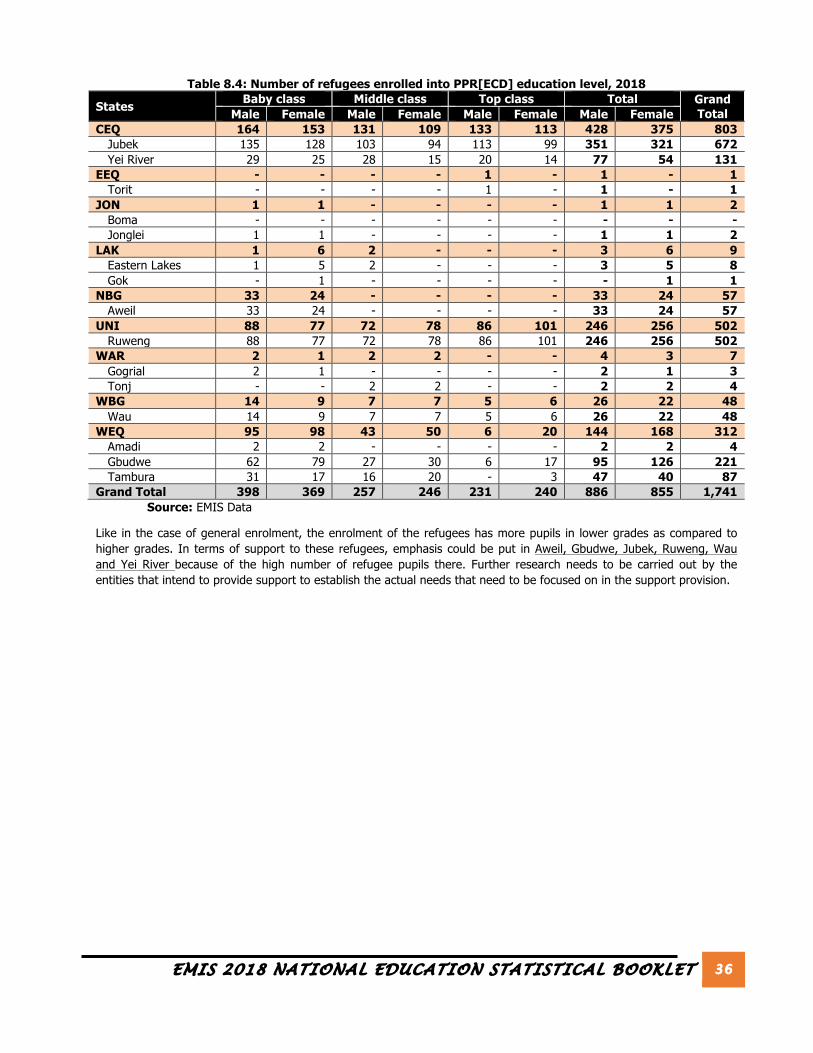
Like in the case of general enrolment, the enrolment of the refugees has more pupils in lower grades as compared to higher grades. In terms of support to these refugees, emphasis could be put in Aweil, Gbudwe, Jubek, Ruweng, Wau and Yei River because of the high number of refugee pupils there. Further research needs to be carried out by the entities that intend to provide support to establish the actual needs that need to be focused on in the support provision.
EMIS 2018 NATIONAL EDUCATION STATISTICAL BOOKLET 37
b) Primary level of education
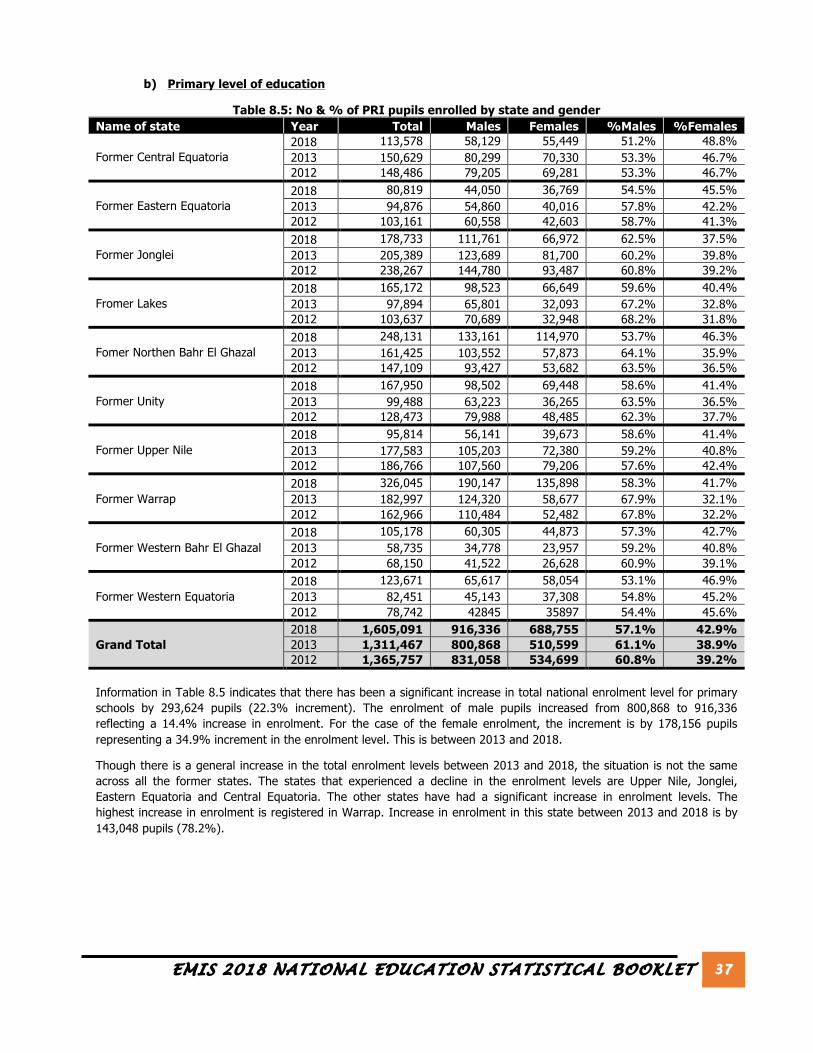
Table 8.5: No & % of PRI pupils enrolled by state and gender Name of state Year Total Males Females %Males %Females
Former Central Equatoria 2018 113,578 58,129 55,449 51.2% 48.8% 2013 150,629 80,299 70,330 53.3% 46.7% 2012 148,486 79,205 69,281 53.3% 46.7%
Former Eastern Equatoria 2018 80,819 44,050 36,769 54.5% 45.5% 2013 94,876 54,860 40,016 57.8% 42.2% 2012 103,161 60,558 42,603 58.7% 41.3%
Former Jonglei 2018 178,733 111,761 66,972 62.5% 37.5% 2013 205,389 123,689 81,700 60.2% 39.8% 2012 238,267 144,780 93,487 60.8% 39.2%
Fromer Lakes 2018 165,172 98,523 66,649 59.6% 40.4% 2013 97,894 65,801 32,093 67.2% 32.8% 2012 103,637 70,689 32,948 68.2% 31.8%
Fomer Northen Bahr El Ghazal 2018 248,131 133,161 114,970 53.7% 46.3% 2013 161,425 103,552 57,873 64.1% 35.9% 2012 147,109 93,427 53,682 63.5% 36.5%
Former Unity 2018 167,950 98,502 69,448 58.6% 41.4% 2013 99,488 63,223 36,265 63.5% 36.5% 2012 128,473 79,988 48,485 62.3% 37.7%
Former Upper Nile 2018 95,814 56,141 39,673 58.6% 41.4% 2013 177,583 105,203 72,380 59.2% 40.8% 2012 186,766 107,560 79,206 57.6% 42.4%
Former Warrap 2018 326,045 190,147 135,898 58.3% 41.7% 2013 182,997 124,320 58,677 67.9% 32.1% 2012 162,966 110,484 52,482 67.8% 32.2%
Former Western Bahr El Ghazal 2018 105,178 60,305 44,873 57.3% 42.7% 2013 58,735 34,778 23,957 59.2% 40.8% 2012 68,150 41,522 26,628 60.9% 39.1%
Former Western Equatoria 2018 123,671 65,617 58,054 53.1% 46.9% 2013 82,451 45,143 37,308 54.8% 45.2% 2012 78,742 42845 35897 54.4% 45.6%
Grand Total 2018 1,605,091 916,336 688,755 57.1% 42.9% 2013 1,311,467 800,868 510,599 61.1% 38.9% 2012 1,365,757 831,058 534,699 60.8% 39.2%
Information in Table 8.5 indicates that there has been a significant increase in total national enrolment level for primary schools by 293,624 pupils (22.3% increment). The enrolment of male pupils increased from 800,868 to 916,336 reflecting a 14.4% increase in enrolment. For the case of the female enrolment, the increment is by 178,156 pupils representing a 34.9% increment in the enrolment level. This is between 2013 and 2018.
Though there is a general increase in the total enrolment levels between 2013 and 2018, the situation is not the same across all the former states. The states that experienced a decline in the enrolment levels are Upper Nile, Jonglei, Eastern Equatoria and Central Equatoria. The other states have had a significant increase in enrolment levels. The highest increase in enrolment is registered in Warrap. Increase in enrolment in this state between 2013 and 2018 is by 143,048 pupils (78.2%).

EMIS 2018 NATIONAL EDUCATION STATISTICAL BOOKLET 38
The charts below help to emphasize the information presented in Table 8.3
Figure 8.1: PRI enrolment by gender and state, 2018
Information in Figure 8.1 re-emphasizes that enrolment of males has been higher than that of females in all the former states in South Sudan. The gap between enrolment of male and female pupils is significantly high in Warrap and Jonglei. More information is presented in Figure 8.2 below.
Figure 8.2: PRI enrolment by gender and state, 2018
Information in Figure 8.2 emphasizes the information presented in Table 8.3 in relation to enrolment levels per former states. Warrap has the highest levels of enrolment in 2018. The other states with highest enrolment in 2018 are Lakes, Northern Bahr El Ghazal, Unity, Western Bahr El Ghazal and Western Equatoria. States that have had a decline in enrolment between 2013 and 2018 are Central Equatoria, Eastern Equatoria, Jonglei and Upper Nile.
148,
486
103,
161
238,
267
103,
637
147,
109
128,
473
186,
766
162,
966
68,1
50
78,7
42 150,
629
94,8
76
205,
389
97,8
94
161,
425
99,4
88 17
7,58
3
182,
997
58,7
35
82,4
51
113,
578
80,8
19 17
8,73
3
165,
172 24
8,13
1
167,
950
95,8
14
326,
045
105,
178
123,
671
CEQ EEQ JON LAK NBG UNI UPN WAR WBG WEQ
No of pupils in PRI schools (2012, 2013 & 2018)
2012 2013 2018
58,1
29
44,0
50
111,
761
98,5
23 13
3,16
1
98,5
02
56,1
41
190,
147
60,3
05
65,6
17
55,4
49
36,7
69 66
,972
66,6
49
114,
970
69,4
48
39,6
73
135,
898
44,8
73
58,0
54
CEQ EEQ JON LAK NBG UNI UPN WAR WBG WEQ
PRI enrolment by gender and state, 2018
Male Female

EMIS 2018 NATIONAL EDUCATION STATISTICAL BOOKLET 39
The same information about enrolment is presented in Table 8.6. It is re-represented here to include the combination of former and new states.
Table 8.6: No & % of PRI pupils enrolled by state and gender States Total Male Female %Male %Female CEQ 113,578 58,129 55,449 51.2% 48.8%
Jubek 83,700 41,726 41,974 49.9% 50.1% Terekeka 10,834 6,689 4,145 61.7% 38.3% Yei River 19,044 9,714 9,330 51.0% 49.0%
EEQ 80,819 44,050 36,769 54.5% 45.5% Kapoeta 20,332 11,317 9,015 55.7% 44.3% Torit 60,487 32,733 27,754 54.1% 45.9%
JON 178,733 111,761 66,972 62.5% 37.5% Akobo 16,656 10,128 6,528 60.8% 39.2% Bieh 33,013 20,141 12,872 61.0% 39.0% Boma 10,212 6,475 3,737 63.4% 36.6% Fangak 45,265 30,733 14,532 67.9% 32.1% Jonglei 73,587 44,284 29,303 60.2% 39.8%
LAK 165,172 98,523 66,649 59.6% 40.4% Eastern Lakes 47,057 30,187 16,870 64.1% 35.9% Gok 37,761 21,407 16,354 56.7% 43.3% Western Lakes 80,354 46,929 33,425 58.4% 41.6%
NBG 248,131 133,161 114,970 53.7% 46.3% Aweil 76,988 42,577 34,411 55.3% 44.7% Aweil East 78,727 42,530 36,197 54.0% 46.0% Lol 92,416 48,054 44,362 52.0% 48.0%
UNI 167,950 98,502 69,448 58.6% 41.4% Northern Liech 86,809 51,354 35,455 59.2% 40.8% Ruweng 27,748 15,478 12,270 55.8% 44.2% Southern Liech 53,393 31,670 21,723 59.3% 40.7%
UPN 95,814 56,141 39,673 58.6% 41.4% Central Upper Nile 13,971 7,798 6,173 55.8% 44.2% Fashoda 1,790 998 792 55.8% 44.2% Latjor 34,996 20,255 14,741 57.9% 42.1% Maiwut 26,105 17,105 9,000 65.5% 34.5% Northern Upper Nile 18,952 9,985 8,967 52.7% 47.3%
WAR 326,045 190,147 135,898 58.3% 41.7% Abyei AA 9,747 5,275 4,472 54.1% 45.9% Gogrial 150,780 87,649 63,131 58.1% 41.9% Tonj 94,773 60,073 34,700 63.4% 36.6% Twic 70,745 37,150 33,595 52.5% 47.5%
WBG 105,178 60,305 44,873 57.3% 42.7% Wau 105,178 60,305 44,873 57.3% 42.7%
WEQ 123,671 65,617 58,054 53.1% 46.9% Amadi 27,689 14,738 12,951 53.2% 46.8% Gbudwe 48,255 25,622 22,633 53.1% 46.9% Maridi 15,158 8,017 7,141 52.9% 47.1% Tambura 32,569 17,240 15,329 52.9% 47.1%
Grand Total 1,605,091 916,336 688,755 57.1% 42.9% Source: EMIS Data
Table 8.6 provides a more detailed breakdown of enrolment in 2018. Though the former 10 states indicate that enrolment levels per state has been above 50,000 pupils per state, the information in Table 8.4 indicates that there are states with less than 10,000 pupils in total enrolment. These include states such as Abyei AA (9,747 pupils in total enrolment) and Fashoda (1,790 pupils in total enrolment). There is also one state, Gogrial, with total enrolment of 150,780 pupils. This is the highest level of enrolment in states with primary schools in 2018.

EMIS 2018 NATIONAL EDUCATION STATISTICAL BOOKLET 40
Table 8.7: Refugees enrolled into PRI school by state and gender (2018) States Total Male Female %Males %Females CEQ 1,552 746 806 48.1% 51.9%
Jubek 837 330 507 39.4% 60.6% Terekeka 107 88 19 82.2% 17.8% Yei River 608 328 280 53.9% 46.1%
EEQ 40 21 19 52.5% 47.5% Kapoeta 4 1 3 25.0% 75.0% Torit 36 20 16 55.6% 44.4%
JON - - - - - Akobo - - - - - Boma - - - - - Jonglei - - - - -
LAK 99 56 43 56.6% 43.4% Eastern Lakes 15 7 8 46.7% 53.3% Gok 63 42 21 66.7% 33.3% Western Lakes 21 7 14 33.3% 66.7%
NBG 1,019 476 543 46.7% 53.3% Aweil 240 107 133 44.6% 55.4% Aweil East 17 11 6 64.7% 35.3% Lol 762 358 404 47.0% 53.0%
UNI 8,877 4,721 4,156 53.2% 46.8% Northern Liech 3 - 3 - 100.0% Ruweng 8,822 4,693 4,129 53.2% 46.8% Southern Liech 52 28 24 53.8% 46.2%
UPN 569 365 204 64.1% 35.9% Fashoda 8 5 3 62.5% 37.5% Latjor 19 11 8 57.9% 42.1% Maiwut 214 179 35 83.6% 16.4% Northern Upper Nile 328 170 158 51.8% 48.2%
WAR 120 76 44 63.3% 36.7% Abyei AA 2 2 - 100.0% - Gogrial 51 31 20 60.8% 39.2% Tonj 67 43 24 64.2% 35.8% Twic - - - - -
WBG 142 77 65 54.2% 45.8% Wau 142 77 65 54.2% 45.8%
WEQ 2,066 1,010 1,056 48.9% 51.1% Amadi 16 5 11 31.3% 68.8% Gbudwe 1,714 833 881 48.6% 51.4% Maridi - - - - - Tambura 336 172 164 51.2% 48.8%
Grand Total 14,484 7,548 6,936 52.1% 47.9%

EMIS 2018 NATIONAL EDUCATION STATISTICAL BOOKLET 41
5.2.5 Disabled pupils at primary level in 2018 This subsection has information related to the disabled pupils enrolled into primary schools in South Sudan. This information is presented in Table 5.8.
Table 8.8: No and % of PRI disabled pupils, 2018 States Total Males Females %Males %Females CEQ 1,042 562 480 53.9% 46.1%
Jubek 680 331 349 48.7% 51.3% Terekeka 66 45 21 68.2% 31.8% Yei River 296 186 110 62.8% 37.2%
EEQ 1,444 811 633 56.2% 43.8% Kapoeta 293 171 122 58.4% 41.6% Torit 1,151 640 511 55.6% 44.4%
JON 1,507 862 645 57.2% 42.8% Akobo 88 52 36 59.1% 40.9% Bieh 499 282 217 56.5% 43.5% Boma 60 39 21 65.0% 35.0% Fangak 325 192 133 59.1% 40.9% Jonglei 535 297 238 55.5% 44.5%
LAK 659 434 225 65.9% 34.1% Eastern Lakes 240 156 84 65.0% 35.0% Gok 168 108 60 64.3% 35.7% Western Lakes 251 170 81 67.7% 32.3%
NBG 1,787 972 815 54.4% 45.6% Aweil 461 256 205 55.5% 44.5% Aweil East 673 352 321 52.3% 47.7% Lol 653 364 289 55.7% 44.3%
UNI 2,000 1,196 804 59.8% 40.2% Northern Liech 1,178 675 503 57.3% 42.7% Ruweng 288 206 82 71.5% 28.5% Southern Liech 534 315 219 59.0% 41.0%
UPN 946 613 333 64.8% 35.2% Central Upper Nile 51 36 15 70.6% 29.4% Fashoda 4 3 1 75.0% 25.0% Latjor 385 260 125 67.5% 32.5% Maiwut 103 71 32 68.9% 31.1% Northern Upper Nile 403 243 160 60.3% 39.7%
WAR 1,664 982 682 59.0% 41.0% Abyei AA 87 53 34 60.9% 39.1% Gogrial 822 466 356 56.7% 43.3% Tonj 290 199 91 68.6% 31.4% Twic 465 264 201 56.8% 43.2%
WBG 670 349 321 52.1% 47.9% Wau 670 349 321 52.1% 47.9%
WEQ 1,212 690 522 56.9% 43.1% Amadi 350 193 157 55.1% 44.9% Gbudwe 458 251 207 54.8% 45.2% Maridi 166 89 77 53.6% 46.4% Tambura 238 157 81 66.0% 34.0%
Grand Total 12,931 7,471 5,460 57.8% 42.2%
Source: EMIS Data
Information in Table 5.8 indicates that majority of the pupils enrolled as disabled were enrolled in Jubek, Torit, Bieh, Jonglei, Aweil East, Northern Liech, Southern Liech, Northern Upper Nile, Gogrial, Lol, Wau and Gbudwe. To be able to establish the number of pupils per a specific type of disability, a chart below with the percentages per type of disability has been provided. This helps to provide an overview of the extent to which pupils in primary schools are disabled and the kind of disability they have.

EMIS 2018 NATIONAL EDUCATION STATISTICAL BOOKLET 42
c) Secondary level of education Table 8.9: No & % of SEC enrolment by state and gender (2012, 2013 & 2018)
State Year Total Males Females % Males % Females
Former Central Equatoria 2018 17,676 10,741 6,935 60.8% 39.2% 2013 7,403 4,926 2,477 66.5% 33.5% 2012 17,344 10,720 6,624 61.8% 38.2%
Former Eastern Equatoria 2018 6,778 4,571 2,207 67.4% 32.6% 2013 4,655 3,279 1,376 70.4% 29.6% 2012 4,585 3,390 1,195 73.9% 26.1%
Former Jonglei 2018 3,781 2,878 903 76.1% 23.9% 2013 2,039 1,551 488 76.1% 23.9% 2012 836 729 107 87.2% 12.8%
Fromer Lakes 2018 9,278 6,861 2,417 73.9% 26.1% 2013 949 628 321 66.2% 33.8% 2012 4,120 3,457 663 83.9% 16.1%
Fomer Northen Bahr El Ghazal 2018 11,562 7,160 4,402 61.9% 38.1% 2013 4,621 3,537 1,084 76.5% 23.5% 2012 3,425 2,749 676 80.3% 19.7%
Former Unity 2018 2,926 2,115 811 72.3% 27.7% 2013 1,771 1,415 356 79.9% 20.1% 2012 4,236 3,148 1,088 74.3% 25.7%
Former Upper Nile 2018 1,827 1,376 451 75.3% 24.7% 2013 10,467 6,734 3,733 64.3% 35.7% 2012 10,348 7,260 3,088 70.2% 29.8%
Former Warrap 2018 12,065 8,446 3,619 70.0% 30.0% 2013 4,218 3,388 830 80.3% 19.7% 2012 3,898 3,318 580 85.1% 14.9%
Former Western Bahr El Ghazal 2018 9,760 5,464 4,296 56.0% 44.0% 2013 5,726 3,227 2,499 56.4% 43.6% 2012 4,657 3,259 1,398 70.0% 30.0%
Former Western Equatoria 2018 8,909 5,132 3,777 57.6% 42.4% 2013 4,718 3,024 1,694 64.1% 35.9% 2012 3,378 2,016 1,362 59.7% 40.3%
Total 2018 84,562 54,744 29,818 64.7% 35.3% 2013 46,567 31,709 14,858 68.1% 31.9% 2012 56,827 40,046 16,781 70.5% 29.5%
Source: EMIS Data
Information in Table 8.5 indicates that there was a decline in the total enrolment between 2012 and 2013. This decline was of 10,260 students (from 56,827 students in 2012 to 46,567 students in 2013) representing 18.1% decline in enrolment from the number that was reported in 2012. This trend was however reversed between 2013 and 2018 by an increment of 37,995 in total enrolment of students (from 46,567 students in 2013 to 84,562 students in 2018). The increase in the total enrolment level in 2018 represented 81.6% increment from the total enrolment level registered in 2013. This was a significant increase in the number of students enrolled at secondary level.
Focusing on total enrolment by gender, the proportion of total male students enrolled into secondary schools over the three years has been declining. It reduced from 70.5% to 68.1% between 2012 and 2013. It again reduced from 68.1% to 64.7% between 2013 and 2018. The reverse of this has been happening on the proportion of total female students enrolled into secondary schools. This has been increasing over the three years under consideration (2012, 2013 & 2018).
Between 2013 and 2018, the total enrolment of female students increased by 100.7% from 14,858 students in 2013 to 29,818 students in 2018. All this indicates that there has been a significant increase in the enrolment of female students into secondary schools in the country over the three years considered in this report. Though this is the case, the number of male students enrolled into secondary schools is still higher than that of female students. This is true when considering both, national totals and total enrolment levels by former states as presented in Table 8.5.
Focusing on the enrolment levels by new states in 2018, information in Table 8.6 is presented.

EMIS 2018 NATIONAL EDUCATION STATISTICAL BOOKLET 43
Table 8.10: No & % of secondary school students by gender and state, 2018 States Totals Males Females %Males %Females CEQ 17,676 10,741 6,935 60.8% 39.2%
Jubek 15,537 9,446 6,091 60.8% 39.2% Terekeka 406 279 127 68.7% 31.3% Yei River 1,733 1,016 717 58.6% 41.4%
EEQ 6,778 4,571 2,207 67.4% 32.6% Kapoeta 696 401 295 57.6% 42.4% Torit 6,082 4,170 1,912 68.6% 31.4%
JON 3,781 2,878 903 76.1% 23.9% Boma 81 79 2 97.5% 2.5% Fangak 303 230 73 75.9% 24.1% Jonglei 3,397 2,569 828 75.6% 24.4%
LAK 9,278 6,861 2,417 73.9% 26.1% Eastern Lakes 3,329 2,541 788 76.3% 23.7% Gok 769 389 380 50.6% 49.4% Western Lakes 5,180 3,931 1,249 75.9% 24.1%
NBG 11,562 7,160 4,402 61.9% 38.1% Aweil 7,412 4,482 2,930 60.5% 39.5% Aweil East 1,553 993 560 63.9% 36.1% Lol 2,597 1,685 912 64.9% 35.1%
UNI 2,926 2,115 811 72.3% 27.7% Northern Liech 363 295 68 81.3% 18.7% Ruweng 837 628 209 75.0% 25.0% Southern Liech 1,726 1,192 534 69.1% 30.9%
UPN 1,827 1,376 451 75.3% 24.7% Central Upper Nile 526 447 79 85.0% 15.0% Latjor 19 6 13 31.6% 68.4% Northern Upper Nile 1,282 923 359 72.0% 28.0%
WAR 12,065 8,446 3,619 70.0% 30.0% Abyei AA 586 397 189 67.7% 32.3% Gogrial 4,614 3,044 1,570 66.0% 34.0% Tonj 3,680 2,825 855 76.8% 23.2% Twic 3,185 2,180 1,005 68.4% 31.6%
WBG 9,760 5,464 4,296 56.0% 44.0% Wau 9,760 5,464 4,296 56.0% 44.0%
WEQ 8,909 5,132 3,777 57.6% 42.4% Amadi 1,125 729 396 64.8% 35.2% Gbudwe 4,953 2,571 2,382 51.9% 48.1% Maridi 1,188 787 401 66.2% 33.8% Tambura 1,643 1,045 598 63.6% 36.4%
Grand Total 84,562 54,744 29,818 64.7% 35.3% Source: EMIS Data
Information in Table 8.6 complements what is presented in Table 8.5. Basing on this information, Latjor state stands out as a state with more female students than male students in secondary schools in that state. All the other states have more male students than female students in secondary schools. Boma state also stands out for having less than 10% of female students in secondary schools in the state. In this state, only 2 female students (2.5% of total state enrolment) were in secondary schools in 2018.
The state with the highest number of students in secondary school is Jubek (15,537 students) while that with the lowest number of students in secondary school is Latjor (19 students). Jubek also doubles as the state with the highest number of male and female students in secondary education.

EMIS 2018 NATIONAL EDUCATION STATISTICAL BOOKLET 44
Table 8.11: Number of SEC students with disability by state and type of disability States Poor
Vision Complete Blindness
Partial Deafness
Complete Deafness
Mental Impairement
Physical Impairement
Total
CEQ 35 2 13 3 8 37 98 Jubek 25 2 10 1 8 21 67 Yei River 10 - 3 2 - 16 31
EEQ 13 - 7 - 6 18 44 Kapoeta - - - - - 2 2 Torit 13 - 7 - 6 16 42
JON 14 - 2 - 1 10 27 Boma 10 - 2 - - 1 13 Jonglei 4 - - - 1 9 14
LAK 88 - 5 1 7 16 117 Eastern Lakes 8 - 4 1 2 7 22 Gok 2 - - - 1 2 5 Western Lakes 78 - 1 - 4 7 90
NBG 24 - 23 - 11 11 69 Aweil 14 - 16 - 2 6 38 Aweil East 8 - 2 - 8 1 19 Lol 2 - 5 - 1 4 12
UNI 18 - 9 1 3 20 51 Northern Liech - - - - - 3 3 Ruweng 9 - 6 - 1 12 28 Southern Liech 9 - 3 1 2 5 20
UPN - - 1 - - 3 4 Northern Upper Nile - - 1 - - 3 4
WAR 15 - 26 - 7 49 97 Abyei AA 1 - - - - - 1 Gogrial 3 - 10 - 1 32 46 Tonj 9 - 4 - 4 10 27 Twic 2 - 12 - 2 7 23
WBG 65 - 37 - 1 19 122 Wau 65 - 37 - 1 19 122
WEQ 27 - 5 - 22 19 73 Amadi 3 - 1 - 7 1 12 Gbudwe 21 - - - 13 10 44 Maridi 1 - - - - 4 5 Tambura 2 - 4 - 2 4 12
Grand Total 299 2 128 5 66 202 702
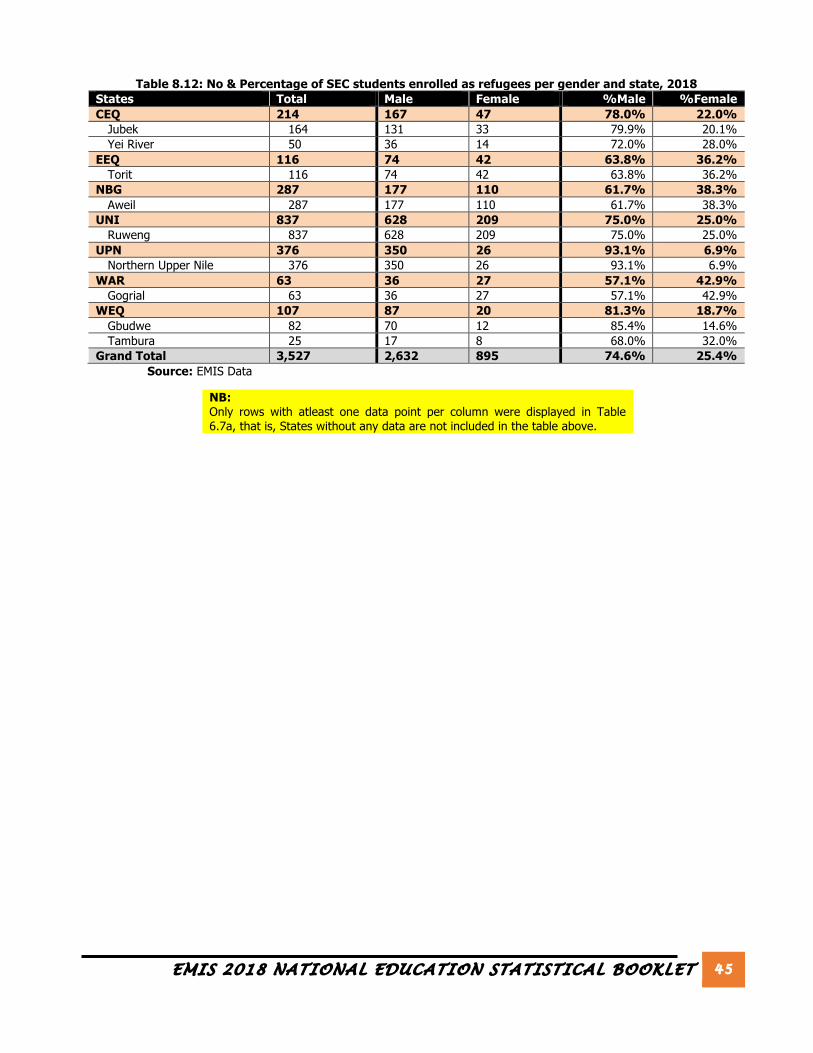
EMIS 2018 NATIONAL EDUCATION STATISTICAL BOOKLET 45
Table 8.12: No & Percentage of SEC students enrolled as refugees per gender and state, 2018 States Total Male Female %Male %Female CEQ 214 167 47 78.0% 22.0%
Jubek 164 131 33 79.9% 20.1% Yei River 50 36 14 72.0% 28.0%
EEQ 116 74 42 63.8% 36.2% Torit 116 74 42 63.8% 36.2%
NBG 287 177 110 61.7% 38.3% Aweil 287 177 110 61.7% 38.3%
UNI 837 628 209 75.0% 25.0% Ruweng 837 628 209 75.0% 25.0%
UPN 376 350 26 93.1% 6.9% Northern Upper Nile 376 350 26 93.1% 6.9%
WAR 63 36 27 57.1% 42.9% Gogrial 63 36 27 57.1% 42.9%
WEQ 107 87 20 81.3% 18.7% Gbudwe 82 70 12 85.4% 14.6% Tambura 25 17 8 68.0% 32.0%
Grand Total 3,527 2,632 895 74.6% 25.4% Source: EMIS Data
NB: Only rows with atleast one data point per column were displayed in Table 6.7a, that is, States without any data are not included in the table above.
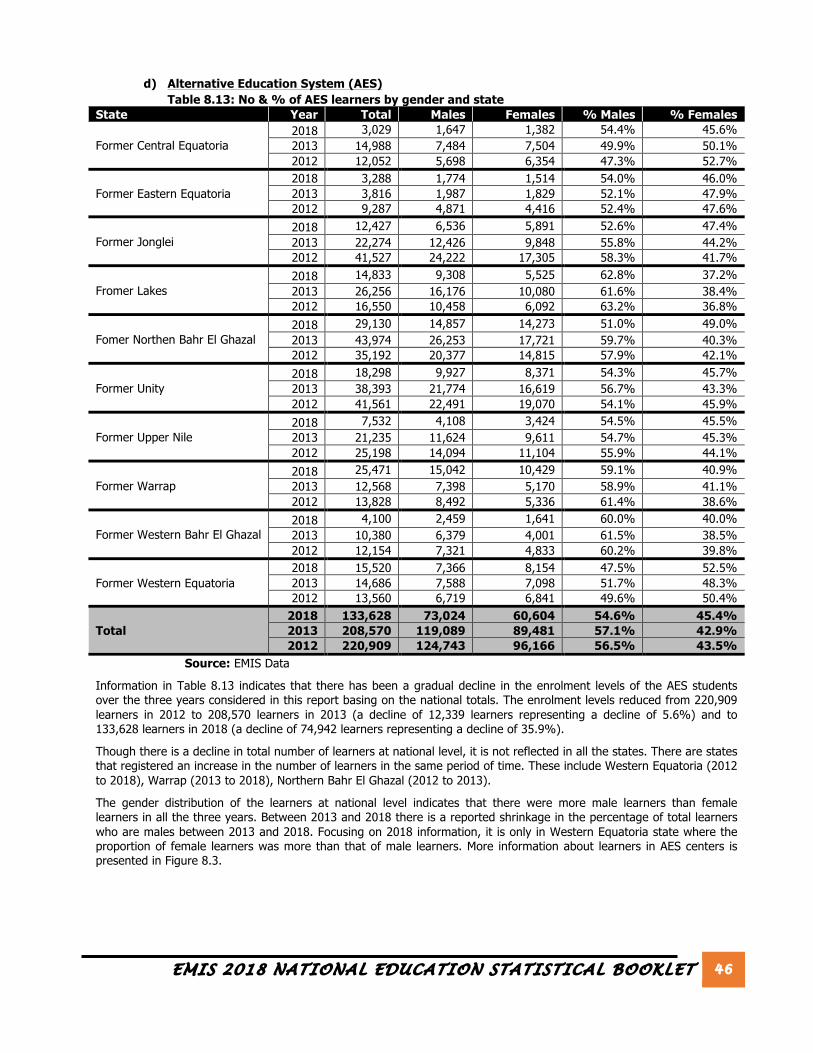
EMIS 2018 NATIONAL EDUCATION STATISTICAL BOOKLET 46
d) Alternative Education System (AES) Table 8.13: No & % of AES learners by gender and state
State Year Total Males Females % Males % Females
Former Central Equatoria 2018 3,029 1,647 1,382 54.4% 45.6% 2013 14,988 7,484 7,504 49.9% 50.1% 2012 12,052 5,698 6,354 47.3% 52.7%
Former Eastern Equatoria 2018 3,288 1,774 1,514 54.0% 46.0% 2013 3,816 1,987 1,829 52.1% 47.9% 2012 9,287 4,871 4,416 52.4% 47.6%
Former Jonglei 2018 12,427 6,536 5,891 52.6% 47.4% 2013 22,274 12,426 9,848 55.8% 44.2% 2012 41,527 24,222 17,305 58.3% 41.7%
Fromer Lakes 2018 14,833 9,308 5,525 62.8% 37.2% 2013 26,256 16,176 10,080 61.6% 38.4% 2012 16,550 10,458 6,092 63.2% 36.8%
Fomer Northen Bahr El Ghazal 2018 29,130 14,857 14,273 51.0% 49.0% 2013 43,974 26,253 17,721 59.7% 40.3% 2012 35,192 20,377 14,815 57.9% 42.1%
Former Unity 2018 18,298 9,927 8,371 54.3% 45.7% 2013 38,393 21,774 16,619 56.7% 43.3% 2012 41,561 22,491 19,070 54.1% 45.9%
Former Upper Nile 2018 7,532 4,108 3,424 54.5% 45.5% 2013 21,235 11,624 9,611 54.7% 45.3% 2012 25,198 14,094 11,104 55.9% 44.1%
Former Warrap 2018 25,471 15,042 10,429 59.1% 40.9% 2013 12,568 7,398 5,170 58.9% 41.1% 2012 13,828 8,492 5,336 61.4% 38.6%
Former Western Bahr El Ghazal 2018 4,100 2,459 1,641 60.0% 40.0% 2013 10,380 6,379 4,001 61.5% 38.5% 2012 12,154 7,321 4,833 60.2% 39.8%
Former Western Equatoria 2018 15,520 7,366 8,154 47.5% 52.5% 2013 14,686 7,588 7,098 51.7% 48.3% 2012 13,560 6,719 6,841 49.6% 50.4%
Total 2018 133,628 73,024 60,604 54.6% 45.4% 2013 208,570 119,089 89,481 57.1% 42.9% 2012 220,909 124,743 96,166 56.5% 43.5%
Source: EMIS Data
Information in Table 8.13 indicates that there has been a gradual decline in the enrolment levels of the AES students over the three years considered in this report basing on the national totals. The enrolment levels reduced from 220,909 learners in 2012 to 208,570 learners in 2013 (a decline of 12,339 learners representing a decline of 5.6%) and to 133,628 learners in 2018 (a decline of 74,942 learners representing a decline of 35.9%).
Though there is a decline in total number of learners at national level, it is not reflected in all the states. There are states that registered an increase in the number of learners in the same period of time. These include Western Equatoria (2012 to 2018), Warrap (2013 to 2018), Northern Bahr El Ghazal (2012 to 2013).
The gender distribution of the learners at national level indicates that there were more male learners than female learners in all the three years. Between 2013 and 2018 there is a reported shrinkage in the percentage of total learners who are males between 2013 and 2018. Focusing on 2018 information, it is only in Western Equatoria state where the proportion of female learners was more than that of male learners. More information about learners in AES centers is presented in Figure 8.3.

EMIS 2018 NATIONAL EDUCATION STATISTICAL BOOKLET 47
Figure 8.3: AES learners by state (2012, 2013 & 2018)
Information in Figure 8.3 indicates that Northern Bahr El Ghazal stands out for having the highest number of learners in 2013. Apart from Warrap and Western Equatoria, all the other states are reported to have had more learners in 2012 and 2013 as compared to the number of learners in 2018. This confirms what is presented in Table 8.7 indicating that there was a gradual decline in the total number of learners enrolled into AES centers over the three years under consideration.
The general enrolment presented in Table 8.7 captures only the former states. In order to reflect enrolment levels in the new states, Table 18 is presented (See next page). Information in Table 8.8 includes enrolment levels for 2018 alone. This is the case because the other years do not have information relating to enrolment levels in new states.
12,0
52
9,28
7
41,5
27
16,5
50
35,1
92
41,5
61
25,1
98
13,8
28
12,1
54
13,5
60
14,9
88
3,81
6
22,2
74
26,2
56
43,9
74
38,3
93
21,2
35
12,5
68
10,3
80 14,6
86
3,02
9
3,28
8
12,4
27
14,8
33
29,1
30
18,2
98
7,53
2
25,4
71
4,10
0
15,5
20
CEQ EEQ JON LAK NBG UNI UPN WAR WBG WEQ
Number of AES learners by state (2012, 2013 & 2018)
2012 2013 2018

EMIS 2018 NATIONAL EDUCATION STATISTICAL BOOKLET 48
Table 8.14: No & % of AES learners by gender and state, 2018 States Totals Male Female %Male %Female CEQ 3,029 1,647 1,382 54.4% 45.6%
Jubek 1,925 1,058 867 55.0% 45.0% Terekeka 643 336 307 52.3% 47.7% Yei River 461 253 208 54.9% 45.1%
EEQ 3,288 1,774 1,514 54.0% 46.0% Kapoeta 1,464 917 547 62.6% 37.4% Torit 1,824 857 967 47.0% 53.0%
JON 12,427 6,536 5,891 52.6% 47.4% Akobo 1,522 926 596 60.8% 39.2% Bieh 830 463 367 55.8% 44.2% Boma 1,032 690 342 66.9% 33.1% Fangak 775 537 238 69.3% 30.7% Jonglei 8,268 3,920 4,348 47.4% 52.6%
LAK 14,833 9,308 5,525 62.8% 37.2% Eastern Lakes 4,794 3,070 1,724 64.0% 36.0% Gok 4,074 2,573 1,501 63.2% 36.8% Western Lakes 5,965 3,665 2,300 61.4% 38.6%
NBG 29,130 14,857 14,273 51.0% 49.0% Aweil 12,261 6,345 5,916 51.7% 48.3% Aweil East 6,411 3,299 3,112 51.5% 48.5% Lol 10,458 5,213 5,245 49.8% 50.2%
UNI 18,298 9,927 8,371 54.3% 45.7% Northern Liech 5,862 3,198 2,664 54.6% 45.4% Ruweng 4,984 2,737 2,247 54.9% 45.1% Southern Liech 7,452 3,992 3,460 53.6% 46.4%
UPN 7,532 4,108 3,424 54.5% 45.5% Central Upper Nile 3,246 1,699 1,547 52.3% 47.7% Fashoda 277 117 160 42.2% 57.8% Latjor 1,289 702 587 54.5% 45.5% Maiwut 1,689 1,062 627 62.9% 37.1% Northern Upper Nile 1,031 528 503 51.2% 48.8%
WAR 25,471 15,042 10,429 59.1% 40.9% Abyei AA 435 198 237 45.5% 54.5% Gogrial 13,009 7,555 5,454 58.1% 41.9% Tonj 10,762 6,583 4,179 61.2% 38.8% Twic 1,265 706 559 55.8% 44.2%
WBG 4,100 2,459 1,641 60.0% 40.0% Wau 4,100 2,459 1,641 60.0% 40.0%
WEQ 15,520 7,366 8,154 47.5% 52.5% Amadi 2,839 1,269 1,570 44.7% 55.3% Gbudwe 6,204 3,055 3,149 49.2% 50.8% Maridi 2,503 1,255 1,248 50.1% 49.9% Tambura 3,974 1,787 2,187 45.0% 55.0%
Grand Total 133,628 73,024 60,604 54.6% 45.4%
Information in Table 8.14 indicates that, apart from Maridi state, all the other new states belonging to the former Western Equatoria state had more female learners than male learners. This concurs with the information presented in Table 8.7 where it is indicated that it is only Western Equatoria that had more female learners as compared to their male counterparts. The other states that had more female learners than male learners in 2018 are Abyei AA, Fashoda, Torit, Jonglei, Lol, Tambura and Gbudwe. Focusing on national figures however, male learners are more than female learners.
Table 8.8 also indicates that all new states had both male and female learners in AES centers. There is no state that had only male learners or only female learners in an AES center.
The state that had the highest number of learners in AES centers in 2018 was Gogrial with a total of 13,009 learners. Out of these, 7,555 were male learners and 5,454 learners were female learners.
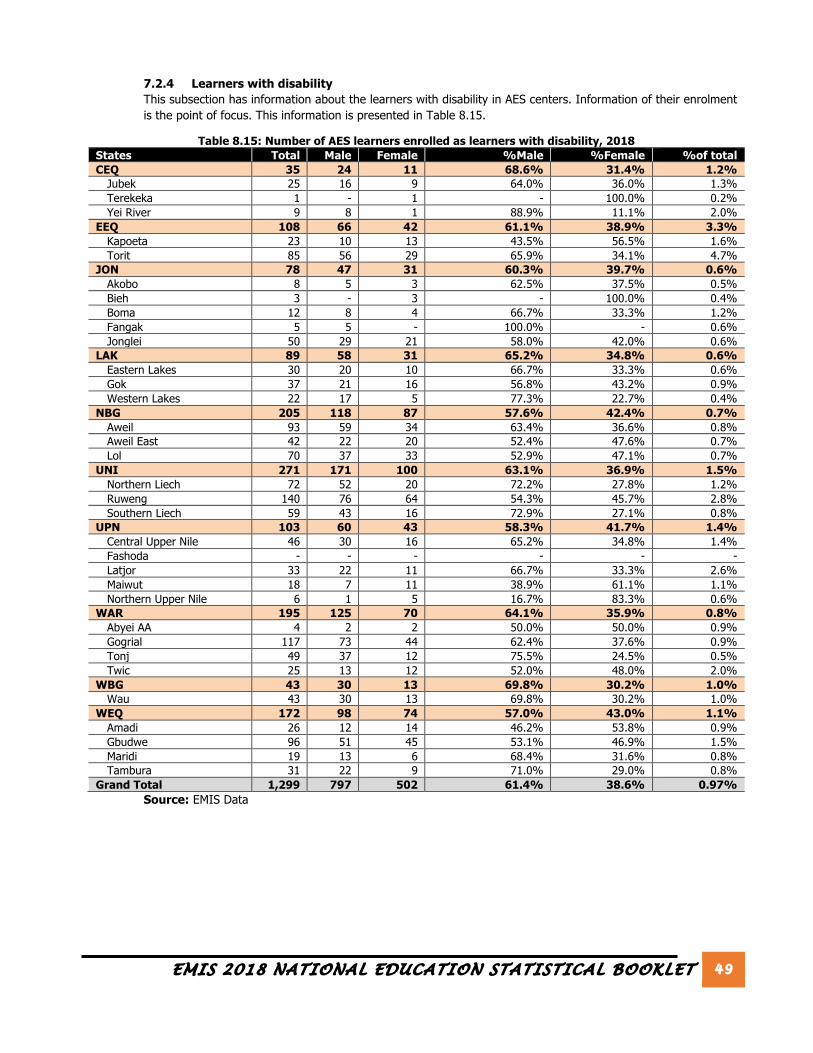
EMIS 2018 NATIONAL EDUCATION STATISTICAL BOOKLET 49
7.2.4 Learners with disability This subsection has information about the learners with disability in AES centers. Information of their enrolment is the point of focus. This information is presented in Table 8.15.
Table 8.15: Number of AES learners enrolled as learners with disability, 2018 States Total Male Female %Male %Female %of total CEQ 35 24 11 68.6% 31.4% 1.2%
Jubek 25 16 9 64.0% 36.0% 1.3% Terekeka 1 - 1 - 100.0% 0.2% Yei River 9 8 1 88.9% 11.1% 2.0%
EEQ 108 66 42 61.1% 38.9% 3.3% Kapoeta 23 10 13 43.5% 56.5% 1.6% Torit 85 56 29 65.9% 34.1% 4.7%
JON 78 47 31 60.3% 39.7% 0.6% Akobo 8 5 3 62.5% 37.5% 0.5% Bieh 3 - 3 - 100.0% 0.4% Boma 12 8 4 66.7% 33.3% 1.2% Fangak 5 5 - 100.0% - 0.6% Jonglei 50 29 21 58.0% 42.0% 0.6%
LAK 89 58 31 65.2% 34.8% 0.6% Eastern Lakes 30 20 10 66.7% 33.3% 0.6% Gok 37 21 16 56.8% 43.2% 0.9% Western Lakes 22 17 5 77.3% 22.7% 0.4%
NBG 205 118 87 57.6% 42.4% 0.7% Aweil 93 59 34 63.4% 36.6% 0.8% Aweil East 42 22 20 52.4% 47.6% 0.7% Lol 70 37 33 52.9% 47.1% 0.7%
UNI 271 171 100 63.1% 36.9% 1.5% Northern Liech 72 52 20 72.2% 27.8% 1.2% Ruweng 140 76 64 54.3% 45.7% 2.8% Southern Liech 59 43 16 72.9% 27.1% 0.8%
UPN 103 60 43 58.3% 41.7% 1.4% Central Upper Nile 46 30 16 65.2% 34.8% 1.4% Fashoda - - - - - - Latjor 33 22 11 66.7% 33.3% 2.6% Maiwut 18 7 11 38.9% 61.1% 1.1% Northern Upper Nile 6 1 5 16.7% 83.3% 0.6%
WAR 195 125 70 64.1% 35.9% 0.8% Abyei AA 4 2 2 50.0% 50.0% 0.9% Gogrial 117 73 44 62.4% 37.6% 0.9% Tonj 49 37 12 75.5% 24.5% 0.5% Twic 25 13 12 52.0% 48.0% 2.0%
WBG 43 30 13 69.8% 30.2% 1.0% Wau 43 30 13 69.8% 30.2% 1.0%
WEQ 172 98 74 57.0% 43.0% 1.1% Amadi 26 12 14 46.2% 53.8% 0.9% Gbudwe 96 51 45 53.1% 46.9% 1.5% Maridi 19 13 6 68.4% 31.6% 0.8% Tambura 31 22 9 71.0% 29.0% 0.8%
Grand Total 1,299 797 502 61.4% 38.6% 0.97% Source: EMIS Data

EMIS 2018 NATIONAL EDUCATION STATISTICAL BOOKLET 50
e) Technical Vocational Education and Training (TVET)
Table 8.16: No. of informal TVET students by gender, former state and vocational training Field of training Gender CEQ EEQ LAK WAR WBG WEQ Total
Mechanical Engineering Males - 30 6 - 51 - 87 Females - - 2 - 4 - 6
Building Concrete practice Males - 23 - - 4 57 84 Females - 2 - - - 21 23
Metal fabrication (welding) Males - 4 - - 3 - 7 Females - - - - - - -
Financial Mathematics Males 77 - - - - - 77 Females 64 - - - - - 64
Carpentry and joinery Males - 21 - - 6 56 83 Females - 2 - - - 20 22
Electrical Installation Males - - - - 28 14 42 Females - - - - 1 6 7
Hotel catering Males - - - - 4 - 4 Females - - - - 5 - 5
Tailoring Males - 7 - - 117 4 128 Females - 27 - - 45 16 88
Economics and Financial Accounts Males 77 - - - - - 77 Females 64 - - - - - 64
Casting Taxation Males 62 - - - - - 62 Females 48 - - - - - 48
Total Males 216 85 6 - 213 131 651 Females 176 31 2 - 55 63 327
Grand Total 392 116 8 - 268 194 978
Table 8.17: No & % of TVET students by state and gender, 2018 States Total Male Female %Male %Female Former Central Equatoria 1,764 1,145 619 64.9% 35.1%
Jubek 1,764 1,145 619 64.9% 35.1% Former Eastern Equatoria 58 32 26 55.2% 44.8%
Kapoeta 23 20 3 87.0% 13.0% Torit 35 12 23 34.3% 65.7%
Lakes 719 370 349 51.5% 48.5% Gok 719 370 349 51.5% 48.5%
Warrap 316 175 141 55.4% 44.6% Twic 316 175 141 55.4% 44.6%
Former Western Equatoria 100 78 22 78.0% 22.0% Gbudwe 100 78 22 78.0% 22.0%
Total 2,957 1,800 1,157 60.9% 39.1%

EMIS 2018 NATIONAL EDUCATION STATISTICAL BOOKLET 51
Table 8.18: No. of informal TVET students by gender, new state and vocational training
Vocational training type
Gender CEQ EEQ LAK WAR WBG WEQ Total Jubek Kapoeta Torit Gok Twic Wau Amadi Gbudwe
Mechanical Engineering
Male - 30 - 6 - 51 - - 87 Female - - - 2 - 4 - - 6
Building concrete practice
Male - 9 14 - - 4 27 30 84 Female - - 2 - - - 21 - 23
Metal fabrication (welding)
Male - 4 - - - 3 - - 7 Female - - - - - - - - -
Financial mathematics
Male 77 - - - - - - - 77 Female 64 - - - - - - - 64
Carpentry and joinery
Male - 6 15 - - 6 26 30 83 Female - - 2 - - - 20 - 22
Electrical installation
Male - - - - - 28 - 14 42 Female - - - - - 1 - 6 7
Hotel and Catering
Male - - - - - 4 - - 4 Female - - - - - 5 - - 5
Tailoring Male - 5 2 - - 117 - 4 128 Female - 3 24 - - 45 - 16 88
Economics and financial accounts
Male 77 - - - - - - - 77 Female 64 - - - - - - - 64
Casting taxation Male 62 - - - - - - - 62 Female 48 - - - - - - - 48
Totals Male 216 54 31 6 - 213 53 78 651 Female 176 3 28 2 - 55 41 22 327
Grand Total 392 57 59 8 - 268 94 100 978
f) Teacher Training Institutes (TTI)
Table 8.19: No. & % of TTI students by gender and state, 2018 States Total Male Female %Males %Females EEQ 50 40 10 80.0% 20.0%
Torit 50 40 10 80.0% 20.0% LAK 24 21 3 87.5% 12.5%
Gok 24 21 3 87.5% 12.5% WEQ 109 85 24 78.0% 22.0%
Gbudwe 109 85 24 78.0% 22.0% Grand Total 183 146 37 79.8% 20.2%
g) Universities (UNI)
Table 8.20: No. & % of UNI students by gender and state, 2018 States Total Male Female %Male %Female CEQ 7,547 5,810 1,737 77.0% 23.0%
Jubek 7547 5,810 1,737 77.0% 23.0% WAR 305 285 20 93.4% 6.6%
Gogrial 305 285 20 93.4% 6.6% WEQ 347 237 110 68.3% 31.7%
Gbudwe 347 237 110 68.3% 31.7% Grand Total 8199 6,332 1,867 77.2% 22.8%

EMIS 2018 NATIONAL EDUCATION STATISTICAL BOOKLET 52
9. Trend of GER, NER, GIR, NIR of Primary and secondary enrollment by state (2012, 2013, & 2018)
Table 9.1: Trend of Enrolment rates Type of school Year GER NER GIR NIR
PRI 2018 62% 42% 13% 4% 2013 61.9% 41.5% 68.0% 11.9% 2012 63.6% 42.1% 65.9% 9.8%
SEC 2018 8% 3% 7% 0.41% 2013 5.1% 1.9% 5.7% 0.4% 2012 6.6% 2.5% 6.6% 0.8%
Figure 9.1: Enrolment rates for 2012, 2013 and 2018
63.6
0%
61.9
0%
62%
6.60
%
5.10
%
8%
42.1
0%
41.5
0%
42%
2.50
%
1.90
%
3%
65.9
0%
68.0
0%
13%
6.60
%
5.70
%
7%
9.80
%
11.9
0%
4%
0.80
%
0.40
%
0.41
%
2012 2013 2018 2012 2013 2018
PRI SEC
Trend in enrolment rates (2012, 2013 & 2018)
GER NER GIR NIR

EMIS 2018 NATIONAL EDUCATION STATISTICAL BOOKLET 53
10. Gender parity index by school type
Table 10.1: Gender Parity Index by level of education and state, 2018 States PPR [ECD] PRI SEC AES TTI TVET UNI CEQ 0.94 0.95 0.65 0.84 - 0.54 0.30
Jubek 0.94 1.01 0.64 0.82 - 0.54 0.30 Terekeka 0.58 0.62 0.46 0.91 - - - Yei River 1.03 0.96 0.71 0.82 - - -
EEQ 0.86 0.83 0.48 0.85 0.25 0.81 - Kapoeta 0.75 0.80 0.74 0.60 - 0.15 - Torit 0.91 0.85 0.46 1.13 0.25 1.92 -
JON 0.71 0.60 0.31 0.90 - - - Akobo 0.62 0.64 - 0.64 - - - Bieh 0.76 0.64 - 0.79 - - - Boma 0.83 0.58 0.03 0.50 - - - Fangak 0.63 0.47 0.32 0.44 - - - Jonglei 0.87 0.66 0.32 1.11 - - -
LAK 0.72 0.68 0.35 0.59 0.14 0.94 - Eastern Lakes 0.69 0.56 0.31 0.56 - - - Gok 0.98 0.76 0.98 0.58 0.14 0.94 - Western Lakes 0.55 0.71 0.32 0.63 - - -
NBG 0.88 0.86 0.61 0.96 - - - Aweil 0.87 0.81 0.65 0.93 - - - Aweil East 0.95 0.85 0.56 0.94 - - - Lol 0.77 0.92 0.54 1.01 - - -
UNI 0.72 0.71 0.38 0.84 - - - Northern Liech 0.79 0.69 0.23 0.83 - - - Ruweng 0.78 0.79 0.33 0.82 - - - Southern Liech 0.70 0.69 0.45 0.87 - - -
UPN 0.74 0.71 0.33 0.83 - Central Upper Nile 0.82 0.79 0.18 0.91 - - - Fashoda 1.15 0.79 - 1.37 - - - Latjor 1.05 0.73 2.17 0.84 - - - Maiwut 0.29 0.53 - 0.59 - - - Northern Upper Nile 0.94 0.90 0.39 0.95 - - -
WAR 0.85 0.71 0.43 0.69 - 0.81 0.07 Abyei AA 0.83 0.85 0.48 1.20 - - - Gogrial 0.88 0.72 0.52 0.72 - - 0.07 Tonj 0.79 0.58 0.30 0.63 - - - Twic 0.86 0.90 0.46 0.79 - 0.81 -
WBG 0.76 0.74 0.79 0.67 - - - Wau 0.76 0.74 0.79 0.67 - - -
WEQ 0.98 0.88 0.74 1.11 0.28 0.28 0.46 Amadi 0.94 0.88 0.54 1.24 - - - Gbudwe 0.99 0.88 0.93 1.03 0.28 0.28 0.46 Maridi 1.01 0.89 0.51 0.99 - - - Tambura 0.95 0.89 0.57 1.22 - - -
Grand Total 0.86 0.75 0.54 0.83 0.25 0.64 0.29
11. Number of dropouts for secondary and primary level of education This is presented by grade in the different states where dropout students/pupils were found in the AEC of 2018. The first part has information about primary school level of education and the second part has information about the secondary school level of education.

EMIS 2018 NATIONAL EDUCATION STATISTICAL BOOKLET 54
a) Primary school level of education.
Table 11.1: Primary school dropouts by grade and state States P1 P2 P3 P4 P5 P6 P7 P8 Totals CEQ 949 632 555 633 615 532 487 210 4,613
Jubek 495 373 305 363 399 333 344 148 2,760 Terekeka 150 115 100 90 89 87 58 20 709 Yei River 304 144 150 180 127 112 85 42 1,144
EEQ 3,168 696 604 568 487 368 226 129 6,246 Kapoeta 132 110 106 98 96 60 34 15 651 Torit 3,036 586 498 470 391 308 192 114 5,595
JON 1,651 995 929 785 615 375 207 85 5,642 Akobo 162 103 91 92 50 19 9 6 532 Bieh 318 193 222 154 115 56 11 17 1,086 Boma 110 70 82 37 5 10 - - 314 Fangak 219 169 165 132 129 27 16 15 872 Jonglei 842 460 369 370 316 263 171 47 2,838
LAK 1,042 772 713 932 589 425 361 198 5,032 Eastern Lakes 404 260 264 226 197 141 141 88 1,721 Gok 220 151 131 111 89 62 49 12 825 Western Lakes 418 361 318 595 303 222 171 98 2,486
NBG 2,926 1,622 1,264 1,063 1,166 836 537 366 9,780 Aweil 907 523 440 306 548 307 230 134 3,395 Aweil East 918 539 364 353 285 181 120 73 2,833 Lol 1,101 560 460 404 333 348 187 159 3,552
UNI 1,811 1,325 1,119 805 632 480 212 101 6,485 Northern Liech 1,314 991 819 567 454 355 116 65 4,681 Ruweng 208 158 115 96 67 63 70 23 800 Southern Liech 289 176 185 142 111 62 26 13 1,004
UPN 1,742 847 660 538 326 187 166 120 4,586 Central Upper Nile 665 102 105 75 45 40 44 54 1,130 Fashoda 13 8 8 8 - 1 - - 38 Latjor 488 296 234 193 89 70 58 8 1,436 Maiwut 248 255 186 157 64 1 2 5 918 Northern Upper Nile 328 186 127 105 128 75 62 53 1,064
WAR 2,143 1,384 1,296 1,177 843 749 568 310 8,470 Abyei AA 121 97 101 78 86 63 38 69 653 Gogrial 966 610 493 429 323 330 270 116 3,537 Tonj 722 407 405 287 185 158 109 71 2,344 Twic 334 270 297 383 249 198 151 54 1,936
WBG 664 409 462 420 354 340 368 210 3,227 Wau 664 409 462 420 354 340 368 210 3,227
WEQ 1,248 1,001 939 746 752 573 451 312 6,022 Amadi 331 258 256 212 202 133 102 72 1,566 Gbudwe 495 412 360 313 282 252 206 125 2,445 Maridi 140 136 139 78 113 72 48 30 756 Tambura 282 195 184 143 155 116 95 85 1,255
Grand Total 17,344 9,683 8,541 7,667 6,379 4,865 3,583 2,041 60,103 Source: EMIS Data

EMIS 2018 NATIONAL EDUCATION STATISTICAL BOOKLET 55
Basing on information on total dropouts in 2018, the number of dropouts is lower in higher primary school grades as compared to lower primary school grades. The states with the highest number of dropouts per grade is Torrit while that
with the lowest number of dropouts per grade is Fashoda. More information relating to primary school dropouts is presented in Figure 11.1.
Figure 11.1: Number of PRI dropouts by grade and gender, 2018
Information in Figure 11.1 indicates that there are more pupils that dropped out in lower grades than in higher grades in 2018. The lower primary grades have more male dropouts than female dropouts while upper primary grades have more female dropouts than male dropouts.
Focusing on former states, dropouts of pupils were analyzed in terms of their gender per state. This information is presented in Figure 11.2.
Figure 11.2: Number of PRI dropouts by state and gender, 2018
10,6
17
5,03
8
4,61
4
3,83
4
3,04
2
2,32
5
1,73
8
952
6,72
7
4,64
5
3,92
7
3,83
3
3,33
7
2,54
0
1,84
5
1,08
9
P1 P2 P3 P4 P5 P6 P7 P8
Total PRI dropouts by grade and gender, 2018
Males Females
2,22
0
4,08
1
3,09
0
2,76
0
4,76
2
3,41
0
2,62
2
4,62
1
1,72
3
2,87
1
2,39
3
2,16
5
2,55
2
2,27
2
5,01
8
3,07
5
1,96
4
3,84
9
1,50
4
3,15
1
CEQ EEQ JON LAK NBG UNI UPN WAR WBG WEQ
PRI dropout pupils by state and gender, 2018
Males Females

EMIS 2018 NATIONAL EDUCATION STATISTICAL BOOKLET 56
Information in Figure 11.2 indicates that Northern Bahr El Ghazal had the highest number of dropouts in primary schools in 2018. This is followed by Warrap. With the exception of Central Equatoria, Northern Bahr El Ghazal and Western Equatoria, all the other states have more male dropouts than female dropouts at primary school level of education. The highest disparity between male and female dropouts per state was in Eastern Equatoria.
b) Secondary school level of education This subsection has information in relation to the number of secondary school students that dropped out of schools in 2018. Their number has been established and the percentage of the total students computed. An overview of total students that dropped out of school by their grade and gender is presented in Figure 11.3.
Figure 11.3: Number of drop out SEC students by their gender and grade, 2018 Information in Figure 11.3 indicates that in 2018, more students dropped out in lower grades as compared to higher grades. With the exception of grade three (S3) of secondary education, the other grades have more male students dropping out of school as compared to female students.
Though there are more students dropping out of secondary schools in lower grades than in higher grades, the gender gap between male students and female students dropping out of secondary school is higher in grade four (S4) as compared to the other grades. The gap in grade four is 267 students while that in grade one is 248 students and 204 students in grade two. The gap in grade three is the lowest with only 76 students.
The percentage of secondary school students that dropped out of school in 2018 is presented in Table 11.2 (see next page). These percentages are computed by considering the number of students who dropped out of secondary schools and the total enrolment level into secondary school education.
968
749
360
547
720
545
436
280
S1 S2 S3 S4
Total number of SEC dropouts by grade and gender, 2018
Male Female
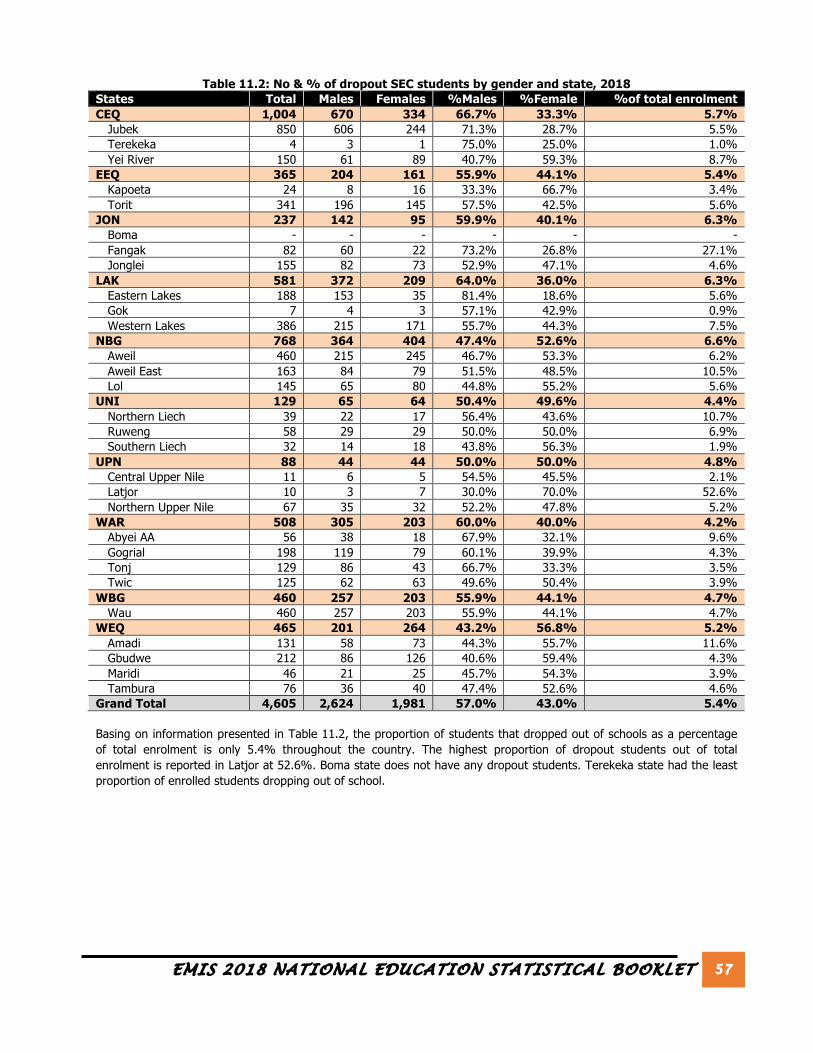
EMIS 2018 NATIONAL EDUCATION STATISTICAL BOOKLET 57
Table 11.2: No & % of dropout SEC students by gender and state, 2018 States Total Males Females %Males %Female %of total enrolment CEQ 1,004 670 334 66.7% 33.3% 5.7%
Jubek 850 606 244 71.3% 28.7% 5.5% Terekeka 4 3 1 75.0% 25.0% 1.0% Yei River 150 61 89 40.7% 59.3% 8.7%
EEQ 365 204 161 55.9% 44.1% 5.4% Kapoeta 24 8 16 33.3% 66.7% 3.4% Torit 341 196 145 57.5% 42.5% 5.6%
JON 237 142 95 59.9% 40.1% 6.3% Boma - - - - - - Fangak 82 60 22 73.2% 26.8% 27.1% Jonglei 155 82 73 52.9% 47.1% 4.6%
LAK 581 372 209 64.0% 36.0% 6.3% Eastern Lakes 188 153 35 81.4% 18.6% 5.6% Gok 7 4 3 57.1% 42.9% 0.9% Western Lakes 386 215 171 55.7% 44.3% 7.5%
NBG 768 364 404 47.4% 52.6% 6.6% Aweil 460 215 245 46.7% 53.3% 6.2% Aweil East 163 84 79 51.5% 48.5% 10.5% Lol 145 65 80 44.8% 55.2% 5.6%
UNI 129 65 64 50.4% 49.6% 4.4% Northern Liech 39 22 17 56.4% 43.6% 10.7% Ruweng 58 29 29 50.0% 50.0% 6.9% Southern Liech 32 14 18 43.8% 56.3% 1.9%
UPN 88 44 44 50.0% 50.0% 4.8% Central Upper Nile 11 6 5 54.5% 45.5% 2.1% Latjor 10 3 7 30.0% 70.0% 52.6% Northern Upper Nile 67 35 32 52.2% 47.8% 5.2%
WAR 508 305 203 60.0% 40.0% 4.2% Abyei AA 56 38 18 67.9% 32.1% 9.6% Gogrial 198 119 79 60.1% 39.9% 4.3% Tonj 129 86 43 66.7% 33.3% 3.5% Twic 125 62 63 49.6% 50.4% 3.9%
WBG 460 257 203 55.9% 44.1% 4.7% Wau 460 257 203 55.9% 44.1% 4.7%
WEQ 465 201 264 43.2% 56.8% 5.2% Amadi 131 58 73 44.3% 55.7% 11.6% Gbudwe 212 86 126 40.6% 59.4% 4.3% Maridi 46 21 25 45.7% 54.3% 3.9% Tambura 76 36 40 47.4% 52.6% 4.6%
Grand Total 4,605 2,624 1,981 57.0% 43.0% 5.4%
Basing on information presented in Table 11.2, the proportion of students that dropped out of schools as a percentage of total enrolment is only 5.4% throughout the country. The highest proportion of dropout students out of total enrolment is reported in Latjor at 52.6%. Boma state does not have any dropout students. Terekeka state had the least proportion of enrolled students dropping out of school.

EMIS 2018 NATIONAL EDUCATION STATISTICAL BOOKLET 58
12. Number and condition of classrooms by education level, 2018
Table 12.1: Number and percentage of classrooms and PCR per level of education and classroom types 2018
Level of education Total Perm Semi perm Roof only Tent Open air PCR
AES 2,192 830 360 91 184 727
112.3 100% 37.9% 16.4% 4.2% 8.4% 33.2%
PPR [ECD] 2,164 738 754 128 57 487
76.3 100% 34.1% 34.8% 5.9% 2.6% 22.5%
PRI 25,119 6,886 5,202 1,541 608 10,882
132.8 100% 27.4% 20.7% 6.1% 2.4% 43.3%
SEC 1,979 1,411 399 88 27 54
46.7 100% 71.3% 20.2% 4.4% 1.4% 2.7%
Total 31,472 9,881 6,716 1,849 876 12,150
116.7 100% 31.4% 21.3% 5.9% 2.8% 38.6%
The formula below was used when computing the PCR (Pupil-Classroom-Ratio)
!"# = !"#$% !"#$%&!"' !" ! !"#$% !"#$ !" !"#$$%!" !" !"#$ !"#$$%&&'$ + !" !" !"#$ − !"#$ !"#$$%&&'$
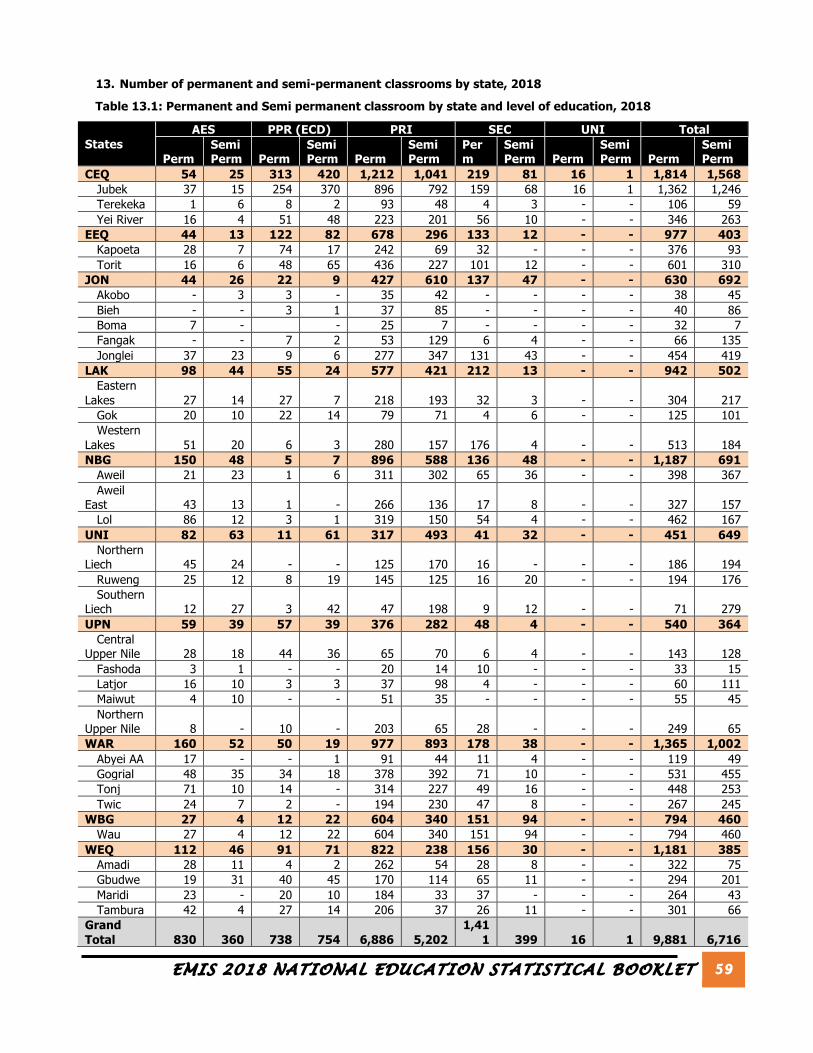
EMIS 2018 NATIONAL EDUCATION STATISTICAL BOOKLET 59
13. Number of permanent and semi-permanent classrooms by state, 2018
Table 13.1: Permanent and Semi permanent classroom by state and level of education, 2018
States AES PPR (ECD) PRI SEC UNI Total
Perm Semi Perm Perm
Semi Perm Perm
Semi Perm
Perm
Semi Perm Perm
Semi Perm Perm
Semi Perm
CEQ 54 25 313 420 1,212 1,041 219 81 16 1 1,814 1,568 Jubek 37 15 254 370 896 792 159 68 16 1 1,362 1,246 Terekeka 1 6 8 2 93 48 4 3 - - 106 59 Yei River 16 4 51 48 223 201 56 10 - - 346 263
EEQ 44 13 122 82 678 296 133 12 - - 977 403 Kapoeta 28 7 74 17 242 69 32 - - - 376 93 Torit 16 6 48 65 436 227 101 12 - - 601 310
JON 44 26 22 9 427 610 137 47 - - 630 692 Akobo - 3 3 - 35 42 - - - - 38 45 Bieh - - 3 1 37 85 - - - - 40 86 Boma 7 - - 25 7 - - - - 32 7 Fangak - - 7 2 53 129 6 4 - - 66 135 Jonglei 37 23 9 6 277 347 131 43 - - 454 419
LAK 98 44 55 24 577 421 212 13 - - 942 502 Eastern
Lakes 27 14 27 7 218 193 32 3 - - 304 217 Gok 20 10 22 14 79 71 4 6 - - 125 101 Western
Lakes 51 20 6 3 280 157 176 4 - - 513 184 NBG 150 48 5 7 896 588 136 48 - - 1,187 691
Aweil 21 23 1 6 311 302 65 36 - - 398 367 Aweil
East 43 13 1 - 266 136 17 8 - - 327 157 Lol 86 12 3 1 319 150 54 4 - - 462 167
UNI 82 63 11 61 317 493 41 32 - - 451 649 Northern
Liech 45 24 - - 125 170 16 - - - 186 194 Ruweng 25 12 8 19 145 125 16 20 - - 194 176 Southern
Liech 12 27 3 42 47 198 9 12 - - 71 279 UPN 59 39 57 39 376 282 48 4 - - 540 364
Central Upper Nile 28 18 44 36 65 70 6 4 - - 143 128
Fashoda 3 1 - - 20 14 10 - - - 33 15 Latjor 16 10 3 3 37 98 4 - - - 60 111 Maiwut 4 10 - - 51 35 - - - - 55 45 Northern
Upper Nile 8 - 10 - 203 65 28 - - - 249 65 WAR 160 52 50 19 977 893 178 38 - - 1,365 1,002
Abyei AA 17 - - 1 91 44 11 4 - - 119 49 Gogrial 48 35 34 18 378 392 71 10 - - 531 455 Tonj 71 10 14 - 314 227 49 16 - - 448 253 Twic 24 7 2 - 194 230 47 8 - - 267 245
WBG 27 4 12 22 604 340 151 94 - - 794 460 Wau 27 4 12 22 604 340 151 94 - - 794 460
WEQ 112 46 91 71 822 238 156 30 - - 1,181 385 Amadi 28 11 4 2 262 54 28 8 - - 322 75 Gbudwe 19 31 40 45 170 114 65 11 - - 294 201 Maridi 23 - 20 10 184 33 37 - - - 264 43 Tambura 42 4 27 14 206 37 26 11 - - 301 66
Grand Total 830 360 738 754 6,886 5,202
1,411 399 16 1 9,881 6,716

EMIS 2018 NATIONAL EDUCATION STATISTICAL BOOKLET 60
14. Teachers by level of education and qualification status
Table 14.1: Number and % of teachers per school type and professional training
Level of education Total Trained Untrained Unknown status
Count % of total Count % of total Count % of total AES 4,793 896 18.7% 3,616 75.4% 281 5.9% PPR [ECD] 2,910 607 20.9% 2,076 71.3% 227 7.8% PRI 40,822 7,149 17.5% 30,371 74.4% 3,302 8.1% SEC 4,006 2,081 51.9% 1,599 39.9% 326 8.2% TTI 29 29 100% - - - - TVET 119 56 47.1% 58 48.7% 5 4.2% UNI 800 800 100% - - - - Total 53,479 11,618 21.7% 37,720 70.5% 4,141 7.8%

EMIS 2018 NATIONAL EDUCATION STATISTICAL BOOKLET 61
15. Qualification of teachers by state This is presented to cover the different levels of education. a) Early Childhood Development (Pre-Primary)
Table 15.1: Type of training received by PPR (ECD) Qualified teachers, 2018
States Bachelor of Education and Above
2 years In Service
2 years Pre Service
4 years In Service
Diploma in Education
Totals
CEQ 23 1 79 123 44 270 Jubek 21 1 77 111 38 248 Terekeka 1 - - 2 - 3 Yei River 1 - 2 10 6 19
EEQ 11 2 43 39 18 113 Kapoeta - - 6 4 5 15 Torit 11 2 37 35 13 98
JON 2 - 6 14 4 26 Akobo 1 - 2 2 - 5 Bieh - - 1 6 - 7 Boma - - - 2 2 4 Fangak - - 1 1 - 2 Jonglei 1 - 2 3 2 8
LAK 2 - 11 26 1 40 Eastern
Lakes 1 - 3 18 1 23 Gok - - 1 6 - 7 Western
Lakes 1 - 7 2 - 10 NBG 3 - - 2 - 5
Aweil 3 - - 2 - 5 Aweil East - - - - - - Lol - - - - - -
UNI - - 11 8 - 19 Northern
Liech - - - - - - Ruweng - - 2 3 - 5 Southern
Liech - - 9 5 - 14 UPN 2 - 13 23 4 42
Central Upper Nile 2 - 9 16 - 27
Fashoda - - 2 2 - 4 Latjor - - 2 2 - 4 Maiwut - - - 2 3 5 Northern
Upper Nile - - - 1 1 2 WAR - - 11 5 3 19
Abyei AA - - 2 - - 2 Gogrial - - 6 5 - 11 Tonj - - 3 - 2 5 Twic - - - - 1 1
WBG 2 - 7 9 5 23 Wau 2 - 7 9 5 23
WEQ 1 1 17 28 3 50 Amadi - - 1 5 1 7 Gbudwe 1 1 8 9 2 21 Maridi - - 3 9 - 12 Tambura - - 5 5 - 10
Grand Total 46 4 198 277 82 607

EMIS 2018 NATIONAL EDUCATION STATISTICAL BOOKLET 62
Information presented in Table 15.1 indicates that majority of the teachers who were qualified received the ‘4 years in service’ training. A total of 277 teachers received this training. The training that was received by the fewest number of teachers is the ‘2 years in service training’. Only 4 teachers received this training.
b) Primary level of education
Table 15.2: Type of training received by PRI Qualified teachers, 2018
States Bachelor of
Education and Above
2 years In Service
2 years Pre Service
4 years In Service
Diploma in Education
CEQ 154 6 364 435 219 Jubek 127 5 279 354 196 Terekeka 1 - 15 15 9 Yei River 26 1 70 66 14
EEQ 18 - 173 206 83 Kapoeta 3 - 48 92 35 Torit 15 - 125 114 48
JON 22 2 213 238 66 Akobo 4 - 30 45 2 Bieh 2 - 50 25 13 Boma 2 - 28 47 15 Fangak 2 1 29 50 8 Jonglei 12 1 76 71 28
LAK 23 3 225 402 25 Eastern Lakes 11 - 65 158 12 Gok 2 - 36 65 3 Western Lakes 10 3 124 179 10
NBG 18 4 330 421 63 Aweil 5 2 84 84 34 Aweil East 1 2 135 187 14 Lol 12 - 111 150 15
UNI 11 - 306 283 65 Northern Liech 7 - 185 146 45 Ruweng 3 - 38 44 16 Southern Liech 1 - 83 93 4
UPN 35 - 119 184 103 Central Upper Nile 13 - 15 50 15 Fashoda 1 - 1 14 1 Latjor 5 - 22 34 15 Maiwut 9 - 25 9 50 Northern Upper Nile 7 - 56 77 22
WAR 41 13 463 600 66 Abyei AA 2 - 19 34 9 Gogrial 20 10 201 283 23 Tonj 14 2 141 133 18 Twic 5 1 102 150 16
WBG 69 - 140 322 109 Wau 69 - 140 322 109
WEQ 3 2 192 263 47 Amadi 1 2 36 64 18 Gbudwe 2 - 65 82 18 Maridi - - 25 62 11 Tambura - - 66 55 -
Grand Total 394 30 2,525 3,354 846

EMIS 2018 NATIONAL EDUCATION STATISTICAL BOOKLET 63
c) Secondary level of education
Table 15.3: Type of training received by SEC Qualified teachers, 2018
States Bachelor of Education and Above
2 years In Service
2 years Pre Service
4 years In Service
Diploma in Education
Total
CEQ 259 - 23 64 87 433 Jubek 243 - 18 49 58 368 Terekeka 1 - 1 1 2 5 Yei River 15 - 4 14 27 60
EEQ 92 - 12 14 68 186 Kapoeta 11 - 1 1 - 13 Torit 81 - 11 13 68 173
JON 62 - 6 50 3 121 Boma 6 - - - 1 7 Fangak 4 - 2 9 - 15 Jonglei 52 - 4 41 2 99
LAK 48 - 18 59 16 141 Eastern
Lakes 33 - 17 26 9 85 Gok 2 - - 2 - 4 Western
Lakes 13 - 1 31 7 52 NBG 75 2 30 60 87 254
Aweil 57 - 22 48 70 197 Aweil East 7 2 7 4 10 30 Lol 11 - 1 8 7 27
UNI 33 - 9 26 37 105 Northern
Liech 17 - - 2 7 26 Ruweng 12 - 3 - 17 32 Southern
Liech 4 - 6 24 13 47 UPN 46 - 8 2 29 85
Central Upper Nile 10 - 1 - 16 27
Fashoda - - - - - - Latjor 4 - - - 4 8 Northern
Upper Nile 32 - 7 2 9 50 WAR 124 - 40 57 38 259
Abyei AA 9 - - - - 9 Gogrial 62 - 24 18 11 115 Tonj 33 - 10 25 20 88 Twic 20 - 6 14 7 47
WBG 138 - 41 55 36 270 Wau 138 - 41 55 36 270
WEQ 68 1 12 44 102 227 Amadi 29 - 2 2 20 53 Gbudwe 25 - 5 5 59 94 Maridi 7 - 3 29 6 45 Tambura 7 1 2 8 17 35
Grand Total 945 3 199 431 503 2,081

EMIS 2018 NATIONAL EDUCATION STATISTICAL BOOKLET 64
d) Alternative Education System
Table 15.4: Type of training received by AES Qualified teachers, 2018 States Bachelor of Education
and Above 2 years In Service
2 years Pre Service
4 years In Service
Diploma in Education
Total
CEQ 9 - 22 12 8 51 Jubek 9 - 10 7 6 32 Terekeka - - - - - - Yei River - - 12 5 2 19
EEQ 2 - 37 35 12 86 Kapoeta - - 7 26 3 36 Torit 2 - 30 9 9 50
JON 1 - 14 16 9 40 Akobo - - 1 2 3 6 Bieh 1 - - 5 3 9 Boma - - 2 9 1 12 Fangak - - - - - - Jonglei - - 11 - 2 13
LAK 2 - 11 61 7 81 Eastern
Lakes 1 - 2 15 3 21 Gok - - 7 13 2 22 Western
Lakes 1 - 2 33 2 38 NBG 2 1 67 60 12 142
Aweil 1 - 26 21 4 52 Aweil East - - 19 15 2 36 Lol 1 1 22 24 6 54
UNI 2 3 45 33 8 91 Northern
Liech - 3 10 16 2 31 Ruweng 2 - 21 7 6 36 Southern
Liech - - 14 10 - 24 UPN 7 - 50 64 19 140
Central Upper Nile 5 - 25 57 11 98
Fashoda - - - 1 - 1 Latjor 1 - 22 4 1 28 Maiwut 1 - 3 - 6 10 Northern
Upper Nile - - 2 1 3 WAR 12 - 62 77 3 154
Abyei AA 1 - 1 1 - 3 Gogrial 6 - 27 15 1 49 Tonj 5 - 28 40 2 75 Twic - - 6 21 - 27
WBG - - 11 9 1 21 Wau - - 11 9 1 21
WEQ - - 46 39 5 90 Amadi - - 4 8 1 13 Gbudwe - - 14 18 1 33 Maridi - - 10 6 1 17 Tambura - - 18 7 2 27
Grand Total 37 4 365 406 84 896

EMIS 2018 NATIONAL EDUCATION STATISTICAL BOOKLET 65
e) Technical Vocational Education and Training
Table 15.5: Type of training received by TVET Qualified trainers [Teachers], 2018
States Bachelor of Education and Above
2 years Pre Service
4 years In Service
Diploma in Education
Total
CEQ 12 1 3 9 25 Jubek 12 1 3 9 25
EEQ - - - 4 4 Kapoeta - - - 3 3 Torit - - - 1 1
LAK - 1 3 - 4 Gok - 1 3 - 4
WAR - - 2 1 3 Twic - - 2 1 3
WBG 4 1 3 12 20 Wau 4 1 3 12 20
Grand Total 16 3 11 26 56
f) Teacher Training Institutes
Table 15.6: Type of training received by TTI Qualified trainers [Teachers], 2018 States Bachelor of Education and Above Diploma in Education Total EEQ 1 4 5
Torit 1 4 5 LAK 9 - 9
Gok 9 - 9 WEQ 12 3 15
Gbudwe 12 3 15 Grand Total 22 7 29
g) Universities
Table 15.7: Education qualification of University facilitators by state, 2018
Row Labels Bachelor’s degree Master’s degree PhD degree Male Female Male Female Male Female
CEQ 335 45 281 35 66 - Jubek 335 45 281 35 66 -
WAR 10 1 4 - - - Gogrial 10 1 4 - - -
WEQ 19 1 2 - 1 - Gbudwe 19 1 2 - 1 -
Grand Total 364 47 287 35 67 -
16. Accessibility to drinking water
Table 16.1: No and % of schools with/without access to drinking water per level of education, 2018 Level of education Didn’t respond Total Resp. Access No access AES 210 436 86.9% 13.1% PPR [ECD] 103 488 86.9% 13.1% PRI 236 3,612 82.9% 17.1% SEC 10 287 81.5% 18.5% TTI 1 2 100.0% 0.0% TVET 5 8 87.5% 12.5% Total 565 4,833 83.6% 16.4%

EMIS 2018 NATIONAL EDUCATION STATISTICAL BOOKLET 66
17. Accessibility to latrines
Table 17.1: Number and % of schools with access to latrines for pupils and teachers grouped by level of education in 2018
Level of education
Latrines access for pupils Latrine access for teachers Didn’t
Respond Total Resp.
% Access
% No access
Didn’t Respond
Total Resp.
% Access
% No access
AES 289 357 69.20% 30.80% 267 379 72.80% 27.20% PPR (ECD) 103 488 84.00% 16.00% 99 492 83.30% 16.70% PRI 810 3038 60.40% 39.60% 975 2873 61.50% 38.50% SEC 33 264 89.40% 10.60% 24 273 90.50% 9.50% Total 1,235 4,147 65.80% 34.20% 1,365 4,017 67.20% 32.80%
NB: The percentages are computed basing on the figures in the column of Total respondents (Total Resp.)

EMIS 2018 NATIONAL EDUCATION STATISTICAL BOOKLET 67
18. HIV, Sexuality and peace education In this section, the following key should be used to be able to understand the tables contained in this section. Code Meaning MC&CTh Decision making, communication and critical thinking CR Conflict Resolution PS Psychosocial support RH Reproductive Health HIV Trans HIV and STI transmission HHE Health, hygiene and education
a) Pre-primary level of education
Table 18.1: No of PPR (ECD) schools that offer HIV, Sexuality and Peace education by state States MC&CTh CR PS RH HIV Trans HHE CEQ 22 25 30 20 24 67
Jubek 19 20 22 14 19 54 Terekeka 1 1 1 1 Yei River 3 5 7 5 4 12
EEQ 17 20 21 20 26 41 Kapoeta 7 8 7 10 8 14 Torit 10 12 14 10 18 27
JON 7 9 10 7 7 12 Akobo 1 1 2 2 Bieh 2 2 2 2 1 1 Boma 1 1 1 1 2 Fangak 3 4 4 4 4 4 Jonglei 1 1 1 1 3
LAK 10 8 7 6 8 15 Eastern Lakes 4 4 2 1 2 8 Gok 3 2 1 1 2 3 Western Lakes 3 2 4 4 4 4
NBG 2 2 Aweil Aweil East 1 1 Lol 1 1
UNI 7 6 16 4 7 23 Northern Liech Ruweng 2 2 2 2 3 3 Southern Liech 5 4 14 2 4 20
UPN 8 9 10 5 5 15 Central Upper Nile 3 6 6 3 2 8 Fashoda Latjor 3 2 3 1 2 4 Maiwut 2 Northern Upper Nile 2 1 1 1 1 1
WAR 2 1 2 2 4 4 Abyei AA 1 1 1 1 1 1 Gogrial 1 1 1 3 3 Tonj Twic
WBG 4 2 3 2 2 3 Wau 4 2 3 2 2 3
WEQ 16 18 22 18 21 43 Amadi 5 8 6 6 5 13 Gbudwe 5 4 9 6 7 11 Maridi 3 4 3 2 3 6 Tambura 3 2 4 4 6 13
Grand Total 93 100 121 84 104 225

EMIS 2018 NATIONAL EDUCATION STATISTICAL BOOKLET 68
b) Primary level of education
Table 18.2: No of PRI schools that offer HIV, Sexuality and Peace education by state States MC&CTh CR PS RH HIV Trans HHE CEQ 70 67 75 69 79 128
Jubek 46 49 49 47 52 88 Terekeka 7 5 6 5 7 12 Yei River 17 13 20 17 20 28
EEQ 63 65 54 57 78 109 Kapoeta 16 17 18 19 24 31 Torit 47 48 36 38 54 78
JON 117 117 145 90 103 170 Akobo 15 6 19 5 5 19 Bieh 17 11 14 7 8 13 Boma 6 5 7 5 9 16 Fangak 42 51 55 41 42 58 Jonglei 37 44 50 32 39 64
LAK 104 82 78 67 82 149 Eastern Lakes 24 17 17 17 17 43 Gok 32 22 24 15 24 46 Western Lakes 48 43 37 35 41 60
NBG 131 98 116 95 114 224 Aweil 48 38 43 37 52 79 Aweil East 36 32 38 30 33 70 Lol 47 28 35 28 29 75
UNI 69 85 101 68 73 140 Northern Liech 38 55 55 44 38 74 Ruweng 6 3 9 5 9 21 Southern Liech 25 27 37 19 26 45
UPN 59 70 82 45 50 87 Central Upper Nile 6 7 11 6 6 11 Fashoda 2 2 2 3 2 2 Latjor 19 29 40 14 20 40 Maiwut 14 14 13 6 6 7 Northern Upper Nile 18 18 16 16 16 27
WAR 160 117 119 114 161 246 Abyei AA 7 7 4 4 4 10 Gogrial 81 67 68 60 77 118 Tonj 33 24 28 28 39 57 Twic 39 19 19 22 41 61
WBG 62 64 65 58 67 99 Wau 62 64 65 58 67 99
WEQ 53 57 66 56 87 135 Amadi 15 19 19 13 19 43 Gbudwe 11 13 17 16 23 32 Maridi 10 9 15 9 15 18 Tambura 17 16 15 18 30 42
Grand Total 888 822 901 719 894 1487

EMIS 2018 NATIONAL EDUCATION STATISTICAL BOOKLET 69
c) Secondary level of education
Table 18.3: No of SEC schools that offer HIV, Sexuality and Peace education by state States MC&CTh CR PS RH HIV Trans HHE CEQ 12 13 13 12 15 19
Jubek 8 8 9 7 10 11 Terekeka 1 1 1 1 2 Yei River 3 4 3 5 4 6
EEQ 7 9 10 11 10 13 Kapoeta 1 Torit 7 9 10 11 10 12
JON 5 7 9 6 9 11 Akobo Bieh Boma 1 1 1 1 1 1 Fangak 2 2 2 2 2 2 Jonglei 2 4 6 3 6 8
LAK 4 6 5 6 8 9 Eastern Lakes 1 2 3 3 5 5 Gok Western Lakes 3 4 2 3 3 4
NBG 13 13 13 18 21 26 Aweil 8 8 8 12 14 14 Aweil East 4 3 4 3 4 6 Lol 1 2 1 3 3 6
UNI 4 6 6 4 4 7 Northern Liech 1 2 2 1 1 1 Ruweng 1 1 2 Southern Liech 3 4 3 2 3 4
UPN 1 2 2 2 3 5 Central Upper Nile 1 1 1 1 1 2 Fashoda 1 Latjor 1 1 1 1 Maiwut Northern Upper Nile 1 2
WAR 12 11 9 13 17 21 Abyei AA 1 1 1 1 2 2 Gogrial 7 4 3 4 8 12 Tonj 2 4 3 4 4 3 Twic 2 2 2 4 3 4
WBG 6 7 7 8 15 12 Wau 6 7 7 8 15 12
WEQ 4 7 8 11 13 12 Amadi 0 0 2 0 1 Gbudwe 3 5 5 6 6 5 Maridi 1 1 1 3 3 3 Tambura 0 1 0 2 3 4

EMIS 2018 NATIONAL EDUCATION STATISTICAL BOOKLET 70
d) Alternative Education system
Table 18.4: No of AES centers that offer HIV, Sexuality and Peace education by state States MC&CTh CR PS RH HIV Trans HHE CEQ 2 4 4 4 4 7
Jubek 2 4 3 4 3 5 Terekeka 1 1 1 Yei River 1
EEQ 11 11 9 12 12 16 Kapoeta 5 4 6 6 4 7 Torit 6 7 3 6 8 9
JON 5 11 9 5 8 12 Akobo Bieh 1 1 1 1 1 Boma 1 1 1 1 Fangak 2 2 2 2 2 2 Jonglei 2 7 6 2 4 8
LAK 14 20 14 19 21 26 Eastern Lakes 2 9 3 7 6 9 Gok 4 2 3 3 5 5 Western Lakes 8 9 8 9 10 12
NBG 20 12 12 11 18 28 Aweil 7 3 7 5 8 14 Aweil East 3 5 2 2 4 7 Lol 10 4 3 4 6 7
UNI 12 9 16 12 10 18 Northern Liech 6 4 6 5 4 5 Ruweng 2 3 4 5 5 5 Southern Liech 4 2 6 2 1 8
UPN 7 10 14 7 10 12 Central Upper Nile 2 3 4 1 2 4 Fashoda Latjor 4 3 6 2 4 4 Maiwut 1 4 4 4 4 2 Northern Upper Nile 2
WAR 23 14 17 18 23 39 Abyei AA Gogrial 13 10 11 12 14 18 Tonj 7 3 6 5 7 17 Twic 3 1 1 2 4
WBG 2 1 1 3 3 3 Wau 2 1 1 3 3 3
WEQ 11 12 16 13 15 21 Amadi 5 5 5 4 4 7 Gbudwe 2 2 3 1 2 2 Maridi 2 3 3 4 5 5 Tambura 2 2 5 4 4 7
Grand Total 107 104 112 104 124 182