Narrowing the jobs gap: overcoming impediments to ...
45
Steve Strongin 1(212)357-4706 [email protected] Goldman, Sachs & Co. Sonya Banerjee 1(212) 357-4322 [email protected] Goldman, Sachs & Co. Sandra Lawson 1(212)902-6821 [email protected] Goldman, Sachs & Co. Michael Hinds 1(212) 357-7528 [email protected] Goldman, Sachs & Co. Katherine Maxwell 1(212) 357-2761 [email protected] Goldman, Sachs & Co. Hui Shan 1(212) 902-4447 [email protected] Goldman, Sachs & Co. GLOBAL MARKETS INSTITUTE | July 2016 Narrowing the jobs gap: overcoming impediments to investing in people
Transcript of Narrowing the jobs gap: overcoming impediments to ...

Steve Strongin1(212)[email protected], Sachs & Co.
Sonya Banerjee 1(212) [email protected], Sachs & Co.
Sandra Lawson1(212)902-6821 [email protected] Goldman, Sachs & Co.
Michael Hinds1(212) 357-7528 [email protected], Sachs & Co.
Katherine Maxwell1(212) [email protected], Sachs & Co.
Hui Shan1(212) [email protected] Goldman, Sachs & Co.
GLOBAL MARKETS INSTITUTE | July 2016
Narrowing the jobs gap: overcoming impediments to investing in people

Thanks to Jeff Currie, Jan Hatzius, Charlie Himmelberg, Brian Rooney, Carl Cederholm and
Jennifer Carey.
The Global Markets Institute is the public-policy research unit of Goldman Sachs Global
Investment Research, designed to help improve public understanding of capital markets and their
role in driving economic growth.

July 1, 2016 Global Markets Institute
Goldman Sachs Global Investment Research 2
Narrowing the jobs gap: key points
Although technological change is good for the economy over the long run, it isn’t necessarily good for everyone,
particularly in the short term. The economy as a whole benefits from the higher living standards that
technological innovation generates. But for the people whose jobs are displaced by technology, the macro
benefits are of little comfort.
Occupations and industries follow a natural evolution. Early on, new job opportunities are plentiful and the work
is often well-compensated. Over time, jobs become vulnerable to automation, outsourcing or falling wages (or
some combination of the three). This process reflects the normal course of economic demand, not any changes
in policy. As automation becomes cost-effective, people’s economic role shifts from ‘doing’ the work to
‘organizing, coordinating and supervising’ the increasingly complex resources and activities behind it. Today,
the pace of this evolution is accelerating as measurement technologies and data-collection capabilities improve,
putting more jobs at risk.
The broader economy benefits if more people who are at risk of job displacement retrain and shift to new
industries where their competitive advantages over machines offer better long-term economic prospects. But an
investment analysis shows that while changing careers makes sense at the macro level, the decision is more
complex from an individual’s perspective, particularly since she must shoulder the burden of investing in human
capital on her own. Often, waiting for even an unlikely job opening in her current occupation can be a superior
choice to switching careers, because of the uncertainty involved.
This dynamic has helped create a ‘jobs gap’ – the gap that often exists between the types of jobs that people
want and the types of jobs that are available. Closing the jobs gap requires a new approach to risk-sharing, one
that spreads the burden of investing in human capital more broadly. This risk-sharing approach should include a
greater educational focus on social skills, creativity and judgment, not only STEM subjects; expanded incentives
for corporate job training; standardized labor contracts; innovative financing structures to support investments
in human capital and career transitions; lower barriers to entry into certain professions; increased support for
small-business creation; and regulation that supports the growth of the ‘freelance economy.’
Exhibit 1: As economic activity expands, technology doesn’t eliminate the need for people – it changes their role Over time, people’s principal economic role has evolved from physically ‘doing’ work to ‘organizing, coordinating and
supervising’ complex resources and activities. As economic activity expands, more people are needed (rather than fewer) to
manage the increasing number and sophistication of non-labor inputs
Source: Goldman Sachs Global Investment Research.
Non-labor
inputsNon-labor inputs
Non-
labor
inputs
Labor
Total economic activity over time
Labor
Labor

July 1, 2016 Global Markets Institute
Goldman Sachs Global Investment Research 3
Table of contents
I. Narrowing the jobs gap: overcoming impediments to investing in people 4
II. Why technological progress can hurt today’s jobs even as it benefits the economy’s future 5
III. Technology versus individuals in the 21st century 10
IV. The investment analysis: impediments to investing in people 13
V. The disconnect between individual loss and aggregate gain creates policy challenges 16
VI. Conclusion 22
Appendix A: Technological innovation has fueled job destruction and creation throughout American history 23
Appendix B: The natural ‘arc’ of occupations and industries 27
Appendix C: How uncertainty keeps individuals from moving out of declining industries 32
Bibliography 41

July 1, 2016 Global Markets Institute
Goldman Sachs Global Investment Research 4
I. Narrowing the jobs gap: overcoming impediments to investing
in people
Conflict between technological progress and labor dates back centuries. By allowing
people to offload tasks to machines, technological innovation eliminates some jobs but
also paves the way for new forms of employment and for higher living standards overall.
As part of this process, the nature of work evolves; over time, people have shifted from
‘doing’ physical labor to ‘organizing, coordinating, and supervising’ increasingly complex
resources. In this way, technology has underpinned the innumerable ways in which
economic activity has expanded, modernized and become more inclusive and flexible.
The activities that are offloaded to machines tend to be data-intensive, repetitive and
standardized – work for which technology and machines are more efficient than people,
especially when done at scale. Many occupations (and on a larger scale, many industries)
follow a natural evolution. In the early days they are small-scale, innovative, creative and
often well-compensated; people dominate. In the later phases these jobs and industries
become large-scale, standardized and repetitive and the jobs typically become less
remunerative; cost-effective automation displaces people. Given the rapid improvements in
measurement and data-collection tools, the pace of these transitions is accelerating and the
need to identify how best to deploy – and subsequently redeploy – labor has become more
pressing.
While the benefits of technological progress are felt by the economy as a whole over time,
this is of little comfort to the individuals whose jobs are displaced by technology (with clear
parallels to the impact of globalization). They find themselves in an untenable position as
their skills become obsolete, their human capital erodes and their jobs cease to be ‘good.’
Existing incentives and policies make successful career transitions difficult, particularly for
people with significant work experience and above-average earnings. Often, the
individual’s best economic alternative is to wait and see whether she can find employment
that leverages her existing skills – rather than to invest in new employment possibilities –
even if finding a new job in her current industry is highly unlikely.
An investment analysis uncovers the economics driving the decisions of whether, and how,
to make the investments in human capital that will narrow the ‘jobs gap.’ This is the gap
that often exists between the types of jobs that people want and the types of jobs that are
available. The economy in the aggregate benefits if the individuals who are at risk of being
displaced by technological innovation move to industries with better long-term prospects.
Yet it can be extremely difficult to make these career transitions successfully and to bridge
the ‘jobs gap’ without external assistance.
Companies’ incentives to formally invest in employees’ human capital are dampened by
the risk that the investments will be one-sided; employees may leave, taking the benefits of
their training with them before the company has had a chance to recoup the expense. As a
result, the burden of investing in human capital falls principally on individuals, who may
not be well-placed to bear it.
The economics of these investment decisions point to the public-policy changes needed to
narrow the jobs gap, namely by providing greater assistance to individuals and to
businesses in order to encourage broad-based investments in human capital. These
changes include a greater educational focus on the skills that underpin ‘adaptive’
occupations, changes to labor contracts, expanded incentives to encourage private-sector
investment in job training, innovative financing structures to support the potentially costly
process of career transitions and support for small businesses and the freelance economy.
In effect, a new approach to risk-sharing is needed.

July 1, 2016 Global Markets Institute
Goldman Sachs Global Investment Research 5
II. Why technological progress can hurt today’s jobs even as it
benefits the economy’s future
Today’s rapid spread of technology is only the latest phase in a long historical story that
has played out in the US (and elsewhere) many times before. In the 19th century, new
agricultural technology vastly increased farming productivity and output, reducing the
need for agricultural labor and capital. These surplus resources were reallocated to the
burgeoning manufacturing sector beginning in the late 19th century and extending into the
mid-20th century. Subsequent innovations in machine-production processes led to a boom
in manufacturing that again reduced the need for labor and capital, freeing up the
resources that drove the later 20th-century information revolution. Productivity gains from
that information revolution have in turn paved the way for the current era of the web, big
data and machine learning.
These historical transformations share common features. Initially, the industry that lay at
the center of innovation drew inflows of capital and labor, supporting high-profile
investments and disruptors and seeming to promise vast opportunities and the extensive
creation of high-paying jobs. Productivity rose, making the goods these sectors produced
cheaper and more abundant and transforming expensive luxuries into affordable everyday
items. But at the same time, higher productivity also reduced the need for labor and the
returns to capital in that sector, encouraging both to move elsewhere. Perhaps counter-
intuitively, on a relative basis, the sector that was once at the forefront of technological
innovation ultimately employed fewer people, required less capital and consumed a
smaller share of total spending. The reallocation of excess capital and labor to other
sectors, where lower initial levels of productivity created opportunities for higher returns,
started the cycle again.
This shift from novel to unremarkable makes economic sense. Today, agriculture employs
just 2% of the American workforce, down from 80% in the early 19th century, while
manufacturing employment has fallen to roughly 10% today from a peak of nearly 30% in
1960. See Exhibit 2. Spending patterns have changed: food accounts for less than 10% of
consumer spending today, down from nearly 25% just 80 years ago, as Exhibit 3 shows.
Appendix A tracks these economic transformations in more detail.
Exhibit 2: The share of labor in both agriculture and
manufacturing has declined over time, while the share of
labor in services has increased Share of workers aged 16+ in labor force
Exhibit 3: Food has accounted for a decreasing
proportion of consumer spending over time Share of annual consumer spending on food and drink
Source: IPUMS-USA, University of Minnesota, www.ipums.org, Goldman Sachs Global Investment Research. Note: data are not available for 1890.
Source: Bureau of Economic Analysis, Goldman Sachs Global Investment Research.
0%
10%
20%
30%
40%
50%
60%
70%
80%
1850 1860 1870 1880 1900 1910 1920 1930 1940 1950 1960 1970 1980 1990 2000 2010
Shar
e o
f w
ork
ers
(16 y
rs+)
Services
Manufacturing
Agriculture
0%
5%
10%
15%
20%
25%
30%
1930 1940 1950 1960 1970 1980 1990 2000 2010
Pro
port
ion o
f an
nual
consu
mer
sp
endin
g o
n f
ood a
nd b
ever
ages

July 1, 2016 Global Markets Institute
Goldman Sachs Global Investment Research 6
From doing to organizing
Exhibit 4 illustrates the evolution of economic activity over a very long time frame.
Economic activity has never been only about people. ‘Non-labor inputs’ have been
important since the hunter-gatherer age, beginning with plants and animals, moving
through tools and machinery and extending to the network connectivity of today. Starting
at a point in the past when the scope of labor inputs was roughly equivalent to that of non-
labor inputs, people spent as much time ‘doing’ physical work as they did ‘coordinating’
non-labor inputs (the far-left circle below). Over time, as non-labor inputs have become
more numerous and increasingly sophisticated, they have dramatically broadened the
scope of what a single person can accomplish and have expanded the universe of
economic activity (or total production, often approximated today by GDP) (as shown in the
far-right circle below).
Exhibit 4: As economic activity expands, technology doesn’t eliminate the need for people – it changes their role Over time, people’s principal economic role has evolved from physically ‘doing’ work to ‘organizing, coordinating and
supervising’ complex resources and activities. As economic activity expands, more people are needed (rather than fewer) to
manage the increasing number and sophistication of non-labor inputs
Source: Goldman Sachs Global Investment Research.
At first glance – and particularly from the perspective of a person whose job has been
threatened by or lost to automation – this illustration may suggest that technology is
pushing people to the fringes and ultimately eliminating them from the world of work
entirely. But the reality is that people remain critical to economic activity: the key is that the
nature of ‘work’ has changed over time as the ratio of non-labor to labor inputs has
shifted.1
1 See for example, Katz and Margo, “Technical change and the relative demand for skilled labor: the United States in historical perspective,” 2013.
Non-labor
inputsNon-labor inputs
Non-
labor
inputs
Labor
Total economic activity over time
Labor
Labor

July 1, 2016 Global Markets Institute
Goldman Sachs Global Investment Research 7
Technology reduces the scope of work that involves heavy physical labor, dangerous
machinery and tedious repetition. This pushes people into new roles: organizing,
structuring and bringing their problem-solving skills to bear on the ever-growing realm of
non-labor inputs. Organizing and coordinating rely more on attributes like creativity,
judgment and social skills, and less on physical attributes like strength, speed, good
eyesight and manual dexterity.
Non-labor inputs don’t eliminate people from the economic equation. Instead the existence
and sophistication of the non-labor inputs allow people to stretch their capabilities by
focusing on organizing and supervising the tools that generate the output.
Consider farming. For centuries the scope of a farmer’s activity was limited to what a
family could grow, by hand, on a small patch of land. Tools like the steel plow and the
grain drill made labor more efficient and allowed farmers to cultivate bigger plots; the work
itself became more complex as people were required to master use of the new tools. When
machinery entered the mix, farmers could do more: cultivate more land, farm multiple
crops in size, install efficient irrigation systems and move beyond subsistence agriculture.
Today, thanks to information technology and network connectivity, much of farming can be
done remotely.
The same is broadly true in occupations not typically thought of as technology-intensive,
such as housekeeping. Technology has not eliminated physical labor, but it has reduced
the intensity of such work. Modern machinery and cleaning products have dramatically
expanded the productive capacity of housekeepers and have shifted the work away from a
complete reliance on heavy physical labor and toward a greater role in ‘coordinating’ the
use of new products.
Or consider the historical development of transport, which initially was all about labor –
walking. Non-labor inputs from the horse to the cart to the stagecoach and ultimately the
car changed the dynamic, and walkers became riders whose principal role was to direct
and control the new mode of transport. Trains and planes went one step further,
concentrating the organizational activity in just a few positions (engineers, pilots and
controllers); fewer actors can now move many more people.

July 1, 2016 Global Markets Institute
Goldman Sachs Global Investment Research 8
Replacing yesterday’s jobs with today’s
As occupations and industries evolve, they follow what can be thought of as a natural ‘arc.’
We show this progression in Exhibit 5 and discuss the economics behind it in greater detail
in Appendix B.
In the early days of an industry – the price-elastic phase – falling prices result in rapid
growth in demand and attract labor and capital. During this period, particularly the early
part, there are typically few formal requirements for employment, and wages are above-
market in order to compensate for risk and to attract highly motivated and flexible
employees. These favorable dynamics are shown as the ‘price-elastic phase’ of the arc in
Exhibit 5.
A dramatically different dynamic begins to unfold as demand growth slows and the
industry enters the price-inelastic phase. Productivity now outstrips demand growth,
demand for both labor and capital begins to shrink, and jobs become vulnerable to
automation, outsourcing or falling wages (or some combination of the three). The wage
premium shrinks and the present value of the employment declines. ‘Good’ jobs lose their
luster and, once automation fully sets in, disappear. The jobs that do remain in the industry
are less repetitive and more complex; they require employees to continue building job- or
industry-specific skills even when the employment outlook for the industry is in structural
decline. The inflection in demand and spending is shown as the start of the ‘price-inelastic
phase’ in Exhibit 5, while the accompanying decline in employment is illustrated in Exhibit
6.
This transformation reflects the normal evolution of demand rather than any changes in
policy. No matter what the price, after a certain point greater consumption becomes less
fulfilling and often simply impractical. The transition from price-elastic to price-inelastic is
typically driven by a combination of broad adoption and natural constraints on greater
consumption (such as a 2000-calorie diet or a finite number of leisure hours). Policy can
ameliorate some of the impact of this shift, but it cannot change the underlying dynamic.
Similarly, trade and globalization may accelerate this process, but they are not the
underlying causes.
Exhibit 5: The natural ‘arc’ of an occupation or industry In the price-elastic phase, the sector attracts labor, capital
and a larger proportion of spending, but these decline in the
price-inelastic phase. See Appendix B
Exhibit 6: Higher US agricultural productivity ultimately
led to inelastic demand and fewer labor inputs See Appendix B
Source: Goldman Sachs Global Investment Research.
Source: Goldman Sachs Global Investment Research.
% s
har
e of
expen
dit
ure
Time, measured in years
Price-elastic phase Price-inelastic phase
100
0200
0
10
20
30
40
50
60
1850 1870 1890 1910 1930 1950 1970 1990 2005 2007 2009
% s
har
e o
f la
bor
dev
ote
d t
o t
he s
ect
or
wit
h
hig
h p
roduct
ivit
y gro
wth
Year
Actual
Model prediction
Agriculture employment share:
July 1, 2016 Global Markets Institute
Goldman Sachs Global Investment Research 9
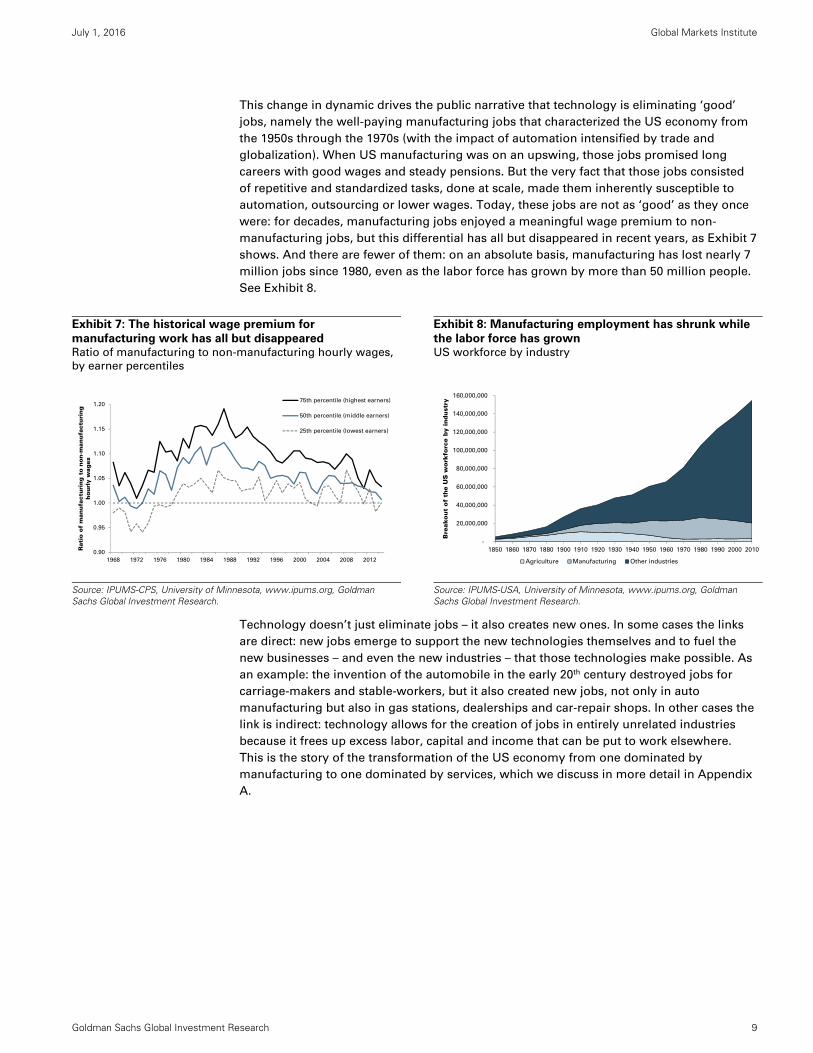
This change in dynamic drives the public narrative that technology is eliminating ‘good’
jobs, namely the well-paying manufacturing jobs that characterized the US economy from
the 1950s through the 1970s (with the impact of automation intensified by trade and
globalization). When US manufacturing was on an upswing, those jobs promised long
careers with good wages and steady pensions. But the very fact that those jobs consisted
of repetitive and standardized tasks, done at scale, made them inherently susceptible to
automation, outsourcing or lower wages. Today, these jobs are not as ‘good’ as they once
were: for decades, manufacturing jobs enjoyed a meaningful wage premium to non-
manufacturing jobs, but this differential has all but disappeared in recent years, as Exhibit 7
shows. And there are fewer of them: on an absolute basis, manufacturing has lost nearly 7
million jobs since 1980, even as the labor force has grown by more than 50 million people.
See Exhibit 8.
Exhibit 7: The historical wage premium for
manufacturing work has all but disappeared Ratio of manufacturing to non-manufacturing hourly wages,
by earner percentiles
Exhibit 8: Manufacturing employment has shrunk while
the labor force has grown US workforce by industry
Source: IPUMS-CPS, University of Minnesota, www.ipums.org, Goldman Sachs Global Investment Research.
Source: IPUMS-USA, University of Minnesota, www.ipums.org, Goldman Sachs Global Investment Research.
Technology doesn’t just eliminate jobs – it also creates new ones. In some cases the links
are direct: new jobs emerge to support the new technologies themselves and to fuel the
new businesses – and even the new industries – that those technologies make possible. As
an example: the invention of the automobile in the early 20th century destroyed jobs for
carriage-makers and stable-workers, but it also created new jobs, not only in auto
manufacturing but also in gas stations, dealerships and car-repair shops. In other cases the
link is indirect: technology allows for the creation of jobs in entirely unrelated industries
because it frees up excess labor, capital and income that can be put to work elsewhere.
This is the story of the transformation of the US economy from one dominated by
manufacturing to one dominated by services, which we discuss in more detail in Appendix
A.
0.90
0.95
1.00
1.05
1.10
1.15
1.20
1968 1972 1976 1980 1984 1988 1992 1996 2000 2004 2008 2012
Rati
o o
f m
anufa
ctu
ring t
o n
on-m
anufa
ctu
ring
h
ourl
y w
ages
75th percentile (highest earners)
50th percentile (middle earners)
25th percentile (lowest earners)
-
20,000,000
40,000,000
60,000,000
80,000,000
100,000,000
120,000,000
140,000,000
160,000,000
1850 1860 1870 1880 1900 1910 1920 1930 1940 1950 1960 1970 1980 1990 2000 2010
Bre
ako
ut
of
the
US
wo
rkfo
rce
by
indust
ry
Agriculture Manufacturing Other industries

July 1, 2016 Global Markets Institute
Goldman Sachs Global Investment Research 10
III. Technology versus individuals in the 21st century
Looking at the evolution of employment over the course of prior technological revolutions
illuminates the core of what technology is and what it can do. Over time, machines have
consistently excelled in jobs done at scale – repeated tasks that are capable of
accurate measurement, that use standardized components and processes and that
are performed in controlled environments in order to produce consistent outcomes.
This hasn’t changed. What has changed is the scope of activities in which machines can
excel and the pace at which such transitions are occurring.
In just the past two decades, tremendous increases in analytics capability, the development
of more precise measurement techniques and the emergence of advanced processing
capability and near-infinite data-storage capacity have expanded the range of jobs that are
susceptible to automation. Machine learning is the most recent example of what happens
when simple brute-force pattern recognition is combined with massive databases or with
cheap, highly flexible and accurate sensors that can generate vast amounts of data.
Perhaps the most remarkable illustration of the pace of change is the self-driving car, which
only 15 years ago was still a dream given the context-specific nature of driving and its
intense reliance on human judgment. Thanks to technological advancements in sensors,
global positioning systems and learning algorithms, which gather and process billions of
data points instantaneously, driverless cars are a reality today and in another decade may
be the norm.
Yet even as the universe of things that can be measured and automated grows, the
inherent limits on technology remain. The key limiting factor on automation is its reliance
on data. Data allow for clear and consistent inputs, standard production processes and
consistent outcomes. Without data, automation and technology cannot be as effective as a
person would be. Despite fears that technology will eliminate employment across the
board, automation is actually only well-suited for tasks that meet rigid and limiting
characteristics.2
The changing nature of work: the rise of adaptive occupations
Given these limits, it is not surprising that we also see growth in ‘adaptive occupations,’
which require the attributes machines lack. Adaptive occupations respond to and generate
the eternal demand for the ‘new’ – the creation of original content, the identification of
previously unmet or unrecognized needs, the unique situation that can’t be replicated or
that can only be resolved through the application of specialized skills, experience or
judgment.
People maintain a competitive advantage in almost all contexts in which repetition and
measurement are not central or not even possible. They have a lasting competitive
advantage in jobs that require personal attributes like judgment, creativity, problem-
solving and the ability to read social cues. They also have a lasting competitive advantage
in jobs that involve questions of taste or complex customer preferences, jobs that occur in
new or unique settings and jobs that require direct interpersonal interaction. Similarly,
people are needed for jobs in which the process and the outcome depend on variable and
changing factors, such as the physical and social environment, the degree of customization
required and the level of professional expertise needed. In all of these cases, machines
don’t work as effectively.
2 See Autor, “Polanyi’s paradox and the shape of employment growth,” 2014.

July 1, 2016 Global Markets Institute
Goldman Sachs Global Investment Research 11
Adaptive occupations frequently involve interpersonal interaction or a social aspect; the
interaction is most often direct and physical but can also be done remotely. This need for
interpersonal interaction also means that many adaptive jobs can only be done on a small
scale. And while most are found in service industries, adaptive occupations can also
include small-scale goods production.
Though they generally deal with things more than with people, many traditional trades
(such as electricians, carpentry, plumbing, locksmiths and tailors) also fall into the category
of adaptive occupations. These trades involve site- and context-specific work and typically
require a combination of specialized training, the exercise of professional judgment and
interaction with customers. People working in adaptive trades gain professional expertise
by doing the same work over and over again, but the work is sufficiently different each
time that it can’t be automated: every project is unique.
Exhibit 9 highlights some adaptive occupations that the Bureau of Labor Statistics expects
to show rapid growth over the coming decade.
Exhibit 9: Adaptive occupations are expected to see robust growth Selected occupations projected by the BLS to have the fastest growth rates between 2014-2024
Source: US Bureau of Labor Statistics, Occupational Employment Statistics program, Goldman Sachs Global Investment Research.
Technology can play a role in many adaptive occupations by automating the routine tasks.3
In these cases, automation doesn’t compete with people. Instead, it allows people to
devote more time, energy and resources to the areas where they have a natural
competitive advantage over technology, and where they add the most value – the creative
or non-routine parts of the job. This is the dynamic illustrated in Exhibit 4, playing out on
the smaller scale of a single occupation. As an example, consider how vast data-processing
and computing power have changed the job of a litigator. Automating the previously labor-
intensive process of discovery opens more time for the higher-skill tasks of strategy,
writing and trial advocacy.
3 The benefits from mixing people and machines stem from the distinction between tasks and jobs. Tasks are specific activities; jobs consist of clusters of tasks, meaning that individual tasks can be automated even if whole jobs cannot. See Autor, “The ‘task approach’ to labor markets: an overview,” January 2013.
2014A 2024E Number Percent
Total, all occupations 150,540 160,329 9,789 7% $36,200 -
Physical therapist assistants 79 111 32 41% $55,170 Associate's degree
Home health aides 914 1,262 348 38% $21,920 No formal educational credential
Nurse practitioners 127 172 45 35% $98,190 Master's degree
Physical therapists 211 283 72 34% $84,020 Doctoral or professional degree
Ambulance drivers and attendants, excl. EMTs 20 26 7 33% $23,740 High school diploma or equivalent
Physician assistants 94 123 29 30% $98,180 Master's degree
Operations research analysts 91 119 28 30% $78,630 Bachelor's degree
Personal financial advisors 249 323 74 30% $89,160 Bachelor's degree
Interpreters and translators 61 79 18 29% $44,190 Bachelor's degree
Optometrists 41 52 11 27% $103,900 Doctoral or professional degree
Web developers 149 188 40 27% $64,970 Associate's degree
Occupational therapists 115 145 30 27% $80,150 Master's degree
Personal care aides 1,768 2,227 458 26% $20,980 No formal educational credential
Phlebotomists 113 141 28 25% $31,630 Postsecondary nondegree award
Emergency medical technicians and paramedics 241 300 59 24% $31,980 Postsecondary nondegree award
Typical education needed for entryMedian annual
wage, 2015Employment (000s) Change, 2014-24Selected occupations projected to have the fastest
growth rates
July 1, 2016 Global Markets Institute
Goldman Sachs Global Investment Research 12
Over time, even adaptive occupations can evolve into jobs that can be automated in ways
that eliminate the role of individual labor. As we mentioned earlier, the key is data. Once
processes are no longer new, and once people have exercised their professional judgment
in similar circumstances thousands of times, data as to what works and what doesn’t
becomes available. Once data makes standardization possible, then machines and
processes can be designed to do the work more quickly, more effectively or more cheaply
(or all three). At this point, the individuals who find themselves displaced by automation
will fare better if they look for new employment elsewhere, in fields where this level of data
doesn’t yet exist and where technology is not (yet) able to replace labor.
The pace at which occupations and industries move along this natural arc is accelerating,
reflecting the ways in which the scale of business has grown, data collection has become
easier and measurement technologies have become cheaper and more flexible. This makes
narrowing the jobs gap – redeploying people to new opportunities that are not only more
critical to the overall health of the economy but also better for the affected individuals
themselves – all the more urgent.
July 1, 2016 Global Markets Institute
Goldman Sachs Global Investment Research 13
IV. The investment analysis: impediments to investing in people
The impact of technological change can be personal and quite painful. It makes hard-won
skills obsolete, diminishes – if not destroys – human capital and often leads to permanently
lower income. But at the macro level, technological change is impersonal and beneficial,
replacing existing products with newer and cheaper goods that generate higher standards
of living and overall prosperity. The net result is positive for the economy as a whole,
especially over the long term. But this is of little consolation to the individuals whose jobs
have been displaced along the way and who feel that the social contract has failed them
even though they have ‘played by the rules.’
The problem is that it is difficult for individuals to anticipate when and how the rules will
change. Many career paths look predictable and profitable – until suddenly a person
realizes that his ‘good’ job is in a declining industry being transformed by automation,
offshoring, falling wages or some combination of the three.
To cope with the increasingly rapid and highly personalized deprecation of their own
human capital, individuals will need to find effective ways to retrain and to refresh and
redeploy their own skills. The challenge is in finding how to make the economics of this
new investment work. It is clearly in the broader interest to make that investment – but
under existing incentives, it is often in neither a company’s nor a person’s own economic
interest to do so.
To see the problem from a corporate standpoint, consider a company facing an
economically equivalent choice between investing in technology and hiring a person, when
the machine and the person have the same direct costs and produce the same output. In
this (somewhat artificial) scenario, the company will almost certainly choose to invest in
the technology rather than hire and invest in training the person.
There are many reasons why this is the case. The obvious ones are the tax and accounting
rules that typically favor investing in capital (machinery) rather than labor (people). Over
the longer term, two other factors likely matter more. The fact that technology lends itself
to scale more effectively than people do means that an evenly balanced choice today will
strongly favor technology as the better decision for the future. And perhaps most
important is the fact that the employer’s investment in a machine has less payback risk
than does an equivalent investment in a person, particularly since people can change
employers and take any acquired skills with them.
From the individual’s standpoint, the decision whether to retrain is a classic investment
problem, involving the nature of human capital. Human capital is effectively a highly
concentrated portfolio of non-transferable assets with heavy sunk costs in the form of
education, training, licensing and experience.
Someone seeking to develop the new human capital needed for success in a different field
must write off a significant share of his existing stock. To benefit from the higher expected
returns in the new industry, this person will need to recreate all of these investments,
which will take time – with no guarantee that his future earnings will match what he earned
in the past. Along with the significant uncertainty as to the ultimate returns from the career
change, there is also the high likelihood of a reduced income for the foreseeable future, not
just during training but also during the early years of the new job. This makes changing
careers both expensive and risky, particularly if the person doesn’t have external help.

July 1, 2016 Global Markets Institute
Goldman Sachs Global Investment Research 14
Alternatively, the person at risk of being displaced can wait and hope that an employment
opportunity will arise in his current industry, one that allows him to preserve the value of
his accumulated human capital. Even industries in decline generate job openings and
opportunities as they shrink; for the person on the ground who sees the gross flows of job
creation rather than the net number, there is always the chance that one will become
available to him. In contrast, there is little chance of returning to his former situation once
he leaves his current industry, given how quickly human capital atrophies.
Faced with this choice, the natural inclination is to ‘wait and see for now.’ As we discuss in
much greater detail in Appendix C, the choice to postpone making a decision can be
economically rational for the person, even though it is a worse outcome for the economy
as a whole.4 Exhibits 10 and 11 illustrate this dynamic for a worker considering shifting to a
new industry. Given the magnitude of the loss from changing careers and the fact that a
delay will barely affect the net present value of the new occupation (because the choice will
still exist in the future), even a small probability that the prospects for his current job will
improve can be enough to make delaying a better choice, at least in the near term.
Because ‘wait and see’ is the easier choice for the person caught between two uncertain
outcomes, it makes economic sense to repeat that short delay, time after time. The risk is
that ‘for now’ may become ‘forever,’ and in the end the person may never make the
transition to a new career with a higher net present value.5
Exhibit 10: A net present value analysis suggests that a
person displaced by technology should opt to change
careers immediately . . . See Appendix C for the NPV analysis
Exhibit 11: . . . but this analysis overlooks the fact that
the person can wait and postpone making a decision See Appendix C for the NPV analysis
Source: Goldman Sachs Global Investment Research.
Source: Goldman Sachs Global Investment Research.
4 The economic losses associated with job displacement and the value of retraining are well-recognized. But research often overlooks the dislocations that individuals sustain in this process as well as the idea that what might be economically rational for a person may not align with what is best for the economy as a whole. See for example Neal, “Industry-specific human capital: evidence from displaced workers,” 1995; Jacobson, LaLonde and Sullivan, “Is retraining displaced workers a good investment?,” 2005; O’Leary, “Policies for displaced workers: an American perspective,” 2010.
5 See Jacobson, LaLonde and Sullivan, “Earnings losses of displaced workers,” 1993.
10 20 30 40 50 60 70 80
($700,000)
($500,000)
($300,000)
($100,000)
$100,000
$300,000
$500,000
$700,000
-20 -15 -10 -5 0 5 10 15 20 25 30 35 40 45 50
NPV of switching if "switch
immediately" is chosen
Value of real option
Industry A income, if bad outcome
Industry A income, if good outcomeFinal
NPV 10 20 30 40 50 60 70 80
($100,000)
$0
$100,000
$200,000
$300,000
$400,000
$500,000
$600,000
$700,000
-20 -15 -10 -5 0 5 10 15 20 25 30 35 40 45 50
Never
switch
careers
Wait &
switch
careers only
if bad
outcome for
industry A
Switch careers
immediately
Industry A income, if bad outcome
Final
NPV
Industry A income, if good outcome

July 1, 2016 Global Markets Institute
Goldman Sachs Global Investment Research 15
The problem is especially acute for more-experienced and higher-skilled individuals. For
them, the loss from writing-off existing human capital is larger, the period over which the
new investment can pay off is typically shorter and the likely costs of disruption (not only
to the person, but also to the person’s family) are higher. Thus the value of the probability
– however small – that this person’s prospects in his job will improve makes it far more
difficult for well-established and experienced individuals to choose to retrain, reinvest in
their human capital or relocate. As we discuss in more detail in Appendix C, the ‘wait and
see’ option may appear particularly attractive for them.
Yet the ‘wait and see’ approach is not the best answer for the economy as a whole. The
aggregate decisions of many individuals to leave their current jobs and retrain for new,
more promising occupations – rather than to stay put and wait to make the decision – will
benefit the broader economy, generating higher income and a more efficient allocation of
capital and labor. This more efficient allocation will support the creation of new jobs. See
Exhibit 12, which illustrates how the distribution of average wages narrows as more people
leave industries with weak career prospects.
Overcoming the obstacles that prevent people from changing careers can be extremely
challenging and will require the greatest changes to existing institutional arrangements.
Exhibit 12: The option value of waiting is high for an individual, but minimal for the
broader economy Distribution of wages changes as the number of people changing careers rises
Source: Goldman Sachs Global Investment Research.
0%
1%
2%
3%
4%
5%
6%
7%
8%
9%
10%
0%
10%
20%
30%
40%
50%
60%
$24,000 $26,000 $28,000 $30,000 $32,000 $34,000 $36,000 Pro
babilit
y o
f outc
om
e f
or
the g
roup o
f 100 w
ork
ers
Pro
babil
ity
of
outc
om
e
Average annual wage for 1 or more workers (40 yrs or old) after switching careers
1 worker Group of 2 workers Group of 3 workers
Group of 4 workers Group of 5 workers Group of 100 workers (RHS)

July 1, 2016 Global Markets Institute
Goldman Sachs Global Investment Research 16
V. The disconnect between individual loss and aggregate gain
creates policy challenges
Our investment analysis points to the need to consider how changes in public, educational
and employment policies can improve the likelihood of successful career transitions,
reduce the frictions that changing careers generates and put more people on the path to
new jobs and higher wages. In effect, this means re-thinking risk-sharing. Spreading the
costs and the risks of career transitions makes sense if the view is that the broader
economy benefits from the average increase in income for individuals who change
occupations or industries, as well as from a higher-skilled labor force and from a labor
market that values these skills.
Easing career transitions will require a reassessment of education and job-training, a
rethinking of employment from the firm’s perspective and the development of innovative
financing structures. Other important steps to shift some of the burden of risk away from
the individual will include decoupling benefits from employment, removing unnecessary
barriers to entry into professions, regulating the ‘freelance economy’ in ways that do not
stifle its growth and reducing the regulatory burden that impedes small-business creation.6
Educating tomorrow’s workforce today
Today’s educational system reflects an outdated paradigm in which young people learn a
single trade or skillset, find lifetime employment in a single industry and then retire with a
steady pension. But today’s labor market – and especially tomorrow’s – is more likely to
see people shift from one trade or skillset to another, and from one industry to another, for
the second or even third phases of their careers.
The conventional view about the relationship between technological change and education
is that more students should study STEM subjects (science, technology, engineering and
math). While there is generally an understanding that people cannot outrun technology in
many fields, the intent is to help them drive the development and application of technology.
Because teaching STEM is (largely) scalable, this is also an attractive approach for
policymakers looking for easily scalable solutions to employment or education.
But studying math and science – while undoubtedly important – isn’t the answer to the
question of how individuals will adapt to the new labor market. It’s unrealistic to think that
everyone wants to or will become a scientist, a coder or a technology developer, despite
teachers’ best efforts and despite deep investments in STEM education. Nor is it realistic to
think that even STEM professions will be protected from automation – and thus protect
employees – in the long run. Consider what happened to pioneers in computer
programming: programmers with extensive knowledge of COBOL were once highly valued,
but newer and simpler languages have since pushed those skills to the fringes.
6 For a discussion of the challenges facing small businesses, see http://www.goldmansachs.com/our-thinking/public-policy/regulatory-reform/2-speed-economy.html

July 1, 2016 Global Markets Institute
Goldman Sachs Global Investment Research 17
Because it will take longer for computers to replicate the social skills that underpin interpersonal interactions, preparation for the work of the future requires an emphasis on a different set of skills. Individuals will get ahead based on
their judgment, critical thinking, creativity and abilities to interpret fluid situations and
interact with others. To prepare students for this world of work, education will need to
stress ‘foundational middle skills’7 – not just literacy and numeracy, but also adaptability,
problem-solving, common sense and team-building skills. This is less a question of
curriculum per se but more a question of how subjects are taught – how interactive they
are, how much the problems reflect ‘real life,’ how much teamwork is required and how
team dynamics are assessed. Making resilience training a formal part of education may
also bolster people’s ability to adapt to rapidly changing labor markets in the future.
Community colleges have historically been a convenient and affordable option for people
seeking postsecondary education. But these institutions have come under pressure in
recent years – with public funding cuts, higher tuition, decreasing enrollment and
completion rates well below 50%8 – and there is room to improve upon the traditional
structure, which has typically included a mix of developmental education and job-training
curriculum. Reorienting community-college programs to focus more on apprenticeships
and other forms of job training, and offering direct paths to jobs at local businesses upon
completion, would be a practical way to leverage existing infrastructure to support
investments in human capital.
Rethinking risk for both employees and employers
The incentives that exist today make it difficult for private-sector employers – from large
companies down to the smallest firms – to make meaningful investments in human capital.
The key problem lies in companies’ inability to guarantee a reasonable return on their
investments. Some skills are firm-specific, but for the most part human capital is fungible –
and increasingly so as a facility with technology generates skills that can be transferred
across businesses and even industries.
An employer choosing to invest in formal training faces the risk that an employee will leave
the firm, taking her skills and knowledge (potentially to a competitor) before the employer
has had a chance to recoup the expense. In contrast, companies investing in technology
face no such risk. Machines can break, or turn out faulty products, but there is no risk that
they will walk out the door. This can make machines the better investment choice.
Businesses face a harsh reality: they have limited funds and must invest selectively – with a
focus on achieving reasonable returns – in order to remain competitive and profitable over
the long term.
Because of this, it is clear that companies need support in adjusting the way they approach hiring and training, especially as it relates to people who are switching occupations or industries. Hiring, especially hiring people in mid-career shifts, must
become more economically rational and involve less financial and legal risk for employers
than is the case today.
7 See Autor, “Why are there still so many jobs? The history and future of workplace automation,” Summer 2015.
8 See Bailey and Cho, “Developmental education in community colleges,” 2010.

July 1, 2016 Global Markets Institute
Goldman Sachs Global Investment Research 18
These risks point to the need to expand tax and other incentives for on-the-job and
professional training for firms of all sizes. This would be an important shift in US tax policy,
which for decades has encouraged investments in physical capital, through such
provisions as accelerated depreciation and tax credits for technology. In effect this means
that the tax system has worked to accelerate the pace of job destruction. Creating new
incentives for investing in human capital would encourage job creation instead. The
advantages shouldn’t be limited to large corporations, particularly since much of the
training for adaptive trades will take place at small firms. Broad tax advantages for training
should extend as far as the 2.7 million small businesses that file taxes as S corporations,
which make up close to half of all small-employer firms in the US, and to the owners of the
20 million sole proprietorships, given that human capital is acquired across a range of
opportunities.
Formal apprenticeship programs can offer people of any age the chance to learn new skills without incurring large amounts of debt or foregoing current income. Research sponsored by the US Labor Department estimates that participants who have
successfully completed existing government-overseen apprenticeship programs would
earn, on average, an incremental $240,000 over the course of a 36-year career. Expanding
the tax credits that are available to offset some of the cost could make these programs
more attractive to employers. At the same time, a ‘no-fault’ trial period of employment
would also reduce the risk that a company would be tied to an unsuitable hire.
As existing apprenticeship programs may be lengthy and biased toward younger individuals with less work experience, introducing ‘experienced-worker apprenticeship’ programs could be particularly helpful for older individuals in transition to second or third careers. Ensuring that they do not forego income while
they retrain would reduce the uncertainty around the decision to change careers and would
make it more economically attractive to do so quickly.
Apprenticeships may be most appropriate in adaptive trades and other fields where hands-
on learning is critical, as well as in fields where licenses are required. Broadening these
programs beyond traditional fields like construction, machinery, the electrical industry and
cosmetology would seem to make sense (medical residencies and internships offer
possible models). Community colleges offer another affordable avenue for apprenticeships
or similar programs.
In apprenticeships and other hiring contexts, employees and employers alike could benefit from standardized labor contracts. Under these contracts, which could
be tailored for each industry, an employee would commit to a set period of employment in
exchange for a certain level of employer-provided training. Both sides would benefit: the
employee would have the commitment that she would receive formal or on-the-job
training, while the employer could benefit from the greater likelihood of recouping its
investment. As examples, contracts might be roughly akin to the agreements in Reserve
Officers’ Training Corps (ROTC) or the service commitments required when the military
pays for medical or law school.
Legal limits to the enforceability of employment commitments mean that these contracts
would need to be designed carefully. The employment would be an explicit exchange of
the employee’s labor for employer-provided training, with the acknowledgment that
training can be assigned a monetary value because it deepens and expands the employee’s
own human capital. Termination provisions allowing the employee to break the contract by
reimbursing the firm for the value of receiving this human capital could protect the
employee and strengthen the employer’s incentives to provide the training. In addition,
standardization would lead to greater consistency and predictability for employees, thus
reducing employee concern and enhancing the likelihood of compliance.

July 1, 2016 Global Markets Institute
Goldman Sachs Global Investment Research 19
Developing innovative financing approaches
Retraining and changing careers carries meaningful economic risk. Retraining itself may or
may not be expensive, but the opportunity costs can be significant, and wages are likely to
be lower in (at least) the first few years of a new occupation. From a financial standpoint,
changing jobs is particularly challenging for older people, who are more likely to have
commitments that cannot be put on hold, such as home ownership, medical bills or
dependents’ education expenses.
Allowing people to finance retraining by tapping into private savings that are currently earmarked for retirement – 401(k) funds and IRAs – without penalty is one route. Another is creating separate ‘career transition’ savings accounts that are tax-advantaged but more easily accessible, without penalty, and that can be used to pay living expenses during retraining.
These approaches will not work for everyone, particularly for younger people who have not
had time to build a savings cushion. A further option would be to make Social Security
funds available to cover the costs of retraining as well as living expenses during a
transition period – essentially an advance on future distributions. Because this would have
obvious implications for Social Security’s long-term funding, such a program might require
people who drew down funds in mid-life to increase their contributions later in life or to
postpone their retirements (which would also increase the net present value of their new
jobs).
Risk-sharing can also be extended to the public financing of higher and vocational education, again on the grounds that a highly skilled workforce is in the common interest. The current structure of the student loan market could benefit
from a fundamental review: outstanding student debt is now above $1.3 trillion, and more
than seven million people are in default. Student loans offering income-based repayment
programs may offer a less onerous and more effective way to finance education without
imposing life-long burdens on borrowers. To this end, the federal government has
introduced income-based repayment programs for federal student loans with the goal of
promoting affordability.9 Similar incentives could be expanded to support vocational
training for younger people and for a broad range of training efforts later in life.
Revising employee-benefits policies would also shift some of the risk and encourage employment regardless of the prospective employee’s age or previous work history. Decoupling benefits from employment and making them more portable
would improve labor-market flexibility and could make smaller businesses more attractive
as employers. Large firms are currently considerably more likely than smaller firms to offer
retirement plans, medical care and paid sick leave, as Exhibit 13 shows. Recent data from
the Bureau of Labor Statistics indicate that retirement plans are not currently available at
more than half of all private businesses that employ fewer than 50 people. While this is in
part a matter of cost, it is also a question of accessibility: reducing administrative burdens
would make it easier for small firms to offer these benefits.
9 The ‘Pay as You Earn’ repayment plan for federal student loans, launched in 2012, caps loan-service payments at 10% of the borrower’s annual discretionary income. This plan also offers debt forgiveness of any remaining balance after 10 years for people who work in public service and after 20 years for other borrowers. See also https://www.newyorkfed.org/medialibrary/media/research/staff_reports/sr668.pdf

July 1, 2016 Global Markets Institute
Goldman Sachs Global Investment Research 20
Exhibit 13: Large firms are more likely to offer employee benefits Share of establishments (by size) that offer employees access to selected benefits, 2015
Source: US Bureau of Labor Statistics, National Compensation Survey, Goldman Sachs Global Investment Research.
Reducing barriers to entry and supporting the freelance economy
Second and third careers will not necessarily involve jobs at existing firms, particularly
large firms. Many people will become self-employed, start their own businesses or join
small companies. To support these transitions, entrance into new professions should be
made easier, with limits on self-regulatory organizations’ ability to create barriers to entry
that reduce competition and constrain geographic mobility.
A recent White House report indicates that some 25% of US workers now require a license,
a five-fold increase from the early 1950s; two-thirds of the increase reflects a rise in the
number of occupations that require a license rather than a rise in the number of people in
these jobs. Although more than 1000 occupations are regulated across the country, fewer
than 60 are regulated by every state;10 see Exhibit 14. Licensing costs can be a prohibitive
barrier to entry for someone looking to move to a new occupation. For example, a
minimum-wage earner in Louisiana who wants to obtain a retail florist license faces up-
front costs equivalent to at least a week’s wages, with annual license-renewal fees costing
a day’s pay for even an experienced florist.
10 See “Occupational licensing: a framework for policymakers,” July 2015; https://www.whitehouse.gov/sites/default/files/docs/licensing_report_final_nonembargo.pdf
0%
10%
20%
30%
40%
50%
60%
70%
80%
90%
100%
1 to 49 50 to 99 100 to 499 500 or more
% o
f busi
ness
es (
by
size
) th
at o
ffer
em
plo
yees
acc
ess
to b
enefi
ts
# of employees
Paid sick leave
Paid vacation
Paid holidays
Retirement
Medical care

July 1, 2016 Global Markets Institute
Goldman Sachs Global Investment Research 21
Exhibit 14: Licensing requirements vary across the country Selected occupations requiring licenses, licensing fees and median wages
Source: Institute for Justice: License to Work: A National Study of Burdens from Occupational Licensing (April 2012), US Bureau of Labor Statistics, Occupational Employment Statistics (May 2015), Goldman Sachs Global Investment Research. *Note: ‘states’ includes the District of Columbia.
Supporting individuals undertaking career transitions also means approaching regulation of the ‘freelance economy’ in ways that do not impede its growth. The
freelance economy is already a crucial safety net for many, including those whose current
jobs are being automated away. Offering individuals the opportunity to easily monetize
their existing assets and skills – spare rooms, free time, driving licenses, cooking talents –
is a particularly good way of offsetting some of the opportunity costs of retraining. Rules
around classification of employees and independent contractors, working conditions, pay,
benefits, liability and insurance should all be viewed with an eye toward supporting the
freelance economy rather than stifling it.
Selected ccupations that require a license
# of states* that require a license
Avg licensing fee (2012)
Median hourly wage (2015)
Median hourly wage vs. the $7.25 federal
min wage
Cosmetologist 51 $140 $11.00 1.5X
Truck Driver 51 $80 $19.00 2.6X
Pest Control Applicator 51 $90 $16.00 2.2X
School Bus Driver 51 $100 $14.00 1.9X
Emergency Medical Technician 51 $90 $15.00 2.1X
Barber 50 $130 $12.00 1.7X
Preschool Teacher 49 $100 $22.00 3.0X
Athletic Trainer 46 $440 - -
Veterinary Technologist 37 $210 $15.00 2.1X
Security Guard 37 $90 $12.00 1.7X
Security Alarm Installer 34 $210 $21.00 2.9X
Auctioneer 33 $310 $15.00 2.1X
Child Care Worker 33 - $10.00 1.4X
Teacher Assistant 29 $80 - -
Taxidermist 26 $70 - -
Gaming Dealer 24 $170 $9.00 1.2X
Animal Trainer 20 $90 $13.00 1.8X
Animal Control Officer 17 $120 $16.00 2.2X
Sign Language Interpreter 16 $770 $21.00 2.9X
Locksmith 13 $150 $19.00 2.6X
Pharmacy Technician 12 $70 $15.00 2.1X
Farm Labor Contractor 9 $160 $15.00 2.1X

July 1, 2016 Global Markets Institute
Goldman Sachs Global Investment Research 22
VI. Conclusion
Technological disruption of the labor market has been under way for decades, eliminating
some jobs while simultaneously improving living standards and laying the foundation for
new occupations and new industries to emerge. Thanks to advancements in measurement
technologies and data-collection capabilities, the pace of this disruption is accelerating, and
the need to identify how best to deploy labor is becoming more pressing.
Technology-driven change can and should be viewed as an opportunity – not as a
relentless threat. But making this opportunity a reality for many people will require a new
approach to risk-sharing to reduce the uncertainty that comes with undertaking career
transitions. From a public-policy perspective, this will require modernizing education,
revisiting the structure of employment and offering greater financial support to individuals
and businesses seeking to invest in human capital. We believe that policy changes such as
these are critical first steps to closing the jobs gap by better aligning what is economically
rational for an individual with what is beneficial for the economy as whole.

July 1, 2016 Global Markets Institute
Goldman Sachs Global Investment Research 23
Appendix A: Technological innovation has fueled job destruction
and creation throughout American history
Earlier transitions in the US economy offer insights into the way that technology has
fundamentally reshaped the labor market. In both the 19th-century shift from farming to
manufacturing and the 20th-century information revolution, technology eliminated entire
categories of jobs while also driving job growth in new fields and previously unimagined
occupations.
At the start of the 19th century, agriculture dominated the US economy, accounting for
80% of total employment and more than half of gross domestic product. Farms were
generally individually owned and produced a range of crops on a single plot, largely for
personal use or local consumption. Productivity and output were relatively low, and
although farming had advanced beyond the subsistence level, it remained labor-intensive,
small-scale and fragmented.
New farming technology introduced from the 1840s, including factory-made agricultural
machinery and commercially produced fertilizer, made large-scale commercial farming
feasible for the first time. These new tools drove rapid improvements in productivity and
accelerated growth in per capita output; though the historical data are limited, Exhibit 15
tracks the improvement in corn yield since 1900. As productivity rose, agriculture’s share of
total employment declined meaningfully, falling just below 50% by 1880 and to 40% by
1900. By 1950 the proportion of the labor force working in agriculture had dwindled to
roughly 10% and, thanks to continuing increases in productivity, today this figure is just 2%.
See Exhibit 16.
Exhibit 15: Technology has contributed to higher
agricultural yields Corn yield, bushels/acre
Exhibit 16: Agricultural employment share has declined
over time Agricultural employment share of the labor force
Source: US Department of Agriculture, Goldman Sachs Global Investment Research.
Source: IPUMS-USA, University of Minnesota, www.ipums.org, Goldman Sachs Global Investment Research. Note: Data are not available for 1890.
0
20
40
60
80
100
120
140
160
180
1900 1910 1920 1930 1940 1950 1960 1970 1980 1990 2000 2010
Corn
yie
ld, b
ush
els
per
acre
0%
10%
20%
30%
40%
50%
60%
70%
1850 1860 1870 1880 1900 1910 1920 1930 1940 1950 1960 1970 1980 1990 2000 2010
Agri
cult
ure
shar
e o
f th
e to
tal
work
forc
e

July 1, 2016 Global Markets Institute
Goldman Sachs Global Investment Research 24
On the surface, the severe contraction in agricultural employment experienced after 1850
was a negative consequence of technology. However, this technological change allowed
the country to move into a new phase of economic growth, in several ways.
First, higher agricultural productivity freed up a large part of the workforce and allowed
labor to shift to manufacturing. Manufacturing was a critical source of employment for
displaced farmers as well as for new entrants into the labor force (women and immigrants);
manufacturing employment rose from roughly 600,000 in 1850 to nearly four million by
1900. While farming generally required specific traits and skills – for example, physical
strength and situational experience – large-scale manufacturing processes simplified and
deconstructed larger tasks into a series of smaller ones. People could be taught how to
perform these bite-sized tasks on the job, thereby developing new and specialized sets of
skills.
Second, the rise of mechanized manufacturing in the late 19th and early 20th centuries
dramatically improved the quantity and quality of output across a wide range of industries.
Consider the shoe industry, where automation has had a dramatic impact on product
availability, customer choice and cost. For centuries shoes were fabricated by hand, with
little variation or customization except at the highest end; they came in just a few sizes and
typically didn’t distinguish between right foot and left. In the 19th century, technological
advances including the introduction of rolling and sewing machines allowed for faster
production and higher output. With greater volume, producers were able to gather enough
data to standardize their production to more effectively serve the mass market; they could
refine shoe sizes to fit most of the population and could make the production of ‘right’ and
‘left’ shoes the norm.
Individual craftsmen undoubtedly felt the pain of this technological transition, and few
people train to become cobblers today. The shoe designers who have replaced cobblers
bring a different set of skills to the job. Yet consumers have clearly benefited from their
inexpensive access to a dazzling array of choices; the average American bought more than
seven pairs of shoes in 2013 alone.
This dynamic is also evident in the mechanization of automobile manufacturing. Early
automobiles were labor-intensive, highly customized and expensive: in 1900, the more
than two dozen automobile manufacturers in the US produced just a few thousand cars in
total. Later, the standardization of parts, machine-based manufacturing and assembly-line
production made it possible to mass-produce cars that the average American household
could afford. The company that pioneered this approach – Ford Motor Company –
produced more than one million Model T cars on average each year between 1913 and
1927 while reducing the price by roughly two-thirds.
After the turn of the 20th century, the pace of job growth in manufacturing began to exceed
the pace of population growth: the share of the workforce employed in manufacturing
jumped from 15% in 1900 to 25% in 1920. By 1960, the sector employed nearly one-third of
working Americans.
Even so, it wasn’t long before further technological innovations caused the industrial
revolution to give way to the information revolution and the growing prominence of the
services sector. In 1945 half of the private workforce was employed in a goods-producing
industry (a category that includes manufacturing). But as post-war capital investment drove
meaningful increases in manufacturing productivity, the share of employment engaged in
manufacturing began to decline. The labor shift was rapid: between 1945 and the mid-
1990s, the goods-producing share of the private labor force fell from roughly 50% to less
than 25%, while the services share grew from roughly 50% to just over 75%. Today, the
services sector employs 85% of the private workforce, while the share in goods-producing
industries is just 15%. See Exhibits 17 and 18.

July 1, 2016 Global Markets Institute
Goldman Sachs Global Investment Research 25
Exhibit 17: Manufacturing employment share has
declined sharply since 1970 Manufacturing employment share of the labor force
Exhibit 18: The share of the workforce producing services
has grown rapidly in the post-war period Services vs. goods-producing employment share
Source: IPUMS-USA, University of Minnesota, www.ipums.org, Goldman Sachs Global Investment Research.
Source: US Bureau of Labor Statistics, Goldman Sachs Global Investment Research.
This shift away from manufacturing and into services took place amid, and drove, a rise in
overall educational levels. In 1940, just 10% of the adult workforce had completed at least
one year of college, and more than half hadn’t made it past primary school. By 1980, when
manufacturing employment peaked, nearly one-third of the adult workforce had completed
at least one year of college, and only 15% of the workforce had finished their education at
primary school. Today, roughly 60% of the adult civilian population has completed at least
one year of college, while just 5% finished their formal education at primary school. See
Exhibit 19.
The latest Bureau of Labor Statistics employment-projection data suggest that six of the
ten occupations expected to show the fastest job growth by 2024 require at least an
associate’s degree; all ten of the occupations expected to pay the highest wages require at
least a bachelor’s degree as well as some form of on-the-job training as a requirement to
achieve competency. The importance of formal education continues to rise: for nearly the
past 25 years, unemployment rates have been highest among adults who have not
graduated from high school and lowest among college graduates.
Ultimately, automation has continuously placed downward pressure on the prices of
manufactured goods, raising living standards and freeing up consumer spending power to
be redeployed elsewhere, in sectors that themselves have created new employment. In
1930, nearly 40% of consumer spending was dedicated to non-durable goods like clothing,
shoes and gas. Today, the relative economic importance of these items to the consumer
has tumbled: spending on them has been nearly halved, freeing up resources to be spent
on durable goods (housing, cars) and services (education, health care, entertainment) – and
creating new jobs in the process of supplying these new needs. See Exhibit 20.
0%
5%
10%
15%
20%
25%
30%
1850 1860 1870 1880 1900 1910 1920 1930 1940 1950 1960 1970 1980 1990 2000 2010
Manu
fact
uri
ng s
hare
of
the
tota
l w
ork
forc
e
0%
10%
20%
30%
40%
50%
60%
70%
80%
90%
100%
1945 1950 1955 1960 1965 1970 1975 1980 1985 1990 1995 2000 2005 2010 2015
Shar
e of
tota
l em
plo
ymen
t
Goods-producing workers as a % of the total private workforce
Service-providing workers as a % of the total private workforce

July 1, 2016 Global Markets Institute
Goldman Sachs Global Investment Research 26
Exhibit 19: Educational levels have risen over time Civilian population by highest level of educational
attainment, snapshots of 1940 vs. 1980 vs. 2014
Exhibit 20: Technology and productivity gains have
driven down consumer spending on non-durable goods Proportion of annual consumer spending on non-durable
goods
Source: US Census Bureau, Goldman Sachs Global Investment Research. Note: ‘elementary school’ includes people who with no formal schooling and those who attended school for up to 8 years; ‘high school’ includes people who finished elementary school and attended high school for any period of time; ‘college’ includes people who finished high school and attended college for any period of time.
Source: Bureau of Economic Analysis, Goldman Sachs Global Investment Research.
60%
29%
10%
17%
51%
32%
5%
37%
59%
0%
10%
20%
30%
40%
50%
60%
70%
Elementary School High School College
Pro
po
rtio
n o
f th
e po
pula
tio
n (
25+
yea
rs o
ld)
Highest level of educational attainment
1940
1980
2014
15%
20%
25%
30%
35%
40%
45%
1930 1935 1940 1945 1950 1955 1960 1965 1970 1975 1980 1985 1990 1995 2000 2005 2010 2015
Pro
po
rtio
n o
f an
nu
al c
on
sum
er
spen
din
g o
n
no
n-d
ura
ble
go
od
s

July 1, 2016 Global Markets Institute
Goldman Sachs Global Investment Research 27
Appendix B: The natural ‘arc’ of occupations and industries
There are typically two distinct narratives about the interaction of technology with
industries or jobs. The first relates to the promise of new technology as a focal point for
investment, offering unlimited employment opportunity and the potential to create social
good. The second, more draconian take, sees technology as the relentless destroyer of
‘good’ jobs.
In practice, occupations and industries tend to follow a predictable arc that ultimately
encompasses both narratives.11 The early phases are characterized by enthusiasm and
discovery: jobs are loosely defined and the necessary credentials have not yet been
specified or perhaps even invented. From a consumption standpoint, price elasticities tend
to be high, meaning that every one percentage point drop in price created by better
productivity – reflecting advancements in technology – generates more than one
percentage point of demand. As a result, the market grows, as does the need for new
capital and more employees.
These dynamics are depicted in Exhibit 21, which illustrates how the share of spending
dedicated to goods in a sector that is experiencing fast productivity growth increases when
prices are elastic– the early stages of the arc – and declines in the later stages, when prices
are inelastic.
Exhibit 21: The natural ‘arc’ of an occupation or industry In its early phases, the sector at the center of innovation attracts labor and capital and captures a
large proportion of spending. Over time, it requires less labor and capital and captures a smaller
proportion of spending
Source: Goldman Sachs Global Investment Research.
11 See Jacobson, LaLonde and Sullivan, “Long-term earnings losses of high-seniority displaced workers,” November 1993.
% s
har
e o
f ex
pen
dit
ure
Time, measured in years
Price-elastic phase Price-inelastic phase
100
0200

July 1, 2016 Global Markets Institute
Goldman Sachs Global Investment Research 28
An extrapolation of the early phases of the arc suggests that the new occupation or
industry will continue to offer unlimited growth and employment opportunities.
Unfortunately, the early phases cannot last. As history has shown, in the end all industries
(at least so far) hit a limit in demand as the value of the technology that underpins them is
pushed to its limits. As a recent example: the promise of unlimited media streaming is
constrained by the simple reality that there are only 24 hours in a day and that people will
need to spend some of this time doing other things.
Unsurprisingly, the growth trajectory of the industry changes as it approaches these limits.
This is illustrated by the ‘price-inelastic phase’ shown in Exhibit 21. If the pace of
consumption growth does not keep up with the pace of productivity growth, then higher
levels of productivity simply translate to ‘producing more of what is needed using fewer
resources.’ The result is a flight of capital and the elimination of employment, as what had
been ‘good jobs’ become dead ends.
Over time each new industry – and each new technology – has experienced the same
transformation. Think of the agricultural revolution: the promise of new agricultural
technology seemed unlimited as consumption went from 1000 mediocre-tasting calories to
2000 tasty ones. However, as daily consumption passed 2000 calories, the marginal value
of each additional unit began to diminish rapidly. Demand became highly inelastic,
meaning that for every one percentage point drop in price, demand grew by much less
than one percent. Exhibit 22 shows the labor-market implications of this shift for the US
agricultural industry between the mid-19th and the late-20th centuries: as demand became
inelastic, the share of labor in agriculture declined precipitously.
Exhibit 22: Higher productivity in agriculture in the mid-19th century ultimately led to
inelastic demand and fewer labor inputs As demand becomes inelastic, the share of labor dedicated to the industry declines
Source: IPUMS-USA, University of Minnesota, www.ipums.org, Goldman Sachs Global Investment Research.
0
10
20
30
40
50
60
1850 1870 1890 1910 1930 1950 1970 1990 2005 2007 2009
% s
har
e of
lab
or
dev
ote
d t
o t
he
secto
r w
ith
hig
h p
rod
uct
ivit
y gro
wth
Year
Actual
Model prediction
Agriculture employment share:

July 1, 2016 Global Markets Institute
Goldman Sachs Global Investment Research 29
Each repetition of this cycle has left society better off, since people are able to consume
new, less-expensive and better-quality goods, at a higher level of overall income and social
welfare. But these transformations are not experienced as positively by the individuals
directly affected by the transition from the price-elastic to the price-inelastic phase. The
early phases of the cycle, which are characterized by the need to attract employees to new
and risky businesses, generate jobs with low barriers to entry, high relative wages and high
mobility. Over time, these dynamics foster growth in related ‘enabling’ industries,
including technical training classes, specialized employment agencies, dedicated
educational programs and eventually licensing and degree programs – in other words, an
organized path to success, which contributes to the view that job creation will remain
robust for a long period.
As the industry matures, the pool of jobs tends to shrink to those that require more
extensive education and stricter credentials. At the same time, the present value of
employment falls, and individuals’ significant investments in industry-specific human
capital are set against a structurally deteriorating employment picture.
Eventually, and usually without warning, the cycle turns and the job destruction begins.
This inflection does not occur because the individual has failed. Rather, it occurs because
the industry has become saturated and the underlying technology has run out of new
applications. Ironically, it is the industry’s inherently greater level of productivity at this
point – which creates more output by using less rather than by employing more – that is at
fault. From an economic standpoint, in the resource-attracting early phases, the market is
characterized by persistent factor shortages and rents for all parties. In the later phases, the
market is characterized by persistent input surpluses and falling factor payments,
particularly wage income.
Once again, from the standpoint of the economy at large, this transition – from emerging to
mature – produces positive outcomes: welfare improvements expand and are spread more
evenly. However, to those caught in the reversal, this natural transition seems more
personal and possibly even malicious. This persistent gap – between the benefits that
accrue to the broader economy and the pain experienced by the individual – helps to
determine who wins and who loses over the course of an industry’s arc.
Modeling the shift from price-elastic to price-inelastic
In the section below, we present a model that illustrates the effect of productivity growth
on labor in a slightly different way. The conclusion is the same: any industry that is subject
to an extended period of rapid productivity growth will – by the very fact of that
productivity growth – shrink as a share of the economy, as a source of jobs and as a point
of accumulation of capital.
Rather than show how the arc plays out over time in a single sector, this model considers
the problem from the perspective of a two-sector economy, in which the sectors are
distinguished solely by productivity growth. The sector with high productivity growth is the
sector with innovative technology; the sector with low productivity growth can here be
thought of as ‘the rest of the economy.’ Our base case assumes fully mobile labor and
capital and Leontief preferences and Cobb-Douglas production, and we show labor, capital
and budget share over time.
This model has three parts: first, we consider consumption assuming prices are given and
utility is maximized; second, we examine production assuming interest rates (cost of
capital) and wages (cost of labor) are given and profits are maximized; and third, we
analyze the conditions necessary for the market to clear (for consumption to equal
production).

July 1, 2016 Global Markets Institute
Goldman Sachs Global Investment Research 30
Part I: Consumption
On the consumption side, we assume a representative agent has to consume equal
amounts of two goods or services and .12 In each period , he maximizes his utility
min ,
subject to his budget constraint
where and are the prices of the two goods and is his income. The solution to this
problem is:
Part II: Production
On the production side, we assume competitive firms produce the two goods or services.
To understand how each firm maximizes its profits, we reference the standard Cobb-
Douglas production function, which uses capital (K) and labor (L) as inputs.
measures productivity at time . For simplicity, we assume productivity at each firm
grows at a constant rate over time: 1 and 1 .
Normalizing the unit cost of capital as 1 and denoting the unit cost of labor as , we can
write the following profit functions:
Π
Π
The first-order conditions from profit maximization imply
and
For simplicity, we assume the market is competitive and there are no barriers to entry. As a
result, each firm earns zero profit in equilibrium and we have:
2√and
2√
This result suggests that as productivity increases (i.e., higher and ) the price of each
good or service falls. In addition, if technological innovations cause productivity to grow
faster for good or service 1 than for good or service 2, then the price of good or service 1
should fall faster than the price of good or service 2.
12 Essentially, we are using a Leontief utility function. We use this specific utility function to simplify our analysis, but the conclusions remain the same as long as the two goods or services are not highly substitutable.

July 1, 2016 Global Markets Institute
Goldman Sachs Global Investment Research 31
Part III: Market clearing
In equilibrium, consumers consume exactly the same amount that firms produce:
and
This market-clearing condition helps us solve for the equilibrium capital and labor inputs
2 1
2 1
2 1
2 1
Where represents the productivity growth differential:
11
To illustrate the intuition behind these results, we use an example where productivity in the
manufacturing sector grows faster than productivity in the services sector (i.e., ). In
this case, is bigger than 1 and approaches infinity in the limit. This implies that, over
time, both capital and labor devoted to sector 1 (e.g., manufacturing) decrease, whereas
both capital and labor devoted to sector 2 (e.g., services) increase.
Lastly, we can solve for and :
2√1 1
Productivity growth (i.e., increases in and ) allows consumption to rise given the
same income.

July 1, 2016 Global Markets Institute
Goldman Sachs Global Investment Research 32
Appendix C: How uncertainty keeps individuals from moving out of
declining industries
We use an investment analysis to illustrate the dynamics behind individuals’ decisions to
stay put in declining industries or to move to industries with better long-term prospects.
This analysis shows how uncertainty can cause people to choose to remain in their current
industries – even if they believe that the balance of probabilities points to stagnant or
falling incomes there and higher incomes elsewhere. Reluctance to transition to a new
career will be even stronger among older and higher-skilled individuals. Even relatively
mild resistance to such transitions can have significant macro effects: aggregate income
will be lower and more-productive sectors will be deprived of labor, while lower-
productivity sectors will face large labor overhangs.
We use a stylized example to show how a single individual might react to the threat of
displacement due to technological change. Some people will be in better starting positions,
others in worse, and it is difficult to calibrate this analysis exactly. But academic work on
displacement and retraining shows that this is an important question worth empirical
examination.13
Our indicative example considers a person working in industry A, which is facing
considerable uncertainty over its future profitability, such as the US manufacturing sector
today. Despite the cloudy outlook, there is a small possibility that prices and incomes in
that sector could rise again to the levels seen over previous decades (what we call the
‘good state’ of industry A). However, there is a much greater probability that employees’
incomes will stagnate or fall even further as low prices continue to squeeze margins and
companies reduce costs wherever possible to maintain competitiveness (what we call the
‘bad state’ for industry A).
Given this outlook, the person may choose to shift careers by leaving industry A, retraining
and permanently moving to a new industry (B) that is not facing the same long-term
challenges and where future income is less uncertain, for instance as with today’s service
and IT sectors. However, this decision carries its own costs, both direct (potentially
expensive retraining) and indirect (opportunity costs). In addition, the seniority and human
capital this person has gained through formal training as well as through ‘learning-by-
doing’ may be lost or become irrelevant. Accordingly, we assume a less uncertain but
lower income stream from moving to industry B. See Exhibit 23.
13 See for example Jacobson, LaLonde and Sullivan, “Is retraining displaced workers a good investment?” 2005.

July 1, 2016 Global Markets Institute
Goldman Sachs Global Investment Research 33
Exhibit 23: A person considering changing careers faces uncertainty whatever the decision Potential outcomes for a person considering a career transition
Source: Goldman Sachs Global Investment Research. Note that ‘initial income’ of $40,000 is based on the median annual income of workers aged 40-44 per the US Census Bureau’s Current Population Survey, 2015 Annual Social and Economic Supplement.
‘Wait’ doesn’t mean ‘do nothing’ when it comes to deciding
whether to change careers
We use first a Net Present Value (NPV) and then a Real Option Valuation (ROV) technique
to demonstrate the role that income uncertainty plays in affecting the person’s decision to
stay or to shift industries.
We begin with the expected Net Present Value analysis, assuming 25 more years of
working life (for a 40-year-old who will retire at 65). The expected NPV of remaining in
industry A (assuming a 5% real discount rate) is $364,000. However, if the person
immediately undertakes retraining and moves to a new industry, then the expected NPV
will be $452,000 (assuming that retraining costs $1,000 and that the person can
immediately start working in industry B, i.e. that there are no opportunity costs from
training). Accordingly, out of these two possible paths, the option to ‘switch industries
immediately’ will be preferred. See Exhibit 24.
Exhibit 24: A simple net present value analysis suggests that the person should opt to
change careers immediately . . . Expected NPV of future income streams
Source: Goldman Sachs Global Investment Research. Note that if the person decides in P=0 to change jobs, the analysis assumes retraining costs of $1,000 in the same period. Figures highlighted in grey indicate the period in which the change is made and the retraining costs are incurred.
10% HIGH INCOME $ 50,000(GOOD STATE FOR INDUSTRY A)
STAY IN
INDUSTRY A
90% LOW INCOME $ 20,000(BAD STATE FOR INDUSTRY A)
INITIAL INCOME $ 40,000HIGH INCOME $ 35,000
50% (GOOD STATE FOR INDUSTRY B)
SWITCH TO
INDUSTRY B
50% LOW INCOME $ 25,000(BAD STATE FOR INDUSTRY B)
PeriodProbability NPV 0 1 2 3 25
E(NPV | STAY INDEFFINITELY) Good in Industry A, Good in Industry B 5% $744,697 $40,000 $50,000 $50,000 $50,000 $50,000
Good in Industry A, Bad in Industry B 5% $744,697 $40,000 $50,000 $50,000 $50,000 $50,000
Probability weighted NPV: Bad in Industry A, Good in Industry B 45% $321,879 $40,000 $20,000 $20,000 $20,000 $20,000
$364,161 Bad in Industry A, Bad in Industry B 45% $321,879 $40,000 $20,000 $20,000 $20,000 $20,000
PeriodProbability NPV 0 1 2 3 25
E(NPV | SWITCH IMMEDIATELY) Good in Industry A, Good in Industry B 5% $527,288 $34,000 $35,000 $35,000 $35,000 $35,000
Good in Industry A, Bad in Industry B 5% $376,349 $24,000 $25,000 $25,000 $25,000 $25,000
Probability weighted NPV: Bad in Industry A, Good in Industry B 45% $527,288 $34,000 $35,000 $35,000 $35,000 $35,000
$451,818 Bad in Industry A, Bad in Industry B 45% $376,349 $24,000 $25,000 $25,000 $25,000 $25,000
STAY INDEFFINITELY
SWITCH IMMEDIATELY (in P=0)

July 1, 2016 Global Markets Institute
Goldman Sachs Global Investment Research 34
However, as Exhibit 25 shows, additional paths are available. The person can also choose
to wait one period and then decide whether to transition to a new industry depending on
the realized outcomes for industry A and B in the second period. If income in industry A
falls to the low level ($20,000 in our example) and the person moves to industry B
(regardless the state of industry B), then expected NPV rises to $490,000, which is higher
than either of the two paths we initially considered.
Accordingly, the rational decision is to ‘keep your options open’ for now and only make the
decision whether to change careers later, once the current uncertainty has been resolved.
This result is critical, since it shows why not making the move to the industry with better
prospects can be the rational thing to do – at least in the short-term.
Exhibit 25: . . . but the simple NPV analysis overlooks the fact that the person can wait and
postpone making the decision Expected NPV of future income streams
Source: Goldman Sachs Global Investment Research. Note that if the person decides in P=1 to change jobs, the analysis assumes retraining costs of $1,000 in the same period. Figures highlighted in grey indicate the period in which the change is made and the retraining costs are incurred.
The ability to delay making the decision can also be viewed as a ‘real option.’ In finance, an
option gives the opportunity – but not the obligation – to buy or sell a security at a
previously agreed price. In our analysis, the ability to wait and make the career-transition
decision later is also an opportunity, but not an obligation, to move to industry B. We can
use the same pricing concepts from finance – namely constructing a risk-free portfolio and
relying on arbitrage conditions to equilibrate prices over different states of the world – to
price the value of this option to the person.
PeriodProb NPV 0 1 2 3 25
E(NPV | SWITCH IF BAD in A) Good in Industry A, Good in Industry B 5% $744,697 $40,000 $50,000 $50,000 $50,000 $50,000
Good in Industry A, Bad in Industry B 5% $744,697 $40,000 $50,000 $50,000 $50,000 $50,000
Probability weighted NPV: Bad in Industry A, Good in Industry B 45% $532,336 $40,000 $34,000 $35,000 $35,000 $35,000
$490,149 Bad in Industry A, Bad in Industry B 45% $391,396 $40,000 $24,000 $25,000 $25,000 $25,000
PeriodProb NPV 0 1 2 3 25
E(NPV | SWITCH IF BAD in A AND GOOD in B) Good in Industry A, Good in Industry B 5% $744,697 $40,000 $50,000 $50,000 $50,000 $50,000
Good in Industry A, Bad in Industry B 5% $744,697 $40,000 $50,000 $50,000 $50,000 $50,000
Probability weighted NPV: Bad in Industry A, Good in Industry B 45% $532,336 $40,000 $34,000 $35,000 $35,000 $35,000
$458,866 Bad in Industry A, Bad in Industry B 45% $321,879 $40,000 $20,000 $20,000 $20,000 $20,000
PeriodProb NPV 0 1 2 3 25
E(NPV | SWITCH IF BAD in A AND BAD in B) Good in Industry A, Good in Industry B 5% $744,697 $40,000 $50,000 $50,000 $50,000 $50,000
Good in Industry A, Bad in Industry B 5% $744,697 $40,000 $50,000 $50,000 $50,000 $50,000
Probability weighted NPV: Bad in Industry A, Good in Industry B 45% $321,879 $40,000 $20,000 $20,000 $20,000 $20,000
$395,444 Bad in Industry A, Bad in Industry B 45% $391,396 $40,000 $24,000 $25,000 $25,000 $25,000
WAIT 1 PERIOD: SWITCH in P=1 IF BAD in A AND GOOD in B
WAIT 1 PERIOD: SWITCH in P=1 IF BAD in A
WAIT 1 PERIOD: SWITCH in P=1 IF BAD in A AND BAD in B

July 1, 2016 Global Markets Institute
Goldman Sachs Global Investment Research 35
Real option theory explicitly shows the value of waiting
We start by considering the person’s long position in a put option, which is the ability to
stay in industry A.14 See Exhibit 26.
Exhibit 26: The person holds a long put position in industry A Value of the real put option vs. NPV of switching to a new industry immediately
Source: Goldman Sachs Global Investment Research
If the worst outcome for industry A is greater than or equal to the best outcome for
industry B, then the person will always choose to stay in industry A, even if the state of
industry A worsens. The NPV of changing careers immediately is negative and the value of
the option to wait for now and move in the future also becomes zero in this region. But if
the best outcome for industry A falls low enough (keeping volatility between the outcomes
constant for now), then it will always be optimal for the person to move to industry B, as
the expected NPV of the ‘switch immediately’ strategy rises above the value of the real
option to wait (even if there are retraining costs).
The complication for the person is that, between these edge cases, the put option does
have value, and this value is greater than the expected NPV of immediately transitioning to
a new career (see the middle section of the chart on the right side of Exhibit 26). The value
of the put option in this region is the value to the person of certainty about industry A’s
future wages, and the person is prepared to delay making a decision in order to achieve
this certainty. Stated another way, the expected NPV of making a decision before knowing
the outcome in the next period has to be more than just positive – it has to be larger than
the certainty value that would be achieved by waiting (today’s option value).
14 To plot Exhibits 26 and 27, we change the realized levels of income in the good and bad states, but throughout the analysis we maintain a fixed range between these outcomes. This maintains a constant volatility between outcomes. Volatility is itself a key variable in determining the value of the option, which we explore later in this analysis. To simplify the analysis (ensuring a ‘closed-form’ solution), we also set the industry-B income to its expected value of $30,000 in both the good and bad states, eliminating the uncertainty.
10 20 30 40 50 60 70 80
($700,000)
($500,000)
($300,000)
($100,000)
$100,000
$300,000
$500,000
$700,000
-20 -15 -10 -5 0 5 10 15 20 25 30 35 40 45 50
NPV of switching if "switch
immediately" is chosen
Value of real option
Industry A income, if bad outcome
Industry A income, if good outcomeFinal
NPV 10 20 30 40 50 60 70 80
($100,000)
$0
$100,000
$200,000
$300,000
$400,000
$500,000
$600,000
$700,000
-20 -15 -10 -5 0 5 10 15 20 25 30 35 40 45 50
Never
switch
careers
Wait &
switch
careers only
if bad
outcome for
industry A
Switch careers
immediately
Industry A income, if bad outcome
Final
NPV
Industry A income, if good outcome

July 1, 2016 Global Markets Institute
Goldman Sachs Global Investment Research 36
The person also holds a long position in a call option, reflecting the ability to change
careers and move into industry B.15 Again we can determine the value of this option using
real option theory, as shown in Exhibit 27. The chart on the right side of Exhibit 27 shows
three distinct regions. If the best outcome for industry B offers a very low wage (below the
worst outcome for industry A), then there is no incentive to change jobs, and the call
option is worthless. If the worst outcome in industry B is better than or equal to the best
outcome in industry A, then the NPV of changing careers immediately is greater than the
option value of the call, and the person will indeed make the transition immediately.
Between these regions we again see a range of outcomes where the call option has a
positive value that is greater than the NPV of transitioning immediately. In these cases, the
optimal decision is to wait.
Exhibit 27: The person also holds a long call position in switching to industry B Value of the real call option vs. NPV of switching to a new industry immediately
Source: Goldman Sachs Global Investment Research
Combining these results shows that a person has strong incentives to wait over a large
range of expected income levels. There is tangible benefit from following this strategy
since both the put option (trying to mitigate the downside of remaining in industry A) and
the call option (trying to maximize the upside from moving to industry B) have value in this
range.
In our two-period model, the person always makes a decision by the second period.
However, in a more realistic multi-period scenario, uncertainty may persist for some time,
and the ‘wait’ strategy could remain the optimal strategy for much longer. Accordingly, the
rate of transfer between industries A and B would be much lower than either a simple
expected NPV analysis or a two-period ROV model would assume. We also assume
independence between the outcomes16 in each industry, which is unlikely to be the case in
the real world, since national and global business cycles affect many industries
simultaneously. Cross-sector correlation both raises the option value of waiting and
complicates the pricing of these options significantly.
15 To simplify the analysis (ensuring a ‘closed-form’ solution) for different levels of income in industry B, we set the industry-A income to its expected value of $23,000 in both the good and bad states (i.e. we eliminate the uncertainty from the industry-A income).
16 More technically we actually went further by removing uncertainty from industry B in the put-option calculation and uncertainty from industry A in the call-option calculation.
0 10 20 30 40 50 60 70
($100,000)
$0
$100,000
$200,000
$300,000
$400,000
$500,000
-20 -15 -10 -5 0 5 10 15 20 25 30 35 40 45 50
Wait &
switch
careers only
if good
outcome for
industry B
Never
switch
careers
Switch
careers
immediately
Industry B income, if bad outcome
Final
NPV
Industry B income, if good outcome
0 10 20 30 40 50 60 70
($500,000)
($400,000)
($300,000)
($200,000)
($100,000)
$0
$100,000
$200,000
$300,000
$400,000
$500,000
-20 -10 0 10 20 30 40 50
NPV of switching if "switch
immediately" is chosen
Value of real option
Industry B income, if bad outcome
Industry B income, if good outcomeFinal
NPV

July 1, 2016 Global Markets Institute
Goldman Sachs Global Investment Research 37
Older and higher-skilled individuals will wait longer, while younger
people will move sooner
Throughout this analysis, we have compared the option value of waiting against making
the immediate decision to change careers while keeping the range between the binary
‘good’ and ‘bad’ outcomes fixed. This is equivalent to keeping the volatility of outcomes
fixed.
However, in the real world, an older person or one with highly specialized skills who is
considering changing careers will face much greater volatility than a younger person or
one who is less skilled or has more generalist or transferable skills. If an older person
remains in industry A, he is likely to see a proportionally higher income under the ‘good’
scenario than a younger one would, because his greater human capital and seniority give
him a stronger wage bargaining position. On the other hand, if the older person moves to
industry B, the usefulness of his previously accumulated human capital is unclear. This
person may see a large decline in the industry-B income if his skills are irrelevant, but he
also may see only a small decline if he can successfully transfer his human capital. This
adds volatility to the expected industry-B income. In contrast, a younger person deciding to
retrain and enter industry B takes significantly less risk because she is transferring – or
losing – a much lower level of accumulated human capital (since she has had less time in
which to build it). Exhibit 28 shows these dynamics by outlining a set of possible outcomes
for a person in her mid-20s who earns the median income for this age group of $30,000.
Exhibit 28: A younger person considering changing careers sees less uncertainty, as wages
are lower across the board Potential outcomes for a younger or lower-income person considering changing careers
Source: Goldman Sachs Global Investment Research. Note that ‘initial income’ of $30,000 is based on the median annual income of workers aged 25-29 per the US Census Bureau’s Current Population Survey, 2015 Annual Social and Economic Supplement.
10% HIGH INCOME $ 40,000(GOOD STATE FOR INDUSTRY A)
STAY IN
INDUSTRY A
90% LOW INCOME $ 15,000(BAD STATE FOR INDUSTRY A)
INITIAL INCOME $ 30,000HIGH INCOME $ 25,000
50% (GOOD STATE FOR INDUSTRY B)
SWITCH TO
INDUSTRY B
50% LOW INCOME $ 20,000(BAD STATE FOR INDUSTRY B)

July 1, 2016 Global Markets Institute
Goldman Sachs Global Investment Research 38
Exhibits 29 and 30 show the investment analysis for this scenario. Repeating the expected
NPV analysis, we find that again the ‘wait now and move only if industry A enters the bad
state’ strategy maximizes present value. However, plotting the values of the expected NPV
from changing careers immediately against the real option value of waiting, while once
again maintaining a constant variance (remembering that the variance is lower this time
around), shows that the range of incomes where waiting is the optimal strategy has
decreased. This is true for both the put option (for potential industry-A incomes) and the
call option17 (for potential industry-B incomes).18 Accordingly, a younger person, who faces
less uncertainty thanks to her lower starting salary, should spend less time waiting and will
be more likely to take the opportunity to change careers immediately.
Exhibit 29: A young person’s put option is worth less, making waiting less attractive Value of a young person’s real put option vs. NPV of changing careers immediately
Source: Goldman Sachs Global Investment Research
Exhibit 30: A young person’s call option is also worth less, while the NPV from changing careers is worth more Value of a young person’s real call option vs. NPV of changing careers immediately
Source: Goldman Sachs Global Investment Research
17 To simplify the analysis (ensuring a ‘closed-form’ solution) for different levels of income in industry B, we set the industry-A income to its expected value of $17,500 in both the good and bad states (i.e. the industry-A income is now certain).
18 As before, to simplify the analysis (ensuring a ‘closed-form’ solution) we again set the other industry’s income to its expected value.
0 20 40 60 80
($400,000)
($200,000)
$0
$200,000
$400,000
$600,000
$800,000
-25 -20 -15 -10 -5 0 5 10 15 20 25 30 35 40 45 50 55 60
NPV of switching if "switch
immediately" is chosen
Value of real option
Industry A income, if bad outcome
Industry A income, if good outcomeFinal
NPV 0 20 40 60 80
($100,000)
$0
$100,000
$200,000
$300,000
$400,000
$500,000
$600,000
$700,000
$800,000
-25 -20 -15 -10 -5 0 5 10 15 20 25 30 35 40 45 50 55 60
Wait &
switch
careers
only if bad
outcome
for
industry A
Never
switch careers
Switch careers
immediately
Industry A income, if bad outcome
Final
NPV
Industry A income, if good outcome
10 15 20 25 30
($20,000)
$0
$20,000
$40,000
$60,000
$80,000
$100,000
$120,000
$140,000
$160,000
5 10 15 20 25
Never
switch careers
Wait &
switch
careers
only if
good
outcome
for
industry B
Switch
careers
immediately
Industry B income, if bad outcome
Final
NPV
Industry B income, if good outcome
10 15 20 25 30
($160,000)
($110,000)
($60,000)
($10,000)
$40,000
$90,000
$140,000
5 10 15 20 25
NPV of switching if "switch
immediately" is chosen
Value of real option
Industry B income, if bad outcome
Industry B income, if good outcomeFinal
NPV
July 1, 2016 Global Markets Institute
Goldman Sachs Global Investment Research 39
Limiting the downside will encourage more individuals to make
career transitions more quickly
For both older, higher-income and younger, lower-income individuals, we notice the
exactly the same pattern in the ‘kink’ points between waiting and changing careers
immediately (Exhibits 26-27 and 29-30).
For the put option: If the best outcome for industry A is worse than the worst
outcome in industry B (adjusted for retraining costs), then it will always be optimal
to move to industry B, because the expected NPV of the ‘move immediately’
strategy rises above the value of the real option to wait.
For the call option: If the worst outcome in industry B (adjusted for retraining
costs) is better than the best outcome in industry A, then the NPV of moving
immediately is greater than the option value of the call, and the person will move.
The reason for this pattern is the ‘bad-news principle,’ which tells us that the decision to
wait is only sensitive to the downward move in income. Stated differently, it is the ability to
avoid the consequences of making the wrong decision (the ‘bad news’) that makes waiting
attractive.
Policies that limit the ‘bad news’ would encourage more people to make successful career
transitions in the near term. For the put option this would mean placing a ceiling on wages
under the ‘good outcome in industry A’ scenario, which would be hard to implement in
practice. For the call option this would mean placing a floor on wages under the ‘bad
outcome in industry B’ scenario. While subsidizing wages for a prolonged period would be
infeasible, this policy support might only be needed in the short term to encourage
employers to hire people who are transitioning between fields.
The accumulation of new human capital through ‘learning by doing’ would lead to higher
incomes over the longer term. Policy support could also take many other forms, including
subsidized retraining and support in finding new jobs in industry B. Most importantly, since
it is uncertainty which leads individuals to delay making career transitions, the existence of
any credible policy support – even if most people never use it – should induce most people
to make more immediate decisions to change careers.
In the aggregate, the economy benefits from many individual
decisions
For the individual, the decision to join a new industry is a ‘one-shot deal’: his income may
go up or down after he has already paid the cost of retraining and allowed his existing
human capital to erode. But for the broader economy, the average effectiveness of
retraining is viewed as the average increase in income for the people who do change
careers. This benefit is experienced on a collective basis, not by the individual.
If there are many new industries (and if the good and bad states in each are not perfectly
correlated) then by averaging the outcome for many people who shift careers, we get a
bell-curve (binomial) distribution, rather than the binary (Bernoulli) distribution that the
person sees. As the number of people considering changing careers increases, the variance
of the overall distribution of outcome falls towards zero (the bell curve quickly narrows and
becomes more like a spike.) As this variance falls, the social option value of waiting (both
call and put) also tends to zero. In the extreme case of infinite decisions, there is no
uncertainty and the economy will always achieve the expected NPV. See Exhibit 31.
Accordingly, if the expected NPV of moving to industry B is greater than the expected NPV
of staying in industry A, then it will be optimal to move immediately.

July 1, 2016 Global Markets Institute
Goldman Sachs Global Investment Research 40
Exhibit 31: The option value of waiting is high on an individual basis, but minimal from a
broader economic perspective The distribution of the average wage narrows as the number of people changing careers rises
Source: Goldman Sachs Global Investment Research
The economy can also internalize positive externalities from the decisions of more people
to change careers. There could be benefits for the growth of industry B through
normalizing the labor/capital mix (as firms in that industry are no longer deprived of labor),
positive returns to scale and network effects from more people in the industry. For industry
A, a quicker resolution to the labor overhang should also generate higher income for those
people who do remain, because the reduction in labor will increase the marginal product of
labor, giving fundamental support for higher wages.
0%
1%
2%
3%
4%
5%
6%
7%
8%
9%
10%
0%
10%
20%
30%
40%
50%
60%
$24,000 $26,000 $28,000 $30,000 $32,000 $34,000 $36,000 Pro
bab
ilit
y o
f outc
om
e fo
r th
e gro
up o
f 100 w
ork
ers
Pro
bab
ilit
y of
outc
om
e
Average annual wage for 1 or more workers (40 yrs or old) after switching careers
Group of 2 workers Group of 3 workers Group of 4 workers
Group of 5 workers 1 worker Group of 100 workers (RHS)

July 1, 2016 Global Markets Institute
Goldman Sachs Global Investment Research 41
Bibliography
Acemoglu D., Autor D. (2010) “Skills, tasks and technologies: implications for employment
and earnings”, National Bureau of Economic Research
Acemoglu D., Autor D., Dorn D., Hanson G., Price B. (2014) “Return of the Solow paradox?
IT, productivity, and employment in U.S. manufacturing”, National Bureau of Economic
Research
Autor D. (2013) “The ‘task approach’ to labor markets: an overview”, National Bureau of
Economic Research
Autor D. (2014) “Polanyi’s paradox and the shape of employment growth”, National
Bureau of Economic Research
Autor D. (2015, Summer) “Why are there still so many jobs? The history and future of
workplace automation”, Journal of Economic Perspectives, 29(3), 3-30
Autor D., Dorn D. (2013) “The growth of low-skill service jobs and the polarization of the US
labor market”, American Economic Review, 103(5), 1553-1597
Autor D., Katz L., Krueger A. (1998, November) “Computing inequality: have computers
changed the labor market?”, National Bureau of Economic Research
Bailey T., Cho S-.W. (2010) “Developmental education in community colleges”, Community
College Research Center
Barger H., Landsberg H. (1942) “American agriculture, 1899-1939: a study of output,
employment and productivity”, National Bureau of Economic Research
Becker G. (1975) “Investment in human capital: effects on earnings”, National Bureau of
Economic Research
Brown M., Haughwout A., Lee D., Scally J., van der Klaauw W. (2014, April) “Measuring
student debt and its performance”, Federal Reserve Bank of New York Staff Reports, 668
Brynjolfsson E., McAfee A. (2015, July/August) “Will humans go the way of horses?”,
Foreign Affairs, 94(4), retrieved from https://www.philadelphiafed.org
Deming D. (2015) “The growing importance of social skills in the labor market”, National
Bureau of Economic Research
Department of the Treasury Office of Economic Policy, Council of Economic Advisers,
Department of Labor (2015) “Occupational licensing: a framework for policymakers”,
retrieved from www.whitehouse.gov
Dimitri C., Effland A., Conklin N. (2005) “The 20th century transformation of U.S. agriculture
and farm policy”, United States Department of Agriculture Economic Research Service
Einav L., Farronato C., Levin J. (2015) “Peer-to-peer markets”, National Bureau of Economic
Research
Ferrie J. (2005) “The end of American exceptionalism? Mobility in the U.S. since 1850”,
National Bureau of Economic Research
Frey C., Osborne A. (2013) “The future of employment: how susceptible are jobs to
computerization?”, Oxford Martin School
Jacobson L., LaLonde R., and Sullivan D. (1993) “Long-term earnings losses of high-
seniority displaced workers”, Federal Reserve Bank of Chicago

July 1, 2016 Global Markets Institute
Goldman Sachs Global Investment Research 42
Jacobson L., LaLonde R., and Sullivan D. (1993, September) “Earnings losses of displaced
workers”, The American Economic Review, 83(4), 685-709
Jacobson L., LaLonde R., and Sullivan D. (2005) “Is retraining displaced workers a good
investment?”, Federal Reserve Bank of Chicago
Katz L., Margo R. (2013) “Technical change and the relative demand for skilled labor: the
United States in historical perspective”, National Bureau of Economic Research
Looney A., Yannelis C. (2015, Fall), “A crisis in student loans? How changes in the
characteristics of borrowers and in the institutions they attended contributed to rising loan
defaults”, Brookings Papers on Economic Activity
Reed D., Liu A., Kleinman R., Mastri A., Reed D., Sattar S., Ziegler J. (2012) “An
effectiveness assessment and cost-benefit analysis of Registered Apprenticeship in 10
states”, Mathematica Policy Research
Rotman D. (2015, July/August) “Who will own the robots?”, MIT Technology Review,
118(4), 26-33
Seligman M., Ernst R., Gillham J., Reivich K., Linkins M. (2009, June) “Positive education:
positive psychology and classroom interventions”, Oxford Review of Education, 35(3), 293-
311
Stokey N. (2016) “Technology, skill and the wage structure”, National Bureau of Economic
Research
Strongin S., Hindlian A., Lawson S., Maxwell K., Sadan K., Banerjee S. (2015) “The two-
speed economy”, Goldman Sachs Global Markets Institute
Thompson D. (2015, July/August) “A world without work”, The Atlantic, 51-61
Weiss T. (1992) “U.S. labor force estimates and economic growth, 1800-1860”, National
Bureau of Economic Research

Disclosures
This report has been prepared by the Global Markets Institute, the public-policy research unit of the Global Investment Research
Division of The Goldman Sachs Group, Inc. (“Goldman Sachs”). As public-policy research, this report, while in preparation, may have
been discussed with or reviewed by persons outside of the Global Investment Research Division, both within and outside Goldman
Sachs, and parts of the paper may have been written by persons outside of the Global Investment Research Division.
While this report may discuss implications of legislative, regulatory and economic policy developments for industry sectors, it does not
attempt to distinguish among the prospects or performance of, or provide analysis of, individual companies and does not recommend
any individual security or an investment in any individual company and should not be relied upon in making investment decisions with
respect to individual companies or securities.
Distributing entities
This research is disseminated in Australia by Goldman Sachs Australia Pty Ltd (ABN 21 006 797 897); in Brazil by Goldman Sachs do
Brasil Corretora de Títulos e Valores Mobiliários S.A. ; in Canada by either Goldman Sachs Canada Inc. or Goldman, Sachs & Co.; in
Hong Kong by Goldman Sachs (Asia) L.L.C.; in India by Goldman Sachs (India) Securities Private Ltd.; in Japan by Goldman Sachs
Japan Co., Ltd.; in the Republic of Korea by Goldman Sachs (Asia) L.L.C., Seoul Branch; in New Zealand by Goldman Sachs New
Zealand Limited; in Russia by OOO Goldman Sachs; in Singapore by Goldman Sachs (Singapore) Pte. (Company Number:
198602165W); and in the United States of America by Goldman, Sachs & Co. Goldman Sachs International has approved this research
in connection with its distribution in the United Kingdom and European Union.
European Union: Goldman Sachs International authorised by the Prudential Regulation Authority and regulated by the Financial
Conduct Authority and the Prudential Regulation Authority, has approved this research in connection with its distribution in the
European Union and United Kingdom; Goldman Sachs AG, regulated by the Bundesanstalt für Finanzdienstleistungsaufsicht, may also
distribute research in Germany.
General disclosures in addition to specific disclosures required by certain jurisdictions
Goldman Sachs conducts a global full-service, integrated investment banking, investment management and brokerage business. It has
investment banking and other business relationships with governments and companies around the world, and publishes equity, fixed
income, commodities and economic research about, and with implications for, those governments and companies that may be
inconsistent with the views expressed in this report. In addition, its trading and investment businesses and asset management
operations may take positions and make decisions without regard to the views expressed in this report.
© 2016 Goldman Sachs.
No part of this material may be (i) copied, photocopied or duplicated in any form by any means or (ii) redistributed without the prior
written consent of The Goldman Sachs Group, Inc.

GLOBAL MARKETS INSTITUTE