Nanostructured Silicon Mass Spectrometry Imaging of Fingerprint Sweat … · 2014-12-10 · Mass...
10
Mass Spectrometry Imaging of Fingerprint Sweat on Nanostructured Silicon T. Guinan, a C. Della Vedova b , H. Kobus c and N. Voelcker c* a ARC Centre of Excellence in Convergent Bio-Nano Science and Technology, Mawson Institute, University of South Australia, GPO Box 2471, Adelaide, SA, 5001. b School of Pharmacy and Medical Sciences, University of South Australia, Adelaide, South Australia, Australia. c School of Physical and Chemical Sciences, Flinders University, Bedford Park, SA 5042, Australia Corresponding Author: Nicolas H. Voelcker* ARC Centre of Excellence in Convergent Bio-Nano Science and Technology Mawson Institute University of South Australia GPO Box 2471, Adelaide SA 5001, Australia Phone: +61 (08) 8302 5508 Fax: +61 (08) 8302 5613 E-mail: [email protected] Electronic Supplementary Material (ESI) for ChemComm. This journal is © The Royal Society of Chemistry 2014
Transcript of Nanostructured Silicon Mass Spectrometry Imaging of Fingerprint Sweat … · 2014-12-10 · Mass...

Mass Spectrometry Imaging of Fingerprint Sweat on Nanostructured Silicon
T. Guinan,a C. Della Vedovab , H. Kobusc and N. Voelckerc*
aARC Centre of Excellence in Convergent Bio-Nano Science and Technology, Mawson Institute, University of South Australia, GPO Box 2471, Adelaide, SA, 5001.bSchool of Pharmacy and Medical Sciences, University of South Australia, Adelaide, South Australia, Australia.cSchool of Physical and Chemical Sciences, Flinders University, Bedford Park, SA 5042, Australia
Corresponding Author:
Nicolas H. Voelcker*
ARC Centre of Excellence in Convergent Bio-Nano Science and Technology
Mawson Institute
University of South Australia
GPO Box 2471, Adelaide
SA 5001, Australia
Phone: +61 (08) 8302 5508
Fax: +61 (08) 8302 5613
E-mail: [email protected]
Electronic Supplementary Material (ESI) for ChemComm.This journal is © The Royal Society of Chemistry 2014

Experimental Section
Desorption Ionisation on Porous Silicon Chip Fabrication
Monocrystalline (0.008-0.02 Ω.cm) antimony doped n-type Si (100) wafers from
Silicon Quest International (CA, USA) were cut with a diamond cutter into 3.5 cm x
3.5 cm squares. The cleaning processes were carried out by sonicating the wafers in
99.9 % methanol and drying under a stream of nitrogen gas. In brief, pSi substrates
were clamped into a custom-built Teflon anodisation cell contacting a gold foil anode
(Space Products International, CA, USA). A 0.5 mm diameter platinum wire (99.9 %,
Aldrich, WI, USA) formed into a ring was used as a cathode. A 1:1 HF:EtOH
electrolyte solution was filled into the Teflon well. The Si surface was illuminated
using a fiber optic light source which passed through a set of two aspheric lens, f = 80
mm (OptoSigma, CA, USA) for collimation. A constant current of 20 mA was then
applied across the cell for 2 min using a source meter program, created in LabView
6.1 to control a 2425 current source meter (Keithley, Ohio, U.S.A). The pSi surfaces
were then subjected to several methanol washes, before being dried under a stream of
nitrogen gas.
Oxidation and Functionalisation
The freshly-etched pSi was ozone-oxidised at a flow rate of 3.25 g/h using an
Ozone-Generator 500 (Fischer, Germany). Following oxidation, the wafer was
subjected to a second pore broadening etch using 5 % HF/H2O for 30 s. Subsequently,
the double etched surface was ozone oxidised (as above) for a second time. The
hydroxyl-terminated surface was then silanised via the addition of 80 μL of neat
pentafluorophenylpropyldimethylchlorosilane for 1 h at 90 oC. After silanisation, the
pSi substrates were washed with methanol, dried under a stream of nitrogen and then
stored in a desiccator until required.
2

DIOS-Mass Spectrometry Imaging (DIOS-MSI)
The Autoflex Series III Bruker MALDI-TOF-TOF mass spectrometer was used to
perform mass imaging analysis in reflectron positive mode in the range 20-1200 Da
with a spatial resolution ranging from 80-200 μm and summing 500 laser shots for
each measuring point. The laser raster was reduced to 80 μm when high resolution
imaging was required. The mass spectrometer was equipped with a SmartBeam (337
nm, Nd:YAG) 200 Hz pulsed laser, operated at 200 Hz frequency and laser attenuator
offset of 55 %. LIFT mode was used to perform all MS/MS experiments. FlexImaging
2.1 (build 25) (Bruker- Daltonics) was used to control flexControl 3.3 during the
acquisition. FlexImaging was used to extract the ion intensity map images, after
processing the datasets by baseline subtraction, normalisation and data reduction.
Fingerprint MS analysis of small molecules
Ethics approval for recruiting volunteers was obtained from the Human Research
Ethics Committee at the University of South Australia. (Protocol # 0000021954
“Immune function in drug alcohol dependant individuals”).
Fingerprints of both drug free and drug taking volunteers were analysed. Each
donor’s hand was cleaned with ethanol prior to placing their hand in a new nitrile
glove. After five minutes, the donor removed the glove and placed their finger on a
freshly prepared DIOS chip. DIOS chips were secured with double sided carbon tape
to a modified MSP384 steel target plate and imaged using MALDI-TOF-TOF MS.
3

MSI of fingerprints after exogenous exposure
Certified standard solutions of MA were kindly provided by Forensic Science South
Australia (Australia). Stock solutions of MA at 0.1 mg/mL in ethanol were prepared
from a certified standard ampoule and stored at -20 oC. Working solutions of 1000
ng/mL were obtained by diluting the stock solutions with ethanol. MA (1000 ng/mL,
100 μL) was pipetted onto a clean microscope slide and allowed to dry. The index
finger from a drug free volunteer was wiped across the slide containing the dried
droplet of MA to simulate contact with drugs that may occur in real world situations.
After the donor had wiped their index finger across the slide it was then placed onto
the DIOS chip.
Subsequently, the DIOS chip was placed onto a modified MSP384 steel target plate
(Bruker-Daltonics) using double sided carbon tape and imaged by MALDI-TOF-TOF
MS.
Scanning Electron Microscopy (SEM)
For DIOS, NIMS and NALDITM SEM micrographs, top view and cross-sectional
images were acquired using a FEI Quanta 450 FEG environmental SEM fitted with an
SSD detector operated at an accelerating voltage of 30 kV.
Fingerprint scanning
A Futronic FS80 fingerprint scanner purchased from Futronic, Hong Kong was used
to obtain electronic fingerprint images.
Fingerprint Identifying Software
4

Fingerprint Minutiae Viewer (FpMV) version 2.0 Beta developed by the National
Institute of Standards and Technology (NIST) was used to analyse fingerprints
electronically.
5

Supplementary Figures
Figure S1 displays images of fingerprints from MSI (figure S1A) and from a
conventional fingerprint scanner (figure S1B). A latent fingerprint examiner initially
was used to identify similarities in the two fingerprints. Identifying features in the
same relative positions are observed in both images. For example at approximately 8
o’clock from the core of figure S1A there is a curved short ridge. An enclosure or lake
is almost touching the right ending of this short ridge. Above and to the right of the
lake is another ridge ending. To the right of the core are two bifurcations (where the
ridge divides into two). There are numerous other corresponding features in the two
marks. This shows that the MSI has reproduced the fingerprint ridge pattern.
Furthermore, open source minutia identifying software identified ridge patterns from
MSI imaging that is overlaid in the center of the scanned fingerprint (Figure S1C).
Green and red detected features represent bifurcation and ridge detection,
respectively. This further confirms that high resolution MSI imaging of fingerprints
could be used for automated identification of participants.
Figure S1. A) MSI of a fingerprint using a laser raster of (80 µm) and B) image of fingerprint taken with an electronic fingerprint scanner. C) Fingerprint analysed using FpMV 2.0 minutiae identification software. Bifurcation and ridges highlighted in green and red, respectively.
6

Figure S2 displays DIOS-MSI of a donor who had recently taken MA. The presence
of MA was detected alongside its metabolite in amphetamine confirming that the
donor had administered MA.
Figure S2. MSI of a fingerprint from a participant who tested positive to MA. Peak selection for A) MA (m/z 150) and B) its metabolite amphetamine (m/z 136).
7
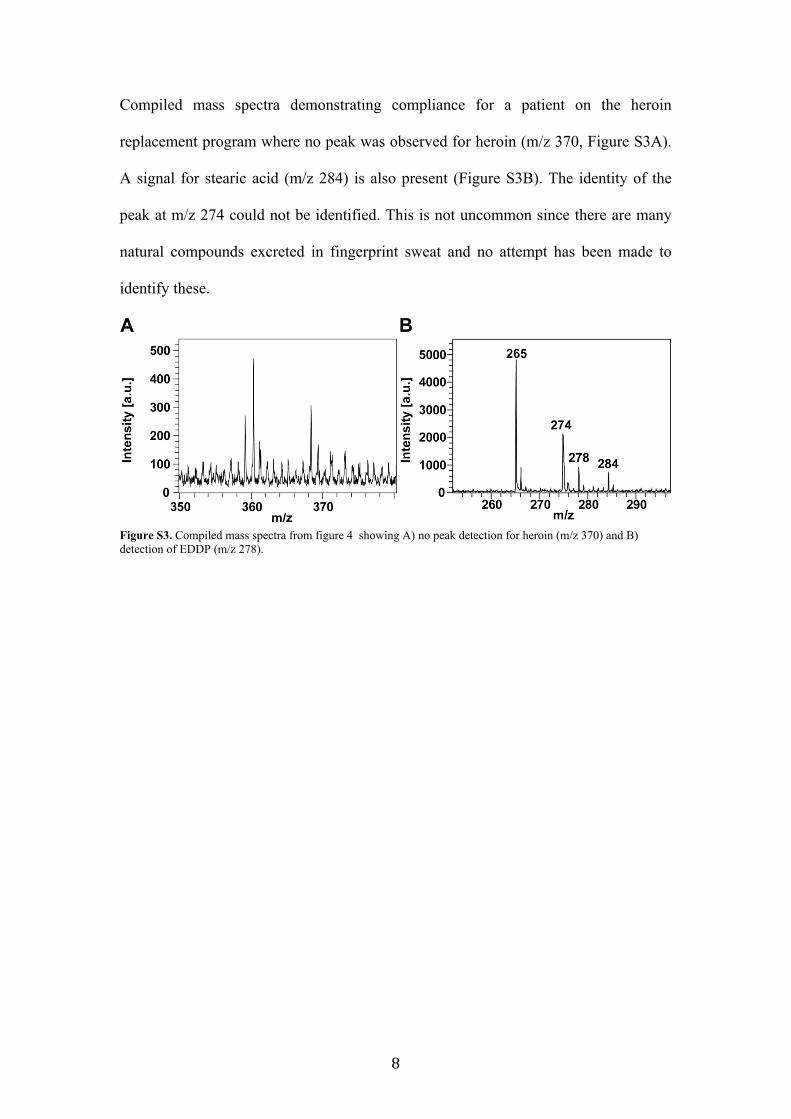
Compiled mass spectra demonstrating compliance for a patient on the heroin
replacement program where no peak was observed for heroin (m/z 370, Figure S3A).
A signal for stearic acid (m/z 284) is also present (Figure S3B). The identity of the
peak at m/z 274 could not be identified. This is not uncommon since there are many
natural compounds excreted in fingerprint sweat and no attempt has been made to
identify these.
Figure S3. Compiled mass spectra from figure 4 showing A) no peak detection for heroin (m/z 370) and B) detection of EDDP (m/z 278).
8

DIOS-MSI images display the detection of multiple analytes in methadone (Figure
S4A) and nicotine (Figure S4B). The compiled mass spectra MSI images are
displayed in Figure S4C. Two high intensity peaks for methadone (m/z 310) and
nicotine (m/z 163) were observed. Interestingly, in this case the metabolite, cotinine
was also detected (Figure S4D). Low signal intensity was observed for cotinine
confirming the presence of nicotine in this case to be from an endogenous source and
not external contamination of the finger.
Figure S4. MSI of a fingerprint from a volunteer enrolled in a heroin replacement program with mass peak selections for A) methadone (m/z 310) and B) nicotine (m/z 163). C) Mass spectrum observed for the detection of methadone and nicotine simultaneously, and D) zoomed in mass spectrum to show the detection of nicotine and cotinine (m/z 177).
9

Figure S5 displays DIOS-MSI of a donor prior to administration of codeine (Figure
S5A) and 1 h after taking codeine (Figure S5B). The presence of codeine was not
detected in the predose fingerprint. However, 1 h after administration codeine was
detected across the entire fingerprint.
Figure S5. MSI of a fingerprint from a volunteer A) prior to the ingestion of 30 mg of codeine (m/z 300) and B) 1 h after ingestion.
10