
Nanoparticles Photothermal Release of CO2 from … · Photothermal Release of CO2 from Capture...
10
Photothermal Release of CO 2 from Capture Solutions Using Nanoparticles Du T. Nguyen, a Samantha A. Goetz, b Richard Truong, b Richard Lee, b and Aaron P. Esser-Kahn* b a Department of Physics and Astronomy, University of California, Irvine, Irvine California, 92697, United States. b Department of Chemistry, University of California, Irvine, Irvine California, 92697, United States. Electronic Supplementary Material (ESI) for Energy & Environmental Science. This journal is © The Royal Society of Chemistry 2014
Transcript of Nanoparticles Photothermal Release of CO2 from … · Photothermal Release of CO2 from Capture...

Photothermal Release of CO2 from Capture Solutions Using Nanoparticles
Du T. Nguyen,a Samantha A. Goetz,b Richard Truong,b Richard Lee,b and Aaron P. Esser-Kahn*b
a Department of Physics and Astronomy, University of California, Irvine, Irvine California, 92697, United States.b Department of Chemistry, University of California, Irvine, Irvine California, 92697, United States.
Electronic Supplementary Material (ESI) for Energy & Environmental Science.This journal is © The Royal Society of Chemistry 2014

Nanoparticle Characterization
The carbon black nanoparticles were characterized with respect to their size and light absorbance. The particle sizes were measured using a Malvern Zetasizer AZ Nano DLS. The nanoparticles were examined in water, MEA, and MEA loaded with CO2. The nanoparticles were distributed within the liquids at 0.001 wt% and dispersed under ultra-sonication. In water and MEA, the nanoparticle diameters ranged from 40 to 1000 nm, with an average of 200 nm (Figure S1). When CO2 was introduced into MEA, the particles agglomerated, resulting in an average measured particle diameter of 3 µm.
Figure S1. Nanoparticle size distributions in H2O, MEA, and MEA with CO2
The carbon black nanoparticles were characterized with respect to their light absorption. The nanoparticles were distributed in water under ultra-sonication at 0.001 wt%. A Cary 50 Photospectrometer measured the transmittance of light through the nanoparticles over a wavelength range of 200 to 1100 nm. There is a broad absorption of light by the nanoparticles with wavelengths greater than 400 nm indicating its potential photo-thermal heat generation over a broad range.
Figure S2. UV-Vis Transmittance of carbon black.
Light Source Emission Spectra
The emission spectra of our light sources were examined using a Hitachi F4500 Fluorescent Spectrometer and a modified cuvette. A set of optical fibers ran to the cuvette so that the emission of the light sources could be monitored by the spectrometer. It should be noted that due to the IR absorbance of glass, only the spectra for the visible range ought to be considered.

Figure S3. Light source emission spectra
Optical Simulation
The energy of light entering the round bottom flask was estimated using POV-Ray1, an optical ray tracing program. The refraction and Fresnel reflection of light causes loss of the some incident radiant (Figure S4a). The software simulates the optical conditions of the system and can provides an estimate of the radiant energy entering the flask (Figure S4b). A round bottom flask was cross-sectioned with a measuring plane where the pixel intensity can be measured (Figure S4c). By comparing the average pixel intensity within the cross section and outside of the cross section, the fraction of lost light was estimated to be 15% as the flask reflects some light and does not contains anti-reflective coatings. This was experimentally confirmed using a modified cuvette to measure the light emission spectra. Within the same spatial coordinates, the irradiance was measured in open air and within a round bottom flask confirming the 15% energy loss.

Figure S4. Optical simulation. (A) Ray tracing. Light is lost as refraction and Fresnel reflection diverts some of the light from the flask. (B) POV-Ray simulation. A representative simulation is shown to demonstrate the capabilities of the software. (C) Lost energy measurement. Half the flask is placed above a measurement plane. The amount of light that passes through the flask is compared to the light that directly hits the grid.
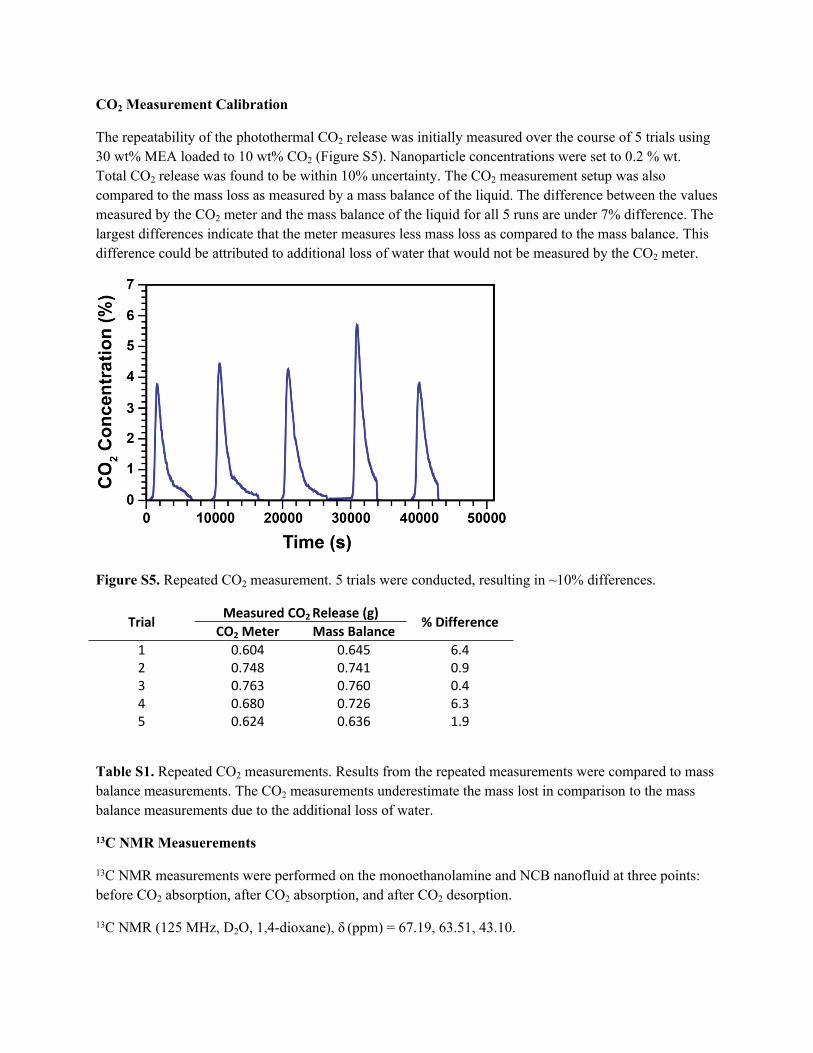
CO2 Measurement Calibration
The repeatability of the photothermal CO2 release was initially measured over the course of 5 trials using 30 wt% MEA loaded to 10 wt% CO2 (Figure S5). Nanoparticle concentrations were set to 0.2 % wt. Total CO2 release was found to be within 10% uncertainty. The CO2 measurement setup was also compared to the mass loss as measured by a mass balance of the liquid. The difference between the values measured by the CO2 meter and the mass balance of the liquid for all 5 runs are under 7% difference. The largest differences indicate that the meter measures less mass loss as compared to the mass balance. This difference could be attributed to additional loss of water that would not be measured by the CO2 meter.
Figure S5. Repeated CO2 measurement. 5 trials were conducted, resulting in ~10% differences.
Measured CO2 Release (g)Trial
CO2 Meter Mass Balance% Difference
1 0.604 0.645 6.42 0.748 0.741 0.93 0.763 0.760 0.44 0.680 0.726 6.35 0.624 0.636 1.9
Table S1. Repeated CO2 measurements. Results from the repeated measurements were compared to mass balance measurements. The CO2 measurements underestimate the mass lost in comparison to the mass balance measurements due to the additional loss of water.
13C NMR Measuerements
13C NMR measurements were performed on the monoethanolamine and NCB nanofluid at three points: before CO2 absorption, after CO2 absorption, and after CO2 desorption.
13C NMR (125 MHz, D2O, 1,4-dioxane), δ (ppm) = 67.19, 63.51, 43.10.

13C NMR (125 MHz, D2O, 1,4-dioxane), δ (ppm) = 165.14, 161.51, 67.19, 62.05, 58.71, 44.03, 42.10.
13C NMR (125 MHz, D2O, 1,4-dioxane), δ (ppm) = 164.97, 67.19, 63.01, 62.10, 44.11, 43.99, 43.18.
Figure S6. 13C NMR Measurements.
CO2 Solubility in MEA Model
The solubility of CO2 in MEA was modeled using a quasi-chemical model based on an activity-fugacity approach reported by Tong et al 2 (Figure S7). The model combines physical equilibria, chemical equilibria, and phase nonidealities to generate information on the vapor-liquid equilibria of CO2 and MEA at given temperatures and pressures.
𝐶𝑂2(𝑔)𝐻𝐶𝑂2
↔ 𝐶𝑂2(𝑙)( 1 )
2𝐻2𝑂𝐾1
↔𝐻3𝑂 + + 𝑂𝐻 ‒ ( 2 )
𝐶𝑂2 + 2𝐻2𝑂 𝐾2
↔𝐻3𝑂 + + 𝐻𝐶𝑂 +3
( 3 )
𝐻𝐶𝑂3 ‒ + 𝐻2𝑂𝐾3
↔𝐻3𝑂 + + 𝐶𝑂2 ‒3
( 4 )
𝑅𝑁𝐻� +3 + 𝐻2𝑂
𝐾4
↔𝑅𝑁𝐻2 + 𝐻3𝑂 + ( 5 )

𝑅𝑁𝐻𝐶𝑂𝑂 ‒ + 𝐻2𝑂 𝐾5
↔𝑅𝑁𝐻2 + 𝐻𝐶𝑂 ‒3
( 6 )
Further information on the model can be found from Tong et al.2
Figure S7. CO2 Solubility in MEA Model based on Tong et. al. (A) Linear contour plot. At high pressures and low temperatures, CO2 is most soluble in MEA. (B) Log scale contour plot.
The equilibria was used to estimate the predicted release of CO2 with given temperature changes by numerically solving (Eq 7)

∂𝛼(𝑡)∂𝑡 =‒ 𝑟(𝛼(𝑡) ‒ 𝛼𝑒𝑞(𝑇(𝑡),𝑃(𝑡)))3 ( 7 )
The rate constant was empirically estimated to match experimentally collected data. Data on the solubility of CO2 was previously collected by Jou et al. at 313K (Figure S8A)3. At loading pressures and temperatures used in this report, 0.5 moles of CO2 are absorbed per mole of MEA. However, higher loading capacities are possible at higher CO2 pressures. The model matched well with their reported data. The predicted release of CO2 was compared with an experiment in which 40 mL of MEA was immersed in a 50 °C water bath. The measured release rate matched well with the predicted results (Figure S8B).
Figure S8. Experimental and model results. (A) Correlation of model and Jou et al. at 40 °C. (B) Correlation of model and experimental release rate at 50 °C.

Temperature evolutions of time were also measured for the two extremes of NCB concentration (Figure S9A). Using these temperature profiles for the model, a predicted release of CO2 was constructed by the model (Figure S9B). While the model was accurate for bulk temperature increases and the resulting CO2 release, the photothermal release of CO2 resulted in greater release than was predicted.
Figure S9. Photothermal temperature evolution. (A) Temperature evolutions. Temperature profiles were measured with respect to time at 0 wt% and 0.3 wt% NCB using a thermocouple. Bulk temperatures only show minor differences. (B) CO2 release model. Experimental temperature evolutions were inputted into the model to produce the expected CO2 release profile. The increased CO2 release between the experiment and model indicate enhanced release due to the presence of the NCB
1. POV-Ray Persistence of Vision Raytracer, 2013, http://www.povray.org/.

2. D. Tong, J. P. M. Trusler, G. C. Maitland, J. Gibbins, and P. S. Fennell, Int. J. Greenh. Gas Control, 2012, 6, 37–47.
3. F.-Y. Jou, A. E. Mather, and F. D. Otto, The Canadian Journal of Chemical Engineering, 1995, 73, 140–147.