NANO CALCIUM PHOSPHATES DOPED WITH TITANIUM AND …etd.lib.metu.edu.tr/upload/12614440/index.pdf ·...
145
NANO CALCIUM PHOSPHATES DOPED WITH TITANIUM AND FLUORIDE IONS: SINTERABILITY AND STABILITY OF PHASES A THESIS SUBMITTED TO THE GRADUATE SCHOOL OF NATURAL AND APPLIED SCIENCES OF MIDDLE EAST TECHNICAL UNIVERSITY BY SERAP GÜNGÖR GERĐDÖNMEZ IN PARTIAL FULFILLMENT OF THE REQUIREMENTS FOR THE DEGREE OF DOCTOR OF PHILOSOPHY IN ENGINEERING SCIENCES JUNE 2012
Transcript of NANO CALCIUM PHOSPHATES DOPED WITH TITANIUM AND …etd.lib.metu.edu.tr/upload/12614440/index.pdf ·...
NANO CALCIUM PHOSPHATES DOPED WITH TITANIUM AND FLUORIDE IONS: SINTERABILITY AND STABILITY OF PHASES
A THESIS SUBMITTED TO
THE GRADUATE SCHOOL OF NATURAL AND APPLIED SCIENCES OF
MIDDLE EAST TECHNICAL UNIVERSITY
BY
SERAP GÜNGÖR GERĐDÖNMEZ
IN PARTIAL FULFILLMENT OF THE REQUIREMENTS FOR
THE DEGREE OF DOCTOR OF PHILOSOPHY IN
ENGINEERING SCIENCES
JUNE 2012
Approval of the thesis:
NANO CALCIUM PHOSPHATES DOPED WITH TITANIUM AND FLUORIDE IONS: SINTERABILITY AND STABILITY OF PHASES
submitted by SERAP GÜNGÖR GERĐDÖNMEZ in partial fulfillment of the requirements for the degree of Doctor of Philosophy in Engineering Sciences Department, Middle East Technical University by,
Prof. Dr. Canan Özgen ______________
Dean, Graduate School of Natural and Applied Sciences
Prof. Dr. Murat Dicleli ______________
Head of Department, Engineering Sciences Dept.
Assoc. Prof. Dr. Zafer Evis ______________
Supervisor, Engineering Sciences Dept.
Examining Committee Members:
Prof. Dr. Turgut Tokdemir. ______________
Engineering Sciences Dept., METU
Assoc. Prof. Dr. Zafer Evis ______________
Engineering Sciences Dept., METU
Assoc. Prof. Dr. Dilek Keskin ______________
Engineering Sciences Dept., METU
Assoc. Prof. Dr. Hasan Okuyucu ______________
Materials Engineering Dept., YBU
Assoc. Prof. Dr. Ayşen Tezcaner ______________
Engineering Sciences Dept., METU
Date: 14.06.2012
iii
PLAGIARISM
I hereby declare that all information in this document has been obtained and presented in accordance with academic rules and ethical conduct. I also declare that, as required by these rules and conduct, I have fully cited and referenced all material and results that are not original to this work. Name, Last Name : Serap GÜNGÖR GERĐDÖNMEZ Signature :
iv
ABSTRACT
NANO CALCIUM PHOSPHATES DOPED WITH TITANIUM AND FLUORIDE IONS: SINTERABILITY AND STABILITY OF PHASES
GÜNGÖR GERĐDÖNMEZ, Serap
Ph.D., Department of Engineering Sciences
Supervisor: Assoc. Prof. Dr. Zafer EVIS
June 2012, 129 pages
The purpose of this study was to synthesize calcium phosphates doped with titanium and
fluoride ions in different combinations. Pure and doped calcium phosphates were
synthesized by a precipitation method. The synthesized materials were sintered at 1100ºC
and 1300ºC for 1h. The ceramics were characterized by density measurements to determine
the effect of sintering temperature. Presence of phases and bonds were characterized by
XRD diffraction and FTIR spectroscopy. Grain sizes of the samples were obtained by
SEM. Microhardness test was applied on the samples to determine the mechanical
properties of the samples. It was observed that Ti4+ addition decreased the density of
samples significantly at 1100°C, whereas increasing the sintering temperature to 1300°C
caused an increase. Increasing the F- ion amount increased the densification at 1100°C
when molar ratios were 1.0, 1.25, 1.50 and decreased the density at 1300°C when Ca /P
molar ratios were 1.0, 1.25, 1.67 and 2.0. Ti4+ and F- co-doped samples showed variety in
their density behaviour after the sintering at 1100ºC and 1300ºC.
The XRD analyses demonstrated that for Ca to P ratio 1 at 1100°C, β-CPP phase, when
sintering temperature was raised to 1300°C, as a second phase of β-CPP and α-TCP
observed. Increasing the molar ratio to 1.25 and 1.50 demonstrated β-TCP and/or β-CPP
and β-TCP/ HA at 1100°C and β-TCP and/or β-CPP, α-TCP, TiO2 and HA, α-TCP, TiO2
phases at 1300°C, respectively. In higher Ca/P molar ratios of 1.67 and 2.0, HA, β-TCP, α-

v
TCP, CaO, TiO2, CaTiO3 and HA, CaO, α-TCP, CaTiO3 phases were determined.
Increasing the sintering temperature to 1300°C resulted in transformation to α-TCP.
In FTIR spectroscopy analysis, when the samples with molar ratio of 1, 1.25, 1.50, 1.67 and
2.0, sintered at 1100°C, the characteristic bands of β-CPP, OCP/β-TCP, β-TCP/HA, HA
and HA were observed, respectively. With increasing the sintering temperature to 1300°C,
samples with molar ratio of 1.0 and 1.25 revealed additional secondary characteristic peaks
of HA and β-TCP. SEM images revealed that sintering temperature and ion amounts of
dopants had significant effect on grain sizes of the samples. The grain sizes were generally
increased when sintering temperature rose from 1100°C to 1300°C. The µ-hardness test
demonstrated that Ti4+ and F- ions in large amounts had positive effect on the mechanical
properties at the sintering temperatures of 1100°C and 1300°C.
Keywords: Hydroxyapatite; Calcium phosphate; Titanium; Fluoride.

vi
ÖZ
TĐTANYUM VE FLOR ĐYONLARI ĐLAVE EDĐLMĐŞ NANO-KALSĐYUM FOSFATLAR: SĐNTERLENME VE FAZLARIN KARARLILIĞI
GÜNGÖR GERĐDÖNMEZ, Serap
Doktora, Mühendislik Bilimleri Bölümü
Tez yöneticisi: Doç. Dr. Zafer EVĐS
Haziran 2012, 129 sayfa
Bu çalışmanın amacı farklı kombinasyonlarda titanyum ve flor eklenmiş kalsiyum
fosfatların sentezlenmesidir. Saf ve iyon eklenmiş kalsiyum fosfatlar bir çöktürme metodu
ile sentezlenmiştir. Sentezlenen malzemeler 1100ºC ve 1300ºC de bir saat sinterlenmiştir.
Seramikler sinterleme sıcaklığının etkisini belirlemek için yoğunluk ölçümleri ile
incelenmiştir. Fazların ve bağların varlığı XRD kırınımı ve FTIR spektrometresi ile
karakterize edilmiştir. Örneklerin tane boyutları taramalı elektron mikroskobu (SEM) ile
elde edilmiştir. Örneklerin mekanik özelliklerinin belirlenebilmesi için numunelere
mikrosertlik testi uygulanmıştır. 1100ºC de Ti4+ katkısının örneklerin yoğunluğu önemli
derecede düşürdüğü, sinterleme sıcaklığının 1300ºC ye yükseltilmesinin ise bir azalmaya
neden olduğu gözlemlenmiştir. F- iyonunun miktarının arttırılması Ca/P mol oranları 1.0,
1.25, 1.50´de yoğunlaşmayı arttırmış ve yoğunlukları 1300 ºC de Ca/P mol oranları 1.0,
1.25, 1.67 ve 2.0 de yoğunluklar azalmıştır. Ti4+ ve F- birlikte ilave edilmiş numunelerin
yoğunluk davranışları 1100ºC ve 1300ºC´de sinterlendikten sonra farklılık göstermiştir.
XRD analizleri Ca/P oranı 1.0 iken, 1100ºC de β-CPP fazı, sinterleme sıcaklığı 1300ºC
yükseltildiğinde ikincil fazlar olarak β-CPP ve α-TCP gözlenmiştir. Mol oranları 1.25 ve
1.50'ye artırılmasıyla sırasıyla 1100°C’de β-TCP ve/veya β-CPP, β-TCP/ HA ve 1300°C’de
β-TCP ve/veya β-CPP, α-TCP, TiO2 ve HA, α-TCP, TiO2 fazlarını göstermiştir. 1.67 ve 2.0
olan daha yüksek Ca/P mol oranlarında, HA, β-TCP, α-TCP, CaO, TiO2, CaTiO3 ve HA,
vii
CaO, α-TCP, CaTiO3 fazları belirlenmiştir. Sinterleme sıcaklığı 1300ºC'ye yükseltildiğinde
α-TCP'ye dönüşümle sonuçlanmıştır.
FTIR spectroskopi analizinde, mol oranları 1, 1.25, 1.50, 1.67 ve 2,0 olan numunelerde,
1100ºC´de sinterlendiğinde sırasıyla, β-CPP, OCP/ β-TCP, β-TCP/HA ve HA karakteristik
bantları gözlemlenmiştir. Sinterleme sıcaklığının 1300ºC'ye yükseltilmesiyle, mol oranları
1.0 ve 1.25 olan numunelerde HA ve β-TCP ek ikincil karakteristik faz tepeleri olarak
ortaya çıkmaktadır. SEM görüntüleri sinterleme sıcaklığı ve ilave edilmiş iyon katkı
miktarlarının tane boyutları üzerinde önemli etkisi olduğunu göstermiştir. Tane boyutları
genellikle sinterleme sıcaklığı 1100ºC´den 1300ºC'ye çıkartıldığında artmıştır. Mikrosertlik
testi, 1100ºC ve 1300ºC sinterleme sıcaklıklarında yüksek miktarlarda Ti4+ ve F- iyonlarının
mekanik özellikler üzerinde olumlu etkisinin olduğunu göstermiştir.
Anahtar Kelimeler: Hidroksiapatit; Kalsiyum fosfat; Titanyum; Flor.

viii
To my father and mother

ix
ACKNOWLEDGMENTS
I would like to express my sincere gratitude to my supervisor Assoc. Prof. Dr. Zafer Evis
for his enthusiastic guidance and patience throughout this study. I am also so grateful to my
advisor for encouraging me in this interesting field, continuous encouragement and
confidence in me and my work throughout the research.
I would also like to thank to Prof Dr. Turgut Tokdemir, Prof. Dr. Ruşen Geçit and Prof. Dr.
Setsuo Maeda for their sincere support and guidance during my thesis.
I would like to express my gratitude thanks to my advisor Assoc. Prof. Dr. Zafer Evis,
Assoc. Prof. Dr. Ayşen Tezcaner and Assoc. Prof. Dr. Dilek Keskin for allowing me to
work in their Biomaterials laboratory. I owe my thanks to my lab friends Aydın
Tahmasebifar and Đdil Uysal for their guidance during my experiments. I also would like to
thank my other dear lab friends; Ayşegül Kavas, Özge Erdemli and Ömer Aktürk for their
support, friendship and the lovely environment they created in our lab.
I would like to express my special thanks to my dearest friends Dr. Ebru Önlü Dural, Dr.
Rezan Sevinik Adıgüzel, Yasemin Kaya, and Ünal Tongür for their precious friendship. I
am also grateful to my friends for their moral support and good will. With their presence,
the joy they bring into my life and their constant support, they mean more than friends to
me.
I would like to give my greatest thanks to my parents and my brother for the values they
taught and the endless support they provided through my entire life. Their respect and
belief in what I do is precious for me.
I offer my special thanks to my spouse Fatih Geridönmez for his unconditional love,
continuous encouragement and support that provide me during my thesis.
x
TABLE OF CONTENTS
ABSTRACT .................................................................................................................... IV
ÖZ ................................................................................................................................... VI
ACKNOWLEDGMENTS ................................................................................................ IX
TABLE OF CONTENTS .................................................................................................. X
LIST OF TABLES ......................................................................................................... XII
LIST OF FIGURES ...................................................................................................... XIV
LIST OF ABBREVIATIONS ....................................................................................... XVI
CHAPTERS
1 INTRODUCTION ..................................................................................................... 1
1.1 BONE ................................................................................................................ 1
1.1.1 Composition of Bone .................................................................................... 2
1.1.2 Bone Mineral ................................................................................................ 5
1.2 APATITES .......................................................................................................... 7
1.2.1 Calcium Phosphates ...................................................................................... 9
1.2.1.1 Calcium Phosphate Types ................................................................... 10
1.3 HYDROXYAPATITE .......................................................................................... 13
1.3.1 Synthesis Methods of HA ............................................................................ 14
1.3.1.1 Solid State Sintering Process of HA .................................................... 15
1.3.1.2 Emulsion and Micro-emulsion Techniques of HA ............................... 16
1.3.1.3 Hydrothermal Reactions of HA ........................................................... 17
1.3.1.4 Sol-gel Synthesis Technique of HA..................................................... 18
1.3.1.5 Precipitation Method of HA ................................................................ 20
1.3.2 Microstructure and Phase Transformations of HA ....................................... 21
1.3.3 Biological Properties of HA ........................................................................ 22
1.3.4 Mechanical Properties HA .......................................................................... 24
1.3.5 Nanophase Hydroxyapatite.......................................................................... 24
1.4 HYDROXYAPATITE DOPED BY TITANIUM ......................................................... 26
1.5 HYDROXYAPATITE DOPED BY FLUORIDE ......................................................... 28
xi
1.6 AIM OF THE THESIS ......................................................................................... 29
2 METHODS ............................................................................................................. 30
2.1 MATERIALS ..................................................................................................... 30
2.2 SYNTHESIS OF CALCIUM PHOSPHATES ............................................................. 30
2.2.1 Synthesis of Doped Calcium Phosphates ..................................................... 32
2.3 CHARACTERIZATION METHODS ....................................................................... 33
2.3.1 Density Measurements ................................................................................ 33
2.3.2 X-ray Diffraction ........................................................................................ 33
2.3.3 Fourier Transform Infrared Spectroscopy (FTIR) ........................................ 34
2.3.4 Scanning Electron Microscopy (SEM)......................................................... 34
2.3.5 Mechanical Measurements .......................................................................... 34
2.3.5.1 Vickers Micro-Hardness ..................................................................... 34
3 RESULTS AND DISCUSSION .............................................................................. 36
3.1 STRUCTURAL ANALYSIS .................................................................................. 36
3.1.1 Density of the Samples ................................................................................ 36
3.2 STRUCTURAL INVESTIGATION OF THE SAMPLES............................................... 40
3.2.1 X-Ray Diffraction ....................................................................................... 40
3.2.1.1 Lattice Parameter Measurements of Pure and Doped Hydroxyapatite .. 63
3.2.2 Fourier Transform Infrared Spectroscopy .................................................... 66
3.2.3 Scanning Electron Microscopy .................................................................... 91
3.3 MECHANICAL INVESTIGATION OF THE SAMPLES ............................................ 108
3.3.1 Micro-hardness Measurements .................................................................. 108
4 CONCLUSION ..................................................................................................... 112
REFERENCES .............................................................................................................. 115
VITA.................................................................................................................................. 129
xii
LIST OF TABLES
TABLES
Table 1.1: The basic functions of the bone (adapted from [1]). ........................................... 1
Table 1.2: The classification of bones according to shapes in the body and the properties [6]. .................................................................................................................................. 4
Table 1.3: Composition of the dentine, enamel and bone given by weight % [17]. .............. 9
Table 1.4: Calcium phosphate types, abbreviation and Ca/P ratio [24]. ............................. 11
Table 1.5: Comparative mechanical properties of cortical bone and HA............................ 25
Table 1.6: Parameters in controlling crystal size, morphology chemical stability and
sinterability of HA. .................................................................................................. 27
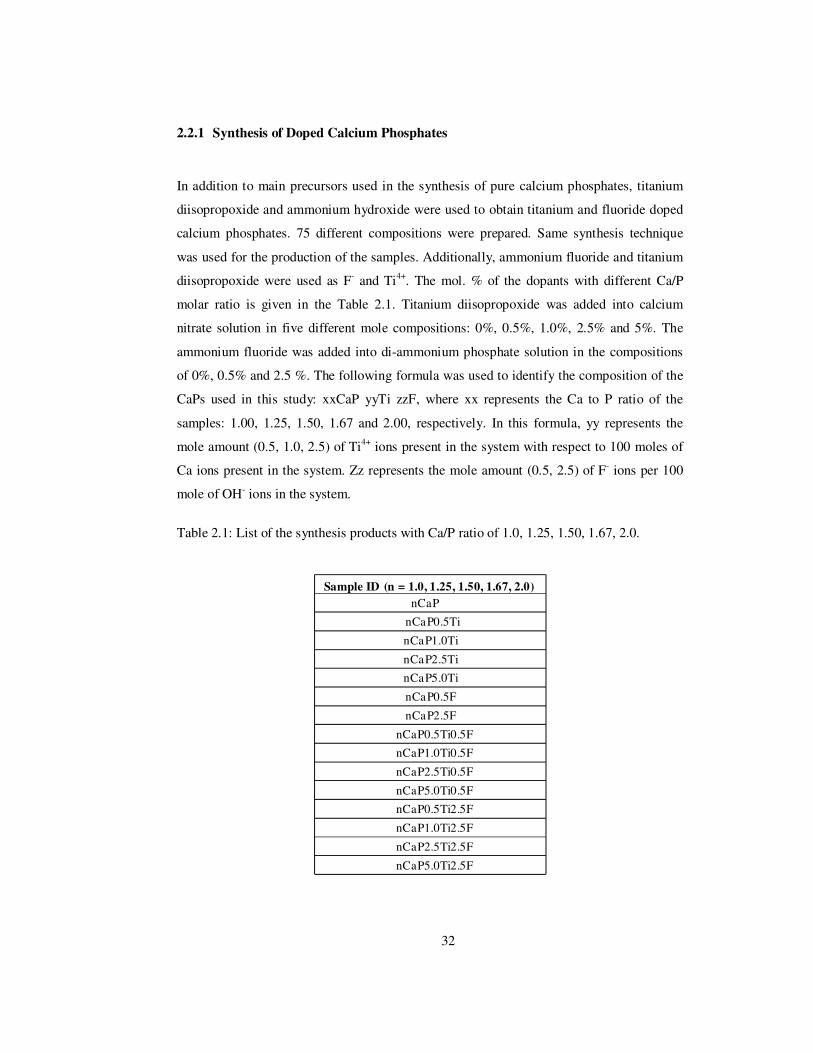
Table 2.1: List of the synthesis products with Ca/P ratio of 1.0, 1.25, 1.50, 1.67, 2.0......... 32
Table 2.2: Theoretical densities of CaP used in the relative density calculations [16]. ....... 33
Table 3.1: Sintered densities of calcium phosphates after the sintering at 1100°C and
1300°C for 1h . ........................................................................................................ 37
Table 3.2: ICDD files for CPP, DCPA, HA, TTCP and TCP. ........................................... 40
Table 3.3: Hexagonal lattice parameters of pure amd doped CaPs with a Ca/P ratio of 1.67
sintered at 1100°C and 1300°C. ............................................................................... 64
Table 3.4: Z positions of the ions of OH and F [66]. ......................................................... 65
Table 3.5: Frequencies and assignment and frequencies of CPP. ....................................... 67
Table 3.6: FTIR band locations in the samples with Ca/P molar ratio 1.0 at 1100°C. ........ 67
Table 3.7: FTIR band locations in the samples with Ca/P molar ratio 1.0 at 1300°C. ........ 69
xiii
Table 3.8: FTIR band locations in the samples with Ca/P molar ratio 1.25 at 1100°C. ...... 72
Table 3.9: FTIR band locations in the samples with Ca/P molar ratio 1.25 at 1300°C. ...... 74
Table 3.10: FTIR band locations in the samples with Ca/P molar ratio 1.50 at 1100°C. ..... 75
Table 3.11: FTIR band locations in the samples with Ca/P molar ratio 1.50 at 1300°C. ..... 79
Table 3.12: Frequencies and assignments of CaPs. ........................................................... 81
Table 3.13: FTIR band locations in the samples with Ca/P molar ratio 1.67 at 1100°C. ..... 82
Table 3.14: FTIR bands of HA and HA-TiO2 [105] . ......................................................... 83
Table 3.15: FTIR band locations in the samples with Ca/P molar ratio 1.67 at 1300°C. ..... 84
Table 3.16: FTIR band locations in the samples with Ca/P molar ratio 2.0 at 1100°C........ 87
Table 3.17: FTIR band locations in the samples with Ca/P molar ratio 2.0 at 1300°C........ 88
Table 3.18: Average grain size of CaPs with molar ratios of 1,1.25, 1.50, 1.67, 2 sintered at
1100oC and 1300 oC. .............................................................................................. 107
Table 3.19: Micro-hardness of CaPs with Ca/P ratios of 1,1.25, 1.50, 1.67 and 2 sintered at
1100oC and 1300 oC. .............................................................................................. 111

xiv
LIST OF FIGURES
FIGURES
Figure 1.1: Composition of the bone [63]. .......................................................................... 2
Figure 1.2: Hierarchically organized structure of the bone [7]. ............................................ 5
Figure 1.3: Alignment of mineral crystals between collagen fibrils, fibers and bone mineral
crystals [13]. .............................................................................................................. 7
Figure 1.4: Setting of carbonate HA and collagen molecules [15]. ...................................... 8
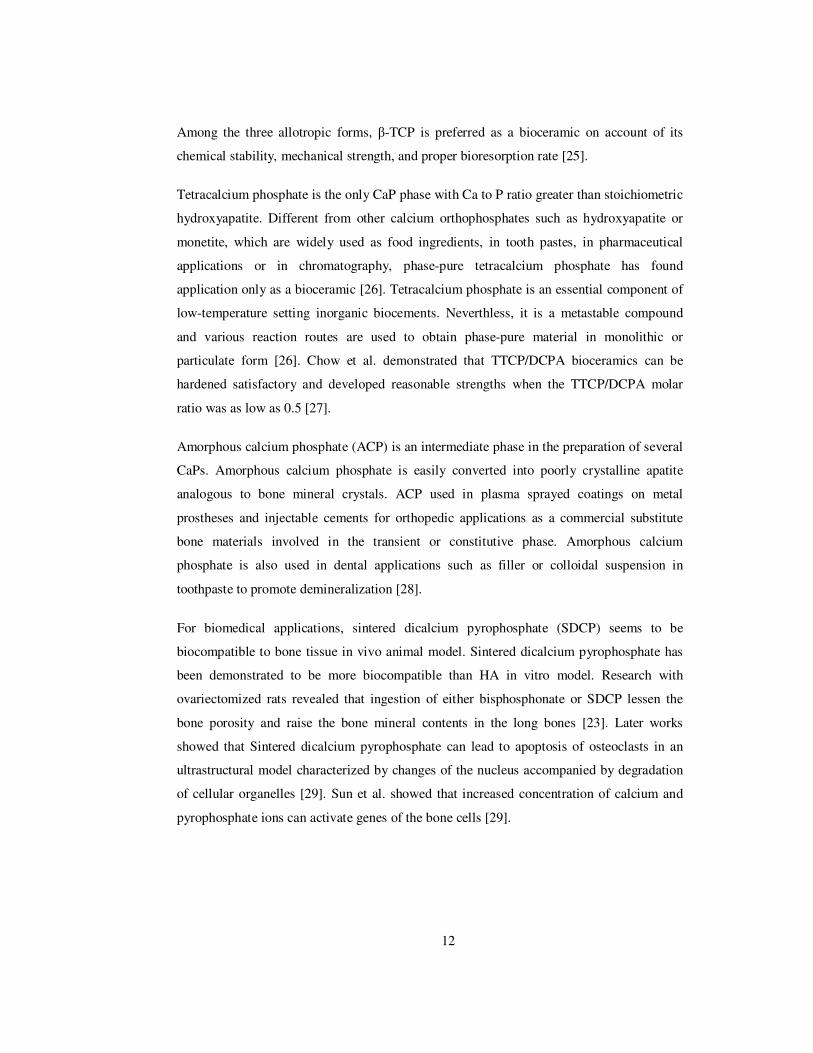
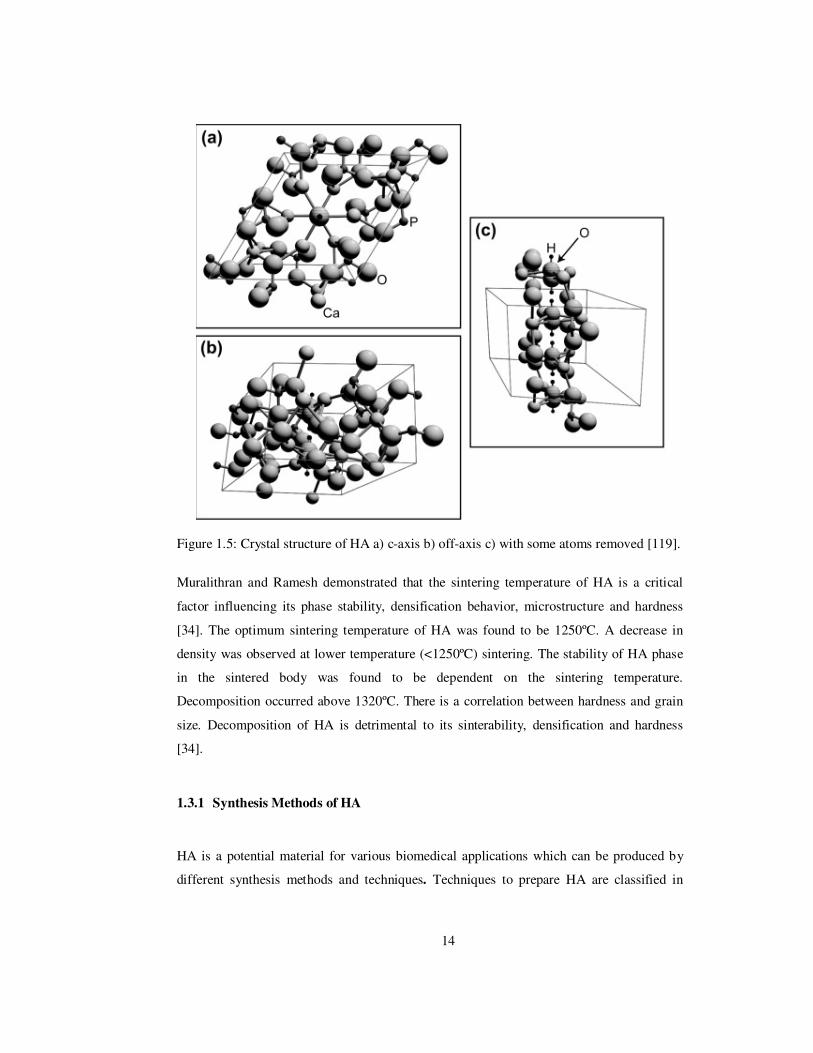
Figure 1.5: Crystal structure of HA a) c-axis b) off-axis c) with some atoms removed [119]. ................................................................................................................................ 14
Figure 1.6: Experimental procedure of the sol-gel synthesis of HA powders [45]. ............. 19
Figure 1.7: Ca (Ι) and Ca (Π) atoms in the microstructure of HA [52]. .............................. 21
Figure 2.1: Synthesis process of pure CaPs. ...................................................................... 31
Figure 3.1: XRD patterns of CaPs with Ca to P ratio of 1.0 sintered at 1100°C. ................ 42
Figure 3.2: XRD patterns of CaPs with Ca to P ratio of 1.0 sintered at 1300°C. ................ 45
Figure 3.3: XRD patterns of CaPs with Ca to P ratio of 1.25 sintered at 1100°C. .............. 46
Figure 3.4: XRD patterns of CaPs with Ca to P ratio of 1.25 sintered at 1300°C. .............. 48
Figure 3.5: XRD patterns of CaPs with Ca to P ratio of 1.50 sintered at 1100°C. .............. 50
Figure 3.6: XRD patterns of CaPs with Ca to P ratio of 1.50 sintered at 1300°C. .............. 52
Figure 3.7: XRD patterns of CaPs with Ca to P ratio of 1.67 sintered at 1100°C. .............. 55
Figure 3.8: XRD patterns of CaPs with Ca to P ratio of 1.67 sintered at 1300°C. .............. 58
Figure 3.9: XRD patterns of CaPs with Ca to P ratio of 2.0 sintered at 1100°C. ................ 60

xv
Figure 3.10: XRD patterns of CaPs with Ca to P ratio of 2.0 sintered at 1300°C. .............. 62
Figure 3.11: FTIR patterns of CaPs with Ca to P ratio of 1 sintered at 1100°C. ................. 70
Figure 3.12: FTIR patterns of CaPs with Ca to P ratio of 1 sintered at 1300°C. ................. 71
Figure 3.13 : FTIR patterns of CaPs with Ca to P ratio of 1.25 sintered at 1100°C. ........... 73
Figure 3.14: FTIR patterns of CaPs with Ca to P ratio of 1.25 sintered at 1300°C. ............ 76
Figure 3.15: FTIR patterns of CaPs with Ca to P ratio of 1.50 sintered at 1100°C. ............ 77
Figure 3.16: FTIR patterns of CaPs with Ca to P ratio of 1.50 sintered at 1300°C. ............ 80
Figure 3.17: FTIR patterns of CaPs with Ca to P ratio of 1.67 sintered at 1100°C. ............ 85
Figure 3.18: FTIR patterns of CaPs with Ca to P ratio of 1.67 sintered at 1300°C. ............ 86
Figure 3.19: FTIR patterns of CaPs with Ca to P ratio of 2.0 sintered at 1100°C. .............. 89
Figure 3.20: FTIR patterns of CaPs with Ca to P ratio of 2.0 sintered at 1300°C. .............. 90
Figure 3.21: SEM images of CaPs with Ca to P ratio of 1.0 sintered at 1100°C. ................ 93
Figure 3.22: SEM images of CaPs with Ca to P ratio of 1.0 sintered at 1300°C. ................ 94
Figure 3.23: SEM images of CaPs with Ca to P ratio of 1.25 sintered at 1100°C. .............. 96
Figure 3.24: SEM images of CaPs with Ca to P ratio of 1.25 sintered at 1300°C. .............. 97
Figure 3.25: SEM images of CaPs with Ca to P ratio 1.50 sintered at 1100°C. ................ 100
Figure 3.26: SEM images of CaPs with Ca to P ratio of 1.50 sintered at 1300°C. ............ 101
Figure 3.27: SEM images of CaPs with Ca to P ratio of 1.67 sintered at 1100°C. ............ 102
Figure 3.28: SEM images of CaPs with Ca to P ratio of 1.67 sintered at 1300°C. ............ 103
Figure 3.29: SEM images of CaPs with Ca to P ratio of 2.0 sintered at 1100°C. .............. 105
Figure 3.30: SEM images of CaPs with Ca to P ratio of 2.0 sintered at 1300°C. .............. 106

xvi
LIST OF ABBREVIATIONS
ACP : Amorphous Calcium Phosphate
DCPD : Dicalcium phosphate dihydrate
FA : Fluorapatite
FHA : Fluoridated Hydroxyapatite
FTIR : Fourier Transfer Infrared Spectroscopy
HA : Hydroxyapatite
RT : Room Temperature
SEM : Scanning Electron Microscopy
TTCP : Tetracalcium phosphate
α-TCP : α-Tricalcium phosphate
β-TCP : β-Tricalcium phosphate
XRD : X-Ray Diffraction
HLB : Hydrophile–lipophile balance
FGM : Functionally-graded biomaterial
1
CHAPTER 1
1
2 INTRODUCTION
1.1 Bone
Bone is the most consequential biological tissue for mechanical support, protection and
locomotion of a human and composed of complex and excellently organized hard living
tissues. They function as to move, support, and protect the various organs of the body and
to produce red and white blood cells and store minerals. Basic functions of the bone are
summarized in Table 1.1.
Table 1.1: The basic functions of the bone (adapted from [1]).
Mechanical Support Maintain points of attachment for most skeletal
muscles and build up the softer tissues.
Protection Contribute as mechanical protection for many of the
body’s internal organs.
Supporting in Movement
Skeletal muscles are attached to bones when the
associated muscles contract they cause bones to
move.
Storage of Minerals
Calcium (Ca) and phosphorus (P) stored in the bone
tissues. These minerals are released when required into
the blood which is simplifying the balance of minerals
in the body.
Production of Blood Cells Blood cells are produced in the red bone marrow.
2
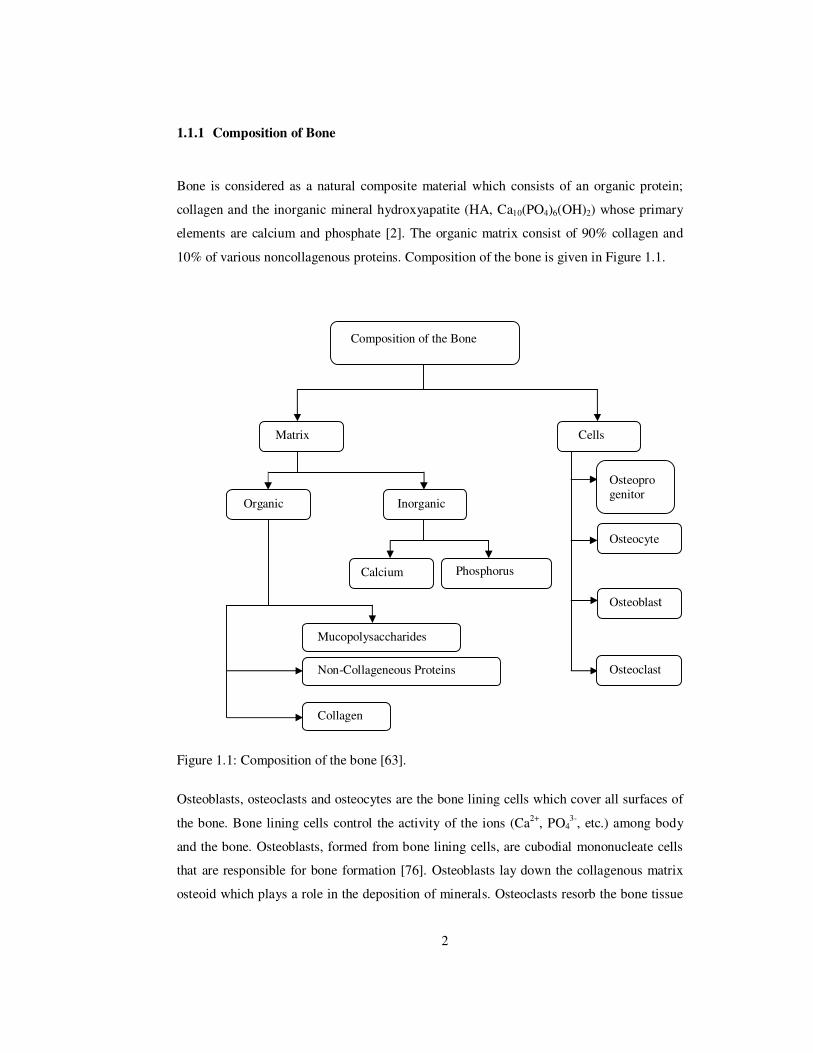
1.1.1 Composition of Bone
Bone is considered as a natural composite material which consists of an organic protein;
collagen and the inorganic mineral hydroxyapatite (HA, Ca10(PO4)6(OH)2) whose primary
elements are calcium and phosphate [2]. The organic matrix consist of 90% collagen and
10% of various noncollagenous proteins. Composition of the bone is given in Figure 1.1.
Figure 1.1: Composition of the bone [63].
Osteoblasts, osteoclasts and osteocytes are the bone lining cells which cover all surfaces of
the bone. Bone lining cells control the activity of the ions (Ca2+, PO43-, etc.) among body
and the bone. Osteoblasts, formed from bone lining cells, are cubodial mononucleate cells
that are responsible for bone formation [76]. Osteoblasts lay down the collagenous matrix
osteoid which plays a role in the deposition of minerals. Osteoclasts resorb the bone tissue
Composition of the Bone
Matrix Cells
Organic
Inorganic
Calcium
Phosphorus
Mucopolysaccharides Non-Collageneous Proteins
Collagen
Osteoprogenitor
Osteocyte
Osteoblast
Osteoclast
3
by removing its mineralized matrix and breaking up the organic bone. Osteoclasts resorb
bone by secreting H+ and acids for matrix dissolution and enzymes for degradation of the
matrix. Osteoclasts and osteoblasts are instrumental in controlling the amount of bone
tissue. Osteocytes derived from osteoblasts function as bone maintaining cells. Osteocyte
occupies a small chamber called lacuna which is used for exchange of nutrients and waste.
The osteocyte is capable of bone deposition, resorption, formation, and matrix maintenance
and calcium homeostasis. Osteocytes transmit the signals to other osteocytes in response to
bone remodeling an even slight deformation of bone is caused by muscular activity [77].
Bones have different shapes according to their locations and functions throughout the body
as seen in Table 1.2.
4
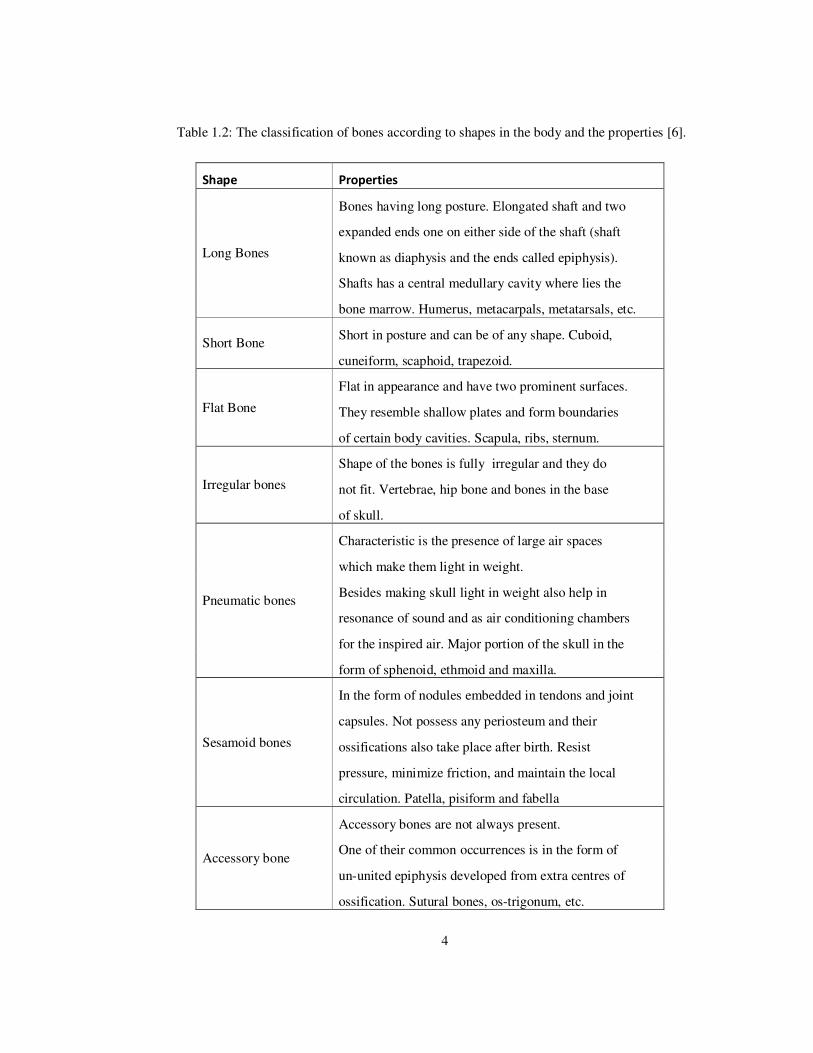
Table 1.2: The classification of bones according to shapes in the body and the properties [6].
Shape Properties
Long Bones
Bones having long posture. Elongated shaft and two
expanded ends one on either side of the shaft (shaft
known as diaphysis and the ends called epiphysis).
Shafts has a central medullary cavity where lies the
bone marrow. Humerus, metacarpals, metatarsals, etc.
Short Bone Short in posture and can be of any shape. Cuboid,
cuneiform, scaphoid, trapezoid.
Flat Bone
Flat in appearance and have two prominent surfaces.
They resemble shallow plates and form boundaries
of certain body cavities. Scapula, ribs, sternum.
Irregular bones
Shape of the bones is fully irregular and they do
not fit. Vertebrae, hip bone and bones in the base
of skull.
Pneumatic bones
Characteristic is the presence of large air spaces
which make them light in weight.
Besides making skull light in weight also help in
resonance of sound and as air conditioning chambers
for the inspired air. Major portion of the skull in the
form of sphenoid, ethmoid and maxilla.
Sesamoid bones
In the form of nodules embedded in tendons and joint
capsules. Not possess any periosteum and their
ossifications also take place after birth. Resist
pressure, minimize friction, and maintain the local
circulation. Patella, pisiform and fabella
Accessory bone
Accessory bones are not always present.
One of their common occurrences is in the form of
un-united epiphysis developed from extra centres of
ossification. Sutural bones, os-trigonum, etc.
5
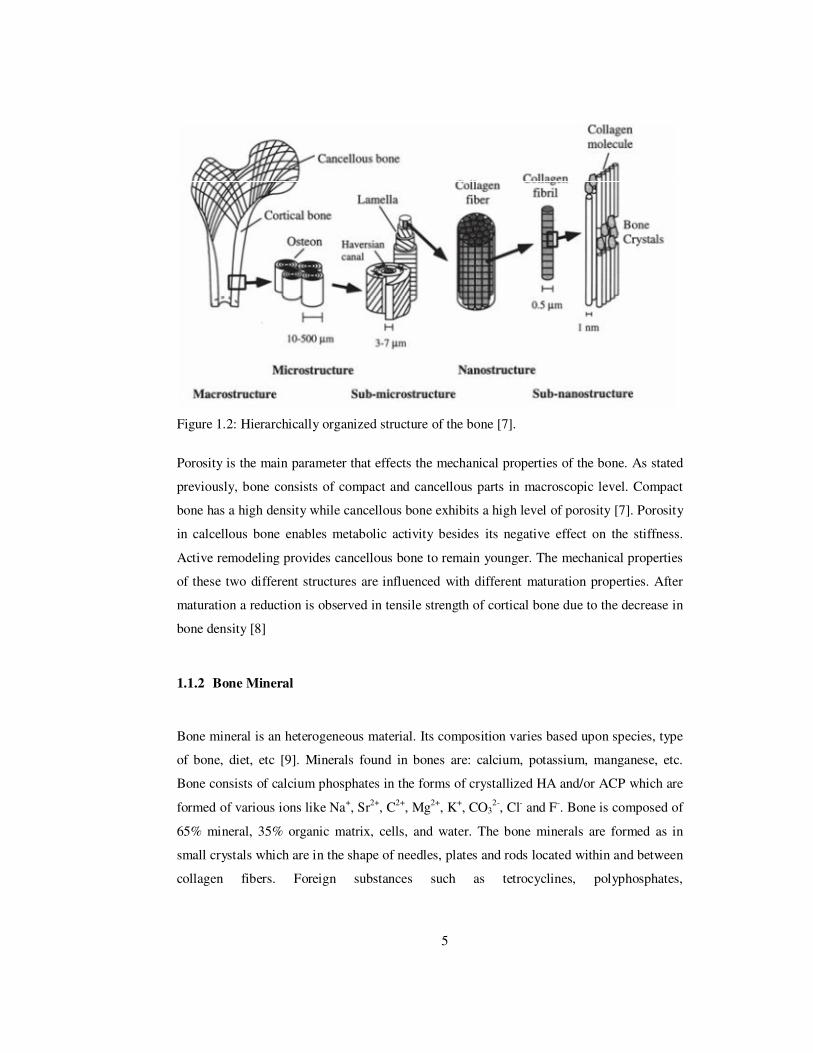
Figure 1.2: Hierarchically organized structure of the bone [7].
Porosity is the main parameter that effects the mechanical properties of the bone. As stated
previously, bone consists of compact and cancellous parts in macroscopic level. Compact
bone has a high density while cancellous bone exhibits a high level of porosity [7]. Porosity
in calcellous bone enables metabolic activity besides its negative effect on the stiffness.
Active remodeling provides cancellous bone to remain younger. The mechanical properties
of these two different structures are influenced with different maturation properties. After
maturation a reduction is observed in tensile strength of cortical bone due to the decrease in
bone density [8]
1.1.2 Bone Mineral
Bone mineral is an heterogeneous material. Its composition varies based upon species, type
of bone, diet, etc [9]. Minerals found in bones are: calcium, potassium, manganese, etc.
Bone consists of calcium phosphates in the forms of crystallized HA and/or ACP which are
formed of various ions like Na+, Sr2+, C2+, Mg2+, K+, CO32-, Cl- and F-. Bone is composed of
65% mineral, 35% organic matrix, cells, and water. The bone minerals are formed as in
small crystals which are in the shape of needles, plates and rods located within and between
collagen fibers. Foreign substances such as tetrocyclines, polyphosphates,

6
bispphosphonates and bone-seeking radionuclides can also be incorporated with high
affinity [10]. Bone chemical composition is shown in chemical formula:
Ca8.3□0.7(PO4)4.3(HPO4 and CO3)1.7 ×(2OH and CO3)0.15□1.7 (1.1)
In which □ represents a vacancy. With maturation, the bone crystal get close, but never
reaches, to the perfect HA structure [9].
The organic matrix produced by osteoblasts is composed of 90% collagen and 10% of
various noncollagenous proteins [11]. The mechanical properties and the ability to regulate
mineral ion homeostasis are implemented with the mineral component. The collagen type 1
fibrils whose function is to create an inorganic/organic composite structure, store the bone
mineral which consists of thiny HA crystals [12]. Bone mineral growth and proliferation
are controlled by the spatial limitation of the collagen fibers and by the absorption of matrix
proteins [11]. The osteoblasts store the triphelical collagen molecule into the extra cellular
space and fibrils produced with self-assembling process with dimensions of 300 nm length
and 1.5 nm thickness. The mineral particles nucleated with a 67 nm periodicity in the
collagen matrix is given in Figure 1.3.
7
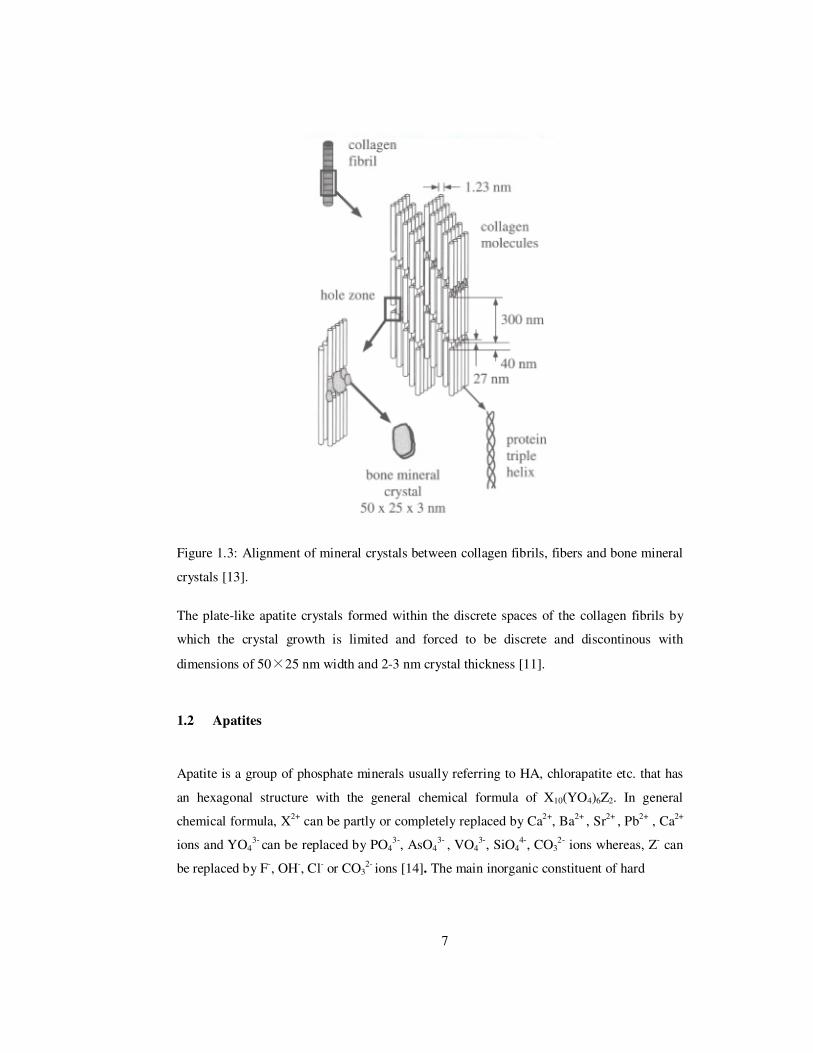
Figure 1.3: Alignment of mineral crystals between collagen fibrils, fibers and bone mineral
crystals [13].
The plate-like apatite crystals formed within the discrete spaces of the collagen fibrils by
which the crystal growth is limited and forced to be discrete and discontinous with
dimensions of 50×25 nm width and 2-3 nm crystal thickness [11].
1.2 Apatites
Apatite is a group of phosphate minerals usually referring to HA, chlorapatite etc. that has
an hexagonal structure with the general chemical formula of X10(YO4)6Z2. In general
chemical formula, X2+ can be partly or completely replaced by Ca2+, Ba2+ , Sr2+ , Pb2+ , Ca2+
ions and YO43-
can be replaced by PO43-, AsO4
3- , VO43-, SiO4
4-, CO32- ions whereas, Z- can
be replaced by F-, OH-, Cl- or CO32- ions [14]. The main inorganic constituent of hard

8
tissues of animal and human is known as apatite [15]. The biological apatites, in the form of
needle or plate, are spreaded all around the organic matrix (see Figure 1.4).
Figure 1.4: Setting of carbonate HA and collagen molecules [15].
Biological apatities are nonstochiometric with vacant frame sites. Lowering of the
symmetry and/or a small variance from the hexagonal structure is resulted from the lattice
substitutions [16]. The structure of biological apatite is poorly crystalline because of the
existence of the carbonate ions. Carbonate ions are known to have a considerable effect on
the growth of the apatite crystals in solution; resulting in smaller crystals or even distorted
products [16]. Ca/P ratios of dentine, enamel and bone and their composition of the
inorganic components are given in Table 1.3.

9
Table 1.3: Composition of the dentine, enamel and bone given by weight % [17].
Component Dentin Enamel Bone
Ca 40.3 37.6 36.6
P 18.6 18.3 17.1
CO32- 4.8 3 4.8
Na 0.1 0.7 1
K 0.07 0.05 0.07
Mg 1.1 0.2 0.6
Sr 0.04 0.03 0.05
Cl 0.27 0.4 0.1
F 0.07 0.01 0.1
Ca/P (molar) 1.67 1.59 1.65
From Table 1.3, it can be concluded that;
• Stochiometric Ca to P ratio of 1.67 is significantly higher than that ratio of enamel
• In bone and dentin the Mg quantity is higher than that in enamel and twice as much
in the dentin compared to the bone.
• CO32- amount of dentin and bone are same but higher than that of enamel.
It is concluded that when PO43- is replaced by CO3
2- in human enamel, the Ca/P ratio is
completely different than that in pure HA [18]. HA is the most used CaP in biomedical
applications because of its similarity to the mineral part of the bone.
1.2.1 Calcium Phosphates
Calcium phosphates (CaP) are the minerals involving calcium ions (Ca2+) with
orthophosphates (PO43-) and frequently hydrogen or hydroxide ions. CaPs are used
frequently in medical applications due to their high biocompatibility in the human body.
Different CaPs are used for different biomedical applications, depending on the bioactivity

10
or resorption rates of the material. CaPs are used in hard tissue repair for a long time
because of their similar inorganic form with the hard tissues. Many studies revealed that
CaP biomaterials (HA, TCP and HA / TCP composite) and CaP-based biomaterials (CaP
apatite-coated metals, calcium carbonate apatite and bioglass ceramics) are biocompatible
and osteoconductive. When these materials are implanted in vivo, the results showed non-
toxic, antigenically inactive, not inducing cancer and bonding directly to bone without any
intervening connective tissue layer [19]. However, mechanical properties of CaPs are poor
against to heavy loads due to their brittle nature.
HA and TCP are the most crucial CaPs due to superior biocompatibility of HA and its slow
dissolution rate in the body and high resorption rate of TCP. Toth et al. revealed that bone
formation in dogs induced by HA/TCP, α-CPP, and β-CPP (CPP: calcium pyrophosphate)
[20]. Yang et al. revealed that HA / TCP phosphate ceramic-induced osteogenesis in dogs
[21]. Yuan et al. showed that β-TCP ceramic and CaP cement can induce bone formation in
soft tissues of dogs [22]. The coincident cases of CaP biomaterial induced osteogenesis
represent the possibility to develop CaP biomaterials with fundamental osteoinductive
property. Yuan et al. demonstrated that the osteoinduction of CaP biomaterials is material
dependent [22]. The micropores on the macropore walls of the materials are important for
osteoinduction. The material dependent properties of CaP-induced osteogenesis strongly
suggest the possibility to develop CaP-based biomaterials with intrinsic osteoinductive
property [19]
1.2.1.1 Calcium Phosphate Types
CaP ceramics have excellent osteoconductivity, bioactivity and ability to form strong bone–
CaP interface. CaPs, especially HA and β-TCP, have been widely studied and used as bone
substitute materials because of their similar molecular composition to bone [23]. There are
many kinds of CaPs whose bioactivity and osteoconductivity are different [16]. CaPs can
be found in the form of composites containing H2PO4-, HPO4
2-, and PO43- ions [16].
The properties of CaPs can be characterized according to their Ca/P ratio in their structures.
11
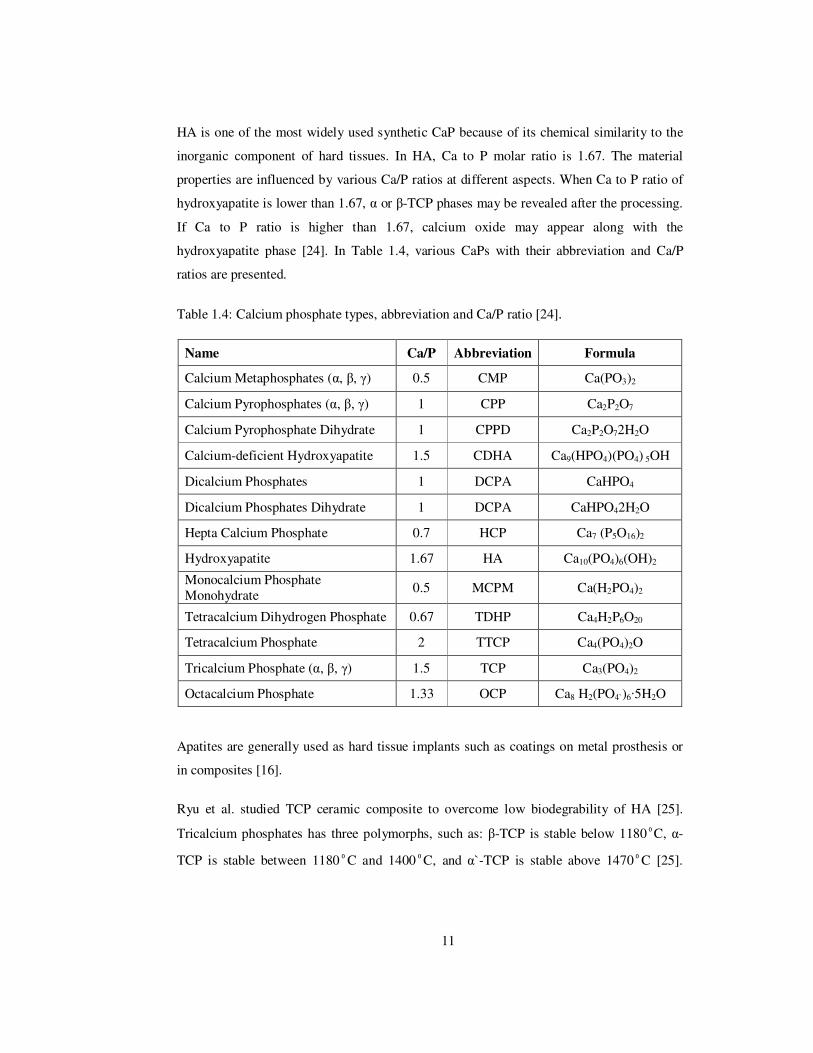
HA is one of the most widely used synthetic CaP because of its chemical similarity to the
inorganic component of hard tissues. In HA, Ca to P molar ratio is 1.67. The material
properties are influenced by various Ca/P ratios at different aspects. When Ca to P ratio of
hydroxyapatite is lower than 1.67, α or β-TCP phases may be revealed after the processing.
If Ca to P ratio is higher than 1.67, calcium oxide may appear along with the
hydroxyapatite phase [24]. In Table 1.4, various CaPs with their abbreviation and Ca/P
ratios are presented.
Table 1.4: Calcium phosphate types, abbreviation and Ca/P ratio [24].
Name Ca/P Abbreviation Formula
Calcium Metaphosphates (α, β, γ) 0.5 CMP Ca(PO3)2
Calcium Pyrophosphates (α, β, γ) 1 CPP Ca2P2O7
Calcium Pyrophosphate Dihydrate 1 CPPD Ca2P2O72H2O
Calcium-deficient Hydroxyapatite 1.5 CDHA Ca9(HPO4)(PO4) 5OH
Dicalcium Phosphates 1 DCPA CaHPO4
Dicalcium Phosphates Dihydrate 1 DCPA CaHPO42H2O
Hepta Calcium Phosphate 0.7 HCP Ca7 (P5O16)2
Hydroxyapatite 1.67 HA Ca10(PO4)6(OH)2
Monocalcium Phosphate Monohydrate 0.5 MCPM Ca(H2PO4)2
Tetracalcium Dihydrogen Phosphate 0.67 TDHP Ca4H2P6O20
Tetracalcium Phosphate 2 TTCP Ca4(PO4)2O
Tricalcium Phosphate (α, β, γ) 1.5 TCP Ca3(PO4)2
Octacalcium Phosphate 1.33 OCP Ca8 H2(PO4`)6·5H2O
Apatites are generally used as hard tissue implants such as coatings on metal prosthesis or
in composites [16].
Ryu et al. studied TCP ceramic composite to overcome low biodegrability of HA [25].
Tricalcium phosphates has three polymorphs, such as: β-TCP is stable below 1180ºC, α-
TCP is stable between 1180ºC and 1400ºC, and α`-TCP is stable above 1470ºC [25].
12
Among the three allotropic forms, β-TCP is preferred as a bioceramic on account of its
chemical stability, mechanical strength, and proper bioresorption rate [25].
Tetracalcium phosphate is the only CaP phase with Ca to P ratio greater than stoichiometric
hydroxyapatite. Different from other calcium orthophosphates such as hydroxyapatite or
monetite, which are widely used as food ingredients, in tooth pastes, in pharmaceutical
applications or in chromatography, phase-pure tetracalcium phosphate has found
application only as a bioceramic [26]. Tetracalcium phosphate is an essential component of
low-temperature setting inorganic biocements. Neverthless, it is a metastable compound
and various reaction routes are used to obtain phase-pure material in monolithic or
particulate form [26]. Chow et al. demonstrated that TTCP/DCPA bioceramics can be
hardened satisfactory and developed reasonable strengths when the TTCP/DCPA molar
ratio was as low as 0.5 [27].
Amorphous calcium phosphate (ACP) is an intermediate phase in the preparation of several
CaPs. Amorphous calcium phosphate is easily converted into poorly crystalline apatite
analogous to bone mineral crystals. ACP used in plasma sprayed coatings on metal
prostheses and injectable cements for orthopedic applications as a commercial substitute
bone materials involved in the transient or constitutive phase. Amorphous calcium
phosphate is also used in dental applications such as filler or colloidal suspension in
toothpaste to promote demineralization [28].
For biomedical applications, sintered dicalcium pyrophosphate (SDCP) seems to be
biocompatible to bone tissue in vivo animal model. Sintered dicalcium pyrophosphate has
been demonstrated to be more biocompatible than HA in vitro model. Research with
ovariectomized rats revealed that ingestion of either bisphosphonate or SDCP lessen the
bone porosity and raise the bone mineral contents in the long bones [23]. Later works
showed that Sintered dicalcium pyrophosphate can lead to apoptosis of osteoclasts in an
ultrastructural model characterized by changes of the nucleus accompanied by degradation
of cellular organelles [29]. Sun et al. showed that increased concentration of calcium and
pyrophosphate ions can activate genes of the bone cells [29].
13
Dicalcium phosphates dehydrate (DCPD) is the major component of hard tissues like bone,
teeth and used as a medicine for calcium supply. The crystallization of DCPD was obtained
mainly by gel method [31].
Synthetic octacalcium phosphate (OCP) is used as a bone substitute material in various
forms like coating on metallic implants and granules [31]. OCP is proposed to be a
precursor of biological apatite crystals in bones and teeth. Transformation of synthetic OCP
to HA has been studied in various physiological environments like body fluid and ultra
filtered human serum, and by murine tissue implantation. The apatite converted from OCP
under in vitro physiological conditions was a Ca-deficient HA, which has a chemical
composition with a lower Ca/P molar ratio and higher acid phosphate content. Suzuki et al.
revealed that the implantation of OCP markedly enhanced bone formation compared to the
implantation of hydrolyzed Ca-deficient HA from OCP [31]. Osteoblastic cell proliferation
and the differentiations were also simplified on OCP in vitro. Also Suzuki et al. confirmed
that OCP as a bone substitute material increases the bone regeneration [31].
1.3 Hydroxyapatite
HA is the major component and an essential material of bone and teeth. HA forms the bone
mineral and matrix of teeth. It has been widely used among various biocompatible materials
in orthopedic applications because of its superior biocompatibility, bioactivity and
similarity of its chemical resemblance to natural hard tissues [24]. HA is one of the few
bioactive materials which support the bone growth and osseointegration when it is used in
orthopedic, dental and maxillofacial applications. Mechanical properties of bone and HA
are different in terms of their strength, hardness and toughness. Discrepancy limits its
applications in load bearing areas [32]. Non-load bearing areas like middle ear, replacement
for tooth roots places where HA has been frequently used. The physical, chemical, and
biological properties of HA are controlled by its crystal structure (given in Figure 1.5) and
composition. Insertion of Ca2+ with other metal ions into the HA structure improves the
properties of HA, metal ions such as Ag+, Cu2+, Zn2+ in the HA structure can affect its
crystallinity, morphology, lattice parameters, stability and antibacterial property [33].
14
Figure 1.5: Crystal structure of HA a) c-axis b) off-axis c) with some atoms removed [119].
Muralithran and Ramesh demonstrated that the sintering temperature of HA is a critical
factor influencing its phase stability, densification behavior, microstructure and hardness
[34]. The optimum sintering temperature of HA was found to be 1250ºC. A decrease in
density was observed at lower temperature (<1250ºC) sintering. The stability of HA phase
in the sintered body was found to be dependent on the sintering temperature.
Decomposition occurred above 1320ºC. There is a correlation between hardness and grain
size. Decomposition of HA is detrimental to its sinterability, densification and hardness
[34].
1.3.1 Synthesis Methods of HA
HA is a potential material for various biomedical applications which can be produced by
different synthesis methods and techniques. Techniques to prepare HA are classified in

15
three groups: wet, dry and hydrothermal processes [35]. Benefits of the wet processes are
that the secondary product is almost water and the probability of contamination during
processing is very low. The drawbacks are that with little difference in the reaction
conditions in which the composition of the resulting product is affected sorely and the time
needed for producing HA takes many days [36]. Wet method is very complicated and needs
a special attention to control the Ca/P ratio as well as the crystallinity. Various methods
have been employed to prepare the nano-sized HA, including precipation, hydrothermal,
sol-gel, crystal conversion and microwave techniques.
1.3.1.1 Solid State Sintering Process of HA
Solid state reaction is a simple and cheap method to synthesize HA. In the solid-state-
reaction process, the samples were prepared by mixing the inorganic components in the
presence of acetone or water [37]. The inorganic component mixture is then milled,
compacted under pressure and sintered at a high temperature [37]. In solid state sintering
method, milling is important because the amount of absorbed water is critically dependent
on it and also milling influences the surface area of the powders [35]. The risk of
contamination in the product is induced with milling. Another parameter in solid state
sintering process is heat treatment. According to the results, HA produced by solid state
sintering process reveals good biocompatibility and mechanical properties [35]. Also single
phase of HA could be produced only in the powder milled in water [35]. As a result of low
cost solid state sintering process a large amount of high crystalline HA can be obtained
economically [35]. However, the powders synthesized by this method usually have
irregular forms and large grain sizes.
Pramanik et al. synthesized HA by low cost solid-state sintering method [37]. After the
sintering at 380, 600, and 1063ºC, the material demonstrated structural phase transitions.
Moreover, presence of α-TCP was observed after the sintering at 1250ºC. Mechanical
properties of HA were improved by an increase in cold compaction pressure during
pelletization. Samples crushed and resintered at 1250ºC demonstrated significant
improvement in the mechanical properties and good biocompatibility. The density of HA
was found to be lower than that of the conventional ceramic materials [37]. The surface
16
hardness of the samples was found to be 15-16 times larger than natural femoral bone and
no change in the sample weight (dry state) was observed [37].
1.3.1.2 Emulsion and Micro-emulsion Techniques of HA
HA powders can be synthesized in bicontinuous micro emulsion, inverse micro emulsion
and emulsion techniques by the reaction of CaCl2 and (NH4)2HPO4 [38]. Different
proportion of cyclohexane surfactant is used during the reactions in order to determine if
the solution acts as an emulsion structure, inverse microemulsion or bicontinuous
microemulsion. As a result, bicontinuous and inverse microemulsion initiate the formation
of much finer HA powders than from the emulsion composition [38].
Jarudilokkul et al. synthesized nanosized HA particles with emulsion liquid membrane
(ELM) method [39]. The synthesized particles were calcium deficient apatite with an
amorphous morphology. The initial Ca/P molar ratio had no effects on the particle sizes.
When reaction temperature was increased, the surface area of prepared particles decreased
resulting in an increase in particle size, transformation of HA particles to β-TCP [39].
Microemulsion processing techniques are used to prepare nanoparticles of metals,
superconductors and bioceramics. Koumoulidis et al. applied the pH-shock wave method
using an emulsion technique to produce phosphate particles, with a grain size of 40-120 nm
[40]. Samples consist of mesoporosity with a narrow pore size and maximum pore
diameters between 292 and 350 Å. After a heating at 650ºC, the solid is crystallized in
particles of similar size and shape, with no internal porosity. Significant amount of β-TCP
was observed after the calcination at 900ºC [40].
Yang et al. synthesized luminescent Eu3+ doped HA particles with high purity and
crystallinity under mild reaction conditions with microwave assisted microemulsion
process [41]. pH of the solution affects the morphologies and the particle size of the final
products [41].
Guo et al. synthesized nanosized HA particles with a reverse microemulsion technique [42].
HA particles produced with microemulsion route compared with conventional precipation
17
method had a smaller size and less particle agglomeration. HA particle diameter and length
were increased with the increase of HLB (hydrophile–lipophile balance) values [42].
1.3.1.3 Hydrothermal Reactions of HA
Hydrothermal method is often used to prepare HA with good crystallinity and
homogeneous size and shapes, which can be achieved at low temperatures. In hydrothermal
reactions in order to synthesize HA, calcium hydrogen phosphate dehydrate (CaHPO4
·2H2O) and calcium carbonate (CaCO3) or Ca(OH)2 powders were mixed in a high speed
agitator [43]. The molar ratio of CaHPO4·2H2O to Ca (OH)2 was 3:7 [14] also mixture in
another work prepared at a Ca/P ratio of 1.67 [43]. After hydrolyzation, the aggregates
were filtered and rinsed in the de-ionized water. Subsequently the synthetic products were
dried and grounded. Finally the powders with different Ca/P ratios hydrolysis were
annealed at different temperatures [43]. In another study HA powders with good
crystallinity, sinterability, high strength and biocompatibility were produced with heating
the powders of Ca(OH)2 and Ca(H2PO4)·2H2O with distilled water in a pressurized pot [14].
The drawback of this method is small amounts can be produced in the laboratory, limited
commercial use and moderately expensive.
Zhang and Vecchio synthesized HA rods with the hydrothermal reaction of DCPA and
cuttlebone powder or CaCO3 from 120°C to 180°C for different durations [44]. The
synthesis is observed to be a nucleation-growth process. The nucleation and growth of HA
rods mainly occurred on DCPA particles. Because of the low stability of DCPA and calcite,
the concentration of calcium and phosphate ions in the solution was low [44]. So HA can
grow slowly and preferably along c-axis and form hexagonal shape in hydrothermal
conditions. β- TCP as calcite nucleated and grew on the surface of calcite particles at the
beginning of the reaction. When the reaction time was increased, formation of β- TCP
slowed down. HA with lower solubility, grew larger into rod-shape particles on DCPA with
the depletion of the starting materials. A small amount of β-TCP was produced as a side
product. Synthesized large HA rods have potential applications for protein purification in
liquid chromatography [44].
18
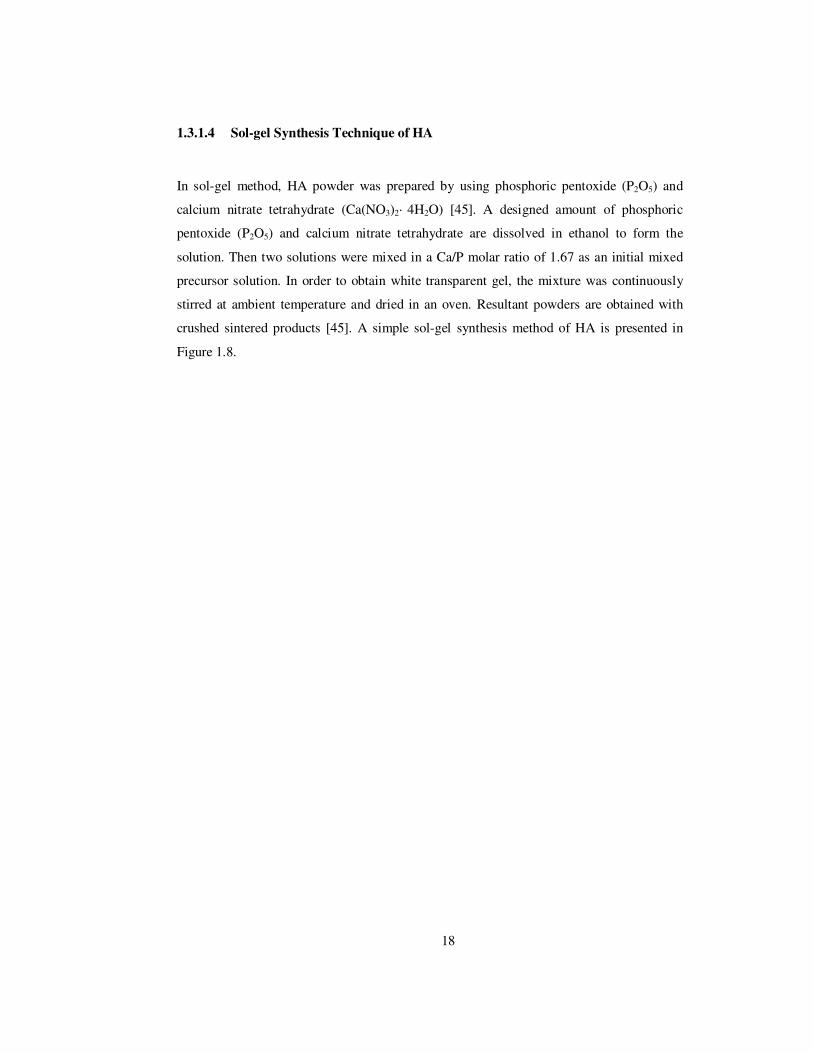
1.3.1.4 Sol-gel Synthesis Technique of HA
In sol-gel method, HA powder was prepared by using phosphoric pentoxide (P2O5) and
calcium nitrate tetrahydrate (Ca(NO3)2· 4H2O) [45]. A designed amount of phosphoric
pentoxide (P2O5) and calcium nitrate tetrahydrate are dissolved in ethanol to form the
solution. Then two solutions were mixed in a Ca/P molar ratio of 1.67 as an initial mixed
precursor solution. In order to obtain white transparent gel, the mixture was continuously
stirred at ambient temperature and dried in an oven. Resultant powders are obtained with
crushed sintered products [45]. A simple sol-gel synthesis method of HA is presented in
Figure 1.8.

19
Figure 1.6: Experimental procedure of the sol-gel synthesis of HA powders [45].
Sintering temperature and time determine the crystallinity degree, morphology and the
particle size of HA obtained by the sol-gel synthesis technique [45]. Controlling the grain
size and morphology with sintering temperature, sol-gel synthesis of HA is similar to other
HA production methods [45]. As a drawback during drying, cracks might occur due to the
capillary forces. Some studies about sol-gel synthesis methods and the outcomes are
summarized below.
Padmanabhan et al. synthesized HA nanorods of 70-90 nm diameter and 400-500 nm length.
The pH during synthesis was 9 [46]. With increasing the temperature, the crystallite size of
the HA nanoparticles increased. At 700ºC, anisotropic crystal elongation was emerged.
P2O5+C2H5OH Ca(NO3)2·4H2O
+ C2H5OH
Mixing
Gelation
Aging
Drying
Sintering
Crushing
HA Powders
20
With increasing the temperature, the crystallinity of the powders was also increased. HA
nanorods with an aspect ratio value between 6 and 7 were obtained. Final calcined product
was pure HA. Rietveld analysis demonstrated high purity and hexagonal structure of
calcined HA, demonstrate hexagonal structure [46].
Liu et al. produced HA ceramics with sol-gel route using triethyl phosphate and calcium
nitrate as phosphorous and calcium precursors [47]. Water and anhydrous ethanol were
used as diluting environment for HA sol preparation. The sols were stable and no gelling
was occurred in surrounding environment over 5 days. After the solvent was removed from
the solution at 60°C, it became a white gel. When calcination temperature was increased,
the crystal size and the HA content in both gels increased. The microstructure and
crystallinity of the resulting HA ceramic were not affected with the initial diluting media.
After ethanol-based sol dip-coating onto a Ti4+ substrate, and calcination at 450°C, resulted
in porous coating with pore size ranging from 0.3 to 1µm [47].
1.3.1.5 Precipitation Method of HA
Precipitation is one of the most used techniques in order to prepare HA powders. In this
method, HA compounds are prepared with calcium nitrate tetra hydrate and di-ammonium
hydrogen phosphate ((NH4)2HPO4) as the starting materials and ammonia solution as pH
adjustment agent [48]. A suspension of Ca(NO3)2·4H2O with distilled water and di-
ammonium hydrogen phosphate with distilled water was prepared. The solutions were
stirred and the temperature was maintained at 25°C. A solution of di-ammonium hydrogen
phosphate in distilled water solution is added drop wise to the calcium nitrate tetra hydrate.
The pH of the Ca(NO3)2·4H2O solution is adjusted to be 11 [48]. Afterwards the
precipitated HA is removed by centrifugation method. The obtained HA is then dried and
calcined. It has been observed that with increasing the temperature grain, size of the
product increased. As a result the grain size of HA can be controlled by a precipitation
method and nano-sized crystals can be obtained by applying a heat treatment at a suitable
temperature. In biomedical applications, nano-sized HA crystals are significant due to their
increased bioactivity and osseointegration [48]. Consequently, precipitation method is
significant in order to synthesize HA especially used in biomedical area. A study about
precipitation method and its outcomes are summarized below.
21
Cengiz et al. synthesized HA using CaPTris solution as a calcium phosphate medium by
precipitation method [49]. The synthesized crystallites range from 15.88 to 16.12 nm. The
(d002/d300) ratio was found as 0.99 for the particles. The length and the width of the
particles were found to be less than 500 and 100 nm. Composition of the product produced
from CaPTris (1.58) is closer to that of the ideal HA (1.67) [49].
Among all these methods the precipitation method is a simple and low cost process in
industrial applications. HA prepared by precipitation method also has the feature of small
size, low crystallinity and high surface activity, which can meet different demands.
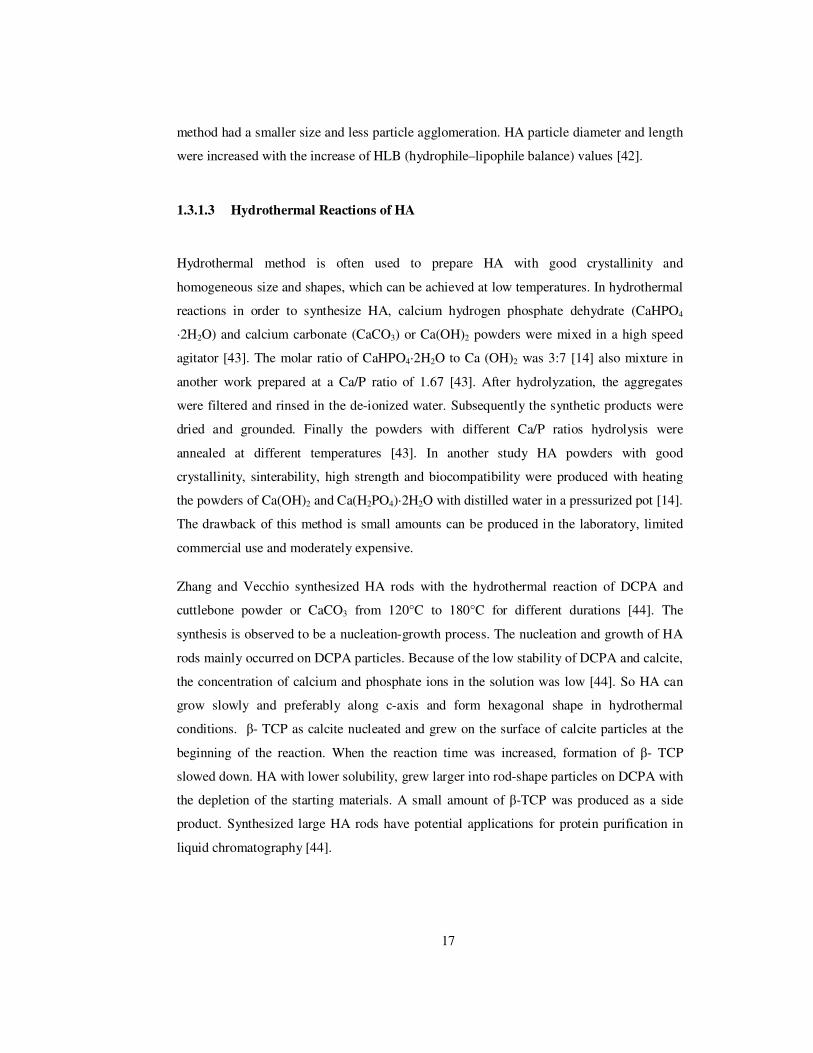
1.3.2 Microstructure and Phase Transformations of HA
The structure of HA is hexagonal which belongs to the space group P63/m. This is defined
by a six fold c-axis perpendicular to three a-axes (a1, a2, a3) whose angles are 120° [50]. In
HA structure four of the ten Ca atoms intercept Ca (Ι) position and the remaining six
calcium atoms occupy the Ca (Π) position. In the structure the OH groups are located at the
corners of the unit cells (Figure 1.9) [52]. Network is made up of (PO43-) group constituting
the skeletal stability in the HA structure in which from level z = 0.25 to z = 0.75 of six
(PO43-) groups constituting form a helical formation.
Figure 1.7: Ca (Ι) and Ca (Π) atoms in the microstructure of HA [52].
22
Phase transformation is generally happened during sintering of HA in which,
decomposition of HA to secondary phases like TCP and TTCP occurs at high temperatures
[53]. Phase transformation of HA is seen in different synthesis methods such that in solid
state reaction, the newly formed phases are β-Ca2P2O7, CaP(HPO4)(PO4)5OH, β-TCP and
α-TCP at temperatures of 500°C, 800°C and 1250°C, respectively. Similarly in micro
emulsion synthesis method, β-TCP is formed at 1200°C [35]. Likewise with sol-gel
synthesis method β-TCP and CaO formed above 800°C [36]. Finally with precipitation
method β-TCP was formed at above 1300°C [37].
In hydrothermal synthesis of HA, thermal decomposition occurs in two steps during
sintering: dehydroxylation and decomposition. At temperatures around 850-900°C, HA
dehydroxylaties to oxyhydroxyapatite [54]:
Ca10(PO4)6(OH)2→Ca10(PO4)6(OH)2-2xOx+xH2Ogas (1.2)
The decomposition of HA to TCP and TTCP occurs at above 900°C.
Ca10(PO4)6(OH)2 → 2Ca3(PO4)2 + Ca4P2O9 + H2Ogas (1.3)
Another factor causing the phase transformation besides sintering temperature is the
calcium deficiency of the synthetic apatite [34]. Deviation from the Ca/P ratio which is 1.67
would probably result in formation of new phases [24]. The rate of the dehydroxylation and
decomposition reactions depends on the humidity in the furnace because of existence of
water vapor which resulted in a slow decomposition rate by preventing the dehydration of
the OH group. Sintering temperature, atmosphere and Ca/P ratio of HA are important
factors contributing to phase transformations. Furthermore, formation of second phases
during the sintering can be suppressed by controlling the moisture content in the sintering
environment. Also addition of the sintering additives into HA can control the presence of
second phases [54].
1.3.3 Biological Properties of HA
In biomaterials research HA takes the particular attention because of its biocompatibility
and bioactivity characteristics. HA is the ideal phase for an application inside the human
23
body because it is a thermodynamically stable material to be used in physiological pH,
temperature and composition [55]. HA is crystallographically similar to natural bone
mineral which represents the bone growth on the material [56]. For the bioactivity,
consequential parameters of HA are the cell behaviors like adhesion, proliferation and
morphology. In a research morphology and resorption activity of osteoclast-like cells on
conventional and nanophase HA and alumina were examined [57]. The cellular activity of
the osteoclast like cells was arranged by the synthesis of tartrate resistant acid phopshatase
(TRAP) and the resorption pits formed on material surfaces by the cells. During 13-day
time period, TRAP synthesis was the highest on conventional and nanophase of HA. For
the formation of resorption pits, both conventional and nanophase HA exhibited a similar
behavior to the bone reference material, however a higher resoption activity was observed
on nanophase HA. As a result higher osteoclast-like cell function was observed on
nanophase HA compared to conventional HA, this is consequent of increased roughness,
higher surface wettability and the improved solubility of nanophase HA [57]. In a different
study, osteoblast functions including on HA were investigated; proliferation, alkaline
phosphatase synthesis and extracellular matrix calcium concentration on HA ceramics [58].
Resultant osteoblast cell functions were greater on nanophase HA with longer cell culture
periods compared to conventional HA. As a result for these two studies, nanophase HA
offers improved biological properties by enhanced osteoclast and osteoblast cell activity on
the material [58].
When nano-HA powder was synthesized at room temperature (RT), in vitro experiments
demonstrated that the produced material was biocompatible with osteoblastic-like MG63
cells and possess osteo-conductive properties [59].
With hot pressing technique, HA-based composite reinforced with 40 vol.% Ti particles
were produced [60]. In vivo studies revealed that HA-40 vol.% Ti composite had excellent
biocompatibility and could integrate with bone. There weren`t any fibrous tissues with the
interface between the composite implant and new born bone.
24
1.3.4 Mechanical Properties HA
The applicability of HA is restricted to non-stressed regions of the skeleton because of its
inferior strength and low fracture toughness [37]. HA which is used under load bearing
applications such as artificial joints has been restricted by its low fracture toughness (0.8-
1.2 MPa m1/2) and low flexural strength (<140 MPa) [61]. Also mechanical properties of
HA diminishes because of the decomposition of HA into other phases [61]. Elastic modulus
of HA is much higher than that of natural bone tissues which causes to greater stress
concentration and fracture at the bone and material interface [62].
One additional important parameter that affects the mechanical properties of HA is the
porous structure which provides a network for the growth of bone tissue and accelerates the
replacement of the material by bone tissue [62]. It is observed that porosity affects the
elastic modulus and hardness of HA exponentially [62]. After a sintering at 1200°C,
flexural strength of HA was 120 MPa [35]. In another study, it was found to be between 58
and 80 MPa depending on the pressing geometry and load applied to the powders [63].
Another work revealed that HA nanopowders synthesized with controlled morphology
resulted in rod-shaped particles into spherical nanopowders. The amount of rod-shaped
particles caused a decrease in the micro hardness and an increase in indentation fracture
toughness of the samples. In SEM pictures, an increase in porosity was detected with the
addition of rod-shaped particles. Results demonstrated that the reported mechanical
properties such as increased porosity limits crack propagation and increases indentation
fracture toughness and low micro-hardness values [64]. It can be concluded that while
producing HA some variables must be taken into account in order to obtain optimum
mechanical properties which are mechanical synthesis methods, heat treatment temperature,
porosity, microstructure and stoichiometry of the sample.
1.3.5 Nanophase Hydroxyapatite
HA has been widely used as a biomaterial because of its nano grain size which is more
desirable in clinical applications [66]. Nanocrystalline HA shows improved sinterability
and densification because of its greater surface area, with increase in its mechanical
properties [67].
25
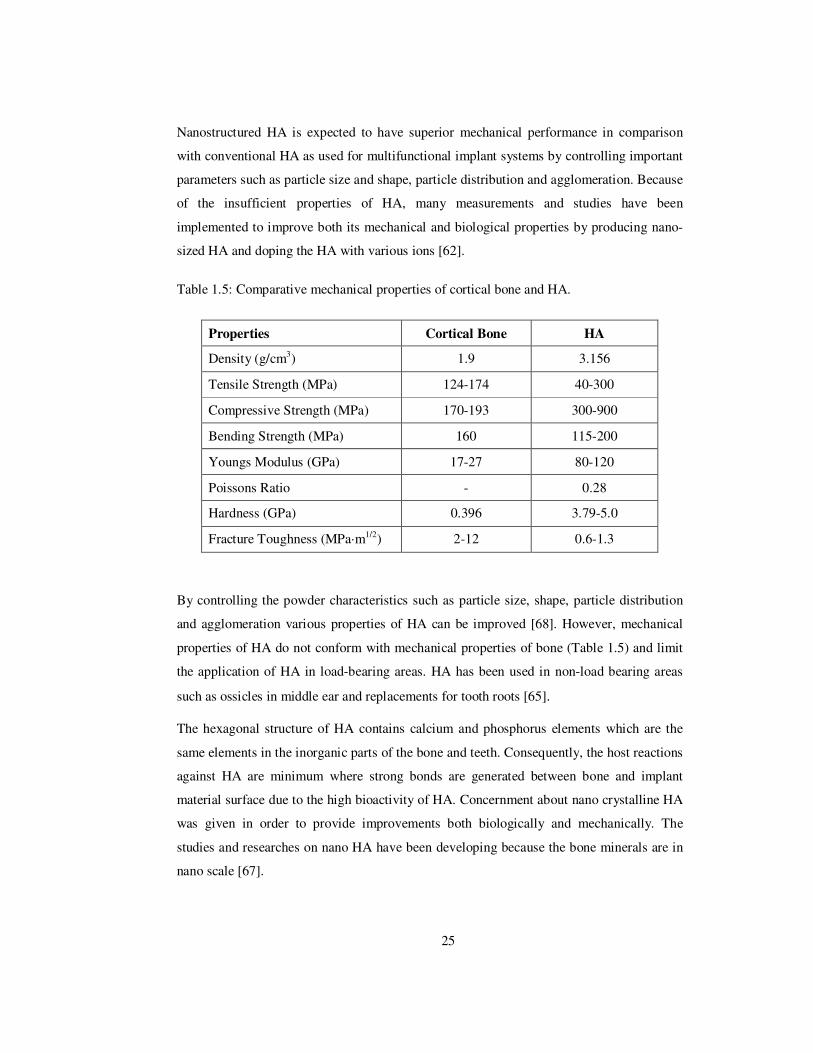
Nanostructured HA is expected to have superior mechanical performance in comparison
with conventional HA as used for multifunctional implant systems by controlling important
parameters such as particle size and shape, particle distribution and agglomeration. Because
of the insufficient properties of HA, many measurements and studies have been
implemented to improve both its mechanical and biological properties by producing nano-
sized HA and doping the HA with various ions [62].
Table 1.5: Comparative mechanical properties of cortical bone and HA.
Properties Cortical Bone HA
Density (g/cm3) 1.9 3.156
Tensile Strength (MPa) 124-174 40-300
Compressive Strength (MPa) 170-193 300-900
Bending Strength (MPa) 160 115-200
Youngs Modulus (GPa) 17-27 80-120
Poissons Ratio - 0.28
Hardness (GPa) 0.396 3.79-5.0
Fracture Toughness (MPa·m1/2) 2-12 0.6-1.3
By controlling the powder characteristics such as particle size, shape, particle distribution
and agglomeration various properties of HA can be improved [68]. However, mechanical
properties of HA do not conform with mechanical properties of bone (Table 1.5) and limit
the application of HA in load-bearing areas. HA has been used in non-load bearing areas
such as ossicles in middle ear and replacements for tooth roots [65].
The hexagonal structure of HA contains calcium and phosphorus elements which are the
same elements in the inorganic parts of the bone and teeth. Consequently, the host reactions
against HA are minimum where strong bonds are generated between bone and implant
material surface due to the high bioactivity of HA. Concernment about nano crystalline HA
was given in order to provide improvements both biologically and mechanically. The
studies and researches on nano HA have been developing because the bone minerals are in
nano scale [67].
26
It has been observed that in order to obtain crystalline HA with a uniform morphology
aging is an important parameter. For aging up to 100 h, samples synthesized by
precipitation method became more stable against decomposition to second phases. Small
crystalline sizes around 50 nm could be produced from the HA powders calcined at 550˚C
which were confirmed by transmission electron microscopy (TEM) and XRD peak
broadening analysis. The aging time and temperature were inspected of some important
parameters such as precursor pH, in order to achieve nano-HA particles with tailored
composition, crystal size, morphology and surface chemistry to optimize their chemical
stability, sinterability and mechanical properties [67]. Resulting effects of these parameters
are summarized in Table 1.6.
1.4 Hydroxyapatite Doped by Titanium
Huang et al. doped two levels of Ti4+ ions into HA by a co-precipitation method [69].
Rietveld refinement analysis revealed that there was a proportional increase in a and c axes
with doping of Ti4+ into HA. Doping of Ti4+ into the HA structure was found to suppress
grain growth without comprising the densification. Surface activity was increased with
increasing the Ti4+ content in HA which reduced the grain size and increased the number of
surface grain boundaries per unit length. Doping of Ti4+ into HA didn’t affect the ability to
bring on bone like apatite formation. This study exposed that 0.8 wt.% of Ti4+ doped HA
have potential for the in biomedical applications, like bioactive scaffolds and coatings on
Ti4+ implants [69].

27
Table 1.6: Parameters in controlling crystal size, morphology chemical stability and
sinterability of HA.
Parameters Resulting Effect
Aging time As increasing; Smaller crystal sizes, more uniform morphology,
reduction in phase decomposition during sintering
Aging temperature
0˚C; Highly non-stochiometric HA, decomposed to coarser
grained β-TCP during sintering. Stochiometric HA,
25˚C; spherical morphology; increased sinterability.
Whisker-like HA particles with preferential growth
80˚C; along the <002> axis
Precursor pH
As increases; Preferential growth along the <002> axis of HA, rod-
like morphology, larger average particle size, non-
stochiometric HA, phase decomposition during sintering.
As decreases; Non-stochiometric HA, phase decomposition during
Sintering
C. Ergun examined the interaction of titanium ions with HA structure [70]. In the different
part of the experiment tetraethyl orthotitanate, HA/CaTiO3 and tri-calcium
phosphate/CaTiO3 were added, respectively. HA doped with titanium ions was produced by
precipitation method. The precipitated materials were dried and sintered in air at various
temperatures for 2h. The result revealed that when Ti4+ was incorporated into the structure,
the lattice parameters got smaller. The grain size of the doped HA was smaller than that of
the pure HA. When the amount of the Ti4+ ions in HA increased, α-TCP and CaTiO3
formed and resulted in an increase in porosity in Ti4+ containing HA [70]. In another work
chemical reactions between HA and titanium were examined [71]. Hot isostatic pressing
was used to bond HA powder to a titanium rod. As a reaction product perovskite (calcium
titanate, CaTiO3) was found on the HA surface [71].
In the crystal structure of HA, one ion can be replaced with another with a minimal effect
on its crystal structure. Ribeiro et al. demonstrated that Ca2+ ions were replaced with Ti4+
ions as seen in Equation 1.4 [9].
28
Ca10 (PO4)6(OH)2+(n/2)Ti4+ → (Ca10-nTi(n/2))(PO4)6(OH)2+ nCa2++(n/2)□ (1.4)
(where □ represents a vacancy).
1.5 Hydroxyapatite Doped by Fluoride
The incorporation of fluorine into the HA matrix enhanced the phase formation and
crystallinity [72]. Thermal stability and biological properties of HA were enhanced with
addition of fluoride ions (F-) which impose the physical and biological characteristics of
HA [73]. In the crystal structure of HA OH- ions and F- ions compete to occupy the same
location. When F- ions partially altered with OH- ions in HA, fluoridated hydroxyapatite
(FHA; Ca5(PO4)3(OH)1-xFx 0≤ x ≤1) is produced. If OH- ions are completely changed with
F- ions, fluorapatite (FA; Ca5 (PO4)3F) is produced [74]. Properties of FHA of low solubility,
high thermal stability and biological potential leads to FHA as a new alternative biomaterial
for bone applications [75].
Excessive amounts of F- ions could raise the number of adverse effects which range from
mild dental fluorosis to crippling skeletal fluorosis (osteomalacia, decreasing osteo-
conductivity) as the level and period of exposure increases [72] and also inhibit the cell
proliferation by releasing Ca+2 ions in HA due to decreased solubility [76]. When high
concentrations of fluoride added into HA led to abnormal tissue growth and poor
mechanical properties but lower fluoride levels improved the mechanical properties of HA,
such as hardness, fracture toughness, elastic modulus and brittleness [77]. Also the termal
stability of HA was improved by adding fluoride ions [78]. Consequently, the optimum
fluoride concentrations in HA for biomaterials applications were reported as 0.033-0.4 mol
F- [76].
In a study the influence of fluoride on the preparation and properties of HA grown in the
same gel medium along with DCPD (dicalcium phosphate dihydrate) crystals were reported.
The formation of HA retarded with the presence of fluoride. The microstructural
morphology of HA changed from fibrous to granular structure and the crystallinity of the
hydroxyapatite increased due to fluoride substituation [72]. Pure HA grown by gel method
decomposed into β-TCP and CaO when sintered at a high temperature. Because of the
fluoride substitution, higher thermal stability of the HA matrix was observed [72].
29
In another study with wet chemical technique, nanocrystalline HA and fluorhydroxyapatite
powder was produced [74]. The thermal stability, mechanical property, solubility and
biocompatibility of the powders were tested. XRD analysis of the calcined powders showed
that all the produced materials were pure [74]. In vitro studies of cell cultures behaviors of
HA were affected when F- content raised cell attachment on HA surface but reduction of
Ca2+ release in culture increased the F- content which inhibitated the cell proliferation [74].
Song et al. [18] showed that F- is very stable in the lattice sites and doping of F- ions
stabilizes the crystal structure of HA because structural energy of F- ions is much lower
than that of other ions [18]. Furthermore, the presence of F- ions has a decreasing effect on
the acid dissolution of HA [16].
1.6 Aim of the Thesis
The purpose of this study is to synthesize calcium phosphates doped with Ti4+ and F- ions
to develop new nanocomposite bioceramics for biomedical applications and to investigate
their microstructures, mechanical and biocompatibility properties. No study has been found
in literature regarding to co-doping of Ti4+ and F- ions into the CaPs. CaPs doped with Ti4+
and F- were synthesized by a precipitation method and sintered from 1100ºC to 1300ºC for
1 h. Composites were characterized by density measurements to determine the effect of
sintering temperature. Presence of phases and bonding properties of the samples were
characterized by X-ray diffraction (XRD) and Fourier transforms infrared spectroscopy
(FTIR). Microstructure and the grain sizes of the samples were investigated by scanning
electron microscopy (SEM). Consequently, microhardness test was applied on the samples
to determine their mechanical properties.
30
CHAPTER 2
3 METHODS
2.1 Materials
In order to synthesize calcium phosphates, the main precursors were calcium nitrate tetra
hydrate (Ca(NO3)2·4H2O) and di-ammonium hydrogen phosphate ((NH4)2HPO4) (Merck,
Germany). In the synthesis of titanium and fluoride doped calcium phosphates and
ammonium fluoride (NH4F) Aldrich, USA and titanium diisopropoxide were used.
Ammonia solution (Merck, Germany) was utilized as to adjust the pH values of the
solution.
2.2 Synthesis of Calcium Phosphates
Nano-calcium phosphate powders were synthesized by a precipation method [48].
Precursors of calcium nitrate tetra hydrate (Ca(NO3)2·4H2O) and di-ammonium hydrogen
phosphate ((NH4)2HPO4) were added into distilled water in order to prepare
Ca(NO3)2·4H2O and (NH4)2HPO4 solutions with a certain molar ratio. The Ca/P ratio was
kept at 1.0, 1.25, 1.50, 1.67 and 2.0. Ammonia was added into the di-ammonium hydrogen
phosphate solution after previous solutions were stirred for 1 h where ammonia solution
was added into both solutions to bring the pH level to 11-12. Ammonia solution, calcium
nitrate solutions and titanium diisopropoxide were added at the same time into the di-
ammonium hydrogen phosphate-ammonia mixture in a drop wise manner after stirring for
10 minutes. After 1 hour stirring the final mixture was heated until boiling in order to
increase the reaction. After boiling, the mixture was left for stirring for 24 h. Later stirring,
the mixture was filtered with a fine filter paper to obtain a wet cake. The wet cake was
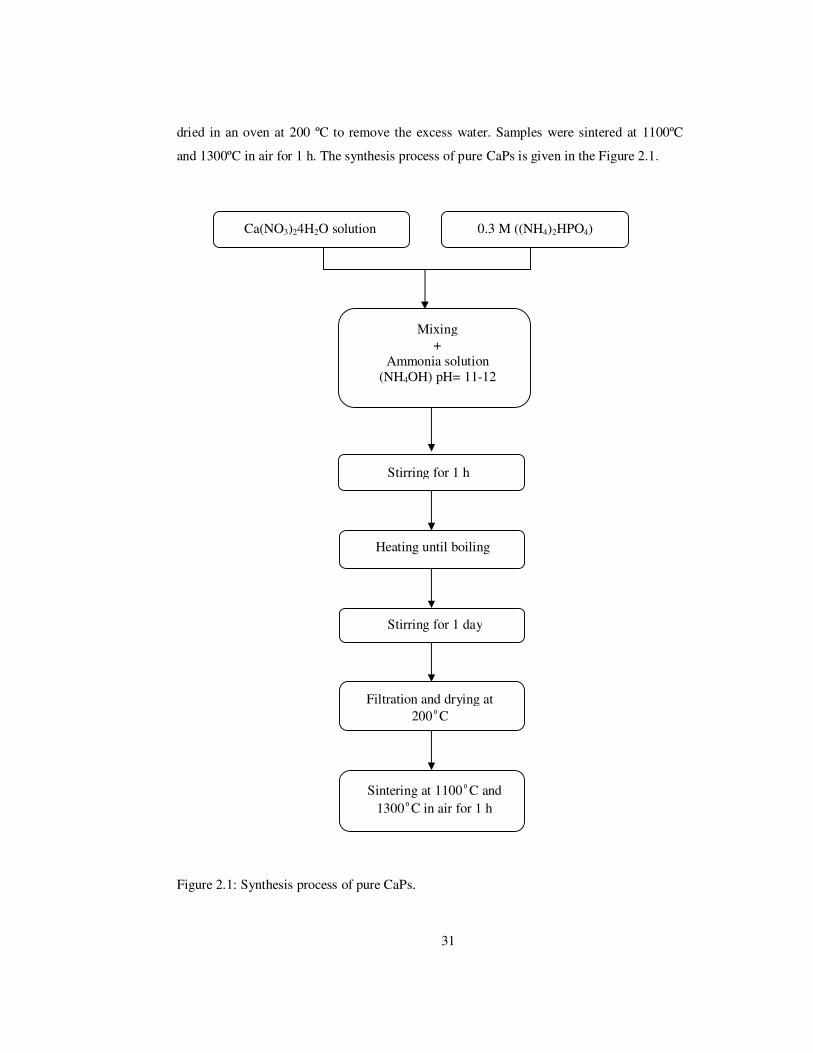
31
dried in an oven at 200 ºC to remove the excess water. Samples were sintered at 1100ºC
and 1300ºC in air for 1 h. The synthesis process of pure CaPs is given in the Figure 2.1.
Figure 2.1: Synthesis process of pure CaPs.
Ca(NO3)24H2O solution 0.3 M ((NH4)2HPO4)
Mixing +
Ammonia solution (NH4OH) pH= 11-12
Stirring for 1 h
Heating until boiling
Stirring for 1 day
Filtration and drying at 200ºC
Sintering at 1100ºC and 1300ºC in air for 1 h
32
2.2.1 Synthesis of Doped Calcium Phosphates
In addition to main precursors used in the synthesis of pure calcium phosphates, titanium
diisopropoxide and ammonium hydroxide were used to obtain titanium and fluoride doped
calcium phosphates. 75 different compositions were prepared. Same synthesis technique
was used for the production of the samples. Additionally, ammonium fluoride and titanium
diisopropoxide were used as F- and Ti4+. The mol. % of the dopants with different Ca/P
molar ratio is given in the Table 2.1. Titanium diisopropoxide was added into calcium
nitrate solution in five different mole compositions: 0%, 0.5%, 1.0%, 2.5% and 5%. The
ammonium fluoride was added into di-ammonium phosphate solution in the compositions
of 0%, 0.5% and 2.5 %. The following formula was used to identify the composition of the
CaPs used in this study: xxCaP yyTi zzF, where xx represents the Ca to P ratio of the
samples: 1.00, 1.25, 1.50, 1.67 and 2.00, respectively. In this formula, yy represents the
mole amount (0.5, 1.0, 2.5) of Ti4+ ions present in the system with respect to 100 moles of
Ca ions present in the system. Zz represents the mole amount (0.5, 2.5) of F- ions per 100
mole of OH- ions in the system.
Table 2.1: List of the synthesis products with Ca/P ratio of 1.0, 1.25, 1.50, 1.67, 2.0.
Sample ID (n = 1.0, 1.25, 1.50, 1.67, 2.0)
nCaP
nCaP0.5Ti
nCaP1.0Ti
nCaP2.5Ti
nCaP5.0Ti
nCaP0.5F
nCaP2.5F
nCaP0.5Ti0.5F
nCaP1.0Ti0.5F
nCaP2.5Ti0.5F
nCaP5.0Ti0.5F
nCaP0.5Ti2.5F
nCaP1.0Ti2.5F
nCaP2.5Ti2.5F
nCaP5.0Ti2.5F

33
The ratios of elements insertion were adjusted according to atomic percentage of precursors.
After mixing the solution, the products were filtered, dried and sintered. The filtered and
dried materials were sintered at temperature of 1100 ºC and 1300 ºC.
2.3 Characterization Methods
2.3.1 Density Measurements
Densities of the sintered materials were derived by Archimedes method [79] :
d = dry weight / (dry weight – wet weight) (2.1)
Theoretical densities of the CaPs are given in Table 2.2.
Table 2.2: Theoretical densities of CaP used in the relative density calculations [16].
Ca/P Theoretical Density (g/cm3)
1 3.090 1.25 2.610 1.5 3.067
1.67 3.156 2 3.100
Five different densities for each sample were obtained to determine its mean density.
2.3.2 X-ray Diffraction
Phases present in the samples were investigated by X-ray diffraction (XRD) method using a
Rigaku DMAX 2200 machine. XRD was performed on the samples with a Cu-Kα radiation
at 40 kV/ 40 mA and samples were scanned from 10º to 80ºin 2θ with a scan speed of %
2.0 min. International Centre For Diffraction Data (ICDD) files were used for comparison
with the positions of diffracted planes taken from XRD results. The amount of phases
present in pure and doped calcium phosphates was calculated by using relative intensity
measurements of diffracted planes.

34
2.3.3 Fourier Transform Infrared Spectroscopy (FTIR)
In order to assess the presence of OH- and F- bonds formed in the structure of calcium
phosphates FTIR spectra were used. The samples were first crushed into the powder form
with the use of ball mill. Ceramic powders were mixed with potassium bromide (KBr) with
a weight ratio of 1 to 300. The obtained powder mixture was then cold pressed in order to
obtain transparent pellets. The spectra were performed from 4000 cm-1 to 400 cm-1 with a
512 scan on FTIR spectrometer (Brukers IFS 66/S; Bruker Optics, Germany).
2.3.4 Scanning Electron Microscopy (SEM)
SEM JEOL JSM-6400 (JEOL Ltd., Japan) analysis was conducted in order to determine the
average grain sizes of the sintered samples. The samples were polished with SiC papers
(Buehler Ltd., USA) with grids from 240 to 1200 grit before examination. Final polishing
was performed with a 1µm monocrystalline diamond suspension (Buehler Ltd., USA).
Grain size and morphology of the prepared samples were determined with SEM (QUANTA
400F Field Emission) at a voltage of 20 kV. Before to the SEM analysis, the samples were
coated with gold.
2.3.5 Mechanical Measurements
2.3.5.1 Vickers Micro-Hardness
Micro-hardness of the samples was acquired by a Vickers micro-hardness tester (HMV-2,
Shimadzu, Japan). The sintered discs embedded into epoxy molds were used to determine
the micro-hardness of the materials. The molds were polished with SiC paper (Buehler Ltd.
USA) in order to obtain a flat surface. A load of 200 g was applied for 20 seconds onto the
surface of the samples. The micro-hardness of the samples was acquired by measuring the
length of the diagonal indent shape, which was formed after the indentation. The formula
for the calculation of µ-hardness is as follows:
HV = 0.001854 P/d2 (2.2)

35
Where:HV: Vickers hardness (GPa), P: Applied load (N) and d: Diagonal indent length
(mm).
36
CHAPTER 3
4
5 RESULTS AND DISCUSSION
3.1 Structural Analysis
3.1.1 Density of the Samples
Densities of CaPs doped with Ti4+ and F- ions sintered at 1100°C and 1300°C are given in
Table 3.1.
According to Table 3.1, when Ca to P ratio was 1.0, higher densities were obtained for most
of the compositions after sintering at 1100°C when compared with 1300°C. Increasing the
amount of Ti4+ ions led to decrease in the density of samples doped with Ti4+ ions after the
sintering at 1100°C. Though, densities of Ti4+ doped samples (1CaP1.0Ti, 1CaP5.0Ti) went
up with increasing the sintering temperature from 1100°C to 1300°C, densities of doped
samples (1CaP0.5Ti, 1CaP2.5Ti) with Ti4+ ions went down with increasing sintering
temperature. Nevertheless, there was no correlation between the density and the Ti4+
content after sintering temperature differ from 1100°C to 1300°C. Increasing the F- ion
amount in the ceramics from 0.5 to 2.5 mol.% led to increase in their density at 1100°C.
However, the opposite case was observed after sintering at 1300°C. In a previous study,
addition of F- ion resulted in less dense materials because the bond that forms between F-
and OH- groups reduces the rate of diffusion regulating the densification [83]. Therefore,
increasing the F- ion substitution decreased the densification [83] similiar as in the samples
sintered at 1300°C. For most of the ceramics doped with Ti4+ and F- ions at same time, their
densities decreased after increasing the sintering temperature from 1100°C to 1300°C.
Therefore, these results demonstrated that co-doped samples were more dense at 1100°C

37
Sam
ple ID
Dens
ity (g
/cm3 ), 1
100°
CDe
nsity
(g/cm
3 ), 130
0°C
n =1.0
n =1.2
5n =
1.50
n =1.6
7n =
2.0n =
1.0n =
1.25
n =1.5
0n =
1.67
n =2.0
nCaP
3.05
2.79
3.04
3.14
3.13
2.86
2.83
2.94
3.12
2.96
nCaP
0.5Ti
2.93
32.9
23.1
2.86
2.85
2.92
2.89
2.91
2.86
nCaP
1.0Ti
2.88
2.99
3.01
3.09
3.08
2.89
2.95
2.85
3.01
3.07
nCaP
2.5Ti
2.87
2.96
2.93
2.98
3.07
2.86
3.03
2.75
2.93
2.98
nCaP
5.0Ti
2.73
2.87
3.06
2.87
3.09
2.92
3.25
2.83
2.75
2.94
nCaP
0.5F
2.86
3.03
2.93
3.09
3.08
2.78
2.88
2.82
3.11
3.04
nCaP
2.5F
2.92
2.95
3.07
3.05
2.97
2.73
2.84
2.93.0
52.9
8
nCaP
0.5Ti
0.5F
2.95
3.03
3.01
2.84
3.22.8
82.7
82.9
3.02
3.1
nCaP
1.0Ti
0.5F
2.85
2.94
32.6
73.0
82.9
62.9
22.8
23.1
53.1
2
nCaP
2.5Ti
0.5F
2.85
2.94
3.02
3.14
3.06
3.03
2.97
2.78
2.91
3.11
nCaP
5.0Ti
0.5F
3.08
2.91
3.01
2.79
3.04
2.82
2.99
2.92
2.86
3.09
nCaP
0.5Ti
2.5F
3.03
2.86
2.98
2.93
3.14
2.92
2.97
2.92.9
83.0
7
nCaP
1.0Ti
2.5F
2.86
2.97
32.9
93
2.81
2.94
2.92
3.09
3.08
nCaP
2.5Ti
2.5F
2.99
2.99
3.03
3.13.0
92.8
93.0
12.8
92.9
33.0
8
nCaP
5.0Ti
2.5F
2.87
2.83
3.08
3.01
3.05
2.64
2.92
2.88
2.84
3.07
than 1300°C. These results indicated that sintered density of the CaPs with a Ca/P ratio of 1,
sintered densities were influenced by the sintering temperature.
For pure 1.25 CaP , increasing the sintering temperature from 1100°C to 1300°C resulted in
an increase in its density. Changing the sintering temperature of the samples (1.25CaP0.5F,
1.25CaP2.5F, 1.25CaP2.5Ti0.5F, 1.25CaP2.5Ti2.5F, 1.25CaP5.0Ti0.5F and
1.25CaP5.0Ti2.5F) from 1100°C to 1300°C showed an increase in their sintered densities.
Tab
le 3
.1: S
inte
red
dens
itie
s of
cal
cium
pho
spha
tes
afte
r th
e si
nter
ing
at 1
100°
C a
nd 1
300°
C f
or 1
h .
38
Although densities of Ti4+ doped samples decreased with increasing the Ti4+ amount from
0.5 to 5.0 mol.% after the sintering at 1100°C, densities of these samples at 1300°C
improved with incresing the Ti4+ content. F- doped samples had smaller densities after
sintering at 1300°C. Ti4+ and F- co-doped samples showed varieties in their densification
behaviours after the sintering at 1100°C and 1300°C. High sintering temperature resulted in
high densities when compared to low sintering temperature for most of the Ti4+ and F- co-
doped samples.
Densities of the CaPs with a Ca to P ratio of 1.5 are presented in Table 3.1. When sintering
temperature was increased from 1100°C to 1300°C, densities of all samples were decreased.
These results indicated that all the samples with Ca/P ratio of 1.5 were denser after
sintering at 1100°C. Increasing the amount of Ti4+ from 0.5 to 5 mol.%, samples had
inconsistent behaviours after sintering at both temperatures. Studies demonstrated that
doping of CaPs with F- ions resulted in a decrease in density because of the reduction of
decomposition rate of the synthesized materials by formation of fluorapatite, which shows
high thermal and chemical stability after the sintering [77]. Different from the study by
Gross et al. [77], increasing the amount of F- ions in the samples resulted in an increase in
their densities after changing the temperature from 1100°C to 1300°C. In 0.5 mol.%F and
2.5 mol.%F co-doped samples, increasing the amount of Ti4+ ions did not contribute too
much difference in their densities. Samples doped with 2.5 mol.%F had high densities after
the sintering at 1100°C when Ti4+ amount increased from 0.5 to 5 mol.%.
For the sample 1.67CaP (pure HA), increasing the sintering temperature from 1100°C to
1300°C resulted in a slight decrease in its density. Increasing the Ti4+ amount from 0.5 to
5.0 mol.% showed a decreasing trend in the density of the materials. In previous studies,
increasing the amount of Ti4+ doping ions in HA changed the density in a decreasing
manner [118]. Moreover, Ergun showed that increasing Ti4+ ion amount in the ceramic
decreased the densities when Ca to P ratio was close to pure HA [70]. In the literature,
Chenglin et al. [84] stated that density of the sintered samples decreases with the increase in
the amount of HA when (HA)–Ti system was developed by an optimized powder
metallurgical process. Moreover, a functionally-graded biomaterial (FGM) of HA and Ti4+
interlayers had low relative densities, which resulted in high amount of porosities in the
FGM’s [84]. As distinct from these results, Huang et al. demonstrated that density of doped
39
samples raised with increasing Ti4+ amount in HA structure which is contradictory to this
study and studies of Chenglin et al. and C. Ergun [69].
In this thesis, when F- ion concentration was increased, density of the F- doped samples
decreased. In another study, increased F- ion amount triggers the thermal stability of HA
[93]. Nevertheless, when the F- ion content was increased up to 57 mole% of OH ions,
porous samples were achieved after sintering at various temperatures which resulted in a
decrease in the density of the samples [93]. Gross et al. demonstrated that as the F- ion
content goes up, the sinterability of the samples goes down [77]. Furthermore, when F- ion
content increased the sintered density and mechanical properties such as hardness, Young’s
Modulus and brittleness of HA decreased at a constant sintering temperature [77]. At high
sintering temperatures, different apatite phases were obtained. Different from these,
fluoridated samples had only HA phase, which means F- ion increases the stability of HA.
As a consequence of increased stability of the phases in the samples, their dissolution rate
decreased and density increased [95]. Former studies revealed that small amount of F- ions
into HA structure increased the density because of the increase in stability and decrease in
dissolution rate [77].
Co-doped samples with Ti4+ and 0.5% F ions had mixed behaviours after the sintering at
1100°C and 1300°C. Increasing the F- amount to 2.5 mol.% in Ti4+ and F- co-doped
samples, resulted in an increase in the densities at 1100°C and a decrease at 1300°C.
In another study, density of Ti4+ doped HAs increased by raising the amount of Ti4+ in the
system [69]. Raising the temperature up to 700°C resulted in a decrease in density due to
loosing of structural water from HA. Afterwards, with increasing temperature, density
showed a continuous increase which can be explained as the volume shrinkage during
sintering [70]. Due to the a study in the literature 1100°C was required for the best sintering
temperature for HA system [85].
According to Table 3.1 for pure 2CaP, increasing the sintering temperature from 1100°C to
1300°C resulted in a decrease in its density. Increasing the Ti4+ amount from 0.5 to 5.0
mol.%, samples had mixed behaviours after the sintering at 1100°C and 1300°C. At two
different sintering temperatures, addition of increased amount of F- ions led to a decrease in
their densities. When Ti4+ ions were added to 0.5 mol.% F doped sample, their densities
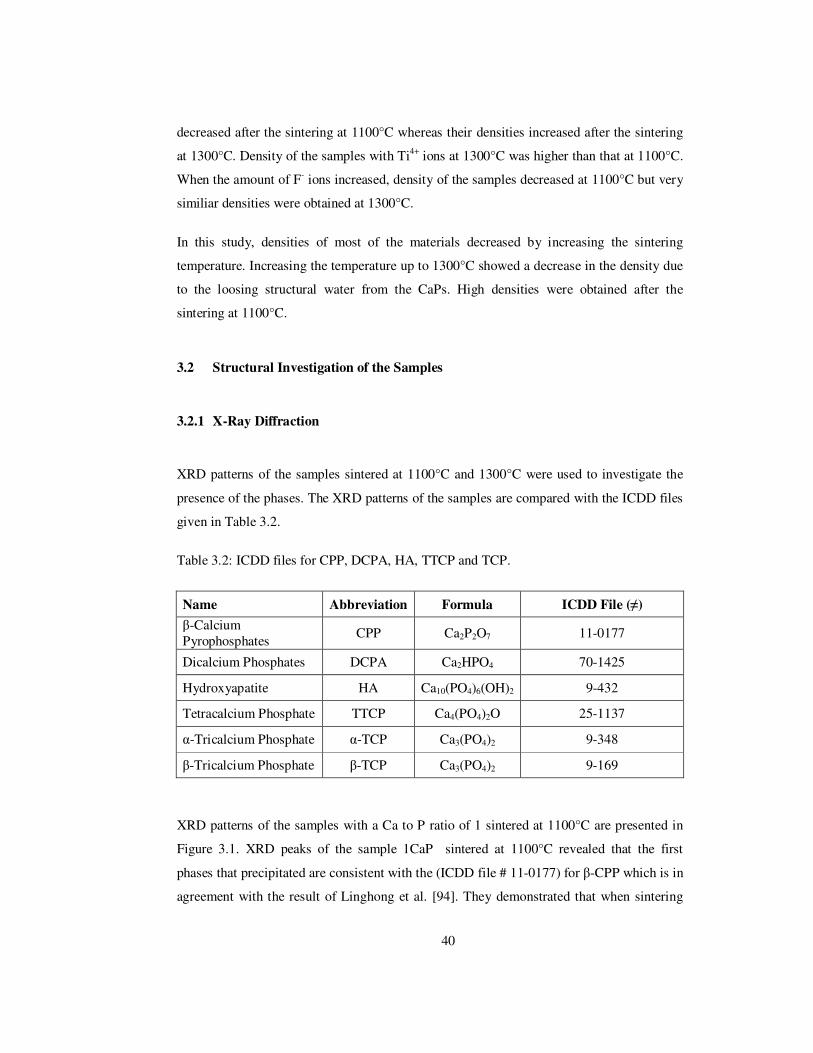
40
decreased after the sintering at 1100°C whereas their densities increased after the sintering
at 1300°C. Density of the samples with Ti4+ ions at 1300°C was higher than that at 1100°C.
When the amount of F- ions increased, density of the samples decreased at 1100°C but very
similiar densities were obtained at 1300°C.
In this study, densities of most of the materials decreased by increasing the sintering
temperature. Increasing the temperature up to 1300°C showed a decrease in the density due
to the loosing structural water from the CaPs. High densities were obtained after the
sintering at 1100°C.
3.2 Structural Investigation of the Samples
3.2.1 X-Ray Diffraction
XRD patterns of the samples sintered at 1100°C and 1300°C were used to investigate the
presence of the phases. The XRD patterns of the samples are compared with the ICDD files
given in Table 3.2.
Table 3.2: ICDD files for CPP, DCPA, HA, TTCP and TCP.
Name Abbreviation Formula ICDD File (≠)
β-Calcium Pyrophosphates
CPP Ca2P2O7 11-0177
Dicalcium Phosphates DCPA Ca2HPO4 70-1425
Hydroxyapatite HA Ca10(PO4)6(OH)2 9-432
Tetracalcium Phosphate TTCP Ca4(PO4)2O 25-1137
α-Tricalcium Phosphate α-TCP Ca3(PO4)2 9-348
β-Tricalcium Phosphate β-TCP Ca3(PO4)2 9-169
XRD patterns of the samples with a Ca to P ratio of 1 sintered at 1100°C are presented in
Figure 3.1. XRD peaks of the sample 1CaP sintered at 1100°C revealed that the first
phases that precipitated are consistent with the (ICDD file # 11-0177) for β-CPP which is in
agreement with the result of Linghong et al. [94]. They demonstrated that when sintering

41
temperature was above 700°C, sintered sample contained only β-CPP which is the most
stable structure.
The characteristic peaks of β-CPP come out in the range of 2θ (27.9, 31.12, 34.48, 47.06,
52.98) for β-CPP compounds. After the sintering at 1100°C, addition of Ti4+ ion in the
samples decreased the β-CPP peak intensities when compared with pure 1CaP. Narrow
peaks of all of the samples show that they were highly crystalline. The XRD patterns of the
co-doped samples with F- ions are compatible with the standard (ICDD file # 11-0177) for
β-CPP. Samples co-doped with Ti4+ and 0.5F ions show that the intensity of the peaks of
the samples increased by increasing the Ti4+ amount. However, as 0.5 mol.%F amount
increased to 2.5 mol.%F, the intensity of the peak decreased. It was previously stated that
addition of F- ions improves the structural stability of the calcium phosphates [93].
However, when the addition amount of F- ion increased to 2.5 mol. %, a decrease in the
intensity of the peaks of the CaP structure was observed in our study. The XRD results
demonstrated that all samples sintered at 1100°C showed a single-phase CPP.
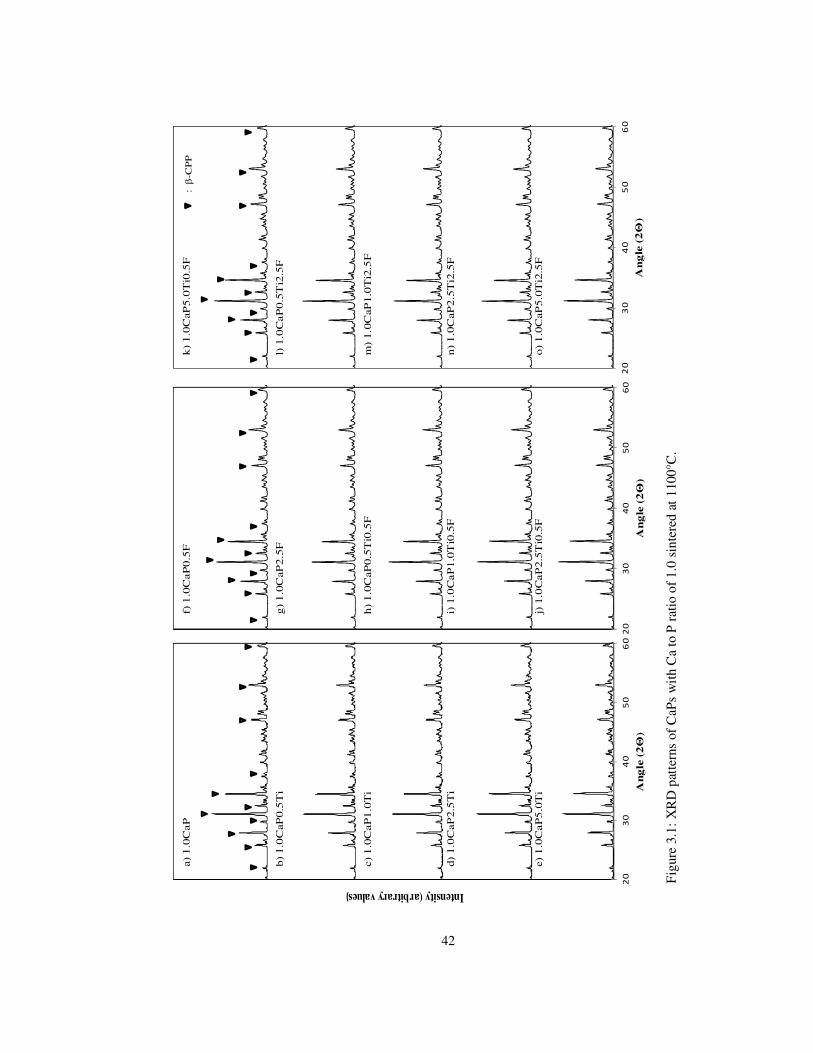
42
20
30
40
50
60
Intensity (arbitrary values)
An
gle
(2Θ
)
20
30
40
50
60
An
gle
(2Θ
)
20
30
40
50
60
An
gle
(2Θ
)
a) 1
.0C
aP
b)
1.0
CaP
0.5
Ti
c) 1
.0C
aP
1.0
Ti
d)
1.0
CaP
2.5
Ti
e) 1
.0C
aP
5.0
Ti
f) 1
.0C
aP
0.5
F
g)
1.0
CaP
2.5
F
h)
1.0
CaP
0.5
Ti0
.5F
i) 1
.0C
aP
1.0
Ti0
.5F
j) 1
.0C
aP
2.5
Ti0
.5F
k)
1.0
CaP
5.0
Ti0
.5F
l) 1
.0C
aP
0.5
Ti2
.5F
m)
1.0
CaP
1.0
Ti2
.5F
n)
1.0
CaP
2.5
Ti2
.5F
o)
1.0
CaP
5.0
Ti2
.5F
: β
-CP
P
Fig
ure
3.1:
XR
D p
atte
rns
of C
aPs
wit
h C
a to
P r
atio
of 1
.0 s
inte
red
at 1
100°
C.
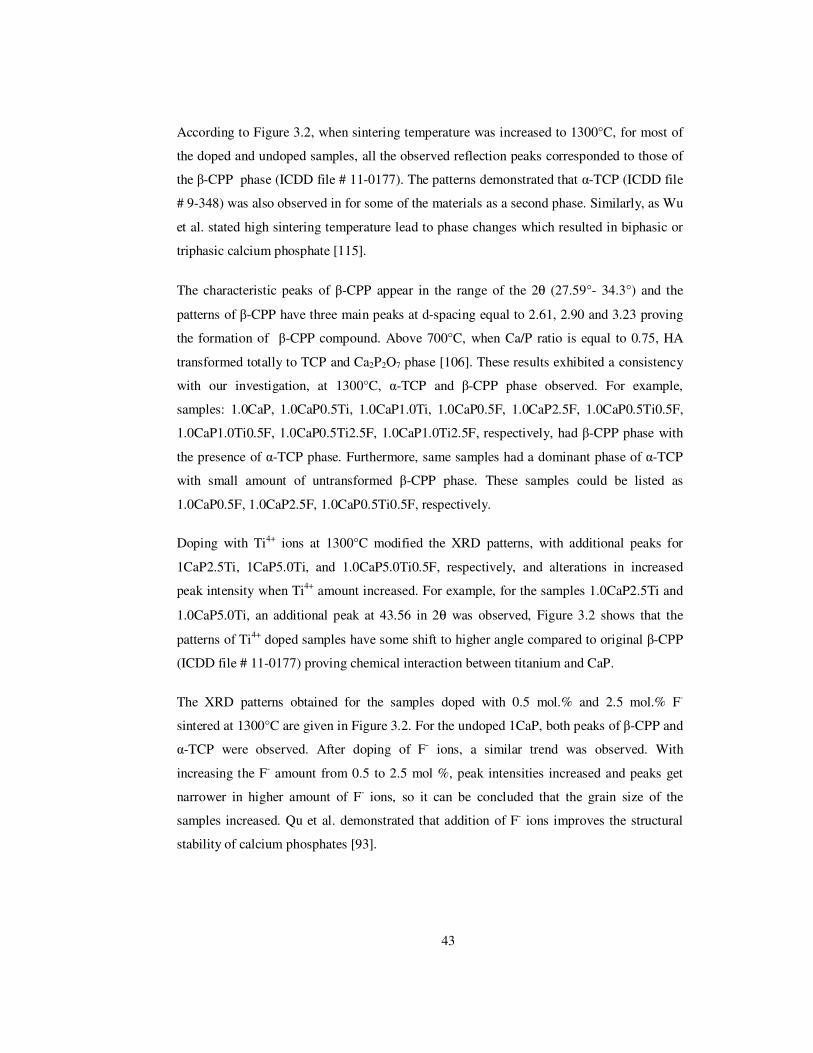
43
According to Figure 3.2, when sintering temperature was increased to 1300°C, for most of
the doped and undoped samples, all the observed reflection peaks corresponded to those of
the β-CPP phase (ICDD file # 11-0177). The patterns demonstrated that α-TCP (ICDD file
# 9-348) was also observed in for some of the materials as a second phase. Similarly, as Wu
et al. stated high sintering temperature lead to phase changes which resulted in biphasic or
triphasic calcium phosphate [115].
The characteristic peaks of β-CPP appear in the range of the 2θ (27.59°- 34.3°) and the
patterns of β-CPP have three main peaks at d-spacing equal to 2.61, 2.90 and 3.23 proving
the formation of β-CPP compound. Above 700°C, when Ca/P ratio is equal to 0.75, HA
transformed totally to TCP and Ca2P2O7 phase [106]. These results exhibited a consistency
with our investigation, at 1300°C, α-TCP and β-CPP phase observed. For example,
samples: 1.0CaP, 1.0CaP0.5Ti, 1.0CaP1.0Ti, 1.0CaP0.5F, 1.0CaP2.5F, 1.0CaP0.5Ti0.5F,
1.0CaP1.0Ti0.5F, 1.0CaP0.5Ti2.5F, 1.0CaP1.0Ti2.5F, respectively, had β-CPP phase with
the presence of α-TCP phase. Furthermore, same samples had a dominant phase of α-TCP
with small amount of untransformed β-CPP phase. These samples could be listed as
1.0CaP0.5F, 1.0CaP2.5F, 1.0CaP0.5Ti0.5F, respectively.
Doping with Ti4+ ions at 1300°C modified the XRD patterns, with additional peaks for
1CaP2.5Ti, 1CaP5.0Ti, and 1.0CaP5.0Ti0.5F, respectively, and alterations in increased
peak intensity when Ti4+ amount increased. For example, for the samples 1.0CaP2.5Ti and
1.0CaP5.0Ti, an additional peak at 43.56 in 2θ was observed, Figure 3.2 shows that the
patterns of Ti4+ doped samples have some shift to higher angle compared to original β-CPP
(ICDD file # 11-0177) proving chemical interaction between titanium and CaP.
The XRD patterns obtained for the samples doped with 0.5 mol.% and 2.5 mol.% F-
sintered at 1300°C are given in Figure 3.2. For the undoped 1CaP, both peaks of β-CPP and
α-TCP were observed. After doping of F- ions, a similar trend was observed. With
increasing the F- amount from 0.5 to 2.5 mol %, peak intensities increased and peaks get
narrower in higher amount of F- ions, so it can be concluded that the grain size of the
samples increased. Qu et al. demonstrated that addition of F- ions improves the structural
stability of calcium phosphates [93].
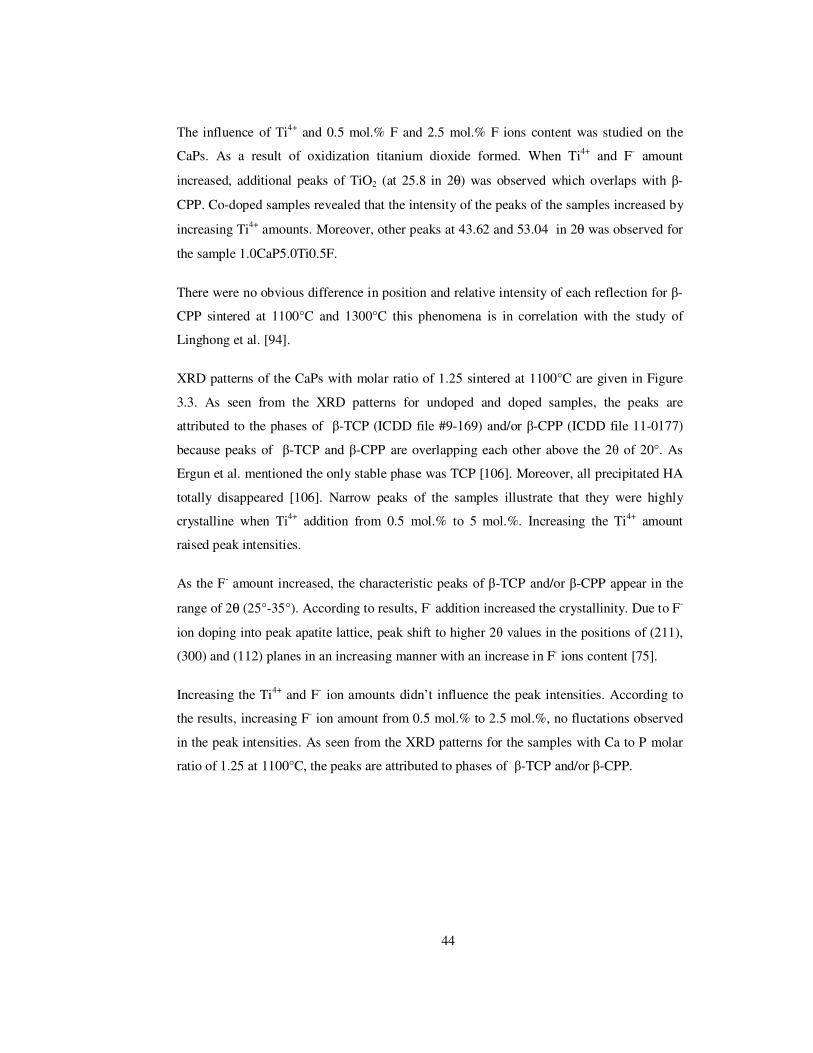
44
The influence of Ti4+ and 0.5 mol.% F and 2.5 mol.% F ions content was studied on the
CaPs. As a result of oxidization titanium dioxide formed. When Ti4+ and F- amount
increased, additional peaks of TiO2 (at 25.8 in 2θ) was observed which overlaps with β-
CPP. Co-doped samples revealed that the intensity of the peaks of the samples increased by
increasing Ti4+ amounts. Moreover, other peaks at 43.62 and 53.04 in 2θ was observed for
the sample 1.0CaP5.0Ti0.5F.
There were no obvious difference in position and relative intensity of each reflection for β-
CPP sintered at 1100°C and 1300°C this phenomena is in correlation with the study of
Linghong et al. [94].
XRD patterns of the CaPs with molar ratio of 1.25 sintered at 1100°C are given in Figure
3.3. As seen from the XRD patterns for undoped and doped samples, the peaks are
attributed to the phases of β-TCP (ICDD file #9-169) and/or β-CPP (ICDD file 11-0177)
because peaks of β-TCP and β-CPP are overlapping each other above the 2θ of 20°. As
Ergun et al. mentioned the only stable phase was TCP [106]. Moreover, all precipitated HA
totally disappeared [106]. Narrow peaks of the samples illustrate that they were highly
crystalline when Ti4+ addition from 0.5 mol.% to 5 mol.%. Increasing the Ti4+ amount
raised peak intensities.
As the F- amount increased, the characteristic peaks of β-TCP and/or β-CPP appear in the
range of 2θ (25°-35°). According to results, F- addition increased the crystallinity. Due to F-
ion doping into peak apatite lattice, peak shift to higher 2θ values in the positions of (211),
(300) and (112) planes in an increasing manner with an increase in F- ions content [75].
Increasing the Ti4+ and F- ion amounts didn’t influence the peak intensities. According to
the results, increasing F- ion amount from 0.5 mol.% to 2.5 mol.%, no fluctations observed
in the peak intensities. As seen from the XRD patterns for the samples with Ca to P molar
ratio of 1.25 at 1100°C, the peaks are attributed to phases of β-TCP and/or β-CPP.

45
20
30
40
50
60
Intensity (arbitrary values)
An
gle
(2Θ
)
a) 1
.0C
aP
b)
1.0
CaP
0.5
Ti
c) 1
.0C
aP1.0
Ti
d)
1.0
CaP
2.5
Ti
e) 1
.0C
aP5.0
Ti
20
30
40
50
60
An
gle
(2Θ
)
f) 1
.0C
aP
0.5
F
g)
1.0
CaP
2.5
F
h)
1.0
CaP
0.5
Ti0
.5F
i) 1
.0C
aP1.0
Ti0
.5F
j) 1
.0C
aP2.5
Ti0
.5F
20
30
40
50
60
An
gle
(2Θ
)
o)
1.0
CaP
5.0
Ti2
.5F
n)
1.0
CaP
2.5
Ti2
.5F
m)
1.0
CaP
1.0
Ti2
.5F
l) 1
.0C
aP0.5
Ti2
.5F
k)
1.0
CaP
5.0
Ti0
.5F
: β
-CP
P: α
-TC
P: T
iO2
Fig
ure
3.2:
XR
D p
atte
rns
of C
aPs
wit
h C
a to
P r
atio
of 1
.0 s
inte
red
at 1
300°
C.
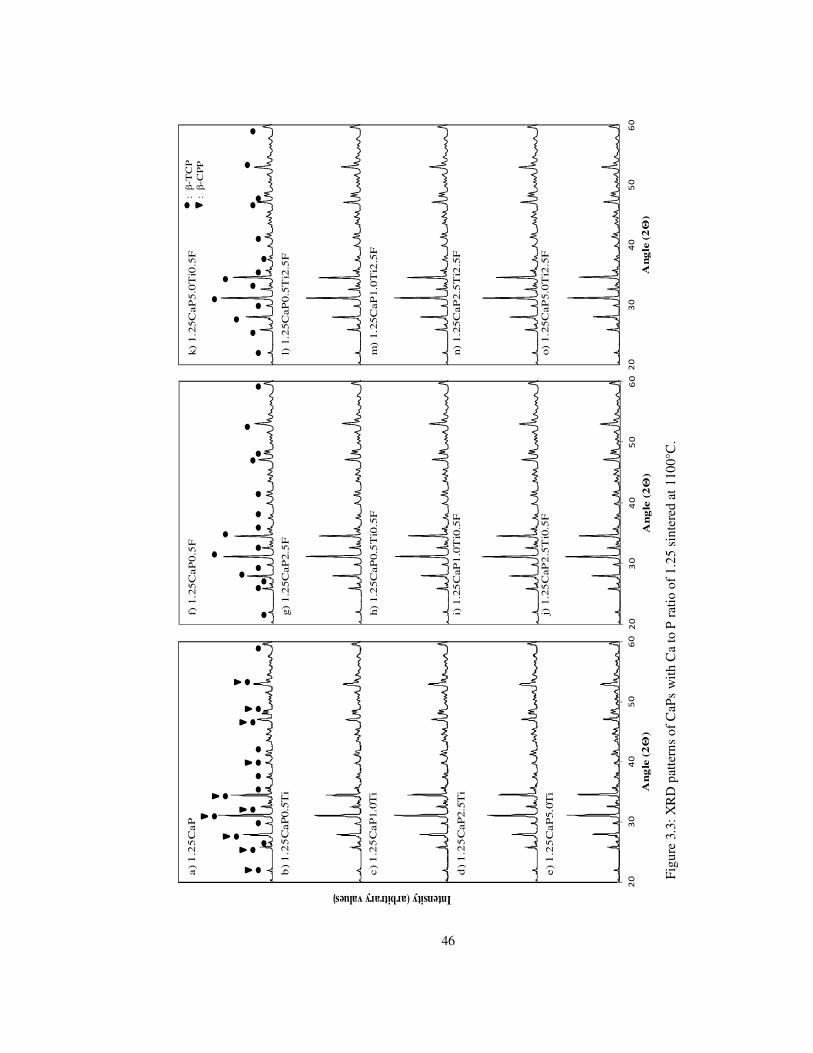
46
20
30
40
50
60
Intensity (arbitrary values)
An
gle
(2Θ
)
e)
1.2
5C
aP
5.0T
i
a)
1.2
5C
aP
b)
1.2
5C
aP0.5
Ti
c)
1.2
5C
aP
1.0T
i
d)
1.2
5C
aP2.5
Ti
20
30
40
50
60
An
gle
(2Θ
)
j) 1
.25
CaP
2.5
Ti0
.5F
i) 1
.25
CaP
1.0
Ti0
.5F
h)
1.2
5C
aP
0.5
Ti0
.5F
g)
1.2
5C
aP
2.5
F
f) 1
.25C
aP
0.5
F
20
30
40
50
60
An
gle
(2Θ
)
k)
1.2
5C
aP
5.0
Ti0
.5F
l) 1
.25C
aP
0.5
Ti2
.5F
m)
1.2
5C
aP
1.0
Ti2
.5F
n)
1.2
5C
aP
2.5
Ti2
.5F
o)
1.2
5C
aP
5.0
Ti2
.5F
: β
-TC
P: β
-CP
P
Figu
re 3
.3: X
RD
pat
tern
s of
CaP
s w
ith C
a to
P r
atio
of 1
.25
sint
ered
at 1
100°
C.
47
XRD spectrums of CaPs with a Ca/P molar ratio of 1.25, sintered at 1300°C are given in
Figure 3.4. As seen from the XRD patterns of the doped and undoped samples peaks are
attributed to β-TCP (ICDD file #9-169) and/or β-CPP (ICDD file # 11-0177). As a third
phase α-TCP (ICDD file #9-348) was also observed in for some of the samples. These
results exhibited a consistency with the study by Ergun et al.,[106] when Ca/P ratio was
between 1.0 and 1.3, the only stable phase was TCP [106].
Doping the CaPs with Ti4+ ions modified the XRD patterns and resulted in alterations in the
intensity of some β-TCP peaks. Addition of Ti4+ ions improves the structural stability of the
samples 1.25CaP2.5Ti which might indicate an increase in crystallinity. Additional peaks
of TiO2 (at 54.58 in 2θ) (ICDD file #21-1276) was observed in the samples 1.25CaP0.5Ti,
1.25CaP1.0Ti, 1.25CaP2.5Ti and 1.25CaP5.0Ti.
In the sample doped with 0.5 mol.%F ions, most of the β-TCP and/or β-CPP transformed
into α-TCP phase. However, in the sample doped with 2.5 mol.%F ions had β-TCP and/or
β-CPP was the main phase with the secondary phase of α-TCP. This showed that increasing
the F- amount stabilized the phases present at low temperature. However, as a result of the
substitution of F- ions, a slight shift to the left was observed.
Increasing Ti4+ and F- ions together, revealed increase in peak intensities. For example, the
broad peak pattern of sample 1.25CaP1.0Ti0.5F demonstrated lower crystallinity level.
According to the co-doped samples, increasing the F- ion amount from 0.5 to 2.5 mol.%
increased peak intensities. This might demonstrate an improvement in the crystallinity of
the samples, which was expected since F- ion incorporation results in an increase in
crystallinity [66]. As seen from the XRD patterns of CaPs with molar ratio of 1.25, the
peaks are attributed to the phase of β-TCP and/or β-CPP and secondary phase of α-TCP
especially in the samples with 1.25CaP1.0Ti0.5F, 1.25CaP2.5Ti2.5F. Additional peaks of
TiO2 (at 54.52 in 2θ) (ICDD file #21-1276) in 2θ was detected in the samples
1.25CaP0.5Ti0.5F, 1.25CaP1.0Ti0.5F, 1.25CaP2.5Ti0.5F, 1.25CaP5.0Ti0.5F
1.25CaP0.5Ti2.5F, 1.25CaP1.0Ti2.5F, 1.25CaP2.5Ti2.5F, and 1.25CaP5.0Ti2.5F.
48
20
30
40
50
60
Intensity (arbitrary values)
An
gle
(2Θ
)
20
30
40
50
60
An
gle
(2Θ
)
20
30
40
50
60
An
gle
(2Θ
)
e) 1
.25C
aP
5.0
Ti
a)
1.2
5C
aP
b)
1.2
5C
aP
0.5
Ti
c) 1
.25C
aP
1.0
Ti
d)
1.2
5C
aP
2.5
Ti
f) 1
.25C
aP
0.5
F
g)
1.2
5C
aP
2.5
F
h)
1.2
5C
aP
0.5
Ti0
.5F
i) 1
.25C
aP
1.0
Ti0
.5F
j) 1
.25C
aP
2.5
Ti0
.5F
k)
1.2
5C
aP5
.0T
i0.5
F
l) 1
.25C
aP
0.5
Ti2
.5F
m)
1.2
5C
aP1
.0T
i2.5
F
n)
1.2
5C
aP2
.5T
i2.5
F
o)
1.2
5C
aP5
.0T
i2.5
F
: β
-TC
P:
α-T
CP
: T
iO2
: β
-CP
P
Fig
ure
3.4:
XR
D p
atte
rns
of C
aPs
wit
h C
a to
P r
atio
of 1
.25
sint
ered
at 1
300°
C.
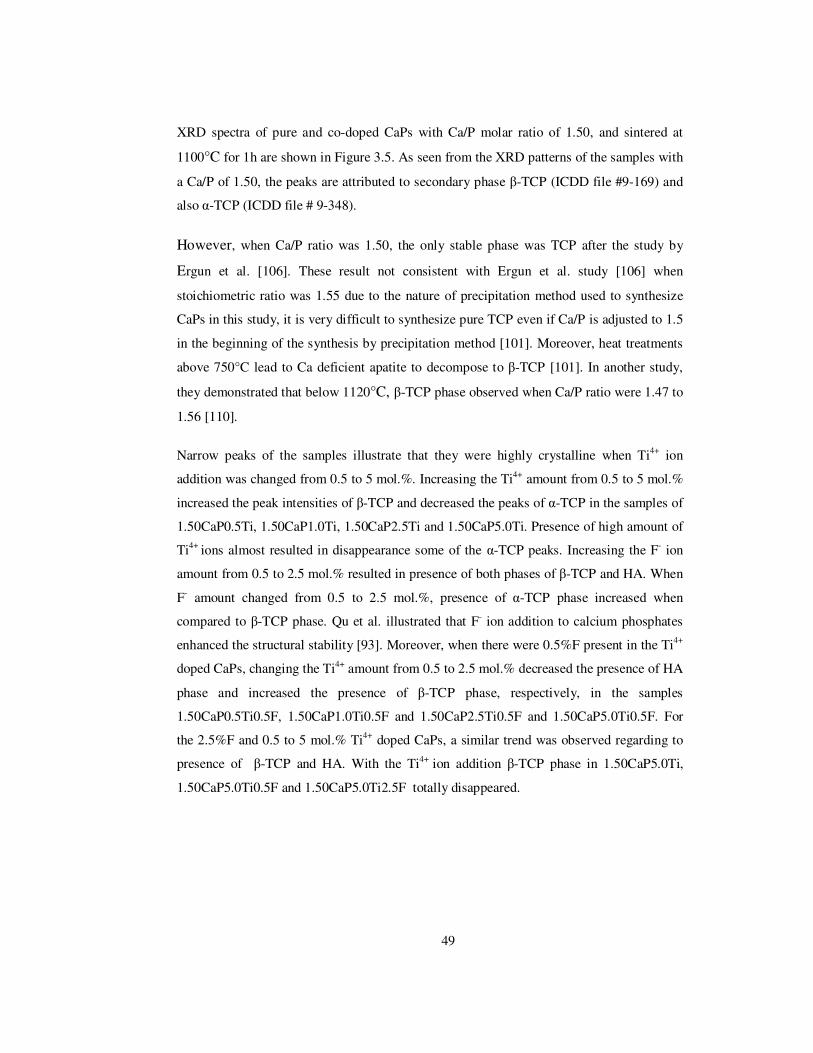
49
XRD spectra of pure and co-doped CaPs with Ca/P molar ratio of 1.50, and sintered at
1100°C for 1h are shown in Figure 3.5. As seen from the XRD patterns of the samples with
a Ca/P of 1.50, the peaks are attributed to secondary phase β-TCP (ICDD file #9-169) and
also α-TCP (ICDD file # 9-348).
However, when Ca/P ratio was 1.50, the only stable phase was TCP after the study by
Ergun et al. [106]. These result not consistent with Ergun et al. study [106] when
stoichiometric ratio was 1.55 due to the nature of precipitation method used to synthesize
CaPs in this study, it is very difficult to synthesize pure TCP even if Ca/P is adjusted to 1.5
in the beginning of the synthesis by precipitation method [101]. Moreover, heat treatments
above 750°C lead to Ca deficient apatite to decompose to β-TCP [101]. In another study,
they demonstrated that below 1120°C, β-TCP phase observed when Ca/P ratio were 1.47 to
1.56 [110].
Narrow peaks of the samples illustrate that they were highly crystalline when Ti4+ ion
addition was changed from 0.5 to 5 mol.%. Increasing the Ti4+ amount from 0.5 to 5 mol.%
increased the peak intensities of β-TCP and decreased the peaks of α-TCP in the samples of
1.50CaP0.5Ti, 1.50CaP1.0Ti, 1.50CaP2.5Ti and 1.50CaP5.0Ti. Presence of high amount of
Ti4+ ions almost resulted in disappearance some of the α-TCP peaks. Increasing the F- ion
amount from 0.5 to 2.5 mol.% resulted in presence of both phases of β-TCP and HA. When
F- amount changed from 0.5 to 2.5 mol.%, presence of α-TCP phase increased when
compared to β-TCP phase. Qu et al. illustrated that F- ion addition to calcium phosphates
enhanced the structural stability [93]. Moreover, when there were 0.5%F present in the Ti4+
doped CaPs, changing the Ti4+ amount from 0.5 to 2.5 mol.% decreased the presence of HA
phase and increased the presence of β-TCP phase, respectively, in the samples
1.50CaP0.5Ti0.5F, 1.50CaP1.0Ti0.5F and 1.50CaP2.5Ti0.5F and 1.50CaP5.0Ti0.5F. For
the 2.5%F and 0.5 to 5 mol.% Ti4+ doped CaPs, a similar trend was observed regarding to
presence of β-TCP and HA. With the Ti4+ ion addition β-TCP phase in 1.50CaP5.0Ti,
1.50CaP5.0Ti0.5F and 1.50CaP5.0Ti2.5F totally disappeared.
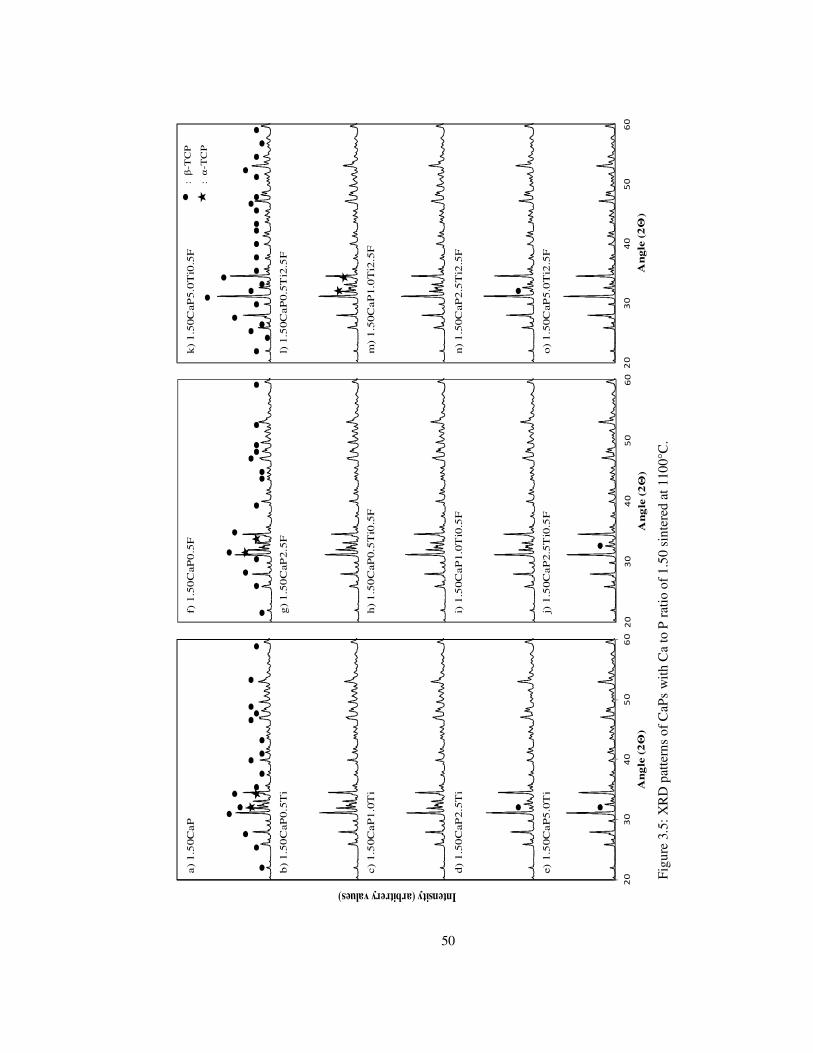
50
20
30
40
50
60
Intensity (arbitrery values)
An
gle
(2Θ
)
20
30
40
50
60
An
gle
(2Θ
)
20
30
40
50
60
An
gle
(2Θ
)
a)
1.5
0C
aP
b)
1.5
0C
aP0.5
Ti
c) 1
.50C
aP
1.0
Ti
d)
1.5
0C
aP2.5
Ti
e) 1
.50C
aP
5.0
Ti
f) 1
.50
CaP
0.5
F
g)
1.5
0C
aP2.5
F
h)
1.5
0C
aP0.5
Ti0
.5F
i) 1
.50C
aP
1.0
Ti0
.5F
j) 1
.50C
aP
2.5
Ti0
.5F
k)
1.5
0C
aP5.0
Ti0
.5F
l) 1
.50C
aP
0.5
Ti2
.5F
m)
1.5
0C
aP
1.0
Ti2
.5F
n)
1.5
0C
aP2.5
Ti2
.5F
o)
1.5
0C
aP5.0
Ti2
.5F
: β
-TC
P
: α
-TC
P
Figu
re 3
.5: X
RD
pat
tern
s of
CaP
s w
ith C
a to
P r
atio
of 1
.50
sint
ered
at 1
100°
C.
51
In Figure 3.6, XRD spectrums of CaPs with molar ratio of 1.50, sintered at 1300°C given.
As seen from the XRD pattern for the undoped sample, the peaks are attributed to α-TCP
(ICDD file # 9-348), β-TCP (ICDD file # 9-169) and TiO2 (ICDD file # 21-1276). As Wu
stated high sintering temperature lead to phase changes which resulted in biphasic or
triphasic calcium phosphate [115]. In the previous studies, when Ca/P ratio was 1.55, a
biphasic HA/TCP structure were observed [106]. Kannan et al. showed that biphasic
HA/TCP ceramics demonstrated modified properties than the single phase of HA or TCP
[107].
Doping with Ti4+ modified the XRD patterns and alterations in intensity of some TCP
peaks. As noted previously, additional phase β-TCP appeared next to α-TCP. After
increasing of Ti4+ ions additional low-intensity peaks of HA observed and peak intensities
increased. XRD pattern shows that some of the peaks of α-TCP has disappeared, the main
crystalline phases of α-TCP remained after Ti4+ ion addition. No severe fluctuations in the
XRD peak positions due to addition of fluoride ions into α-TCP were determined in the
XRD patterns of 1.50CaP0.5F and 1.50CaP2.5F, except that the peak intensities decreased
when compared to pure 1.50CaP. Additional peaks of TiO2 (at 27.28 in 2θ) was observed in
the samples with high amount of Ti4+ ions (1.50CaP5.0Ti, 1.50CaP5.0Ti0.5F and
1.50CaP5.0Ti2.5F).
Increased Ti4+ and F- amount increased peak intensities, three of the sharper peak
correspond to β-TCP, disappeared completely at 1.50CaP2.5Ti0.5F. The broader peak
pattern of 1.50CaP5Ti0.5F demonstrated the smaller crystal sizes and lower crystallinity
degree. According to the results, increasing F- ion amount from 0.5 mol.% to 2.5 mol.%,
increased the peak intensities. This might demonstrate an improvement in the crystallinity
of the samples, which was expected since F- ion incorporation results in an increase in
crystallinity [66]. As noted previously, addition of Ti4+ ions to the samples increased peak
intensities and crystallinity.
52
20
30
40
50
60
Intensity (arbitrary values)
An
gle
(2Θ
)
20
30
40
50
60
An
gle
(2Θ
)
20
30
40
50
60
An
gle
(2Θ
)
a) 1
.50C
aP
b)
1.5
0C
aP
0.5
Ti
c) 1
.50C
aP
1.0
Ti
d)
1.5
0C
aP
2.5
Ti
e) 1
.50C
aP
5.0
Ti
f) 1
.50C
aP
0.5
F
g)
1.5
0C
aP2
.5F
h)
1.5
0C
aP0
.5T
i0.5
F
i) 1
.50C
aP
1.0
Ti0
.5F
j) 1
.50C
aP
2.5
Ti0
.5F
k)
1.5
0C
aP5
.0T
i0.5
F
l) 1
.50C
aP
0.5
Ti2
.5F
m)
1.5
0C
aP1.0
Ti2
.5F
n)
1.5
0C
aP2
.5T
i2.5
F
o)
1.5
0C
aP5
.0T
i2.5
F
: β
-TC
P: α
-TC
P: T
iO2
Figu
re 3
.6: X
RD
pat
tern
s of
CaP
s w
ith C
a to
P r
atio
of
1.50
sin
tere
d at
130
0°C
.

53
XRD patterns of the different compounds with Ca/P molar ratio of 1.67 and sintered at
1100°C are given in Figure 3.7. For the undoped sample, the peaks of HA (ICDD file # 9-
432) and β-TCP(ICDD file # 9-169) were observed due to sample had the optimum Ca/P
ratio of 1.667 to produce pure HA [106]. In these study, result is in correlation with Basar
et al. [86].
According to the results, the peaks are attributed to β-TCP, HA and CaO phases for Ti4+
doped samples. When Ti4+ amount increased from 0.5 to 5 mol.% resulted in increase of the
peak intensities of β-TCP, CaO phase and decrease of the peaks of HA. Doping with Ti4+
ions modified the XRD patterns, with additional reflections, and alterations in intensity of
some HA peaks. A low-intensity peaks were detected at 27.96°, 29.24°, 29.82° and 33.90°.
This result consistent with Ergun study [70]. He mentioned about at 1100°C decomposition
of the HA to TCP observed [70]. After increasing of Ti4+ ion amount peak intensities
decreased, it indicates that crystallinity degree of the powders is low. In the Ti4+ doped
samples as a second phase β-TCP was observed. Because of high sintering temperature and
Ti4+ trigger the decomposition of HA into TCP [107]. With increasing Ti4+ amount,
additional peaks of TiO2 was observed overlapping with β-TCP at 27.8 (2θ) in the samples
of 1.67CaP1.0Ti, 1.67CaP2.5Ti, 1.67CaP5.0Ti, 1.67CaP1.0Ti0.5F, 1.67CaP2.5Ti0.5F,
1.67CaP5.0Ti0.5F, 1.67CaP1.0Ti2.5F, 1.67CaP2.5Ti2.5F and 1.67CaP5.0Ti2.5F.
The results of the XRD pattern for the Ti4+ doped samples showed that HA and Ti4+
reaction products were rutile (TiO2) and β-Ca3(PO4)2 as given in equation 3.2.1 [71]. As
Ergun et al. stated anatase TiO2 converts to rutile and catalyze the decomposition of the HA
to β-Ca3(PO4)2 [71].
Ca10(PO4)6(OH)2 + TiO2 3Ca3(PO4)2 + CaTiO3 + H2O (3.2.1)
The most intense β-Ca3(PO4)2 and rutile peaks were at 2θ (25.80, 27.77, 29.66, 31.03) and
(41.23, 54.32), respectively and HA decompose to Ca3(PO4)2 and H2O at 960°C [112].
In doped samples 1.67CaP2.5Ti, 1.67CaP2.5Ti, 1.67CaP5.0Ti, 1.67CaP1.0Ti0.5F
1.67CaP2.5Ti0.5F, 1.67CaP5.0Ti0.5F, 1.67CaP1.0Ti2.5F 1.67CaP2.5Ti2.5F and
1.67CaP5.0Ti2.5F, CaTiO3 (at 47.54, 58.78 in 2θ) (ICDD file # 42-0423) was found at
1100°C. Meaning that doped samples were thermally unstable at high sintering temperature
54
[69]. According to Ergun et al., at 960°C HA decomposed to Ca3(PO4)3 and H2O and with
reaction of titania, CaTiO3 formed [112]. There was no direct reaction between HA and
titanium but reaction between titanium oxide layer detected [112].
XRD patterns of F- doped samples are presented in Figure 3.7 which assigned the peaks
relative to HA, β-TCP and CaO (ICDD file # 37-1497) phase. According to the results, F-
ion amount at 0.5 mol.% increased the peak intensities of β-TCP and decreased the HA for
the sample of 1.67CaP0.5F. As the F- ion amount increased to 2.5 mol.% F- addition
increased the HA phase and decreased β-TCP and CaO peak intensity in the sample of
1.67CaP2.5F. Qu et al. demonstrated that addition of F- ions improves the structural
stability of HA [93]. Due to F- ion doping into peak apatite lattice, peak shift to higher 2θ
values in the position of (211), (300) and (112) planes in an increasing manner with an
increase in F- ions content [75].
Although, the XRD pattern of the samples 1.67CaP0.5Ti0.5F and 1.67CaP0.5Ti2.5F are
matched with HA with minute amount of β-TCP, addition of Ti4+ ions to the samples
1.67CaP1.0Ti0.5F, 1.67CaP2.5Ti0.5F, 1.67CaP5.0Ti0.5F, 1.67CaP1.0Ti2.5F,
1.67CaP2.5Ti2.5F and 1.67CaP5.0Ti2.5F showed HA, β-TCP and CaO phases. According
to XRD pattern for the Ti4+ and F- doped samples TiO2 (ICDD file # 21-1276) β-TCP and
CaO (ICDD file # 37-1497) peaks observed with increasing Ti4+ ions. The most intense
TiO2 and β-TCP peaks were at 2θ (41.23, 54.32) and (27.77, 31.03, 34.37), respectively.

55
20
30
40
50
60
Intensity (arbitrary values)
An
gle
(2Θ
)2
03
04
05
06
0
An
gle
(2Θ
)
20
30
40
50
60
An
gle
(2Θ
)
f) 1
.67C
aP0.5
F
g) 1
.67C
aP2
.5F
h) 1
.67C
aP0
.5T
i0.5
F
i) 1
.67
CaP
1.0
Ti0
.5F
j) 1
.67
CaP
2.5
Ti0
.5F
k)
1.6
7C
aP5.0
Ti0
.5F
l) 1
.67C
aP0.5
Ti2
.5F
m)
1.6
7C
aP1
.0T
i2.5
F
n)
1.6
7C
aP2.5
Ti2
.5F
o)
1.6
7C
aP5.0
Ti2
.5F
a) 1
.67C
aP
b)
1.6
7C
aP0.5
Ti
c) 1
.67C
aP1
.0T
i
d) 1
.67C
aP2.5
Ti
e) 1
.67C
aP5
.0T
i
: β
-TC
P
: H
A
: T
iO2
: C
aTiO
3
Figu
re 3
.7: X
RD
pat
tern
s of
CaP
s w
ith C
a to
P r
atio
of
1.67
sin
tere
d at
110
0°C
.
56
The XRD pattern of the samples with Ca/P molar ratio of 1.67, sintered at 1300°C, are
given in Figure 3.8. For undoped sample, XRD pattern coincide with the HA (ICDD file #
9-432). Moreover, there were very small amount of α-TCP, CaTiO3 (ICDD file # 42-0423)
and CaO (ICDD file # 37-1497) phases in the XRD pattern of the sample.
Doping with Ti4+ ions modified the XRD patterns. The characteristic peaks of HA (ICDD
file # 9-432), α-TCP (ICDD file # 9-348) and CaO (ICDD file # 37-1497) appeared.
According to Elliot et al. when HA was sintered between 700°C and 1125°C, it
decomposed to β-TCP or a biphasic system of β-TCP and HA [16]. This transformation
varied with respect to substituted ions and sintering temperatures. In these study doping the
samples with Ti4+ ions trigger the decomposition of HA into α-TCP phase.
XRD pattern showed that the characteristic peaks of HA almost disappered when Ti4+ ion
amount was 5.0 mol.%. As a second phase α-TCP was observed in HA after Ti4+ addition at
1300°C. These results indicate that the stability of HA decreased as the sintering
temperature and Ti4+ amount increased. High sintering temperature and Ti4+ trigger the
decomposition of HA into TCP [107]. As a Ergun stated Ti4+ ion can be regarded as an α-
TCP stabilizing agent in HA [70]. In doped samples 1.67CaP0.5Ti, 1.67CaP1.0Ti
1.67CaP2.5Ti, 1.67CaP5.0Ti, 1.67CaP0.5Ti0.5F, 1.67CaP1.0Ti0.5F, 1.67CaP2.5Ti0.5F,
1.67CaP5.0Ti0.5F, 1.67CaP0.5Ti2.5F, 1.67CaP1.0Ti2.5F, 1.67CaP2.5Ti2.5F and
1.67CaP5.0Ti2.5F, CaTiO3 (at 47.54, 58.78 in 2θ) (ICDD file #42-0423) was found at
1300°C. Meaning that doped samples were thermally unstable at high sintering temperature
[69]. Different from 1100°C, with increasing sintering temperature to 1300°C additional
peaks of α-TCP observed.
According to XRD patterns, addition of F- ions demonstrated peaks of HA (ICDD file # 9-
432) and small amount of α-TCP. The main crystalline phase of HA remained. No severe
fluctuations in the XRD peak positions due to addition of fluoride ions determined. The
reason for improved stability was mainly due to the structural stability provided by
precipation method [48] and addition of F- ions for the doped samples [93]. Due to Ca/P
ratio of HA, the material becomes more stable after sintering [24]. This explains the
structural stability in this study.
57
After addition of Ti4+ and F- ions (0.5 mol.% to 5.0 mol.% Ti and 0.5 mol.%, 2.5 mol.% F
ions), HA (ICDD file # 9-432) and α-TCP (ICDD file #9-348) phases were observed. As
reported previosly, with increasing the Ti4+ amount, HA peaks almost disappeared and only
α-TCP characteristic peaks remained. The positions of the peaks were slightly shifted to the
right with respect to the positions of pure α -TCP.
XRD pattern for the Ti4+ and F- doped samples when sintering temperature increased to
1300°C only two peaks of α-TCP observed with increasing Ti4+ ions.
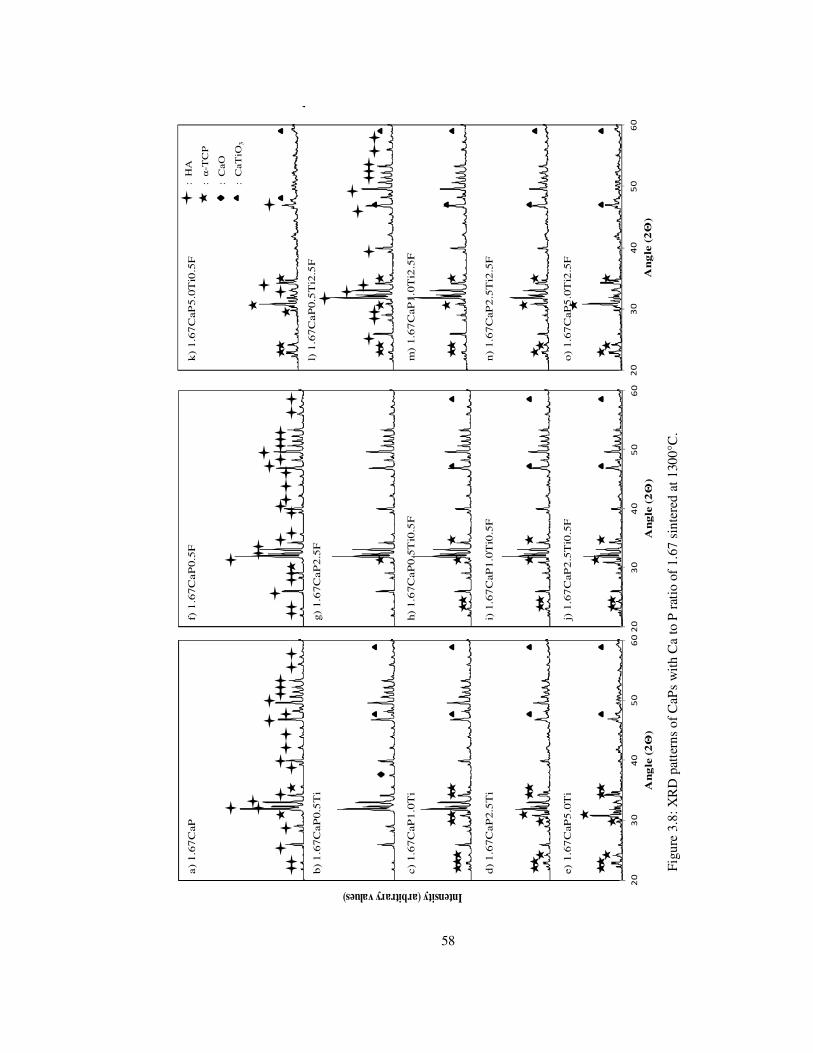
58
20
30
40
50
60
Intensity (arbitrary values)
An
gle
(2Θ
)
20
30
40
50
60
An
gle
(2Θ
)
20
30
40
50
60
An
gle
(2Θ
)
f) 1
.67C
aP0.5
F
g) 1
.67C
aP2.5
F
h) 1
.67C
aP0.5
Ti0
.5F
i) 1
.67
CaP
1.0
Ti0
.5F
j) 1
.67
CaP
2.5
Ti0
.5F
k)
1.6
7C
aP5
.0T
i0.5
F
l) 1
.67C
aP0.5
Ti2
.5F
m)
1.6
7C
aP1.0
Ti2
.5F
n)
1.6
7C
aP2
.5T
i2.5
F
o)
1.6
7C
aP5
.0T
i2.5
F
a) 1
.67
CaP
b)
1.6
7C
aP0.5
Ti
c) 1
.67
CaP
1.0
Ti
d)
1.6
7C
aP2.5
Ti
e) 1
.67
CaP
5.0
Ti
: H
A
: α
-TC
P
: C
aO
: C
aTiO
3
Figu
re 3
.8: X
RD
pat
tern
s of
CaP
s w
ith C
a to
P r
atio
of
1.67
sin
tere
d at
130
0°C
.
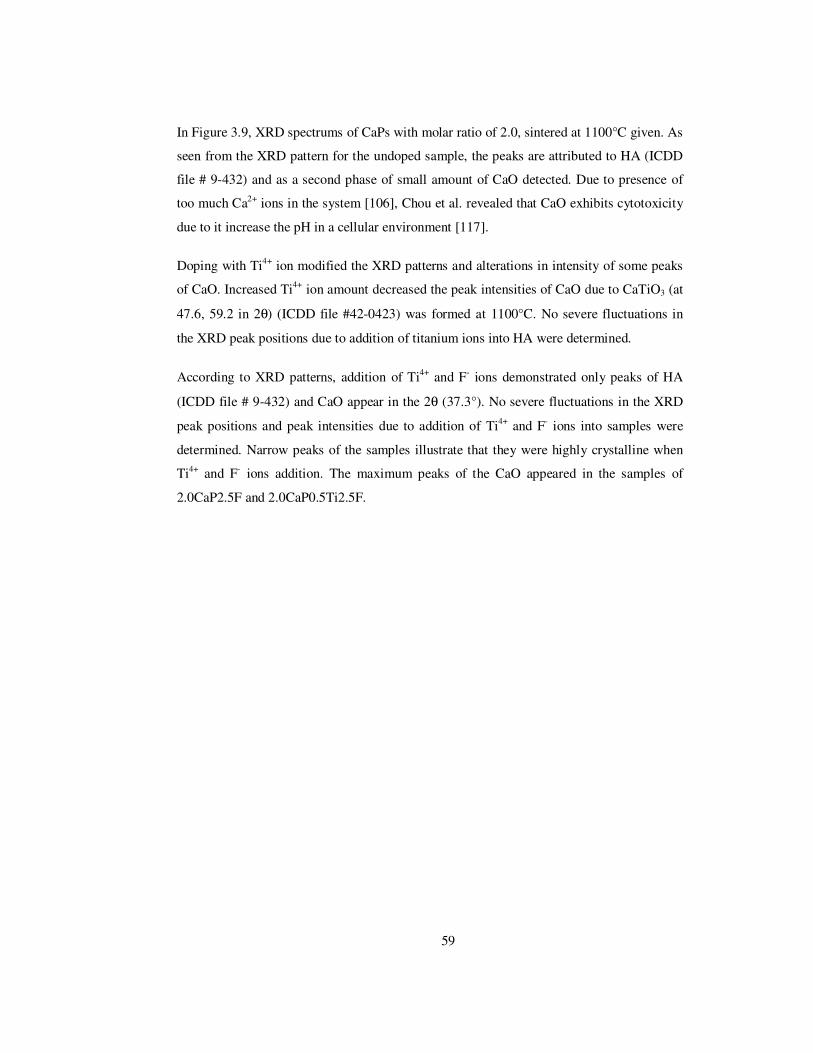
59
In Figure 3.9, XRD spectrums of CaPs with molar ratio of 2.0, sintered at 1100°C given. As
seen from the XRD pattern for the undoped sample, the peaks are attributed to HA (ICDD
file # 9-432) and as a second phase of small amount of CaO detected. Due to presence of
too much Ca2+ ions in the system [106], Chou et al. revealed that CaO exhibits cytotoxicity
due to it increase the pH in a cellular environment [117].
Doping with Ti4+ ion modified the XRD patterns and alterations in intensity of some peaks
of CaO. Increased Ti4+ ion amount decreased the peak intensities of CaO due to CaTiO3 (at
47.6, 59.2 in 2θ) (ICDD file #42-0423) was formed at 1100°C. No severe fluctuations in
the XRD peak positions due to addition of titanium ions into HA were determined.
According to XRD patterns, addition of Ti4+ and F- ions demonstrated only peaks of HA
(ICDD file # 9-432) and CaO appear in the 2θ (37.3°). No severe fluctuations in the XRD
peak positions and peak intensities due to addition of Ti4+ and F- ions into samples were
determined. Narrow peaks of the samples illustrate that they were highly crystalline when
Ti4+ and F- ions addition. The maximum peaks of the CaO appeared in the samples of
2.0CaP2.5F and 2.0CaP0.5Ti2.5F.

60
20
30
40
50
60
Intensity (arbitrary values)
An
gle
(2Θ
)
20
30
40
50
60
An
gle
(2Θ
)
20
30
40
50
60
An
gle
(2Θ
)
a)
2.0
CaP
b)
2.0
CaP
0.5
Ti
c) 2
.0C
aP1.0
Ti
f) 2
.0C
aP0.5
F
g)
2.0
CaP
2.5
F
d)
2.0
CaP
2.5
Ti
e) 2
.0C
aP5.0
Ti
h)
2.0
CaP
0.5
Ti0
.5F
i) 2
.0C
aP
1.0
Ti0
.5F
j) 2
.0C
aP
2.5
Ti0
.5F
k)
2.0
CaP
5.0
Ti0
.5F
l) 2
.0C
aP
0.5
Ti2
.5F
m)
2.0
CaP
1.0
Ti2
.5F
n)
2.0
CaP
2.5
Ti2
.5F
o)
2.0
CaP
5.0
Ti2
.5F
: H
A
: C
aO
: C
aTiO
3
Figu
re 3
.9: X
RD
pat
tern
s of
CaP
s w
ith
Ca
to P
rat
io o
f 2.0
sin
tere
d at
110
0°C
.
61
The XRD patterns of the different compounds with molar ratio of 2.0 sintered at 1300°C
given in Figure 3.10. For the undoped and doped samples, the peaks of HA (ICDD file # 9-
432), α-TCP and small amount of CaO were observed. CaTiO3 (at 47.58, 58.92 in2θ)
(ICDD file #42-0423) was formed at 1300°C. No severe fluctuations in the XRD peak
positions due to addition of titanium and fluoride ions into HA were determined.
There was not a considerable difference in the intensity of the undoped and doped samples
at 1300°C for samples with Ca/P ratio 2.0. Narrow peaks for both sintering temperature
indicate that they were highly crystalline. With increasing sintering temperature from
1100°C to 1300°C, CaO peak at 2θ angle of 37.3° almost disappeared in the Ti4+ added
samples.When comparing the ratios of CaO, the amount of CaO at 1100°C higher than that
at 1300°C. The peak intensity of the CaO at 1300°C decreased because of CaTiO3 (at 47.6,
59.2 in 2θ) (ICDD file #42-0423) was formed.
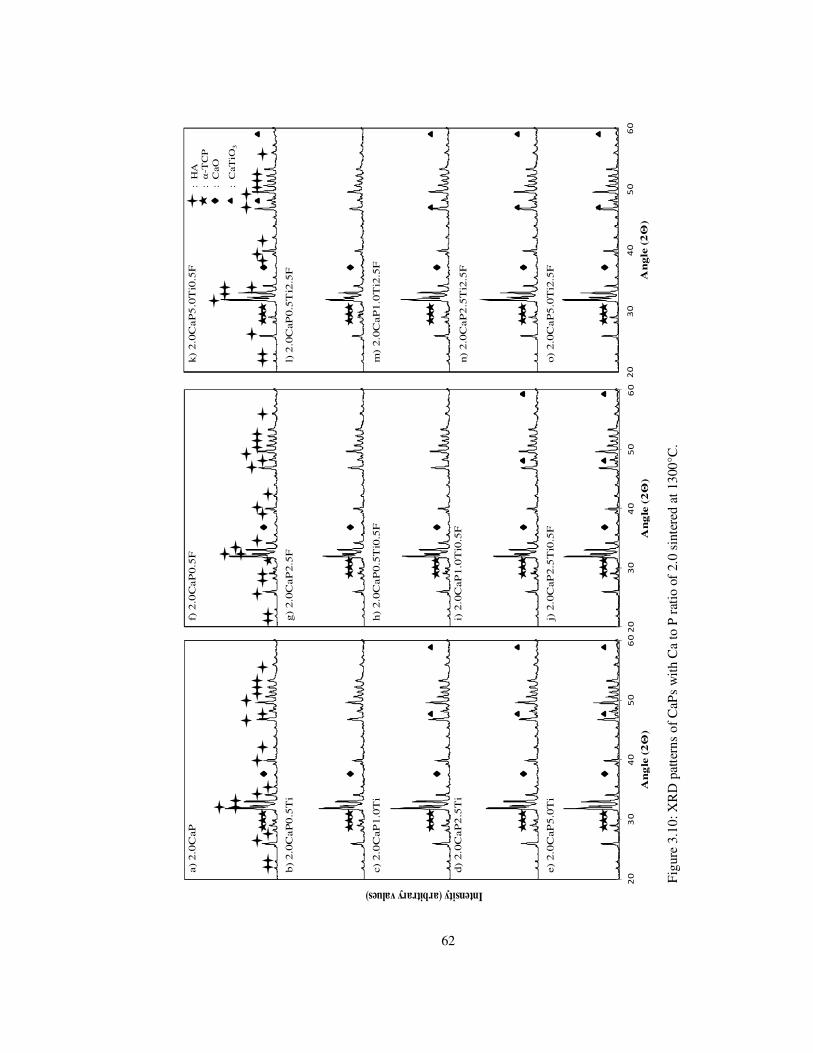
62
20
30
40
50
60
An
gle
(2Θ
)
20
30
40
50
60
An
gle
(2Θ
)
20
30
40
50
60
Intensity (arbitrary values)
An
gle
(2Θ
)
a) 2
.0C
aP
b)
2.0
CaP
0.5
Ti
c) 2
.0C
aP1.0
Ti
d)
2.0
CaP
2.5
Ti
e) 2
.0C
aP5.0
Ti
f) 2
.0C
aP
0.5
F
g)
2.0
CaP
2.5
F
h)
2.0
CaP
0.5
Ti0
.5F
i) 2
.0C
aP1.0
Ti0
.5F
j) 2
.0C
aP2.5
Ti0
.5F
k)
2.0
CaP
5.0
Ti0
.5F
l) 2
.0C
aP0.5
Ti2
.5F
m)
2.0
CaP
1.0
Ti2
.5F
n)
2.0
CaP
2.5
Ti2
.5F
o)
2.0
CaP
5.0
Ti2
.5F
: H
A
: C
aO:
α-T
CP
: C
aTiO
3
Fig
ure
3.10
: XR
D p
atte
rns
of C
aPs
with
Ca
to P
rat
io o
f 2.
0 si
nter
ed a
t 130
0°C
.
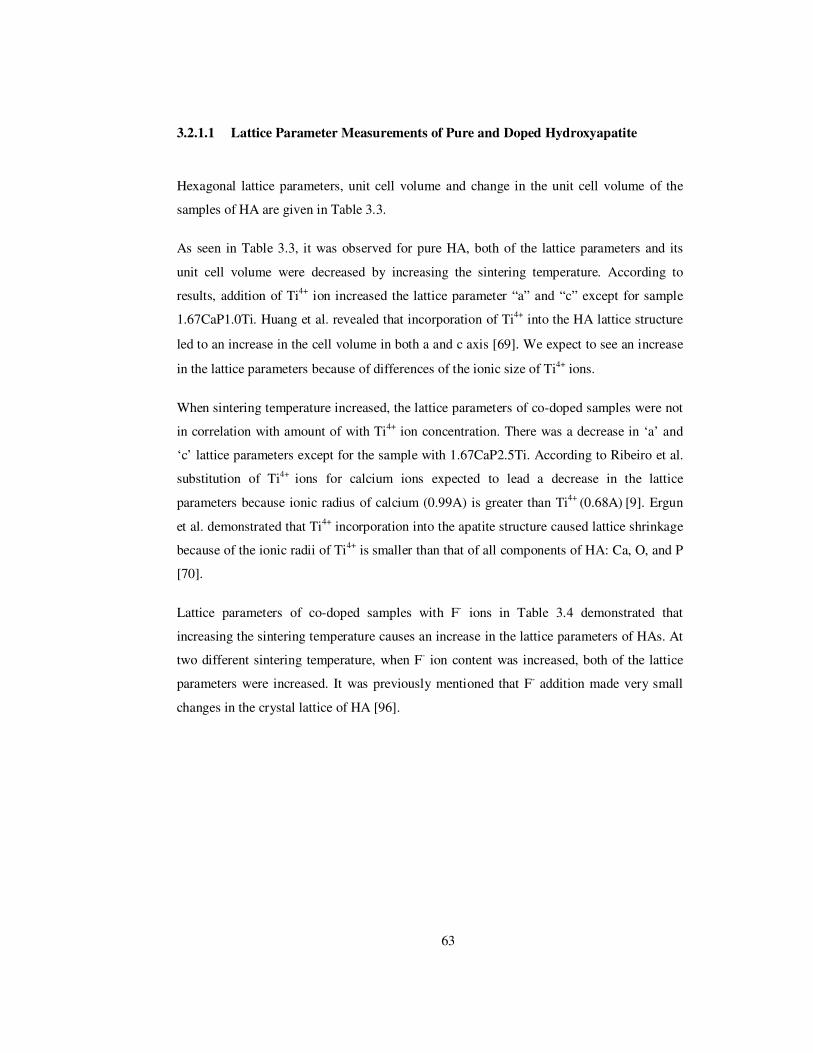
63
3.2.1.1 Lattice Parameter Measurements of Pure and Doped Hydroxyapatite
Hexagonal lattice parameters, unit cell volume and change in the unit cell volume of the
samples of HA are given in Table 3.3.
As seen in Table 3.3, it was observed for pure HA, both of the lattice parameters and its
unit cell volume were decreased by increasing the sintering temperature. According to
results, addition of Ti4+ ion increased the lattice parameter “a” and “c” except for sample
1.67CaP1.0Ti. Huang et al. revealed that incorporation of Ti4+ into the HA lattice structure
led to an increase in the cell volume in both a and c axis [69]. We expect to see an increase
in the lattice parameters because of differences of the ionic size of Ti4+ ions.
When sintering temperature increased, the lattice parameters of co-doped samples were not
in correlation with amount of with Ti4+ ion concentration. There was a decrease in ‘a’ and
‘c’ lattice parameters except for the sample with 1.67CaP2.5Ti. According to Ribeiro et al.
substitution of Ti4+ ions for calcium ions expected to lead a decrease in the lattice
parameters because ionic radius of calcium (0.99A) is greater than Ti4+ (0.68A) [9]. Ergun
et al. demonstrated that Ti4+ incorporation into the apatite structure caused lattice shrinkage
because of the ionic radii of Ti4+ is smaller than that of all components of HA: Ca, O, and P
[70].
Lattice parameters of co-doped samples with F- ions in Table 3.4 demonstrated that
increasing the sintering temperature causes an increase in the lattice parameters of HAs. At
two different sintering temperature, when F- ion content was increased, both of the lattice
parameters were increased. It was previously mentioned that F- addition made very small
changes in the crystal lattice of HA [96].

64
Sam
ple
ID
Sin
tere
d a
t 11
00 °
CS
inte
red
at
1300
°C
a(Å
)c(
Å)
V(Å
3 )∆
V(Å
3 )a(
Å)
c(Å
)V
(Å3 )
∆V
(Å3 )
1.67
CaP
9.40
546.
8683
1573
.03
-7.8
29.
3965
6.86
3915
69.0
4-1
1.80
1.67
CaP
0.5T
i9.
4067
6.86
9415
73.7
1-7
.14
9.40
866.
8687
1574
.19
-6.6
6
1.67
CaP
1.0T
i9.
4053
6.86
7715
72.8
5-7
.99
9.39
696.
915
1580
.86
0.01
1.67
CaP
2.5T
i9.
4082
6.86
6415
67.9
0-1
2.95
9.86
596.
9329
1567
.70
-13.
15
1.67
CaP
5.0T
i9.
6240
6.71
616
10.4
729
.63
9.33
286.
9375
1564
.44
-16.
41
1.67
CaP
0.5F
9.39
616.
8632
1568
.75
-12.
109.
4012
6.86
6715
71.2
6-9
.59
1.67
CaP
2.5F
9.39
946.
8663
1570
.56
-10.
299.
4030
6.87
0815
72.8
0-8
.05
1.67
CaP
0.5T
i0.5
F9.
4115
6.87
4215
76.4
2-4
.43
9.40
376.
8715
1573
.19
-7.6
6
1.67
CaP
1.0T
i0.5
F9.
4073
6.87
2515
74.6
2-6
.22
9.40
506.
8685
1572
.94
-7.9
1
1.67
CaP
2.5T
i0.5
F9.
4044
6.84
0815
66.3
9-1
4.45
9.42
676.
8743
1578
.19
-2.6
6
1.67
CaP
5.0T
i0.5
F9.
4956
6.76
8715
46.9
9-3
3.86
9.58
486.
6177
1574
.00
-6.8
5
1.67
CaP
0.5T
i2.5
F9.
4039
6.86
8615
72.5
9-8
.26
9.39
976.
8693
1571
.35
-9.5
0
1.67
CaP
1.0T
i2.5
F9.
4087
6.87
2215
75.0
2-5
.82
9.40
146.
8714
1572
.40
-8.4
5
1.67
CaP
2.5T
i2.5
F9.
4369
6.86
9515
80.5
0-0
.35
9.41
276.
9286
1580
.13
-0.7
2
1.67
CaP
5.0T
i2.5
F9.
4997
6.81
2215
91.6
210
.77
9.76
416.
3946
1578
.37
-2.4
7
Tab
le 3
.3:
Hex
agon
al la
ttice
par
amet
ers
of
pure
am
d do
ped
CaP
s w
ith a
Ca/
P ra
tio
of 1
.67
sint
ered
at
1100
°C
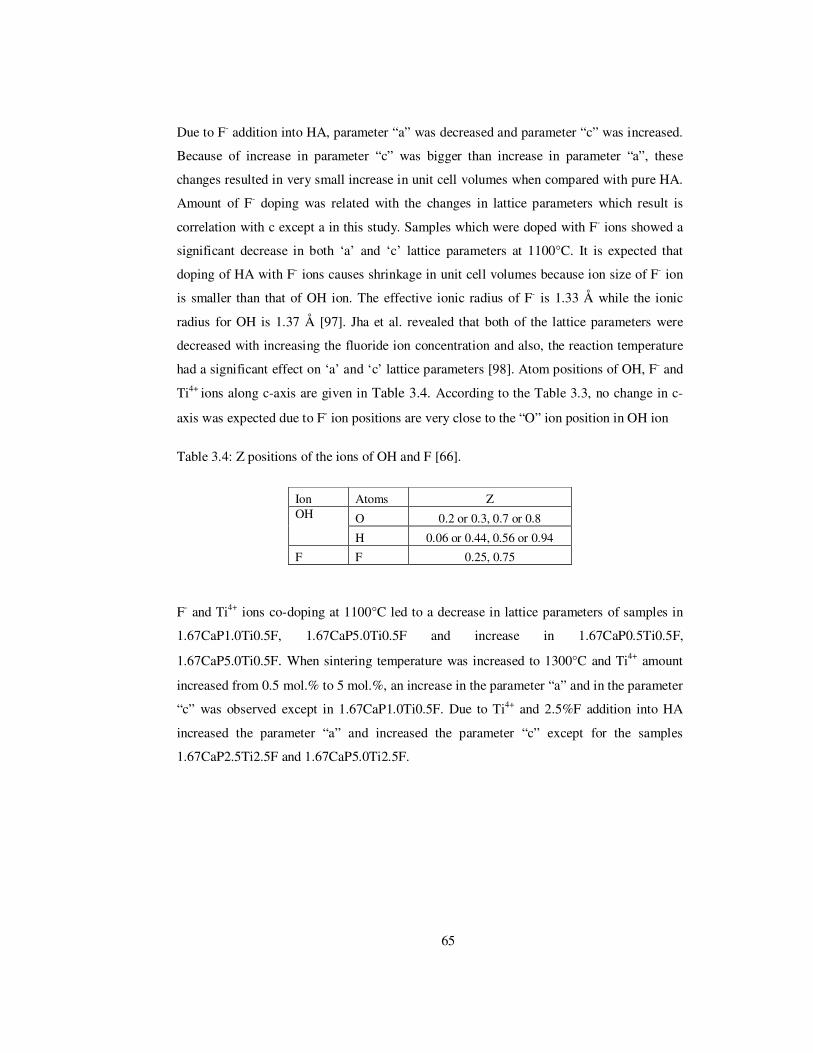
65
Due to F- addition into HA, parameter “a” was decreased and parameter “c” was increased.
Because of increase in parameter “c” was bigger than increase in parameter “a”, these
changes resulted in very small increase in unit cell volumes when compared with pure HA.
Amount of F- doping was related with the changes in lattice parameters which result is
correlation with c except a in this study. Samples which were doped with F- ions showed a
significant decrease in both ‘a’ and ‘c’ lattice parameters at 1100°C. It is expected that
doping of HA with F- ions causes shrinkage in unit cell volumes because ion size of F- ion
is smaller than that of OH ion. The effective ionic radius of F- is 1.33 Å while the ionic
radius for OH is 1.37 Å [97]. Jha et al. revealed that both of the lattice parameters were
decreased with increasing the fluoride ion concentration and also, the reaction temperature
had a significant effect on ‘a’ and ‘c’ lattice parameters [98]. Atom positions of OH, F- and
Ti4+ ions along c-axis are given in Table 3.4. According to the Table 3.3, no change in c-
axis was expected due to F- ion positions are very close to the “O” ion position in OH ion
Table 3.4: Z positions of the ions of OH and F [66].
Ion Atoms Z OH O 0.2 or 0.3, 0.7 or 0.8
H 0.06 or 0.44, 0.56 or 0.94
F F 0.25, 0.75
F- and Ti4+ ions co-doping at 1100°C led to a decrease in lattice parameters of samples in
1.67CaP1.0Ti0.5F, 1.67CaP5.0Ti0.5F and increase in 1.67CaP0.5Ti0.5F,
1.67CaP5.0Ti0.5F. When sintering temperature was increased to 1300°C and Ti4+ amount
increased from 0.5 mol.% to 5 mol.%, an increase in the parameter “a” and in the parameter
“c” was observed except in 1.67CaP1.0Ti0.5F. Due to Ti4+ and 2.5%F addition into HA
increased the parameter “a” and increased the parameter “c” except for the samples
1.67CaP2.5Ti2.5F and 1.67CaP5.0Ti2.5F.
66
3.2.2 Fourier Transform Infrared Spectroscopy
FTIR was applied to identify the presence of the bonds related to CaP and the presence of
bands related to F- and Ti4+ ions. FTIR results of the CaPs doped with Ti4+ and F- ions are
presented in Figures 3.11- 3.20.
The FTIR spectra of the synthesized pure and doped 1CaP after the sintering at 1100°C for
1h is given in Figure 3.11. All of the doped and undoped samples sintered at 1100°C
demonstrated the characteristic bands for β-CPP. FTIR reference frequencies of β-CPP are
given in Table 3.5. β-CPP peaks at 1130-945 cm-1 were attributed to phosphate stretching
and bending mode of vibration as seen in Table 3.6. The bands at 630-518 cm-1 were due to
the phosphate bending mode of vibrations. The bands at 3438 and 1612 cm-1 were
corresponding to OH- [102], indicating the minimum amount of absorved water in the
samples. The asymmetrical stretching and bending modes of PO43- were observed at around
1091, 1170, 980 and 534 cm-1, respectively [100]. The asymmetrical stretching and bending
modes of PO43- ions were declined by increasing the Ti4+ amount. After adding different
Ti4+ ion concentration, a significant decrease was observed in the band peaks. Same peaks
were detected for the samples of 1CaP0.5Ti, 1CaP1.0Ti, 1CaP2.5Ti and 1CaP5.0Ti. The
intensity of the peaks at 696 cm-1 decreased with increasing F- amount in the samples and
also OH-F bonding were visible in this sample. This is due to the fact that F- ion replaces
OH- ion in the CaP structure. When the F- amount in the samples increased, this resulted in
decreased OH- ion concentration in the CaP structure because of the replacement of F- ion
which resulted in a decrease in the intensity of the peaks at 696 cm-1 [92]. This result
revealed that F- ion incorporated into the CaP structure successfully. Increased F- and Ti4+
ions amount resulted in decreased peak intensities. The asymmetrical stretching and
bending modes of PO43- decreased with increasing ion concentrations.
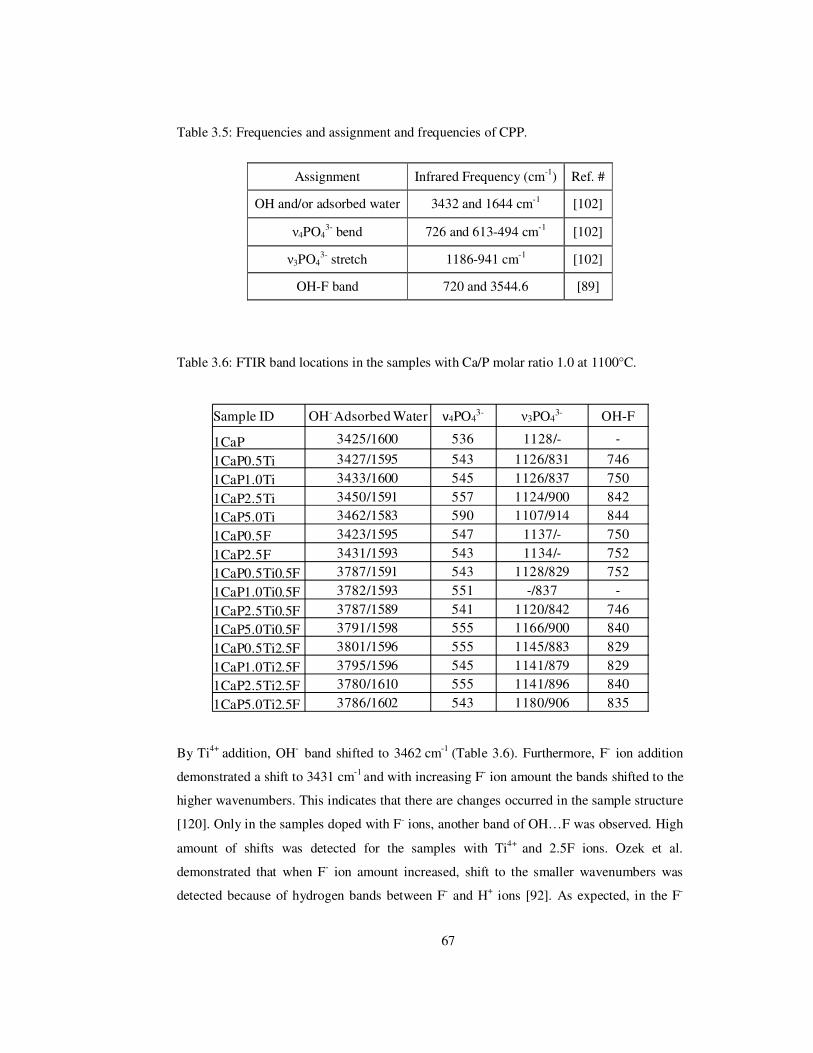
67
Table 3.5: Frequencies and assignment and frequencies of CPP.
Assignment Infrared Frequency (cm-1) Ref. #
OH and/or adsorbed water 3432 and 1644 cm-1 [102]
ν4PO43- bend 726 and 613-494 cm-1 [102]
ν3PO43- stretch 1186-941 cm-1 [102]
OH-F band 720 and 3544.6 [89]
Table 3.6: FTIR band locations in the samples with Ca/P molar ratio 1.0 at 1100°C.
By Ti4+ addition, OH- band shifted to 3462 cm-1 (Table 3.6). Furthermore, F- ion addition
demonstrated a shift to 3431 cm-1 and with increasing F- ion amount the bands shifted to the
higher wavenumbers. This indicates that there are changes occurred in the sample structure
[120]. Only in the samples doped with F- ions, another band of OH…F was observed. High
amount of shifts was detected for the samples with Ti4+ and 2.5F ions. Ozek et al.
demonstrated that when F- ion amount increased, shift to the smaller wavenumbers was
detected because of hydrogen bands between F- and H+ ions [92]. As expected, in the F-
Sample ID OH-Adsorbed Water ν4PO43- ν3PO4
3- OH-F
1CaP 3425/1600 536 1128/-
1CaP0.5Ti 3427/1595 543 1126/831 746
1CaP1.0Ti 3433/1600 545 1126/837 750
1CaP2.5Ti 3450/1591 557 1124/900 842
1CaP5.0Ti 3462/1583 590 1107/914 844
1CaP0.5F 3423/1595 547 1137/ 750
1CaP2.5F 3431/1593 543 1134/ 752
1CaP0.5Ti0.5F 3787/1591 543 1128/829 752
1CaP1.0Ti0.5F 3782/1593 551 /837
1CaP2.5Ti0.5F 3787/1589 541 1120/842 746
1CaP5.0Ti0.5F 3791/1598 555 1166/900 840
1CaP0.5Ti2.5F 3801/1596 555 1145/883 829
1CaP1.0Ti2.5F 3795/1596 545 1141/879 829
1CaP2.5Ti2.5F 3780/1610 555 1141/896 840
1CaP5.0Ti2.5F 3786/1602 543 1180/906 835
68
undoped samples no band was observed at 3543 cm-1, which is the evidence of the F- ion
integration into the β-CPP.
According to Figure 3.12, when sintering temperature was increased to 1300°C
characteristic bands for β-CPP & α-TCP (samples of 1CaP, 1CaP0.5Ti and 1CaP5.0Ti), the
bands for PO43- groups and OH- groups were detected (Table 3.7). In the 0.5 mol.%-2.5
mol.%F- and 0.5 mol.%-5.0 mol.% Ti4+ doped samples the characteristic peaks of β-CPP
and β-TCP were observed. β-TCP peaks were observed at around the infrared frequencies
1126 cm-1 and 971 cm-1 [103]. Band at 3500-3300 cm-1 relating to vibration of the absorved
water (OH- libration band) in sample structure detected except for the samples with Ti4+ and
0.5F- ions it is almost disappeared. The asymmetrical stretching and bending modes of
PO43- ions were increased by increasing Ti4+ amount. Different from the samples sintered at
1100°C, when the F- amount in the samples increased, resulted in increased OH- ion
concentration in the CaP structure, which is in conflict with the result of Ozek [92].
Addition of Ti4+ and F- ion increased the peak intensities. OH- libration band decreased in
the samples with increased Ti4+ and 2.5 mol.% F ions. Maximum stretching bands (ν3) were
observed in the samples doped with 5.0 mol.% Ti ions.
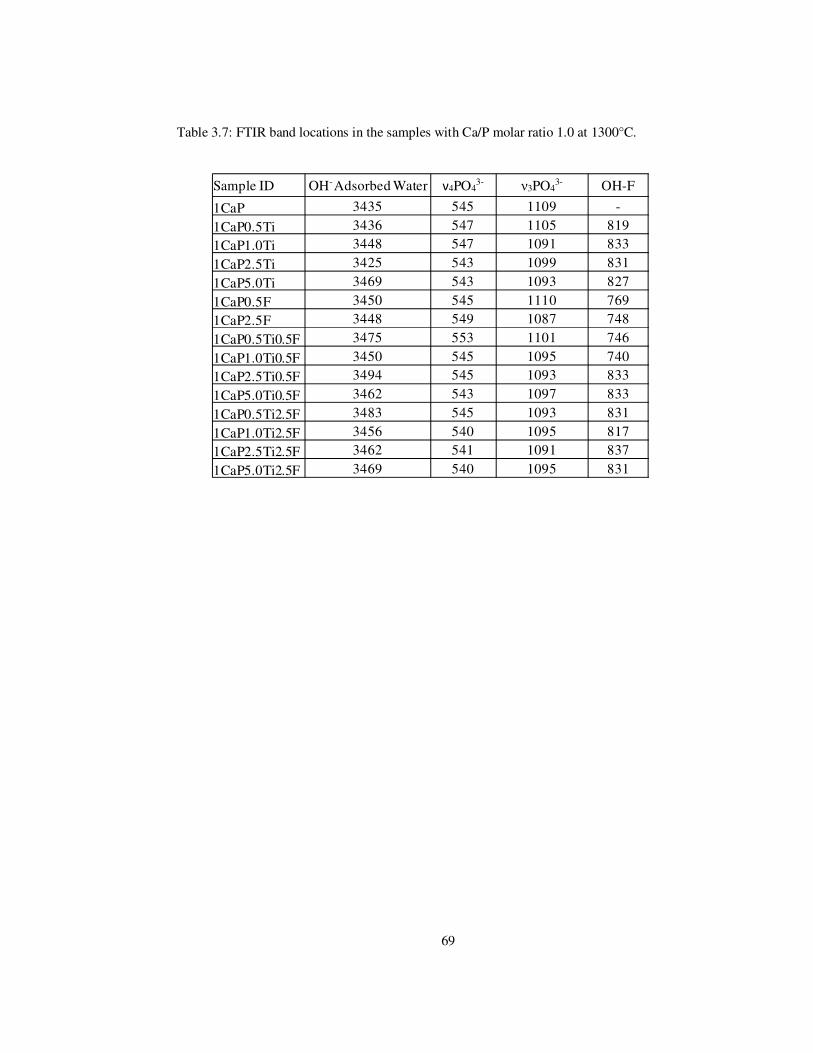
69
Table 3.7: FTIR band locations in the samples with Ca/P molar ratio 1.0 at 1300°C.
Sample ID OH-Adsorbed Water ν4PO43- ν3PO4
3- OH-F
1CaP 3435 545 1109 -
1CaP0.5Ti 3436 547 1105 819
1CaP1.0Ti 3448 547 1091 833
1CaP2.5Ti 3425 543 1099 831
1CaP5.0Ti 3469 543 1093 827
1CaP0.5F 3450 545 1110 769
1CaP2.5F 3448 549 1087 748
1CaP0.5Ti0.5F 3475 553 1101 746
1CaP1.0Ti0.5F 3450 545 1095 740
1CaP2.5Ti0.5F 3494 545 1093 833
1CaP5.0Ti0.5F 3462 543 1097 833
1CaP0.5Ti2.5F 3483 545 1093 831
1CaP1.0Ti2.5F 3456 540 1095 817
1CaP2.5Ti2.5F 3462 541 1091 837
1CaP5.0Ti2.5F 3469 540 1095 831

70
Transmittance (%)
Wa
ve n
um
ber (
cm
-1)
40
00
28
00
2
20
0
16
00
80
04
00
0
28
00
2
20
0
16
00
80
04
00
0
2
80
0
2
20
0
16
00
80
0
Wave n
um
ber (
cm
-1)
Wa
ve n
um
ber (
cm
-1)
a)
1C
aP
b)
1C
aP
0.5
Ti
c)
1C
aP
1.0
Ti
d)
1C
aP
2.5
Ti
e)
1C
aP
5.0
Ti
f) 1
Ca
P0
.5F
g)
1C
aP
2.5
F
h)
1C
aP
0.5
Ti0
.5F
i) 1
CaP
1.0
Ti0
.5F
j) 1
Ca
P2
.5T
i0.5
F
k)
1C
aP
5.0
Ti0
.5F
l) 1
Ca
P0
.5T
i2.5
F
m)
1C
aP
1.0
Ti2
.5F
n)
1C
aP
2.5
Ti2
.5F
o)
1C
aP
5.0
Ti2
.5F
ν 4P
O43
-ν 3
PO
43-
OH
-st
retc
hin
g
OH
-li
bra
tio
nal
OH
-F b
on
d
OH
-F b
on
d
Fig
ure
3.11
: FT
IR p
atte
rns
of C
aPs
with
Ca
to P
rat
io o
f 1
sint
ered
at 1
100°
C.
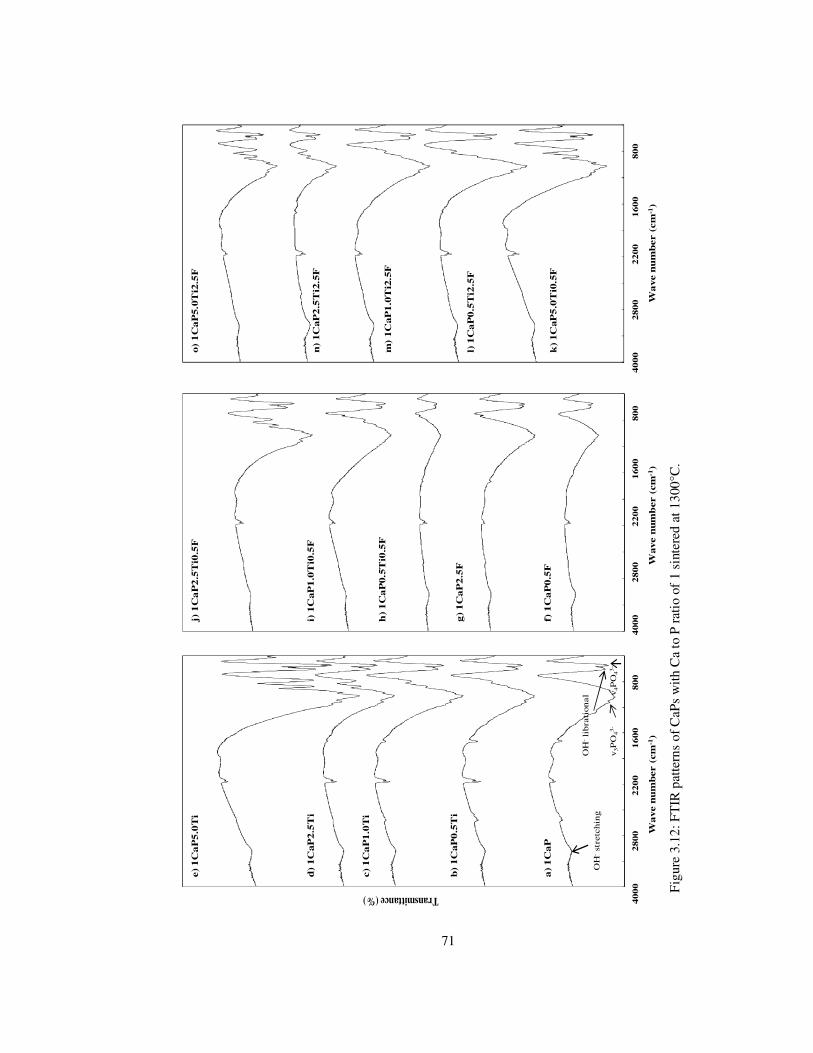
71
Transmittance (%)
Wa
ve n
um
ber (
cm
-1)
4000
2800 2200 1
600
8
00
4000 2
800
2200 1
600 8
00
Wave n
um
ber (
cm
-1)
4000
2800 2200 1
600 8
00
Wa
ve n
um
ber (
cm
-1)
a)
1C
aP
b)
1C
aP
0.5
Ti
c)
1C
aP
1.0
Ti
d)
1C
aP
2.5
Ti
e)
1C
aP
5.0
Ti
f) 1
Ca
P0
.5F
g)
1C
aP
2.5
F
h)
1C
aP
0.5
Ti0
.5F
i) 1
CaP
1.0
Ti0
.5F
j) 1
Ca
P2
.5T
i0.5
F
k)
1C
aP
5.0
Ti0
.5F
l) 1
Ca
P0
.5T
i2.5
F
m)
1C
aP
1.0
Ti2
.5F
n)
1C
aP
2.5
Ti2
.5F
o)
1C
aP
5.0
Ti2
.5F
OH
-st
retc
hin
g
v3P
O43-
v4P
O43
-
OH
-li
bra
tional
Fig
ure
3.12
: FT
IR p
atte
rns
of C
aPs
with
Ca
to P
rat
io o
f 1
sint
ered
at 1
300°
C.
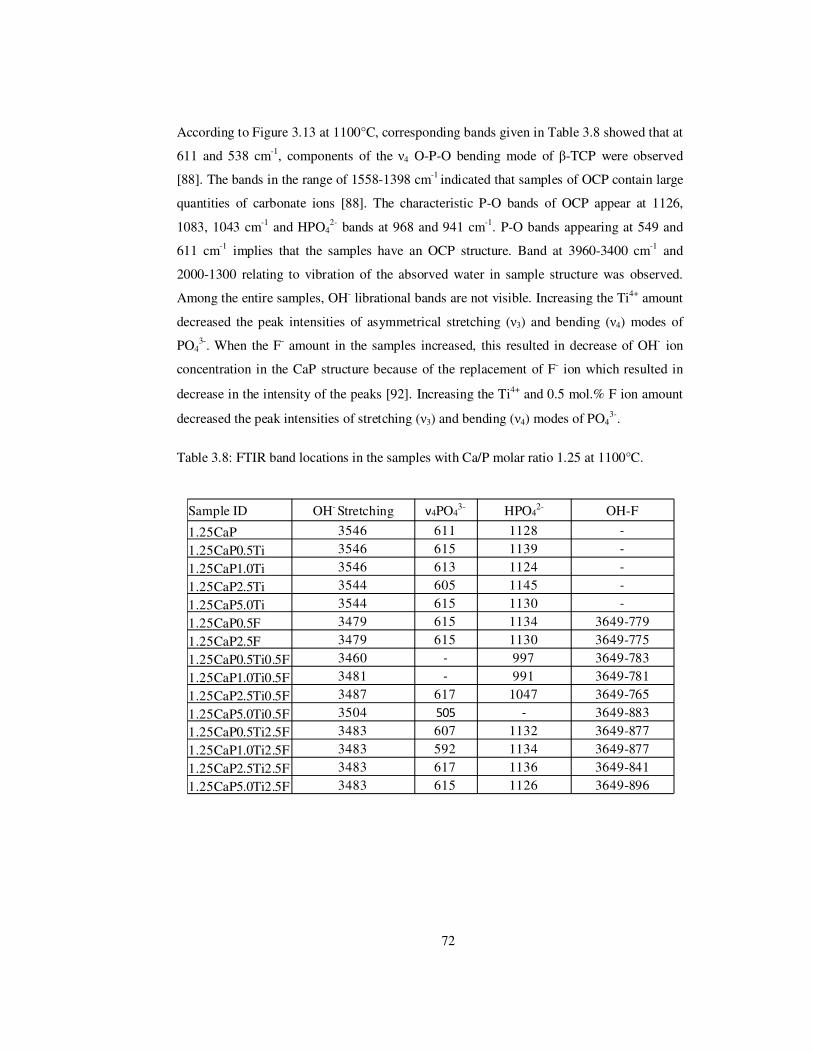
72
According to Figure 3.13 at 1100°C, corresponding bands given in Table 3.8 showed that at
611 and 538 cm-1, components of the ν4 O-P-O bending mode of β-TCP were observed
[88]. The bands in the range of 1558-1398 cm-1 indicated that samples of OCP contain large
quantities of carbonate ions [88]. The characteristic P-O bands of OCP appear at 1126,
1083, 1043 cm-1 and HPO42- bands at 968 and 941 cm-1. P-O bands appearing at 549 and
611 cm-1 implies that the samples have an OCP structure. Band at 3960-3400 cm-1 and
2000-1300 relating to vibration of the absorved water in sample structure was observed.
Among the entire samples, OH- librational bands are not visible. Increasing the Ti4+ amount
decreased the peak intensities of asymmetrical stretching (ν3) and bending (ν4) modes of
PO43-. When the F- amount in the samples increased, this resulted in decrease of OH- ion
concentration in the CaP structure because of the replacement of F- ion which resulted in
decrease in the intensity of the peaks [92]. Increasing the Ti4+ and 0.5 mol.% F ion amount
decreased the peak intensities of stretching (ν3) and bending (ν4) modes of PO43-.
Table 3.8: FTIR band locations in the samples with Ca/P molar ratio 1.25 at 1100°C.
Sample ID OH- Stretching ν4PO43- HPO4
2- OH-F
1.25CaP 3546 611 1128
1.25CaP0.5Ti 3546 615 1139
1.25CaP1.0Ti 3546 613 1124
1.25CaP2.5Ti 3544 605 1145
1.25CaP5.0Ti 3544 615 1130
1.25CaP0.5F 3479 615 1134 3649-779
1.25CaP2.5F 3479 615 1130 3649-775
1.25CaP0.5Ti0.5F 3460 997 3649-783
1.25CaP1.0Ti0.5F 3481 991 3649-781
1.25CaP2.5Ti0.5F 3487 617 1047 3649-765
1.25CaP5.0Ti0.5F 3504 505 3649-883
1.25CaP0.5Ti2.5F 3483 607 1132 3649-877
1.25CaP1.0Ti2.5F 3483 592 1134 3649-877
1.25CaP2.5Ti2.5F 3483 617 1136 3649-841
1.25CaP5.0Ti2.5F 3483 615 1126 3649-896
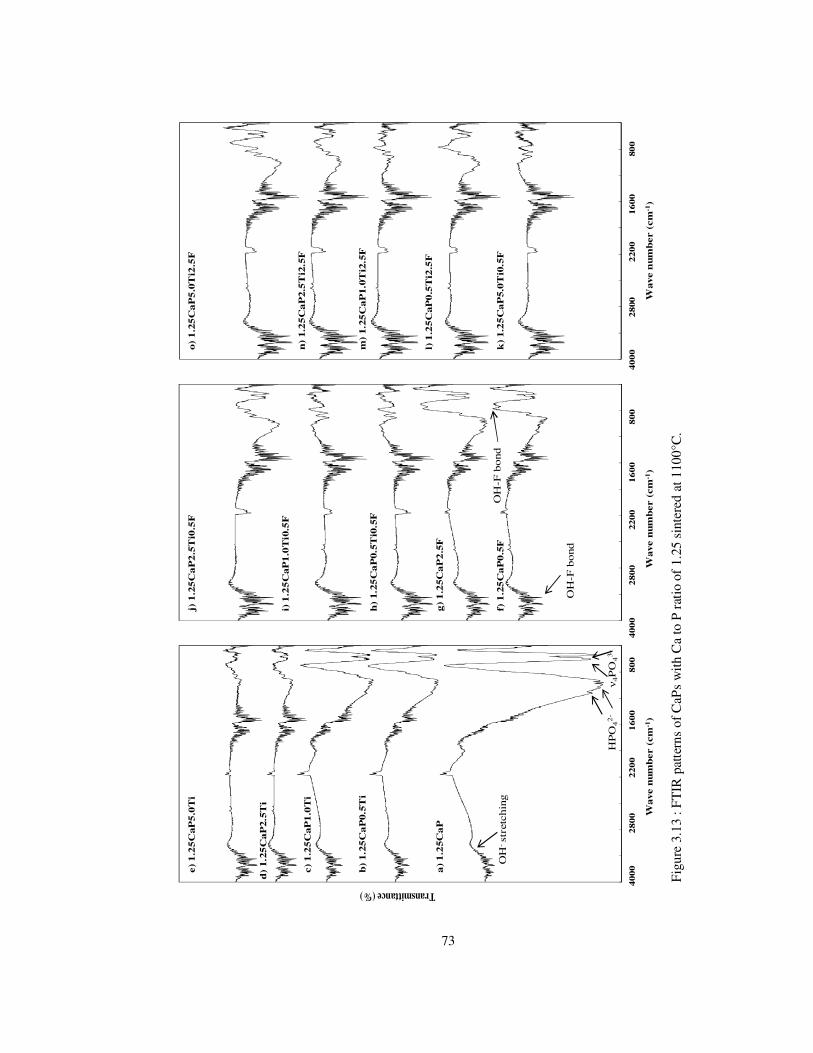
73
Transmittance (%)
40
00
2
80
0
2
20
0
16
00
80
0
Wave n
um
ber (
cm
-1)
40
00
2
80
0
22
00
1
60
0
80
0
Wave n
um
ber (
cm
-1)
40
00
2
800
22
00
1
60
0
80
0
Wave n
um
ber (
cm
-1)
a)
1.2
5C
aP
b)
1.2
5C
aP
0.5
Ti
c)
1.2
5C
aP
1.0
Ti
d)
1.2
5C
aP
2.5
Ti
e)
1.2
5C
aP
5.0
Ti
f) 1
.25
Ca
P0
.5F
g)
1.2
5C
aP
2.5
F
h)
1.2
5C
aP
0.5
Ti0
.5F
i) 1
.25
CaP
1.0
Ti0
.5F
j) 1
.25
Ca
P2
.5T
i0.5
F
k)
1.2
5C
aP
5.0
Ti0
.5F
l) 1
.25
CaP
0.5
Ti2
.5F
m)
1.2
5C
aP
1.0
Ti2
.5F
n)
1.2
5C
aP
2.5
Ti2
.5F
o)
1.2
5C
aP
5.0
Ti2
.5F
ν4P
O43
-
OH
-st
retc
hin
g
HP
O42
-
OH
-F b
ond
OH
-F b
ond
Fig
ure
3.13
: F
TIR
pat
tern
s of
CaP
s w
ith C
a to
P r
atio
of
1.25
sin
tere
d at
110
0°C
.
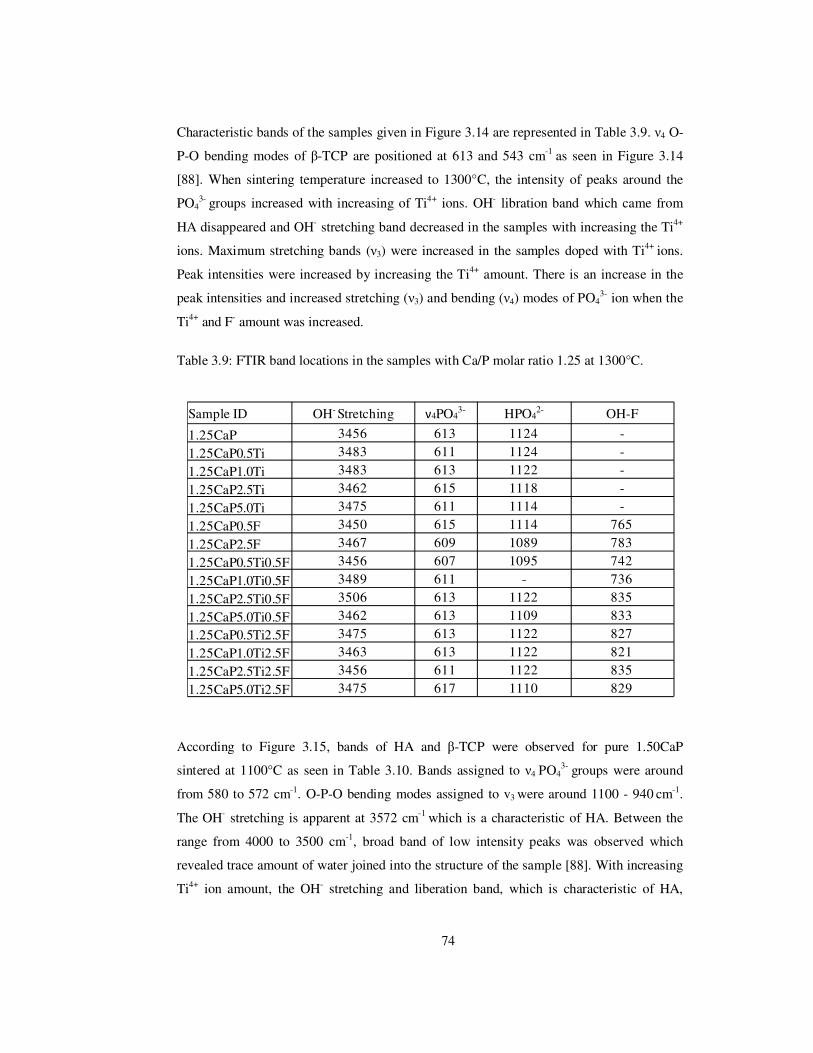
74
Characteristic bands of the samples given in Figure 3.14 are represented in Table 3.9. ν4 O-
P-O bending modes of β-TCP are positioned at 613 and 543 cm-1 as seen in Figure 3.14
[88]. When sintering temperature increased to 1300°C, the intensity of peaks around the
PO43- groups increased with increasing of Ti4+ ions. OH- libration band which came from
HA disappeared and OH- stretching band decreased in the samples with increasing the Ti4+
ions. Maximum stretching bands (ν3) were increased in the samples doped with Ti4+ ions.
Peak intensities were increased by increasing the Ti4+ amount. There is an increase in the
peak intensities and increased stretching (ν3) and bending (ν4) modes of PO43- ion when the
Ti4+ and F- amount was increased.
Table 3.9: FTIR band locations in the samples with Ca/P molar ratio 1.25 at 1300°C.
According to Figure 3.15, bands of HA and β-TCP were observed for pure 1.50CaP
sintered at 1100°C as seen in Table 3.10. Bands assigned to ν4 PO43- groups were around
from 580 to 572 cm-1. O-P-O bending modes assigned to v3 were around 1100 - 940 cm-1.
The OH- stretching is apparent at 3572 cm-1 which is a characteristic of HA. Between the
range from 4000 to 3500 cm-1, broad band of low intensity peaks was observed which
revealed trace amount of water joined into the structure of the sample [88]. With increasing
Ti4+ ion amount, the OH- stretching and liberation band, which is characteristic of HA,
Sample ID OH- Stretching ν4PO43- HPO4
2- OH-F
1.25CaP 3456 613 1124 -
1.25CaP0.5Ti 3483 611 1124 -
1.25CaP1.0Ti 3483 613 1122 -
1.25CaP2.5Ti 3462 615 1118 -
1.25CaP5.0Ti 3475 611 1114 -
1.25CaP0.5F 3450 615 1114 765
1.25CaP2.5F 3467 609 1089 783
1.25CaP0.5Ti0.5F 3456 607 1095 742
1.25CaP1.0Ti0.5F 3489 611 - 736
1.25CaP2.5Ti0.5F 3506 613 1122 835
1.25CaP5.0Ti0.5F 3462 613 1109 833
1.25CaP0.5Ti2.5F 3475 613 1122 827
1.25CaP1.0Ti2.5F 3463 613 1122 821
1.25CaP2.5Ti2.5F 3456 611 1122 835
1.25CaP5.0Ti2.5F 3475 617 1110 829
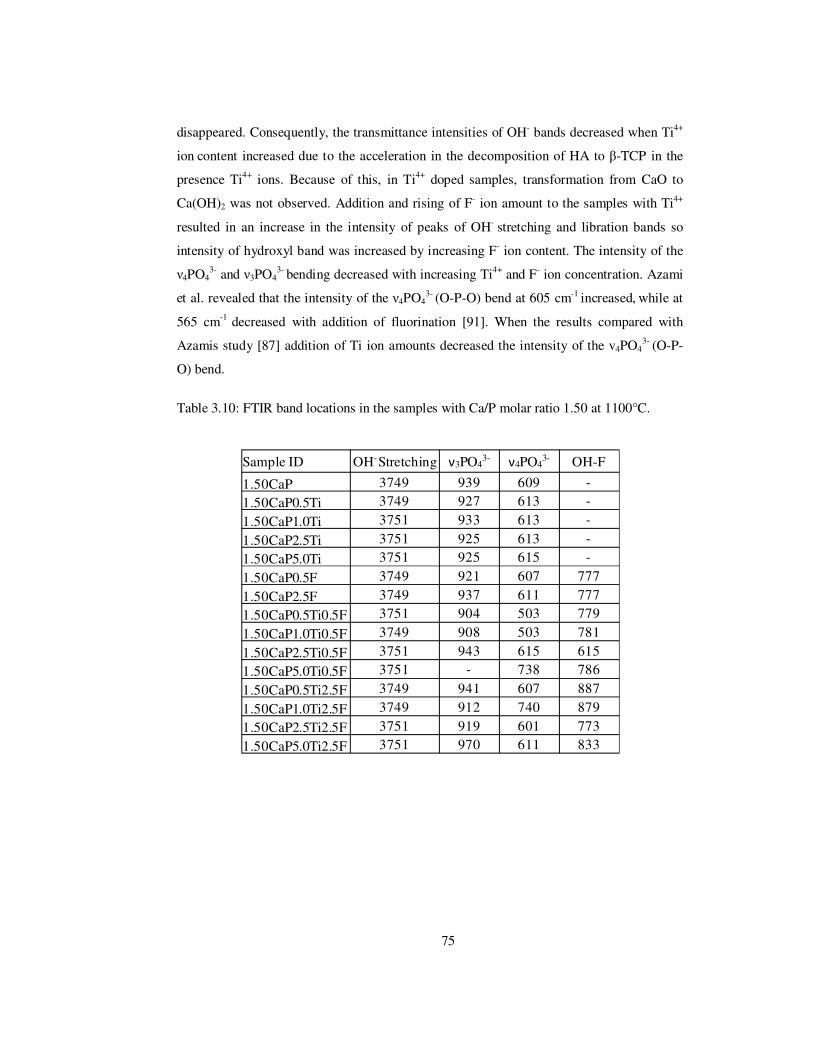
75
disappeared. Consequently, the transmittance intensities of OH- bands decreased when Ti4+
ion content increased due to the acceleration in the decomposition of HA to β-TCP in the
presence Ti4+ ions. Because of this, in Ti4+ doped samples, transformation from CaO to
Ca(OH)2 was not observed. Addition and rising of F- ion amount to the samples with Ti4+
resulted in an increase in the intensity of peaks of OH- stretching and libration bands so
intensity of hydroxyl band was increased by increasing F- ion content. The intensity of the
ν4PO43- and ν3PO4
3- bending decreased with increasing Ti4+ and F- ion concentration. Azami
et al. revealed that the intensity of the ν4PO43- (O-P-O) bend at 605 cm-1 increased, while at
565 cm-1 decreased with addition of fluorination [91]. When the results compared with
Azamis study [87] addition of Ti ion amounts decreased the intensity of the v4PO43- (O-P-
O) bend.
Table 3.10: FTIR band locations in the samples with Ca/P molar ratio 1.50 at 1100°C.
Sample ID OH-Stretching ν3PO43-
ν4PO43- OH-F
1.50CaP 3749 939 609
1.50CaP0.5Ti 3749 927 613
1.50CaP1.0Ti 3751 933 613
1.50CaP2.5Ti 3751 925 613
1.50CaP5.0Ti 3751 925 615
1.50CaP0.5F 3749 921 607 777
1.50CaP2.5F 3749 937 611 777
1.50CaP0.5Ti0.5F 3751 904 503 779
1.50CaP1.0Ti0.5F 3749 908 503 781
1.50CaP2.5Ti0.5F 3751 943 615 615
1.50CaP5.0Ti0.5F 3751 738 786
1.50CaP0.5Ti2.5F 3749 941 607 887
1.50CaP1.0Ti2.5F 3749 912 740 879
1.50CaP2.5Ti2.5F 3751 919 601 773
1.50CaP5.0Ti2.5F 3751 970 611 833

76
Transmittance (%)
40
00
2
80
0
22
00
16
00
8
00
Wa
ve n
um
ber
(cm
-1)
40
00
2
80
0
22
00
16
00
8
00
Wa
ve n
um
ber
(cm
-1)
40
00
2
80
0
22
00
16
00
8
00
Wa
ve n
um
ber
(cm
-1)
a)
1.2
5C
aP
b)
1.2
5C
aP
0.5
Ti
c)
1.2
5C
aP
1.0
Ti
d)
1.2
5C
aP
2.5
Ti
e)
1.2
5C
aP
5.0
Ti
f) 1
.25
Ca
P0
.5F
g)
1.2
5C
aP
2.5
F
h)
1.2
5C
aP
0.5
Ti0
.5F
i) 1
.25
Ca
P1
.0T
i0.5
F
j) 1
.25
Ca
P2
.5T
i0.5
F
k)
1.2
5C
aP
5.0
Ti0
.5F
l) 1
.25
Ca
P0
.5T
i2.5
F
m)
1.2
5C
aP
1.0
Ti2
.5F
n)
1.2
5C
aP
2.5
Ti2
.5F
o)
1.2
5C
aP
5.0
Ti2
.5F
ν4P
O43
-
OH
-st
retc
hing
HP
O42
-
OH
-F b
ond
Figu
re 3
.14:
FT
IR p
atte
rns
of C
aPs
with
Ca
to P
rat
io o
f 1.
25 s
inte
red
at 1
300°
C.
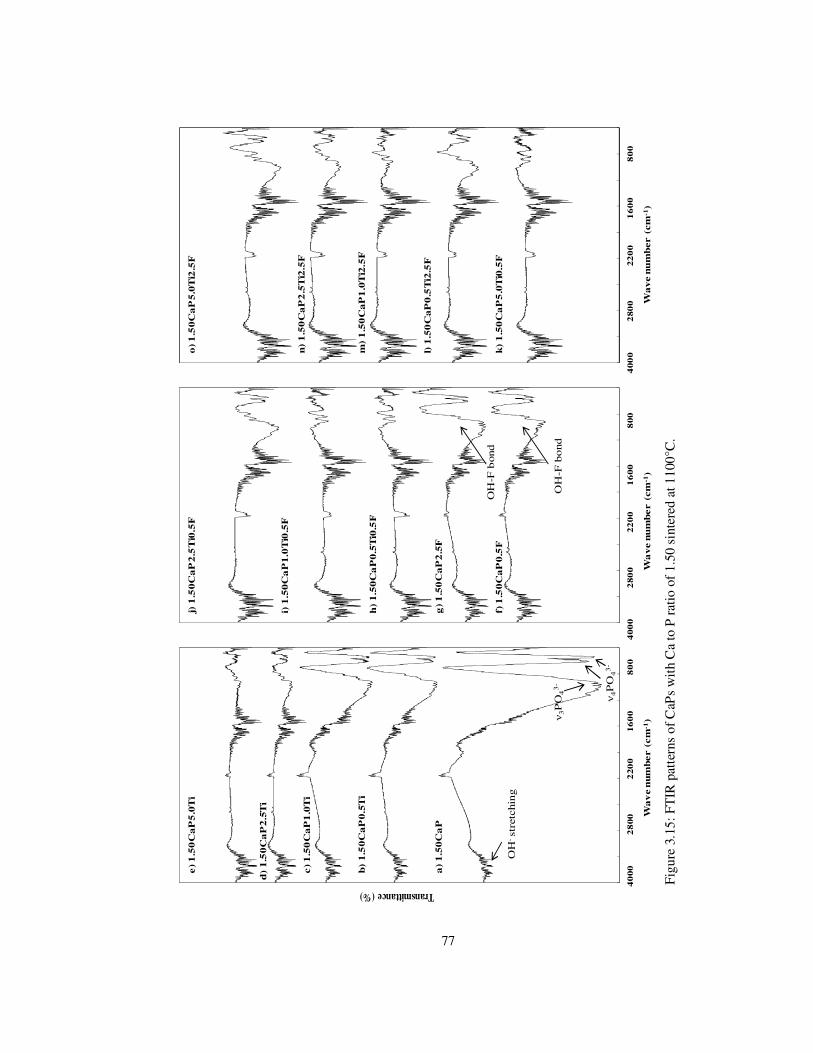
77
Transmittance (%)
40
00
2
80
0
22
00
16
00
8
00
Wa
ve n
um
ber
(cm
-1)
40
00
2
80
0
22
00
16
00
8
00
Wa
ve n
um
ber
(cm
-1)
40
00
2
80
0
22
00
16
00
8
00
Wa
ve n
um
ber
(cm
-1)
a)
1.5
0C
aP
b)
1.5
0C
aP
0.5
Ti
c)
1.5
0C
aP
1.0
Ti
d)
1.5
0C
aP
2.5
Ti
e)
1.5
0C
aP
5.0
Ti
f) 1
.50
Ca
P0
.5F
g)
1.5
0C
aP
2.5
F
h)
1.5
0C
aP
0.5
Ti0
.5F
i) 1
.50
Ca
P1
.0T
i0.5
F
j) 1
.50
Ca
P2
.5T
i0.5
F
k)
1.5
0C
aP
5.0
Ti0
.5F
l) 1
.50
Ca
P0
.5T
i2.5
F
m)
1.5
0C
aP
1.0
Ti2
.5F
n)
1.5
0C
aP
2.5
Ti2
.5F
o)
1.5
0C
aP
5.0
Ti2
.5F
ν4P
O4
3-
ν3P
O4
3-
OH
-st
retc
hin
g
OH
-F b
ond
OH
-F b
ond
Figu
re 3
.15:
FT
IR p
atte
rns
of C
aPs
wit
h C
a to
P r
atio
of
1.50
sin
tere
d at
110
0°C
.
78
According to Figure 3.16, bands given in Table 3.11, doped and undoped samples revealed
the characteristic bands of β-TCP and also a few bands of HA. The bands at 3905-3593 cm-
1 assigned to absorbed water in the samples. The bands at 615-553 cm-1 and 1118-1035 cm-1
were attributed to the ν4PO43- O-P-O bending mode and ν3PO4
3- antisymmetric P-O
stretching mode, respectively. The intensity of peaks around the ν1PO43- P-O symmetric
stretching increased with increasing Ti4+ ions.
In the samples doped with F- ions, the spectrum obtained was characteristic of β-TCP/HA.
Increasing the F- ion addition triggered the peak intensities. The intensity of the peak at 796
cm-1 raised up with increasing F- amount in the samples and also OH-F bonding was visible
in this sample. This is due to the fact that F- ion replaces with OH- ion in the CaP structure.
The characteristic bands of β-TCP and HA were observed in the doped samples. The
intensity of the ν4PO43- and ν3PO4
3- bending raised with increasing Ti4+ and 0.5F- doped
samples. However, increasing the Ti4+ ions and F- amount to 2.5 mol.% resulted in
decreasing the peak intensities. Thus, it can be said that increasing the degree of
fluorination in the samples with 0.5 mol.% to 5.0 mol.% Ti4+ amounts resulted in a decrease
in the intensity of the peaks.
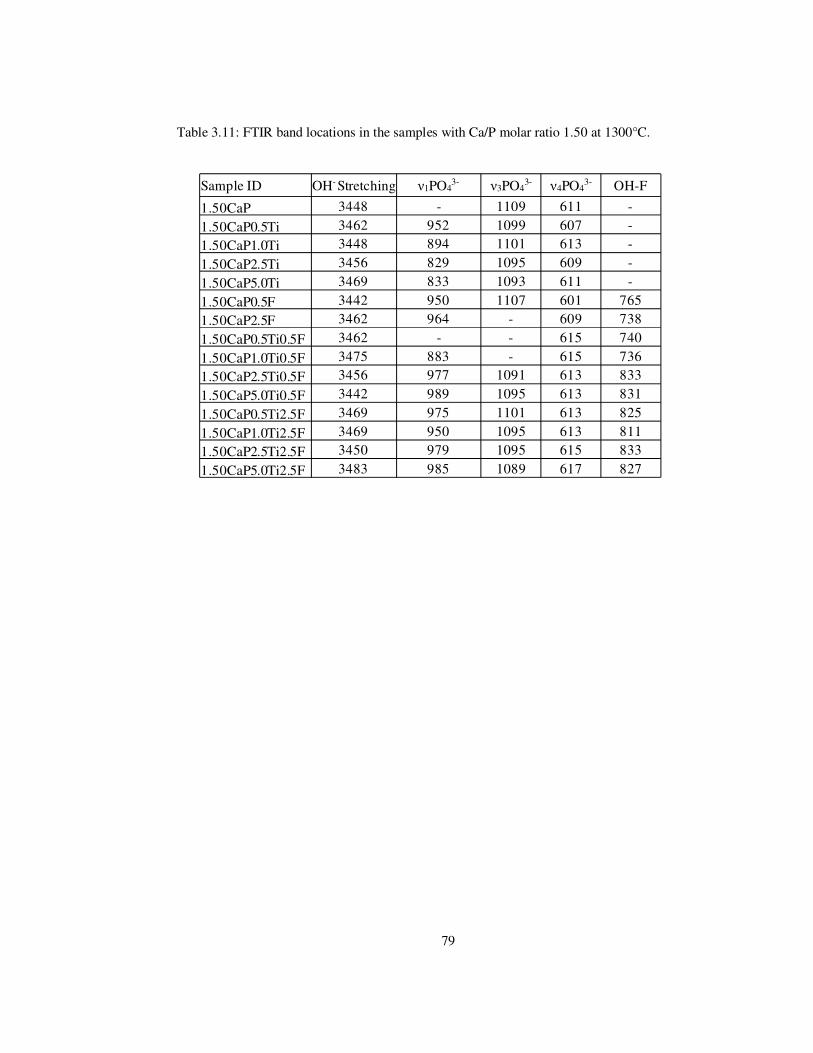
79
Table 3.11: FTIR band locations in the samples with Ca/P molar ratio 1.50 at 1300°C.
Sample ID OH- Stretching ν1PO43- ν3PO4
3- ν4PO43- OH-F
1.50CaP 3448 - 1109 611 -
1.50CaP0.5Ti 3462 952 1099 607 -
1.50CaP1.0Ti 3448 894 1101 613 -
1.50CaP2.5Ti 3456 829 1095 609 -
1.50CaP5.0Ti 3469 833 1093 611 -
1.50CaP0.5F 3442 950 1107 601 765
1.50CaP2.5F 3462 964 - 609 738
1.50CaP0.5Ti0.5F 3462 - - 615 740
1.50CaP1.0Ti0.5F 3475 883 - 615 736
1.50CaP2.5Ti0.5F 3456 977 1091 613 833
1.50CaP5.0Ti0.5F 3442 989 1095 613 831
1.50CaP0.5Ti2.5F 3469 975 1101 613 825
1.50CaP1.0Ti2.5F 3469 950 1095 613 811
1.50CaP2.5Ti2.5F 3450 979 1095 615 833
1.50CaP5.0Ti2.5F 3483 985 1089 617 827
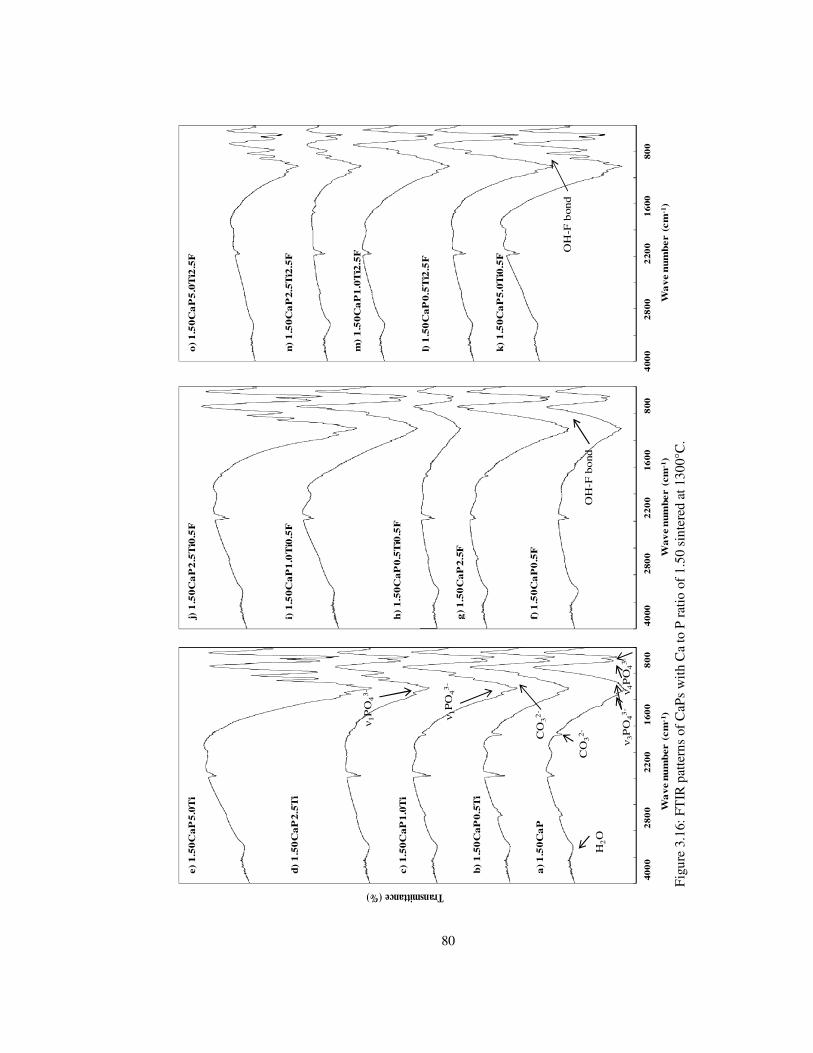
80
40
00
2
80
0
2
20
0
16
00
8
00
Wa
ve n
um
ber
(cm
-1)
Transmittance (%)
40
00
2
80
0
22
00
16
00
8
00
40
00
2
80
0
22
00
16
00
80
0
Wa
ve
nu
mb
er
(cm
-1)
Wa
ve n
um
ber
(cm
-1)
a)
1.5
0C
aP
b)
1.5
0C
aP
0.5
Ti
c) 1
.50
Ca
P1
.0T
i
d)
1.5
0C
aP
2.5
Ti
e) 1
.50
Ca
P5
.0T
i
f) 1
.50
Ca
P0
.5F
g)
1.5
0C
aP
2.5
F
h)
1.5
0C
aP
0.5
Ti0
.5F
i) 1
.50
Ca
P1
.0T
i0.5
F
j) 1
.50
Ca
P2
.5T
i0.5
F
k)
1.5
0C
aP
5.0
Ti0
.5F
l) 1
.50
Ca
P0
.5T
i2.5
F
m)
1.5
0C
aP
1.0
Ti2
.5F
n)
1.5
0C
aP
2.5
Ti2
.5F
o)
1.5
0C
aP
5.0
Ti2
.5F
ν 4P
O4
3-
ν3P
O4
3-
OH
-F b
ond
OH
-F b
ond
ν 1P
O4
3-
ν 1P
O4
3-
H2O
CO
32
-
CO
32
-
Fig
ure
3.16
: FT
IR p
atte
rns
of C
aPs
with
Ca
to P
rat
io o
f 1.
50 s
inte
red
at 1
300°
C.
81
FTIR spectra of the pure and doped HA samples sintered at 1100°C and 1300°C for 1h are
given in Figures 3.17-3.18.
As shown in Figure 3.17, bands given in Table 3.12, for all samples sintered at 1100°C, the
FTIR spectra of the characteristic absorption bands of HA are observed. The two bands at
3571 and 634 cm-1 belong to the OH- liberation vibration mode. OH- absorption bands
appear at 2200-1600 cm-1 showed high amount of dehydroxylation. The asymmetrical
stretching (ν3), bending (ν4) and (ν1) modes of PO43- ion are detected at around 1047 and
1091 cm-1, 572 and 601 cm-1, and 966 cm-1, respectively. The bands at 1541-1508 cm-1 and
956 cm-1 correspond to the ν3 and ν2 stretching vibrations of the carbonate groups,
respectively. These peaks demonstrate that the HA encloses some CO32- groups in PO4
3-
sites of apatite lattice [104]. Because of the presence of carbonates in the constituents of
hard tissues, existence of low amount of CO32- can enhance the bioactivity of HA [104].
Table 3.12: Frequencies and assignments of CaPs.
Assignment Infrared Frequency (cm-1) Ref. #
OH- (stretching) 3571.6 [88]
OH- (libration) 631.7 [88]
Adsorbed water ~3300-3600 [88]
υ4PO43- (O-P-O) bend 571,611 [88]
υ3PO43- (P-O) stretch 1092 and 1040 [88]
υ2PO43- (O-P-O) bend ~462-474 [88]
υ1PO43- (P-O) bend 961 [88]
OH- F bond ~ 720 and 3570 [89][90]
OH- stretching and libration band which are characteristics of HA were disappeared by
increasing the Ti4+ amount. Increasing the Ti4+ amount decreased the peak intensities of
asymmetrical stretching (ν3) and bending (ν4) modes of PO43-. Samples doped with F- ions
revealed no difference in the intensity of the peaks of OH stretching. When the F- amount
in the samples increased, this resulted in increased peak intensities. Addition of Ti4+ and F-
ion decreased the peak intensities. OH- libration and stretching band decreased in the
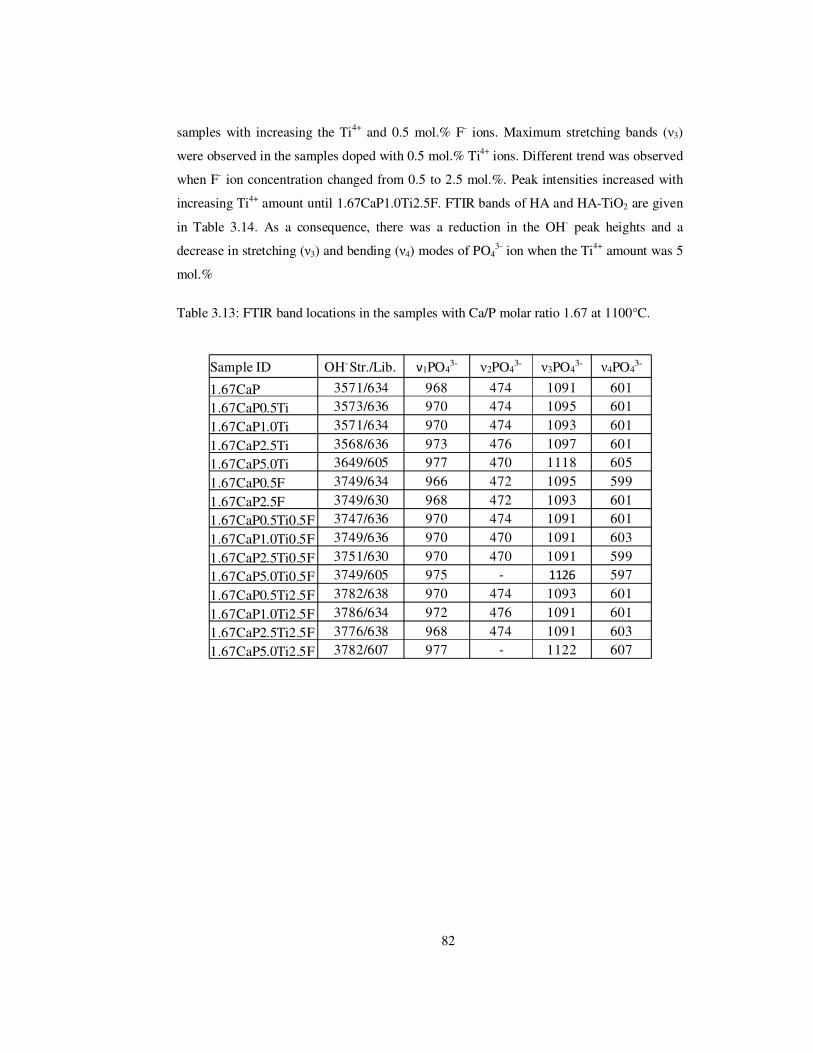
82
samples with increasing the Ti4+ and 0.5 mol.% F- ions. Maximum stretching bands (ν3)
were observed in the samples doped with 0.5 mol.% Ti4+ ions. Different trend was observed
when F- ion concentration changed from 0.5 to 2.5 mol.%. Peak intensities increased with
increasing Ti4+ amount until 1.67CaP1.0Ti2.5F. FTIR bands of HA and HA-TiO2 are given
in Table 3.14. As a consequence, there was a reduction in the OH- peak heights and a
decrease in stretching (ν3) and bending (ν4) modes of PO43- ion when the Ti4+ amount was 5
mol.%
Table 3.13: FTIR band locations in the samples with Ca/P molar ratio 1.67 at 1100°C.
Sample ID OH-Str./Lib. ν1PO43- ν2PO4
3- ν3PO43- ν4PO4
3-
1.67CaP 3571/634 968 474 1091 601
1.67CaP0.5Ti 3573/636 970 474 1095 601
1.67CaP1.0Ti 3571/634 970 474 1093 601
1.67CaP2.5Ti 3568/636 973 476 1097 601
1.67CaP5.0Ti 3649/605 977 470 1118 605
1.67CaP0.5F 3749/634 966 472 1095 599
1.67CaP2.5F 3749/630 968 472 1093 601
1.67CaP0.5Ti0.5F 3747/636 970 474 1091 601
1.67CaP1.0Ti0.5F 3749/636 970 470 1091 603
1.67CaP2.5Ti0.5F 3751/630 970 470 1091 599
1.67CaP5.0Ti0.5F 3749/605 975 1126 597
1.67CaP0.5Ti2.5F 3782/638 970 474 1093 601
1.67CaP1.0Ti2.5F 3786/634 972 476 1091 601
1.67CaP2.5Ti2.5F 3776/638 968 474 1091 603
1.67CaP5.0Ti2.5F 3782/607 977 1122 607

83
Table 3.14: FTIR bands of HA and HA-TiO2 [105] .
Assignment HA (Inf. Freq.(cm-1)) HA-TiO2 (Inf. Freq.(cm-1))
OH- 1629 1629
O-H 3455 3421
O-H 3633 3566
υ1PO43- - 961
υ2CO32- 872 884
υ3PO43- 1039 1039
υ4PO43- 572 605
υ1 (O-H) 627 636
υ3CO32- 1418 -
υ3CO32- 1478 1476
According to the FTIR spectra given in Figure 3.18, bands given in Table 3.14, sintered at
1300°C, main characteristic peaks of HA are observed. OH- libration band at 626 cm-1
almost disappeared in the doped HAs. OH stretching band detected in all samples except
for 1.67CaP5.0Ti and the magnitude decreased with the addition of Ti4+ and F- ions.
Stretching (ν3) and bending (ν4) modes of PO43- ion were observed in the samples. The
broad band of low intensity peaks was visible in the range of 3940-3490 and 1955-1300 in
the doped samples with Ti4+ and 0.5, 2.5F%. Thus, it is possible to say that trace amount of
water was incorporated into the structure of the samples.
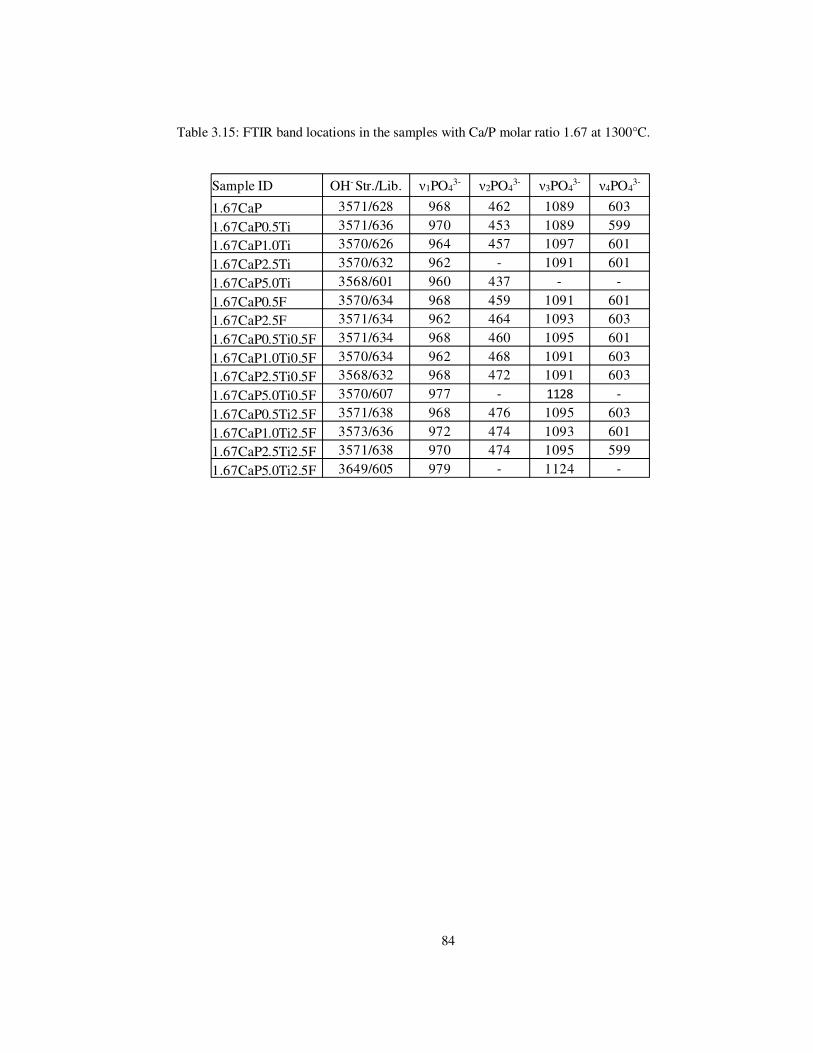
84
Table 3.15: FTIR band locations in the samples with Ca/P molar ratio 1.67 at 1300°C.
Sample ID OH- Str./Lib. ν1PO43- ν2PO4
3- ν3PO43- ν4PO4
3-
1.67CaP 3571/628 968 462 1089 603
1.67CaP0.5Ti 3571/636 970 453 1089 599
1.67CaP1.0Ti 3570/626 964 457 1097 601
1.67CaP2.5Ti 3570/632 962 1091 601
1.67CaP5.0Ti 3568/601 960 437
1.67CaP0.5F 3570/634 968 459 1091 601
1.67CaP2.5F 3571/634 962 464 1093 603
1.67CaP0.5Ti0.5F 3571/634 968 460 1095 601
1.67CaP1.0Ti0.5F 3570/634 962 468 1091 603
1.67CaP2.5Ti0.5F 3568/632 968 472 1091 603
1.67CaP5.0Ti0.5F 3570/607 977 1128
1.67CaP0.5Ti2.5F 3571/638 968 476 1095 603
1.67CaP1.0Ti2.5F 3573/636 972 474 1093 601
1.67CaP2.5Ti2.5F 3571/638 970 474 1095 599
1.67CaP5.0Ti2.5F 3649/605 979 1124

85
Transmittance (%)
40
00
2
80
0
22
00
16
00
8
00
Wa
ve n
um
ber
(cm
-1)
40
00
2
80
0
22
00
16
00
8
00
Wa
ve n
um
ber
(cm
-1)
40
00
2
80
0
22
00
16
00
8
00
Wa
ve n
um
ber
(cm
-1)
a)
1.6
7C
aP
b)
1.6
7C
aP
0.5
Ti
c)
1.6
7C
aP
1.0
Ti
d)
1.6
7C
aP
2.5
Ti
e)
1.6
7C
aP
5.0
Ti
f) 1
.67
Ca
P0
.5F
g)
1.6
7C
aP
2.5
F
h)
1.6
7C
aP
0.5
Ti0
.5F
i) 1
.67
Ca
P1
.0T
i0.5
F
j) 1
.67
Ca
P2
.5T
i0.5
F
k)
1.6
7C
aP
5.0
Ti0
.5F
l) 1
.67
Ca
P0
.5T
i2.5
F
m)
1.6
7C
aP
1.0
Ti2
.5F
n)
1.6
7C
aP
2.5
Ti2
.5F
o)
1.6
7C
aP
5.0
Ti2
.5F
OH
-st
retc
hin
g
OH
-li
bra
tional
ν4P
O4
3-
ν3P
O43
-
ν2P
O4
3-
ν1P
O43
-
Figu
re 3
.17:
FT
IR p
atte
rns
of C
aPs
with
Ca
to P
rat
io o
f 1.
67 s
inte
red
at 1
100°
C.
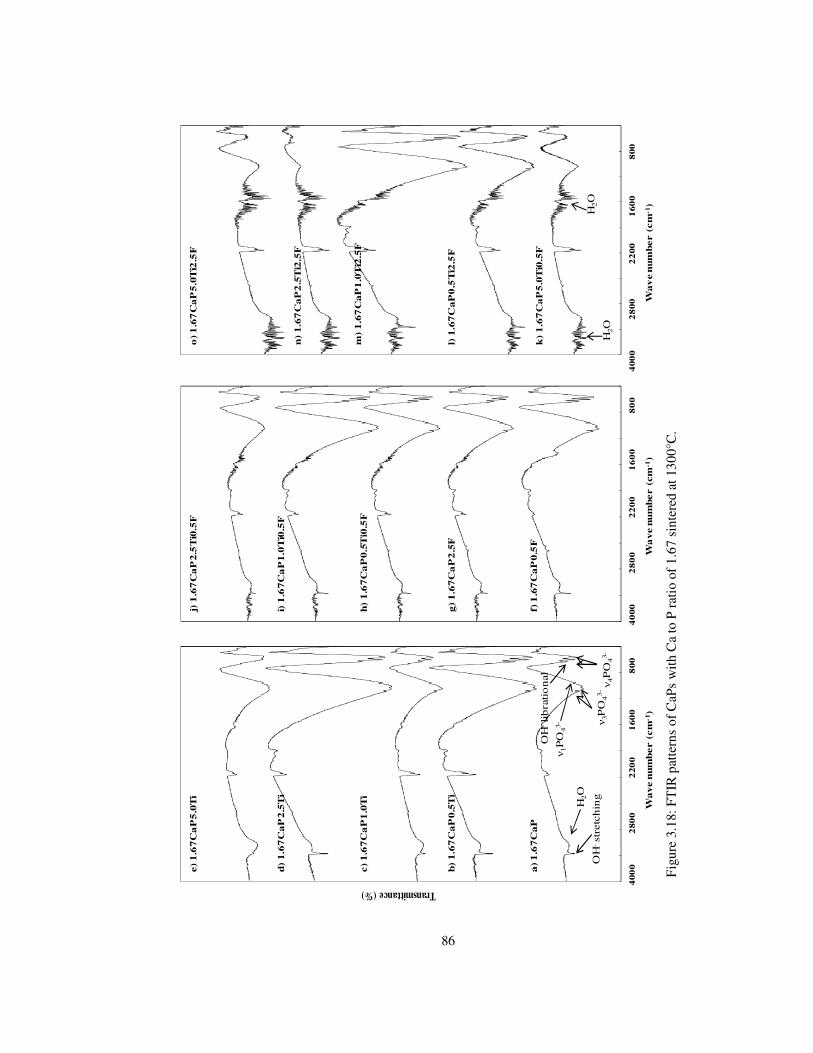
86
a)
1.6
7C
aP
b)
1.6
7C
aP
0.5
Ti
c)
1.6
7C
aP
1.0
Ti
d)
1.6
7C
aP
2.5
Ti
e)
1.6
7C
aP
5.0
Ti
f) 1
.67
Ca
P0
.5F
g)
1.6
7C
aP
2.5
F
h)
1.6
7C
aP
0.5
Ti0
.5F
i) 1
.67
Ca
P1
.0T
i0.5
F
j) 1
.67
Ca
P2
.5T
i0.5
F
k)
1.6
7C
aP
5.0
Ti0
.5F
l) 1
.67
Ca
P0
.5T
i2.5
F
m)
1.6
7C
aP
1.0
Ti2
.5F
n)
1.6
7C
aP
2.5
Ti2
.5F
o)
1.6
7C
aP
5.0
Ti2
.5F
Transmittance (%)
40
00
2
80
0
22
00
16
00
8
00
Wa
ve n
um
ber
(cm
-1)
40
00
2
80
0
22
00
16
00
8
00
40
00
2
80
0
22
00
16
00
8
00
Wa
ve n
um
ber
(cm
-1)
Wa
ve n
um
ber
(cm
-1)
ν4P
O43-
OH
-li
bra
tio
nal
ν3P
O43-
ν1P
O43
-
OH
-st
retc
hin
g
H2O
H2O
H2O
Fig
ure
3.18
: FT
IR p
atte
rns
of C
aPs
with
Ca
to P
rat
io o
f 1.
67 s
inte
red
at 1
300°
C.
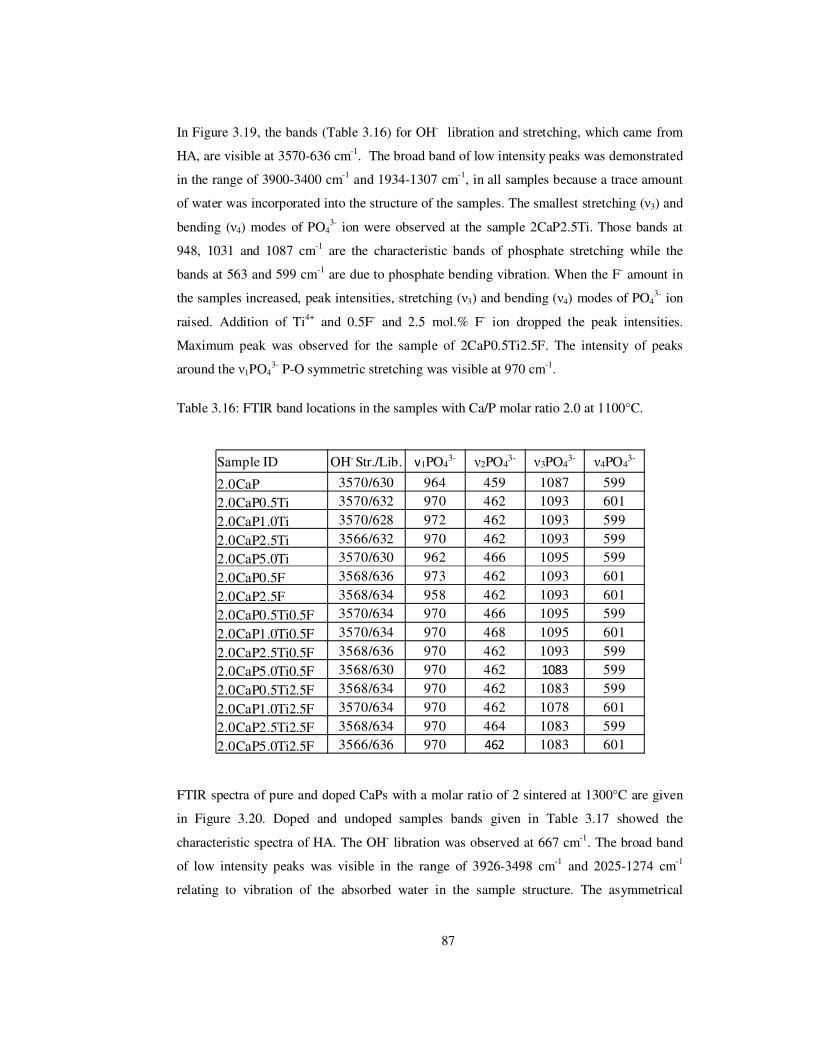
87
In Figure 3.19, the bands (Table 3.16) for OH- libration and stretching, which came from
HA, are visible at 3570-636 cm-1. The broad band of low intensity peaks was demonstrated
in the range of 3900-3400 cm-1 and 1934-1307 cm-1, in all samples because a trace amount
of water was incorporated into the structure of the samples. The smallest stretching (ν3) and
bending (ν4) modes of PO43- ion were observed at the sample 2CaP2.5Ti. Those bands at
948, 1031 and 1087 cm-1 are the characteristic bands of phosphate stretching while the
bands at 563 and 599 cm-1 are due to phosphate bending vibration. When the F- amount in
the samples increased, peak intensities, stretching (ν3) and bending (ν4) modes of PO43- ion
raised. Addition of Ti4+ and 0.5F- and 2.5 mol.% F- ion dropped the peak intensities.
Maximum peak was observed for the sample of 2CaP0.5Ti2.5F. The intensity of peaks
around the ν1PO43- P-O symmetric stretching was visible at 970 cm-1.
Table 3.16: FTIR band locations in the samples with Ca/P molar ratio 2.0 at 1100°C.
FTIR spectra of pure and doped CaPs with a molar ratio of 2 sintered at 1300°C are given
in Figure 3.20. Doped and undoped samples bands given in Table 3.17 showed the
characteristic spectra of HA. The OH- libration was observed at 667 cm-1. The broad band
of low intensity peaks was visible in the range of 3926-3498 cm-1 and 2025-1274 cm-1
relating to vibration of the absorbed water in the sample structure. The asymmetrical
Sample ID OH- Str./Lib. ν1PO43- ν2PO4
3- ν3PO43- ν4PO4
3-
2.0CaP 3570/630 964 459 1087 599
2.0CaP0.5Ti 3570/632 970 462 1093 601
2.0CaP1.0Ti 3570/628 972 462 1093 599
2.0CaP2.5Ti 3566/632 970 462 1093 599
2.0CaP5.0Ti 3570/630 962 466 1095 599
2.0CaP0.5F 3568/636 973 462 1093 601
2.0CaP2.5F 3568/634 958 462 1093 601
2.0CaP0.5Ti0.5F 3570/634 970 466 1095 599
2.0CaP1.0Ti0.5F 3570/634 970 468 1095 601
2.0CaP2.5Ti0.5F 3568/636 970 462 1093 599
2.0CaP5.0Ti0.5F 3568/630 970 462 1083 599
2.0CaP0.5Ti2.5F 3568/634 970 462 1083 599
2.0CaP1.0Ti2.5F 3570/634 970 462 1078 601
2.0CaP2.5Ti2.5F 3568/634 970 464 1083 599
2.0CaP5.0Ti2.5F 3566/636 970 462 1083 601
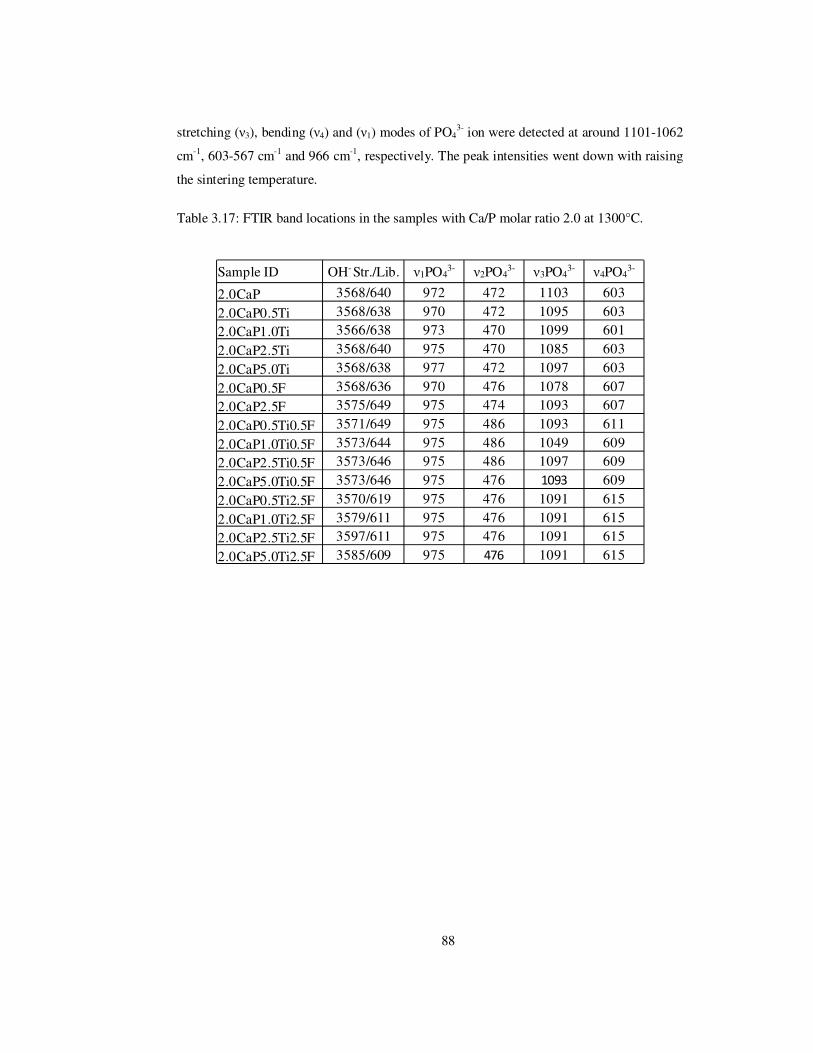
88
stretching (ν3), bending (ν4) and (ν1) modes of PO43- ion were detected at around 1101-1062
cm-1, 603-567 cm-1 and 966 cm-1, respectively. The peak intensities went down with raising
the sintering temperature.
Table 3.17: FTIR band locations in the samples with Ca/P molar ratio 2.0 at 1300°C.
Sample ID OH- Str./Lib. ν1PO43- ν2PO4
3- ν3PO43- ν4PO4
3-
2.0CaP 3568/640 972 472 1103 603
2.0CaP0.5Ti 3568/638 970 472 1095 603
2.0CaP1.0Ti 3566/638 973 470 1099 601
2.0CaP2.5Ti 3568/640 975 470 1085 603
2.0CaP5.0Ti 3568/638 977 472 1097 603
2.0CaP0.5F 3568/636 970 476 1078 607
2.0CaP2.5F 3575/649 975 474 1093 607
2.0CaP0.5Ti0.5F 3571/649 975 486 1093 611
2.0CaP1.0Ti0.5F 3573/644 975 486 1049 609
2.0CaP2.5Ti0.5F 3573/646 975 486 1097 609
2.0CaP5.0Ti0.5F 3573/646 975 476 1093 609
2.0CaP0.5Ti2.5F 3570/619 975 476 1091 615
2.0CaP1.0Ti2.5F 3579/611 975 476 1091 615
2.0CaP2.5Ti2.5F 3597/611 975 476 1091 615
2.0CaP5.0Ti2.5F 3585/609 975 476 1091 615

89
Transmittance (%)
40
00
2
80
0
22
00
16
00
8
00
Wa
ve n
um
ber
(cm
-1)
40
00
2
80
0
22
00
16
00
8
00
Wa
ve n
um
ber
(cm
-1)
40
00
2
80
0
22
00
16
00
8
00
Wa
ve n
um
ber
(cm
-1)
a)
2C
aP
b)
2C
aP
0.5
Ti
c)
2C
aP
1.0
Ti
d)
2C
aP
2.5
Ti
e)
2C
aP
5.0
Ti
f) 2
Ca
P0
.5F
g)
2C
aP
2.5
F
h)
2C
aP
0.5
Ti0
.5F
i) 2
Ca
P1
.0T
i0.5
F
j) 2
Ca
P2
.5T
i0.5
F
k)
2C
aP
5.0
Ti0
.5F
l) 2
Ca
P0
.5T
i2.5
F
m)
2C
aP
1.0
Ti2
.5F
n)
2C
aP
2.5
Ti2
.5F
o)
2C
aP
5.0
Ti2
.5F
ν4P
O43-
OH
-st
retc
hin
g
H2O
H2Oν
3P
O43-
ν1P
O43-
OH
-li
bra
tio
nal
Figu
re 3
.19:
FT
IR p
atte
rns
of C
aPs
wit
h C
a to
P r
atio
of
2.0
sint
ered
at 1
100°
C.
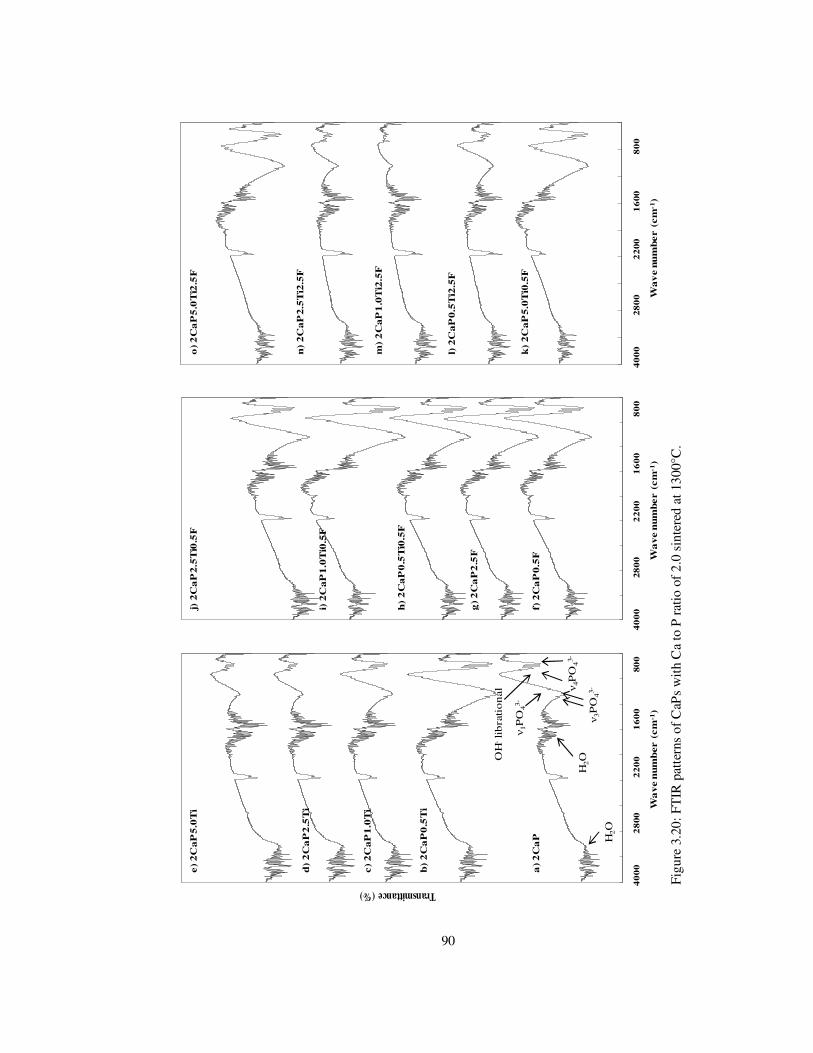
90
a)
2C
aP
b)
2C
aP
0.5
Ti
c)
2C
aP
1.0
Ti
d)
2C
aP
2.5
Ti
e)
2C
aP
5.0
Ti
f) 2
Ca
P0
.5F
g)
2C
aP
2.5
F
h)
2C
aP
0.5
Ti0
.5F
i) 2
Ca
P1
.0T
i0.5
F
j) 2
Ca
P2
.5T
i0.5
F
k)
2C
aP
5.0
Ti0
.5F
l) 2
Ca
P0
.5T
i2.5
F
m)
2C
aP
1.0
Ti2
.5F
n)
2C
aP
2.5
Ti2
.5F
o)
2C
aP
5.0
Ti2
.5F
Transmittance (%)
40
00
2
800
22
00
16
00
80
04
00
0
28
00
22
00
16
00
8
00
40
00
28
00
2
200
16
00
8
00
Wa
ve n
um
ber
(cm
-1)
Wa
ve n
um
ber
(cm
-1)
Wa
ve n
um
ber
(cm
-1)
H2O
H2O
ν3P
O43-
ν1P
O43
-
OH
-li
bra
tio
nal ν
4PO
43-
Figu
re 3
.20:
FT
IR p
atte
rns
of C
aPs
wit
h C
a to
P r
atio
of
2.0
sint
ered
at 1
300°
C.

91
3.2.3 Scanning Electron Microscopy
SEM images of pure and doped CaPs sintered at 1100°C and 1300°C are given in Figures
3.21-3.30. The morphology of the doped and undoped samples were inspected.
SEM images revealed that temperature and ion amounts of dopants had significant effect on
grain sizes of the samples. According to Wang et al. sintering has three stages: First stage,
due to low-density of green body and lacking in physical integrity, little amount of
adhesion among adjacent particles [113]. Second stage, at the connection points among the
particles necks begings to appear. The last stage started when the pores closed [113].
It was seen from SEM images that the CaPs sintered at 1100°C had more uniform
microstructures and fine grains. There is a relationship between amount of dopant and
sintering temperature with grain sizes of apatites [86]. It was reported that HA had nanosize
grains after sintering at 900°C and 1100°C, while there is a severe grain growth after the
sintering at 1300°C [86].
After the sintering at 1100°C, pure CaPs with molar a ratio of 1 had the smallest grain size
when compared to doped CaPs with the same molar ratio. Doping the samples with Ti4+
triggered the enlargement of the grain sizes and large pores at 1100°C. Sample with
1CaP5.0Ti had the porous structure which indicated in the literature that porous CPP
ceramics have the better mechanical properties [94]. Increasing the Ti4+ amount from 0.5 to
5.0 mol.% resulted in an enlargement of grain sizes of the materials at 1100°C and 1300°C.
Because high sintering temperature provides the activation energy for grain growth [34].
With the addition of F- ions, the grain sizes of the samples were increased (Figure 3.22).
According to SEM images, structure of the samples with F- ions are denser. This result is in
relevance with micro-hardness result which shows that doping of the samples with F- ions
causes an increase in hardness at 1300°C whereas a decrease at 1100°C.
Doped CaPs with Ti4+ and F- ions, had grain sizes which represent mixed behavior after the
sintering at 1100°C and 1300°C. It was clearly seen that average grain sizes of the doped
samples were increased by Ti4+ and F- ion addition.

92
According to Figure 3.22 it is obvious that grain size of the samples at 1300°C exhibited
severe increases when compared to low sintering temperature. It could be concluded that
increasing the sintering temperature has an important effect on the change in grain size of
the samples. Samples of 1.0CaP, 1CaP5.0Ti, 1.0CaP0.5F and 1.0CaP1.0Ti2.5F melted at
1300°C due to eutectic appearence at melting temperatures of 1280°C, 1287°C and 1300°C
[109] .
When sintering temperature was changed from 1100°C to 1300°C, the grain sizes were
increased by a factor between 3 and 6 when Ti4+ added, factor of 3 when F- added, of factor
8 when doped with Ti4+ and 0.5F and factors of 9, 11 and 29 when Ti4+ and 2.5F were
added into the samples, respectively. Ramesh et al. revealed that when sintering
temperature changed from 1150°C to 1300°C, the average grain size increased by a factor
of more than 7 [54]. High sintering temperatures trigger the grain growth. Because
increasing the sintering temperature raised the grain sizes through high temperature grain
growth [108]. In the present study, it was seen that increasing sintering temperature caused
an increase in the grain size of CaP with molar ratio of 1. Samples with 1CaP0.5Ti0.5F,
1CaP2.5Ti0.5F and 1CaP5.0Ti2.5F had porous structure at 1100°C. With increasing the
sintering temperature to 1300°C, necks were observed in the samples (second stage of
sintering) and grain shapes increased which led to isolated pores. According to the SEM
images and average grain sizes, it can be concluded that increasing the sintering
temperature had a significant effect on the grain sizes of the materials.
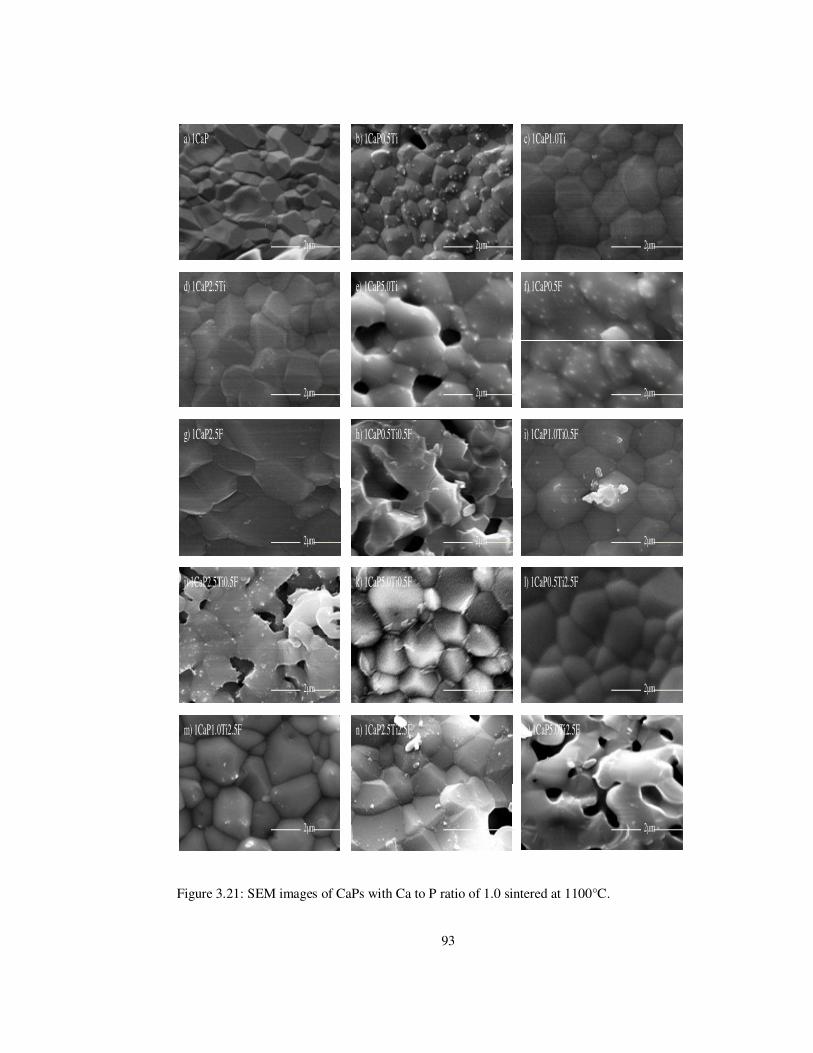
93
Figure 3.21: SEM images of CaPs with Ca to P ratio of 1.0 sintered at 1100°C.
a) 1CaPa) 1CaP b) 1CaP0.5Ti c) 1CaP1.0Ti
2µm 2µm
2µm
d) 1CaP2.5Ti
2µm
2µm
b) 1CaP0.5Ti
e) 1CaP5.0Ti f) 1CaP0.5F
2µm
g) 1CaP2.5F
2µm
h) 1CaP0.5Ti0.5F
2µm
i) 1CaP1.0Ti0.5F
2µm
j) 1CaP2.5Ti0.5F
2µm
k) 1CaP5.0Ti0.5F
2µm
l) 1CaP0.5Ti2.5F
2µm
m) 1CaP1.0Ti2.5F
2µm
n) 1CaP2.5Ti2.5F
2µm
o) 1CaP5.0Ti2.5F
2µm

94
Figure 3.22: SEM images of CaPs with Ca to P ratio of 1.0 sintered at 1300°C.
a) 1CaP
2µ
a) 1CaP
10µm
b) 1CaP0.5Ti
10µm
c) 1CaP1.0Ti
10µm
d) 1CaP2.5Ti
10µm
e) 1CaP5.0Ti
10µm
f) 1CaP0.5F
g) 1CaP2.5F
10µm
h) 1CaP0.5Ti0.5F
10µm
i) 1CaP1.0Ti0.5F
10µm
10µm
j) 1CaP2.5Ti0.5F
10µm
k) 1CaP5.0Ti0.5F
10µm
l) 1CaP0.5Ti2.5F
10µm
m) 1CaP1.0Ti2.5F
10µm
n) 1CaP2.5Ti2.5F
10µm
o) 1CaP5.0Ti2.5F
10µm

95
When molar ratio increased to 1.25 (Figure 3.23), addition of Ti4+ ions amount from 0.5 to
5.0 mol.% at 1100°C resulted in a decrease in grain size when compared to pure 1.25CaP.
With the addition of F- ions, the grain size of the samples were decreased. It can be easily
detected that fluoride had a significant effect on crystal size and stability of apatite
structures since F- ions decrease the crystal size and increase the stability [87]. It was
presented that F- ions substituted OH- groups decreased the degree of disordered in HA
structure and theoretically 50% of F- ion concentration is enough to stabilize the HA
structure by changing the arrangement of F- ions with OH- groups [87]. This concentration
could be increased in experiments due to the random substitution of OH- ions with F- ions
[87]. Grain sizes of samples with 0.5 mol.% F- and Ti4+ amount from 0.5 to 5.0 mol.%, had
mixed behaviours after the sintering at 1100°C. Increasing the F- ions to 2.5 mol.% resulted
in an increase in grain sizes when amount of Ti4+ was increased. It was found that average
grain sizes of the samples with molar ratio of 1.25 decreased when doped with Ti4+ and F-
ions except the samples 1.25CaP0.5F and 1.25CaP5.0Ti0.5F.
According to Figure 3.24, high grain sizes were obtained for most of the samples after
increasing the sintering temperature from 1100°C to 1300°C. By increasing the sintering
temperature from 1100°C to 1300°C, samples with F- ions resulted in an increase in their
grain sizes. Increasing the Ti4+ amount from 0.5 to 5 mol.% resulted in an increase in the
grain sizes. In 0.5F- co-doped samples, raising the amount of Ti4+ ions from 0.5 to 5
mol.%, samples had mixed behaviors after sintering at 1300°C. In 2.5F- co-doped samples,
increasing the amount of Ti4+ ions from 0.5 to 5 mol.%, resulted in an increase in their
grain sizes after the sintering at 1300°C. Acquired average grain sizes were ranged from 4
to 22 µm.
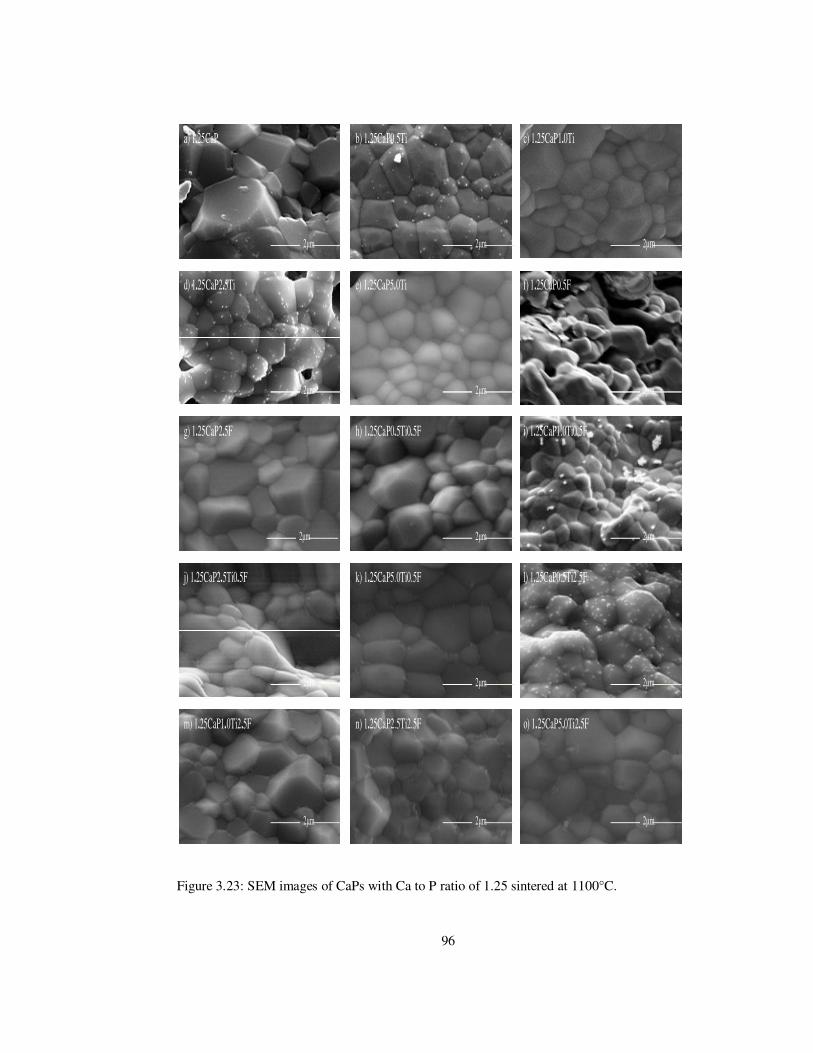
96
Figure 3.23: SEM images of CaPs with Ca to P ratio of 1.25 sintered at 1100°C.
a) 1.25CaP
2µm
b) 1.25CaP0.5Ti
2µ
c) 1.25CaP1.0Ti
2µm
d) 1.25CaP2.5Ti
2µm
e) 1.25CaP5.0Ti
2µm
f) 1.25CaP0.5F
g) 1.25CaP2.5F h) 1.25CaP0.5Ti0.5F
2µm 2µm
i) 1.25CaP1.0Ti0.5F
2µ
j) 1.25CaP2.5Ti0.5F
2µm
k) 1.25CaP5.0Ti0.5F
2µm
l) 1.25CaP0.5Ti2.5F
2µm
m) 1.25CaP1.0Ti2.5F
2µm 2µm
n) 1.25CaP2.5Ti2.5F o) 1.25CaP5.0Ti2.5F
2µm
2µ
b) 1.25CaP0.5Ti
2µm
f) 1.25CaP0.5F
2µm
i) 1.25CaP1.0Ti0.5F
2µm
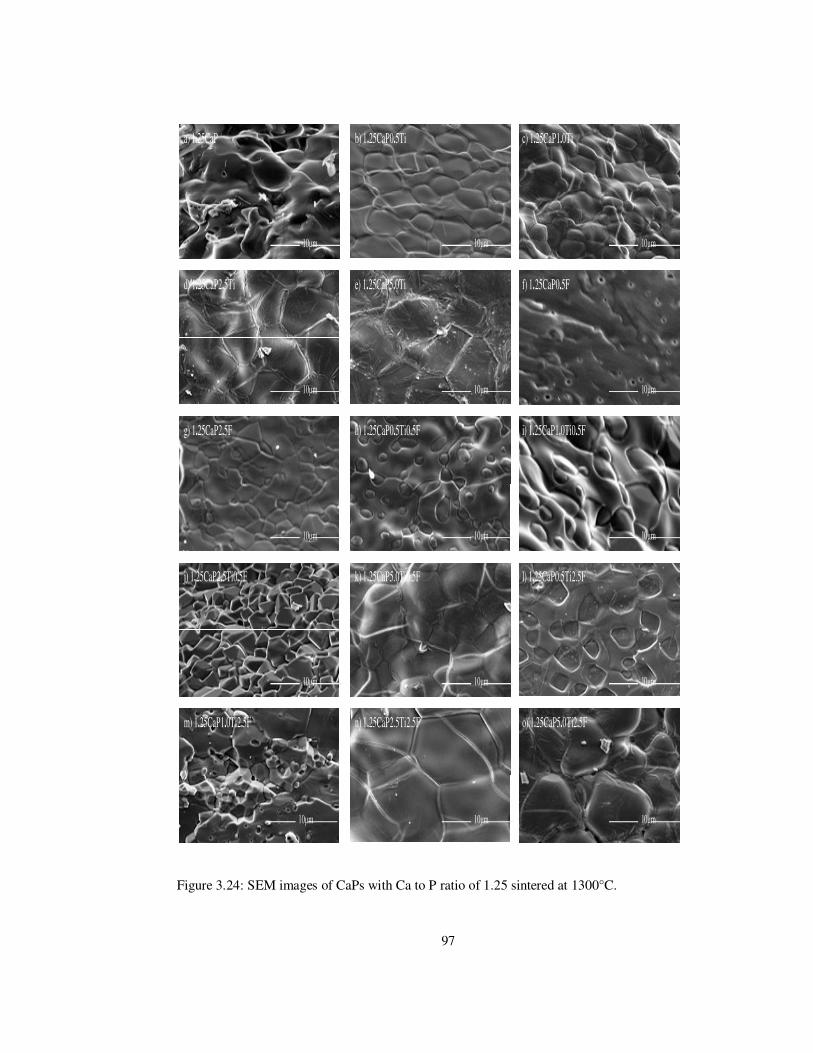
97
Figure 3.24: SEM images of CaPs with Ca to P ratio of 1.25 sintered at 1300°C.
a) 1.25CaP
10µm
b) 1.25CaP0.5Ti
10µm
c) 1.25CaP1.0Ti
10µm
d) 1.25CaP2.5Ti
10µm
e) 1.25CaP5.0Ti
10µm
f) 1.25CaP0.5F
10µm
g) 1.25CaP2.5F
10µm
h) 1.25CaP0.5Ti0.5F
10µm
i) 1.25CaP1.0Ti0.5F
10µm
j) 1.25CaP2.5Ti0.5F
10µm
k) 1.25CaP5.0Ti0.5F
10µm
l) 1.25CaP0.5Ti2.5F
10µm
m) 1.25CaP1.0Ti2.5F
10µm
n) 1.25CaP2.5Ti2.5F
10µm
o) 1.25CaP5.0Ti2.5F
10µm
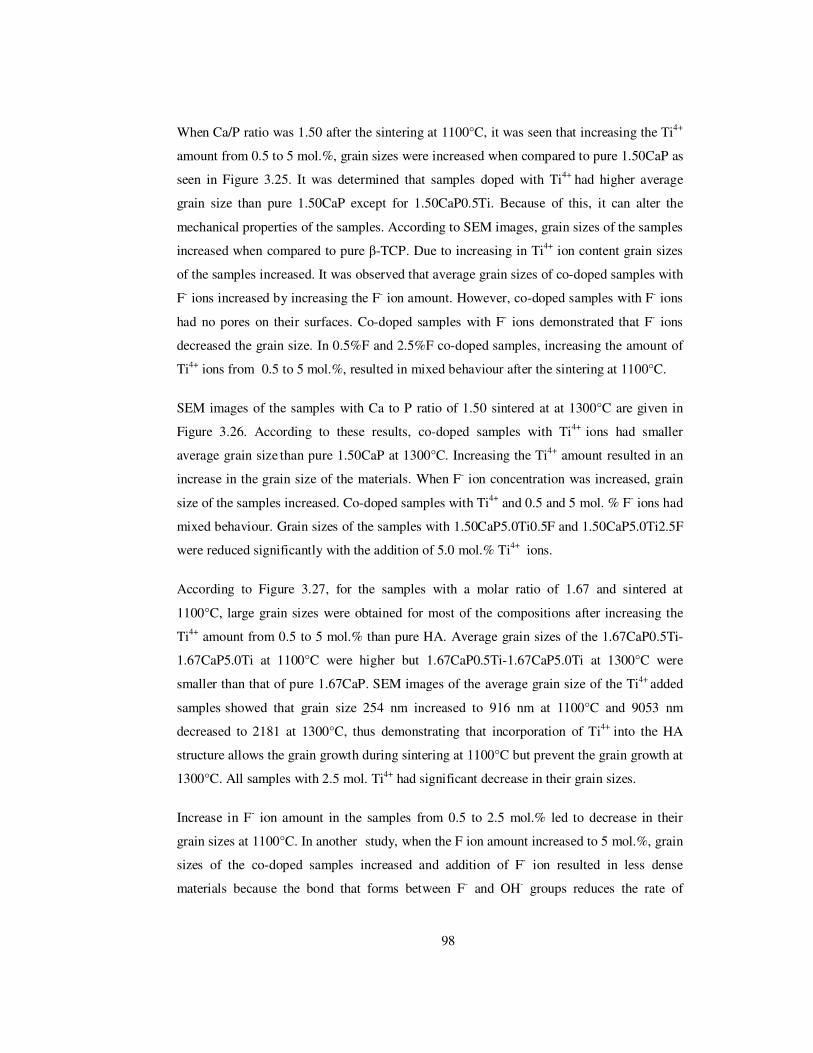
98
When Ca/P ratio was 1.50 after the sintering at 1100°C, it was seen that increasing the Ti4+
amount from 0.5 to 5 mol.%, grain sizes were increased when compared to pure 1.50CaP as
seen in Figure 3.25. It was determined that samples doped with Ti4+ had higher average
grain size than pure 1.50CaP except for 1.50CaP0.5Ti. Because of this, it can alter the
mechanical properties of the samples. According to SEM images, grain sizes of the samples
increased when compared to pure β-TCP. Due to increasing in Ti4+ ion content grain sizes
of the samples increased. It was observed that average grain sizes of co-doped samples with
F- ions increased by increasing the F- ion amount. However, co-doped samples with F- ions
had no pores on their surfaces. Co-doped samples with F- ions demonstrated that F- ions
decreased the grain size. In 0.5%F and 2.5%F co-doped samples, increasing the amount of
Ti4+ ions from 0.5 to 5 mol.%, resulted in mixed behaviour after the sintering at 1100°C.
SEM images of the samples with Ca to P ratio of 1.50 sintered at at 1300°C are given in
Figure 3.26. According to these results, co-doped samples with Ti4+ ions had smaller
average grain size than pure 1.50CaP at 1300°C. Increasing the Ti4+ amount resulted in an
increase in the grain size of the materials. When F- ion concentration was increased, grain
size of the samples increased. Co-doped samples with Ti4+ and 0.5 and 5 mol. % F- ions had
mixed behaviour. Grain sizes of the samples with 1.50CaP5.0Ti0.5F and 1.50CaP5.0Ti2.5F
were reduced significantly with the addition of 5.0 mol.% Ti4+ ions.
According to Figure 3.27, for the samples with a molar ratio of 1.67 and sintered at
1100°C, large grain sizes were obtained for most of the compositions after increasing the
Ti4+ amount from 0.5 to 5 mol.% than pure HA. Average grain sizes of the 1.67CaP0.5Ti-
1.67CaP5.0Ti at 1100°C were higher but 1.67CaP0.5Ti-1.67CaP5.0Ti at 1300°C were
smaller than that of pure 1.67CaP. SEM images of the average grain size of the Ti4+ added
samples showed that grain size 254 nm increased to 916 nm at 1100°C and 9053 nm
decreased to 2181 at 1300°C, thus demonstrating that incorporation of Ti4+ into the HA
structure allows the grain growth during sintering at 1100°C but prevent the grain growth at
1300°C. All samples with 2.5 mol. Ti4+ had significant decrease in their grain sizes.
Increase in F- ion amount in the samples from 0.5 to 2.5 mol.% led to decrease in their
grain sizes at 1100°C. In another study, when the F ion amount increased to 5 mol.%, grain
sizes of the co-doped samples increased and addition of F- ion resulted in less dense
materials because the bond that forms between F- and OH- groups reduces the rate of
99
diffusion regulating the densification [83]. Therefore, increasing the F- ion substitution
decreased the grain sizes [83]. In 0.5F and 2.5F co-doped samples, increasing the Ti4+ ions
amount from 0.5 to 5% resulted in mixed behaviors after sintering at 1100°C.
Grain sizes of the samples doped with Ti4+ ions from 0.5 to 5 mol.% at 1300°C were
smaller than that of pure 1.67CaP as seen in Figure 3.28. In 0.5F and 2.5F co-doped
samples, increasing the amount of Ti4+ ions from 0.5 to 5 mol.% samples had inconsistent
behaviors after the sintering at 1300°C. Samples with 1.67CaP1.0Ti and 1.67CaP0.5Ti0.5F
melted at 1300°C due to appearance of eutectic at melting temperatures of 1280°C, 1287°C
and 1300°C [109].
At 1100°C, samples with 1.67CaP1.0Ti, 1.67CaP2.5Ti, 1.67CaP5.0Ti and
1.67CaP5.0Ti0.5F characterized with porous structure. Klawitter et al. stated that presence
of macropores precipitated resorption and bone ingrowth [116]. Due to Ti4+ and F- ions
additions, increasing the sintering temperature to 1300°C resulted in dense contacts
between the grains and significant grain boundary zones.
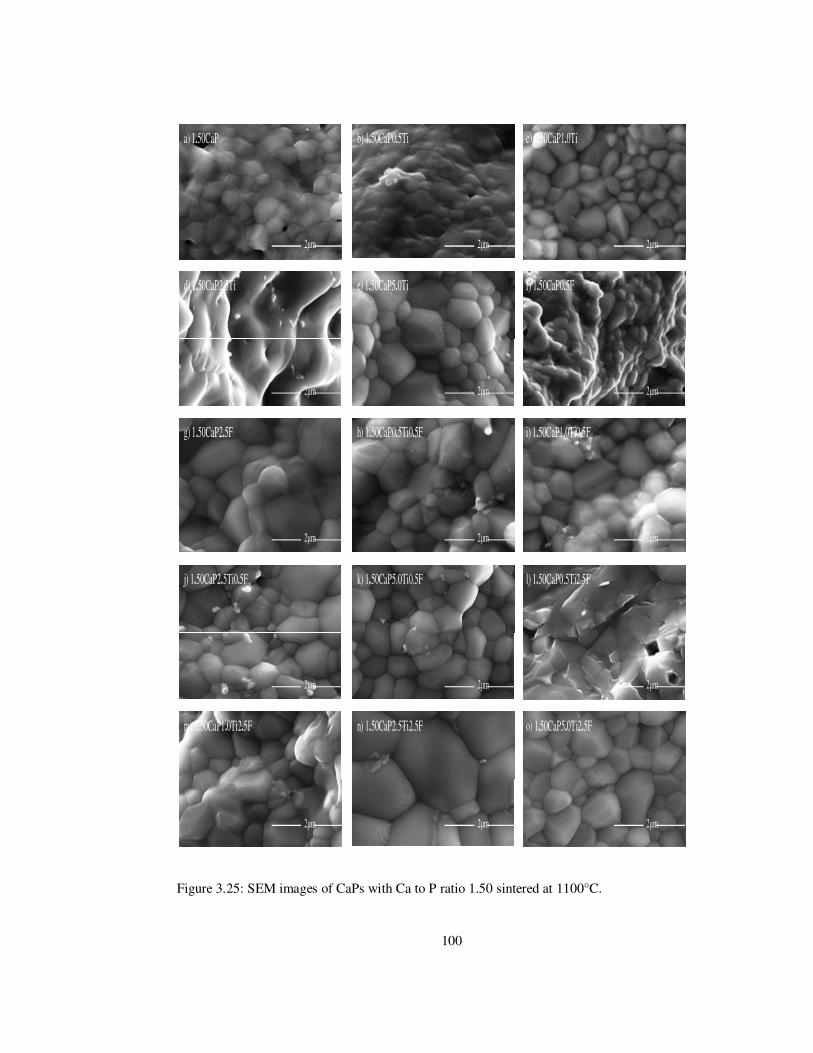
100
Figure 3.25: SEM images of CaPs with Ca to P ratio 1.50 sintered at 1100°C.
a) 1.50CaP
2µm
b) 1.50CaP0.5Ti c) 1.50CaP1.0Ti
2µm
d) 1.50CaP2.5Ti
2µm
e) 1.50CaP5.0Ti
2µm
f) 1.50CaP0.5F
2µ
g) 1.50CaP2.5F
2µm
h) 1.50CaP0.5Ti0.5F
2µm
i) 1.50CaP1.0Ti0.5F
2µm
j) 1.50CaP2.5Ti0.5F
2µm
k) 1.50CaP5.0Ti0.5F
2µm
l) 1.50CaP0.5Ti2.5F
2µm
m) 1.50CaP1.0Ti2.5F
2µm
n) 1.50CaP2.5Ti2.5F
2µm
o) 1.50CaP5.0Ti2.5F
2µm
b) 1.50CaP0.5Ti
2µm
f) 1.50CaP0.5F
2µm
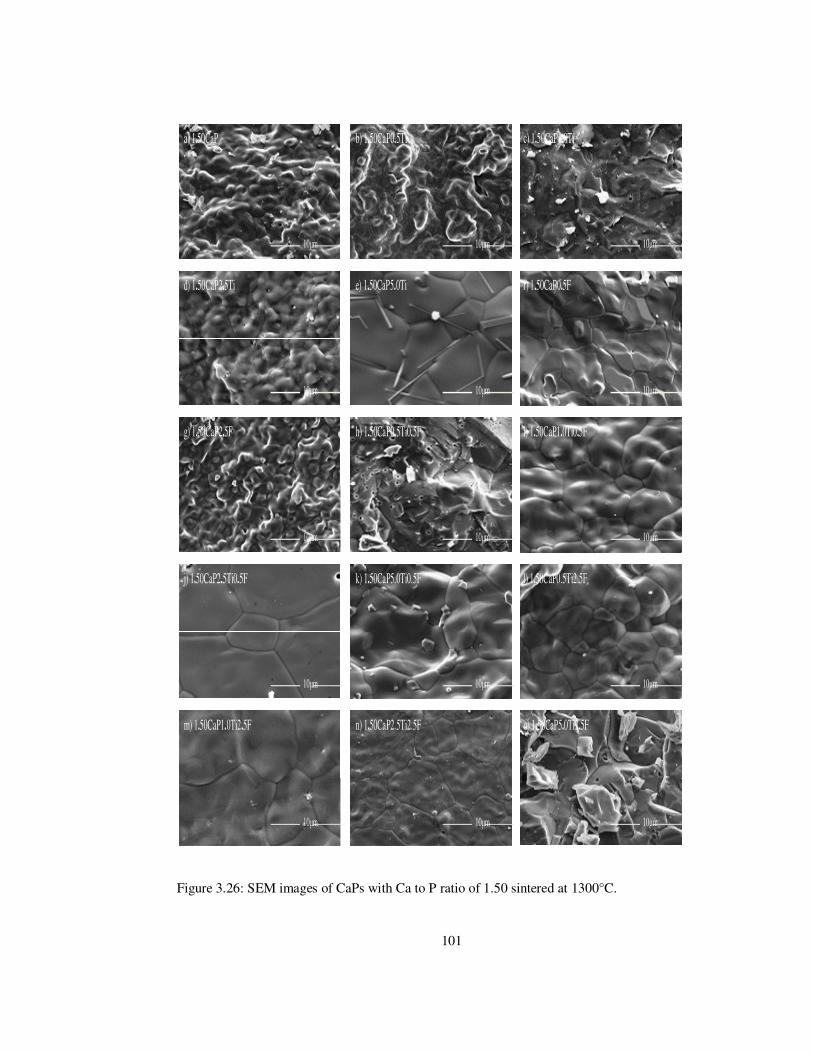
101
Figure 3.26: SEM images of CaPs with Ca to P ratio of 1.50 sintered at 1300°C.
a) 1.50CaP
10µm
b) 1.50CaP0.5Ti
10µm
c) 1.50CaP1.0Ti
10µm
d) 1.50CaP2.5Ti
10µm
e) 1.50CaP5.0Ti
10µm
f) 1.50CaP0.5F
10µm
g) 1.50CaP2.5F
10µm
h) 1.50CaP0.5Ti0.5F
10µm
i) 1.50CaP1.0Ti0.5F
j) 1.50CaP2.5Ti0.5F
10µm
k) 1.50CaP5.0Ti0.5F
10µm
l) 1.50CaP0.5Ti2.5F
10µm
10µm
m) 1.50CaP1.0Ti2.5F
10µm
n) 1.50CaP2.5Ti2.5F
10µm
o) 1.50CaP5.0Ti2.5F
10µm
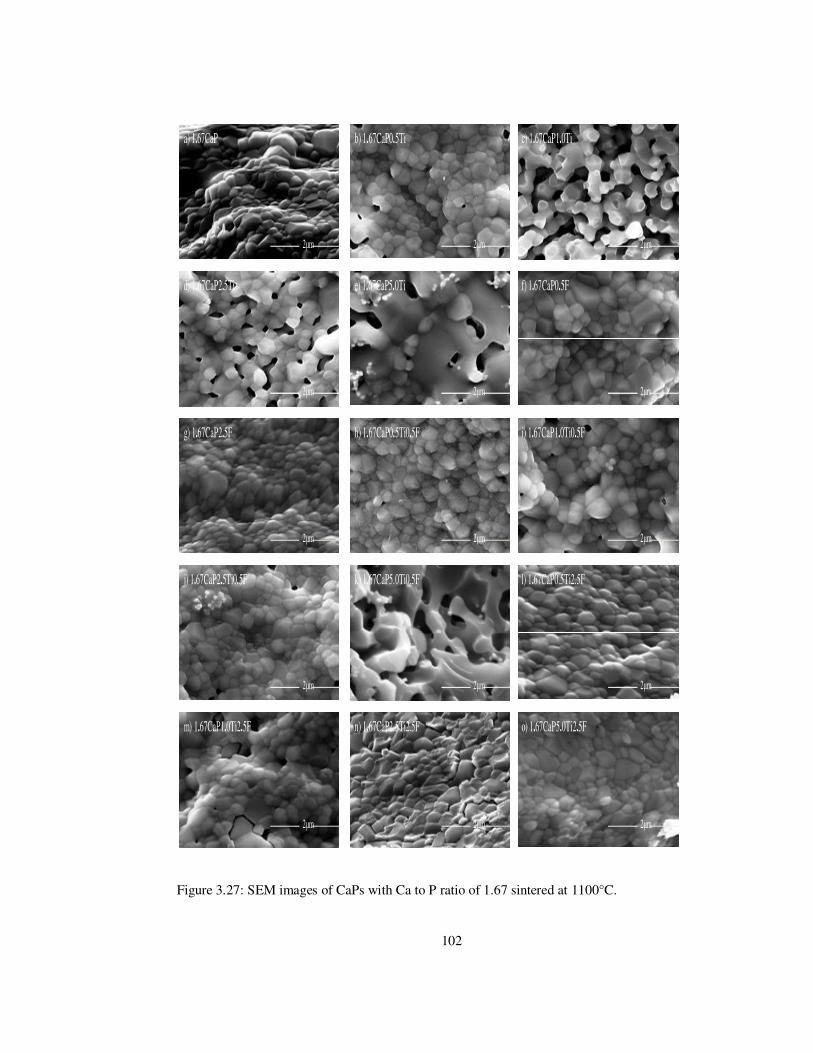
102
Figure 3.27: SEM images of CaPs with Ca to P ratio of 1.67 sintered at 1100°C.
a) 1.67CaP
2µ
b) 1.67CaP0.5Ti
2µm
c) 1.67CaP1.0Ti
2µm
d) 1.67CaP2.5Ti
2µm
e) 1.67CaP5.0Ti
2µm
f) 1.67CaP0.5F
2µm
g) 1.67CaP2.5F
2µ
h) 1.67CaP0.5Ti0.5F
2µm
i) 1.67CaP1.0Ti0.5F
2µm
k) 1.67CaP5.0Ti0.5F
2µm
l) 1.67CaP0.5Ti2.5F
2µm
m) 1.67CaP1.0Ti2.5F
2µm
o) 1.67CaP5.0Ti2.5F
2µm
j) 1.67CaP2.5Ti0.5F
2µm
n) 1.67CaP2.5Ti2.5F
2µm
a) 1.67CaP
2µm
g) 1.67CaP2.5F
2µm
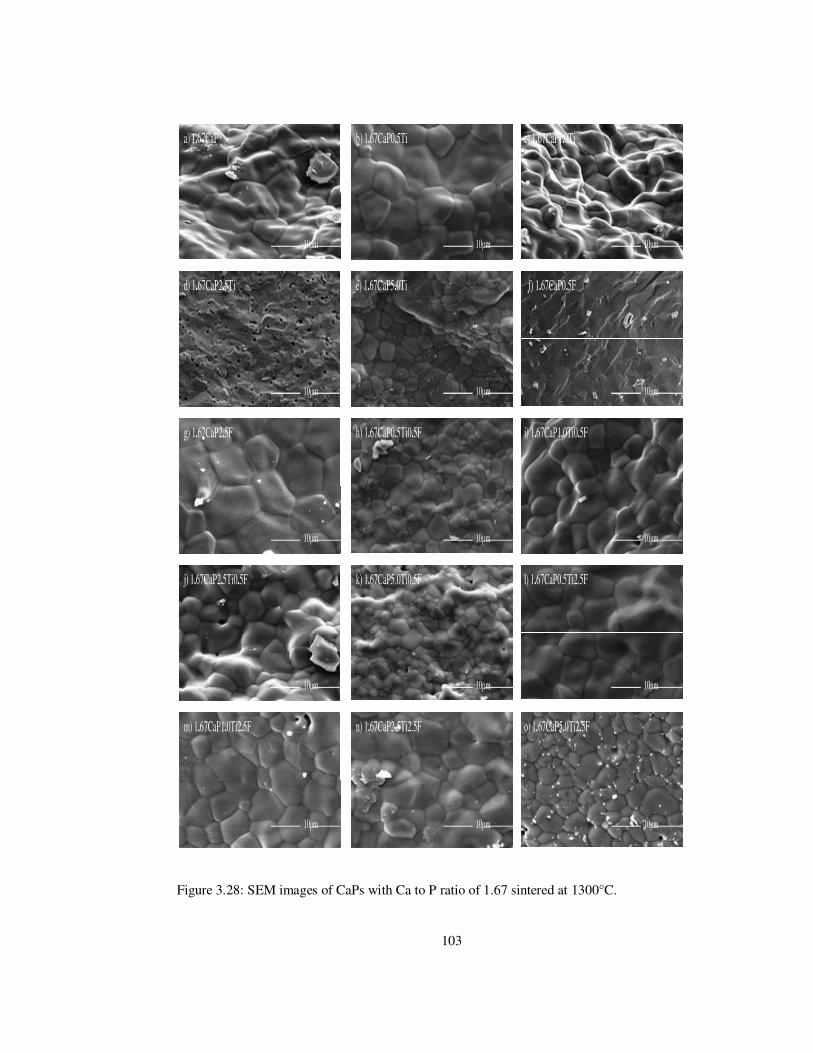
103
Figure 3.28: SEM images of CaPs with Ca to P ratio of 1.67 sintered at 1300°C.
a) 1.67CaP
10µm
b) 1.67CaP0.5Ti
10µm
c) 1.67CaP1.0Ti
10µm
e) 1.67CaP5.0Ti
10µm
f) 1.67CaP0.5F
10µm
g) 1.67CaP2.5F
10µm
h) 1.67CaP0.5Ti0.5F
10µm
i) 1.67CaP1.0Ti0.5F
10µm
j) 1.67CaP2.5Ti0.5F
10µm
k) 1.67CaP5.0Ti0.5F
10µ
l) 1.67CaP0.5Ti2.5F
10µm
m) 1.67CaP1.0Ti2.5F
10µm
n) 1.67CaP2.5Ti2.5F
10µm
o) 1.67CaP5.0Ti2.5F
10µm
d) 1.67CaP2.5Ti
10µm
k) 1.67CaP5.0Ti0.5F
10µm
104
Grain sizes of the samples with Ca to P ratio of 2.0 are presented in Table 3.18. When
sintering temperature was increased from 1100°C to 1300°C, grain sizes of all ceramics
were increased. As Raynaud stated, due to high calcination, samples with Ca/P ratio of 2.0,
had more rounded particles and necks observed at 1100°C [111]. According to Bohner,
change in grain size should affect resorption rate because resorption of ceramics occured at
the grain boundaries [114]. Enlightened regions in the Figure 3.29 suggested that Ti4+ and
F- ions were homogeneously distributed in the co-doped samples. However, increasing the
sintering temperature to 1300°C, they were apparently penetrated in more domains than at
1100°C.
Increasing the amount of F- ions in the samples resulted in an increase in their grain sizes at
both sintering temperatures. At sintering temperatures of 1100 and 1300°C, samples co-
doped with Ti4+ and 0.5 and 5 mol.% F- ions had showed varieties in their behaviours.
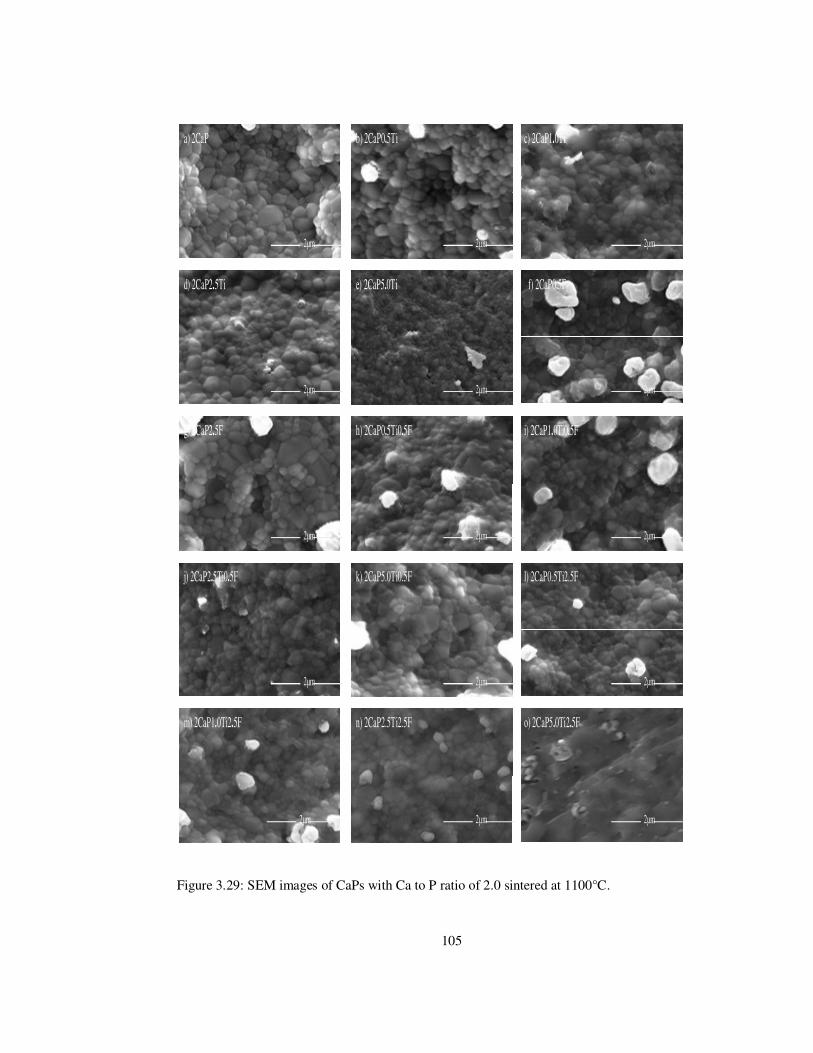
105
Figure 3.29: SEM images of CaPs with Ca to P ratio of 2.0 sintered at 1100°C.
a) 2CaP
2µm
b) 2CaP0.5Ti
2µm
c) 2CaP1.0Ti
2µm
d) 2CaP2.5Ti
2µm
f) 2CaP0.5F
2µm
g) 2CaP2.5F
2µm
h) 2CaP0.5Ti0.5F
2µm
i) 2CaP1.0Ti0.5F
2µm
j) 2CaP2.5Ti0.5F
2µm
k) 2CaP5.0Ti0.5F
2µm
l) 2CaP0.5Ti2.5F
2µm
m) 2CaP1.0Ti2.5F
2µm
n) 2CaP2.5Ti2.5F
2µm
o) 2CaP5.0Ti2.5F
2µm
e) 2CaP5.0Ti
2µm

106
Figure 3.30: SEM images of CaPs with Ca to P ratio of 2.0 sintered at 1300°C.
a) 2CaP
10µm
b) 2CaP0.5Ti
10µm
c) 2CaP1.0Ti
10µm
d) 2CaP2.5Ti
10µm
e) 2CaP5.0Ti
10µm
f) 2CaP0.5F
10µm
g) 2CaP2.5F
10µm
h) 2CaP0.5Ti0.5F
10µm
i) 2CaP1.0Ti0.5F
10µm
j) 2CaP2.5Ti0.5F
10µm
k) 2CaP5.0Ti0.5F
10µm
l) 2CaP0.5Ti2.5F
10µm
n) 2CaP2.5Ti2.5F
10µm
o) 2CaP5.0Ti2.5F
10µm10µm
m) 2CaP1.0Ti2.5F

107
n (C
a/P
)= 1
n (C
a/P
)= 1
.25
n (C
a/P
)= 1
.50
n (C
a/P
)= 1
.67
n (C
a/P
)= 2
Sam
ple
ID
Ave
. Gra
in
Size
(nm
) A
ve. G
rain
Si
ze (n
m)
Ave
. Gra
in
Size
(nm
) A
ve. G
rain
Si
ze (
nm)
Ave
. Gra
in
Size
(nm
) A
ve. G
rain
Si
ze (n
m)
Ave
. Gra
in
Size
(nm
) A
ve. G
rain
Si
ze (n
m)
Ave
. Gra
in
Size
(nm
) A
ve. G
rain
Si
ze (n
m)
1100
°C13
00°C
1100
°C13
00°C
1100
°C13
00°C
1100
°C13
00°C
1100
°C13
00°C
nCaP
489
Mel
ted
897
Mel
ted
406
1579
525
490
5326
519
59
nCaP
0.5T
i61
836
111
773
4764
308
4834
317
5014
285
6354
nCaP
1.0T
i90
719
981
817
7623
718
Mel
ted
507
8109
251
1095
nCaP
2.5T
i98
625
926
612
1167
8M
elte
d62
4544
1M
elte
d26
227
57
nCaP
5.0T
i91
3M
elte
d57
213
587
611
1302
791
621
81M
elte
d12
80
nCaP
0.5F
850
Mel
ted
898
Mel
ted
Mel
ted
6566
412
Mel
ted
273
1166
nCaP
2.5F
1243
3871
731
5034
814
1646
822
959
1243
811
73
nCaP
0.5T
i0.5
FM
elte
d18
871
677
9444
593
Mel
ted
260
3396
164
2436
nCaP
1.0T
i0.5
F12
3285
9885
439
9062
278
0036
835
6322
122
73
nCaP
2.5T
i0.5
F99
386
6260
844
0646
416
296
266
2507
199
2633
nCaP
5.0T
i0.5
F10
9880
6995
911
389
513
1554
5M
elte
dM
elte
d24
129
40
nCaP
0.5T
i2.5
F96
529
167
562
7545
523
4679
303
3587
217
Mel
ted
nCaP
1.0T
i2.5
F12
53M
elte
d73
877
4449
411
111
387
3162
234
Mel
ted
nCaP
2.5T
i2.5
F11
2911
170
792
2125
618
8222
457
240
3412
215
2032
nCaP
5.0T
i2.5
FM
elte
d93
3685
413
167
594
8160
342
2508
Mel
ted
2350
Tab
le 3
.18:
Ave
rage
gra
in s
ize
of C
aPs
with
mol
ar r
atio
s of
1,1
.25,
1.5
0, 1
.67,
2 s
inte
red
at 1
100o C
and
130
0 oC
.

108
3.3 Mechanical Investigation of the Samples
3.3.1 Micro-hardness Measurements
Micro-hardness test was used to investigate the effect of the sintering temperature on the
mechanical properties of doped and undoped CaP samples. Micro-hardness test was applied
to the samples sintered at 1100°C and 1300°C. Average µ-hardness values of samples are
given in Table 3.19.
With regard to Table 3.19, when Ca to P molar ratio is 1.0, the lowest micro-hardness value
of 1.21 GPa was measured for 1CaP5.0Ti sintered at 1100°C whereas the maximum micro-
hardness value of 6.07 GPa was acquired for 1CaP2.5Ti2.5F sintered at 1300°C. According
to the results after the sintering at 1100°C, increasing the amount of the Ti4+ ion led to a
slight decrease in the micro-hardness values. Pure 1CaP had the highest magnitude when
compared to Ti4+ ion added samples. Increasing the sintering temperature to 1300°C
affected the magnitude of the micro-hardness in the increasing direction until the sample of
1CaP2.5Ti. The tendency differs by raising Ti4+ ion in the increasing direction. In other
samples, micro-hardness magnitude of pure 1CaP increased by raising the sintering
temperature. Micro-hardness values of the samples increased with increasing the sintering
temperature and Ti4+ ion amount of the samples. This result indicated that increasing the
sintering temperature positively affected the mechanical properties of the samples with
molar ratio of 1.0. The hardness of CaP increased with increasing the sintering temperature
however a decrease was observed with increasing degree of Ti4+ ion amount for the sample
of 1CaP5.0Ti. It can be concluded that the hardness of the samples with higher amount of
Ti4+ ion indicate an increase with increasing of sintering temperature.
When the amount of the F- ion increased, a decrease in the micro-hardness values was
observed at 1100°C. This outcome showed consistency with the study of Gross et al., which
revealed that F- ion incorporation improved the mechanical properties only up to a certain
limit [70]. Afterwards when the limit exceeded, a decrease in the mechanical properties was
detected as in this study. Co-doped sample with 2.5F had the lowest µ-hardness value. F-
ion addition increased the µ-hardness of the samples. Therefore, due to a decrease in the
porosity of the samples, more compact and hard structures were obtained [121]. Increased
109
compatibility between F- and H+ atoms resulted in compact structure. When sintering
temperature was increased to 1300°C and the amount of F- ions raised from 0.5 to 2.5
mol.% F- increase in the microhardness values was observed. It is possible to say that
increasing the sintering temperature positively affected the mechanical properties of the
samples. This result is in relevance with SEM result which shows that doping of the
samples with F- ions cause an increase in grain sizes at 1300°C but decrease at 1100°C.
1CaP0.5Ti0.5F had the highest micro-hardness, while 1CaP5.0Ti0.5F demonstrated the
smallest micro-hardness at 1100°C when doped with Ti4+ and F- ions. Nevertheless, there
was a sharp decrease in µ-hardness. With increasing the Ti4+ amount, mechanical properties
of the calcium phosphates deteriorated at 1100°C. According to the results, with increasing
sintering temperature to 1300°C, µ-hardness of the samples containing Ti4+ and 0.5F
decreased except the 1CaP2.5Ti0.5F.
Changing the molar ratio to 1.25 at 1100°C resulted in a decrease in the µ-hardness value
except 1.25CaP2.5Ti. Increasing the Ti4+ ion amount decreased the µ-hardness value. Pure
1.25CaP had the one of the maximum microhardness value when compared to other
samples. With increasing F- ion amount, µ-hardness value decreased from 4.74 to 3.85 GPa.
Changing the sintering temperature to 1300°C gave the same tendency as at 1100°C except
for the F- added samples. Kim et al. demonstrated that insertion of F- ions increased µ-
hardness values significantly. This reason explained the decrease in porosity of fluoridated
samples [121]. Micro-hardness values of the samples with 2.5 mol.% F- had higher values
than the samples with 0.5 mol.% F- at both sintering temperature. Micro-hardness value of
1.25CaP5.0Ti was higher than that of pure 1.25CaP and micro-hardness of the pure
1.25CaP decreased with increasing the sintering temperature..
When increasing the Ti4+ ion amount in the samples with molar ratio of 1.50 at 1100°C,
initially the µ-hardness value increased and as the Ti4+ ion amount increased then
decreased. Micro-hardness of the samples with Ti4+ ions increased when compared to pure
1.50CaP. According to the results, F- addition increased the µ-hardness values from 4.44 to
4.80 GPa. Increasing the sintering temperature to 1300°C revealed a decrease in the value
until 1.50CaP5.0Ti when Ti4+ ion added. Micro-hardness for pure 1.50CaP was higher than
Ti4+ and F- ion added samples. The hardness of CaP was decreased with increasing the
sintering temperature. However, an increase was observed with increasing the degree of
Ti4+ ion amount for the sample 1.50CaP5.0Ti. At 1100°C, all samples that contain Ti4+ and

110
F- ions had higher µ-hardness values than at 1300°C. Consequently, the hardness of the
samples with higher amount of Ti4+ ion indicate a decrease with an increase in sintering
temperature.
Altering molar ratio to 1.67 revealed decrease in the µ-hardness and then slightly increase
at 1100°C and 1300°C. At the same sintering temperature the maximum value was obtained
at pure 1.67CaP. Consistent with this result, study of Chenglin et al. showed that that pure
HA ceramics had a micro-hardness value of 4.72 GPa [84]. The hardness of 1.67CaP
increased with increasing the sintering temperature. Increasing the Ti4+ ion addition
worsened the µ-hardness of the co-doped samples at both sintering temperatures. The
hardness of the samples with higher amount of Ti4+ ion indicated an increase with
increasing the sintering temperature. However, F- ion addition enhanced the µ-hardness
values. At 1100°C, when the F- ion addition increased, µ-hardness values increased [29] but
with increasing the sintering temperature, a reduction observed. Samples doped with Ti4+
and F- ions had smaller µ-hardness values than pure 1.67CaP after the sintering at both
temperatures. With increasing Ti4+ and F- ions amount the µ-hardness values decreased.
When molar ratio increased to 2.0 at 1100°C, micro-hardness values revealed various trend.
Increasing the sintering temperature exposed more stabile values. Increasing the Ti4+ ion
amount increased the micro-hardness values of the samples except for 2.0CaP2.5Ti. At
1100°C, micro-hardness value of pure 2.0CaP was higher than that at 1300°C.
As a result of this study, with increasing sintering temperature µ-hardness values of pure
1.0, 1.50 and 1.67 increased and 1.25, 2.0 decreased. It is obvious that at 1300°C higher µ-
hardness values were obtained.

111
Sa
mp
le I
DM
icro
-Ha
rdn
ess
(GP
a),
110
0°C
Mic
ro-H
ard
nes
s (G
Pa
), 1
300°
C
n=
1.0
n=
1.2
5n
=1
.50
n=
1.6
7n
=2
.0n
=1
.0n
=1
.25
n=
1.5
0n
=1
.67
n=
2.0
nC
aP3
.23
±0
.18
4.1
7 ±
0.1
82
.41
±0
.19
3.6
9 ±
0.2
74
.99
±0
.40
3.4
2 ±
0.3
33
.43
±0
.31
4.4
6 ±
0.4
35
.66
±0
.79
4.2
9 ±
0.5
1
nC
aP0
.5T
i3
.20
±0
.24
4.0
0 ±
0.3
24
.15
±0
.28
2.0
3 ±
0.4
04
.56
±0
.41
3.6
4 ±
0.3
54
.16
±0
.67
3.4
0 ±
0.2
13
.74
±0
.40
4.4
2 ±
0.3
9
nC
aP1
.0T
i3
.02
±0
.55
3.9
±6
0.3
94
.52
±0
.10
1.3
1 ±
0.1
53
.88
±0
.37
3.7
1 ±
0.2
62
.94
±0
.31
3.3
3 ±
0.3
63
.68
±0
.49
4.7
7 ±
0.4
4
nC
aP2
.5T
i2
.03
±0
.12
1.8
9 ±
0.2
13
.95
±0
.27
0.6
1 ±
0.0
34
.79
±0
.45
3.9
1 ±
0.3
72
.80
±0
.39
2.6
3 ±
0.2
53
.25
±0
.24
5.3
3 ±
0.1
7
nC
aP5
.0T
i1
.21
±0
.33
3.5
8 ±
0.3
24
.06
±0
.18
0.8
0 ±
0.0
34
.67
±0
.88
3.3
5 ±
0.4
13
.55
±0
.55
3.1
8 ±
0.1
83
.49
±0
.28
3.8
8 ±
0.5
5
nC
aP0
.5F
3.7
8 ±
0.4
34
.74
±0
.26
4.4
4 ±
0.2
25
.16
±0
.37
4.6
8 ±
0.4
03
.26
±0
.41
2.6
4 ±
0.2
73
.54
±0
.18
4.8
0 ±
0.4
63
.48
±0
.26
nC
aP2
.5F
3.0
2 ±
0.5
03
.85
±0
.14
4.8
0 ±
0.6
25
.49
±0
.38
3.0
8 ±
1.4
93
.30
±0
.31
2.9
9 ±
0.2
13
.87
±0
.30
4.4
8 ±
0.2
24
.54
±0
.69
nC
aP0
.5T
i0.5
F3
.57
±0
.47
3.1
7 ±
0.4
04
.42
±0
.27
2.3
9 ±
0.1
25
.95
±0
.49
3.9
1 ±
0.8
33
.43
±0
.24
3.5
3 ±
0.1
74
.73
±0
.85
4.5
5 ±
0.2
4
nC
aP1
.0T
i0.5
F3
.29
±0
.51
4.4
3 ±
0.2
33
.10
±0
.15
2.2
6 ±
0.7
54
.91
±0
.38
3.4
6 ±
0.2
73
.68
±0
.41
3.5
0 ±
0.2
23
.92
±0
.45
4.0
7 ±
0.6
8
nC
aP2
.5T
i0.5
F1
.82
±0
.14
4.3
2 ±
0.3
04
.52
±0
.18
1.6
9 ±
0.1
25
.82
±0
.32
4.6
9 ±
0.6
32
.82
±0
.85
2.7
4 ±
0.2
53
.86
±0
.40
3.5
8 ±
0.1
6
nC
aP5
.0T
i0.5
F1
.29
±0
.17
3.4
7 ±
0.2
34
.40
±0
.26
1.1
0 ±
0.2
65
.25
±0
.60
2.8
2 ±
0.4
35
.42
±0
.64
2.6
5 ±
0.5
32
.82
±0
.24
4.6
7 ±
0.4
9
nC
aP0
.5T
i2.5
F2
.42
±0
.32
2.8
7 ±
0.5
74
.27
±0
.18
3.3
7 ±
0.4
95
.32
±0
.25
4.1
1 ±
0.4
84
.02
±0
.58
3.8
2 ±
0.5
44
.41
±0
.23
5.8
9 ±
0.6
2
nC
aP1
.0T
i2.5
F2
.68
±0
.21
3.2
3 ±
0.3
84
.39
±0
.27
1.3
3 ±
0.1
06
.38
±0
.77
3.6
1 ±
0.2
42
.71
±0
.18
3.6
1 ±
0.2
44
.20
±0
.30
4.9
1 ±
0.4
2
nC
aP2
.5T
i2.5
F1
.74
±0
.25
3.9
1 ±
0.3
03
.65
±0
.21
2.4
2 ±
0.0
93
.88
±0
.62
6.0
7 ±
1.6
74
.01
±0
.52
2.9
0 ±
0.1
83
.47
±0
.29
6.0
4 ±
0.6
3
nC
aP5
.0T
i2.5
F2
.52
±0
.26
2.2
4 ±
0.3
24
.61
±0
.32
1.1
4 ±
0.0
95
.03
±0
.48
3.0
2 ±
0.4
23
.68
±0
.73
3.0
1 ±
0.2
93
.52
±0
.11
5.2
7 ±
0.2
1
Tab
le 3
.19:
Mic
ro-h
ardn
ess
of C
aPs
wit
h C
a/P
rati
os o
f 1,
1.25
, 1.5
0, 1
.67
and
2 si
nter
ed a
t 110
0o C a
nd 1
300 o
C.
112
CHAPTER 4
6 CONCLUSION
In this study, CaPs doped with Ti4+ and F- ions were synthesized by a precipitation method.
Doping amount of F- ions was kept at 0.5 and 2.5 mol.% whereas doping amount of Ti4+
ions was 0.5, 1.0, 2.5, and 5 mol.%. Synthesized CaPs had Ca/P molar ratios ranging from
1.00 to 2.00. All samples were sintered at 1100°C and 1300°C for 1h. Microstructural and
mechanical properties of the sintered samples were investigated.
According to density measurements of doped and undoped samples, small densities were
achieved when the sintering temperature was increased from 1100 to 1300°C. High amount
of Ti4+ led to a decrease in densification when Ca/P ratio was 1.0, 1.25, 1.67 (at 1100°C)
and 1.50, 2.0 (at 1300°C). However, increase in densities was observed when Ca/P molar
ratio was 1.50, 2.0 (at 1100°C) and 1.0, 1.25, 1.67 (at 1300°C). Densities of the F- addition
revealed considerable decreases at 1100°C and 1300°C. Except for the densities of the
doped samples with molar ratio of 1.0, densities for molar ratio of 1.50 at 1100 and 1300°C
decreased. For Ti4+ and 0.5F- co-doped samples, as the Ti4+ amount raised, the density of the
samples decreased at 1100°C and 1300°C, except for the samples with molar ratios of 1.0
and 1.25 at 1300°C. Although densities of Ti4+ and 2.5F- doped samples decreased with
increasing the Ti4+ amount from 0.5 mol.% to 5.0 mol.% after the sintering at 1100 and
1300°C, densities of samples with Ca/P molar ratio of 1.50 and 1.67 increased at 1100°C.
These results demonstrated that optimum amount of Ti4+ and F- ions decreased the
densification. Furthermore, the results revealed that increasing the sintering temperature
decreased the densification. At high sintering temperature, decreased densities were most
probably due to the removal of structural water from the system.
The XRD pattern demonstrated that for Ca to P ratio of 1 at 1100°C, β-CPP phase was
observed. When sintering temperature was increased, β-CPP, α-TCP and TiO2 were
formed. Increasing the molar ratio to 1.25 and 1.50 resulted in phases of β-TCP and/or β-
113
CPP and β-TCP/ HA at 1100°C and β-TCP and/or β-CPP, α-TCP, TiO2 and HA, α-TCP
TiO2 at 1300°C, respectively. In higher molar ratios of 1.67 and 2.0, HA, β-TCP, α-TCP,
CaO, TiO2, CaTiO3 and HA, CaO, α-TCP, CaTiO3 phases was observed. In the samples
with molar ratio 1.50, α-TCP phase was identified besides HA at 1300°C, resulting in the
formation of β-TCP/ α-TCP biphasic composites with different compositions. In XRD,
small shifts in peak positions were observed, due to the incorporation of doping ions and
increased crystallinity. In Ti4+ doped samples of 1.67 and 2.0, at sintering temperature of
1100°C and 1300°C, decomposition of TiHA and formation of CaTiO3 occurred. Results
demonstrated that HA with 0.5Ti and 1.0Ti may have appropriate potential for biomedical
applications. XRD results for molar ratio 2.0 revealed that HA, α-TCP, CaTiO3 and CaO
phase detected. With increasing Ca2+ ions into the system, the intensity of CaO phase
increased. The structural analysis showed that among the samples, β-TCP and α-TCP were
the main phases. The phase compositions at higher sintering temperatures can be explained
by the changes in stoichiometry of the samples and due to loss of ions and molecules.
In FTIR spectroscopy analysis, when molar ratio is 1, 1.25, 1.50, 1.67 and 2.0 and sintering
temperature is 1100°C, the characteristic bands of β-CPP, β-CPP/β-TCP, β-TCP/HA, HA
and HA were observed, respectively. With increasing the sintering temperature to 1300°C,
samples with molar ratio of 1.0 and 1.25 revealed additional secondary characteristic peaks
of HA and β-TCP. In the samples of molar ratio 1.0 and 1.25, PO43- (ν1, ν2, ν3, ν4 vibrational
modes) and OH- (librational and stretching) bands associated β-CPP, TCP and HA were
detected. Additional peaks were determined in F- doped samples at 696 cm-1, in the molar
ratios of 1, 1.25 (at 1100°C and 1300°C) and 1.50 (only at 1100°C) indicating the
successful incorporation of F- ions.
SEM images confirmed that sintering temperature and amount of dopants had significant
effect on grain sizes of the samples. According to the results, the average grain sizes of the
doped and undoped samples decreased when Ca/P ratio increased. Grain sizes were
generally increased when sintering temperature was raised from 1100°C to 1300°C. It can
be concluded that increasing the sintering temperature activates the particle growth. With
respect to grain size calculations, with Ti4+ ion addition, average grain sizes in CaPs with
molar ratios of 1, 1.50 and 1.67 rised and 1.25, 2.0 decreased when sintering temperature
was 1100°C. With increasing the sintering temperature to 1300°C, average grain sizes were
increased in the samples with molar ratio of 1, 1.25 and decreased in 1.50, 1.67 and 2.0.
114
These findings demonstrate that with incorporation of Ti4+ ion decreasing average grain
size prevented the grain growth and increasing the average grain size allowed the grain
growth. However, Ti4+ ion above certain limit developed the decomposition of HA phases.
At 1300 °C, the strongest coalescence was observed in the samples. In these samples, initial
crystals totally changed and coalesced to form grains with bigger dimensions. F- ion
addition increased the grain sizes in 1, 1.50, 2.0, and decreased them in 1.25, 1.67 at
1100°C and 1300°C. The grain sizes of groups consisting of Ti+4 and F- increased when
sintering temperature rose to 1300°C and fluctuations in grain sizes were detected.
As a result of Vickers microhardness test, Ti4+ ion addition in large amounts decreased the
µ-hardness of the samples at 1100°C and 1300°C, except samples with molar ratio 2.0 (at
1100°C) and 1.0, 2.0 (at 1300°C). This had a positive effect on the mechanical properties of
the samples. Substitution of F- ions decreased the µ-hardness values up to certain extent,
however samples with 1.0 (at 1100°C) and 1.50 (at 1100°C and 1300°C) F- incorporation
increased the µ-hardness. For Ti4+ and 0.5F- co-doped samples, as the Ti4+ amount raised,
the µ-hardness of the samples decreased at 1100°C and 1300°C, except for the samples
with molar ratios 1.0 and 1.25 at 1300°C. Although µ-hardness of Ti4+ and 2.5F- doped
samples increased with increasing the Ti4+ amount from 0.5 mol.% to 5.0 mol.% after the
sintering at 1100°C, µ-hardness of samples with molar ratio of 1.0 and 2.0 at 1100°C and
samples at 1300°C decreased.
High densities were obtained for 1.67CaP, 1.67CaP2.5Ti0.5F and 2CaP0.5Ti2.5F at
1100°C. Samples with 1.67CaP2.5F, 2CaP0.5Ti0.5F, 2CaP1.0Ti0.5F, 2CaP2.5Ti0.5F,
2CaP5.0Ti0.5F, 2CaP0.5Ti2.5F, 2CaP1.0Ti2.5F and 2CaP2.5Ti2.5F at 1100°C had smaller
grain sizes than pure HA. Microhardness of the co-doped samples with molar ratio of 1.67
and 2.0 at 1100°C were increased when doped with Ti4+ and F- ions. To conclude that when
CaPs analyzed in terms of structural and mechanical properties. CaPs with molar ratio of
1.67 and 2.0 doped with 0.5 to 2.5 mol.% F- and 0.5 to 5.0 mol.% Ti4+ sintered at 1100°C
were found the most outstanding materials for future biomechanical applications because
this doped samples gave the highest microhardness values, high densities and small grain
sizes. Therefore, further investigations should be focused on this materials.
115
REFERENCES
[1] http://www.ivy-rose.co.uk/HumanBody/Skeletal/Skeletal_System.php:, last
visited on September 2010.
[2] Wang T., Feng Z., “Dynamic mechanical properties of cortical bone: The effect
of mineral content”, Materials Letters, 59 (2005) 2277-2280.
[3] http://commons.wikimedia.org/wiki/File:Composition_of_bone.png, last visited
on October 2010.
[4] Mow V.C., Hayes W.C., “Basic Orthopedic Biomechanics”, Raven Press, Ltd.,
NY, USA, (1991), 93-94.
[5] http://www.britannica.com/EBchecked/topic/434280/osteocyte, last visited on
November 2010.
[6] http://www.mananatomy.com/basic-anatomy/skeleton/classification-of-
bones.htm, last visited on November 2010.
[7] Rho J.Y., Khun-Spearing L., Zioupos P., “Mechanical properties and the
hierarchical structure of bone”, Medical Engineering & Physics, 20 (1998) 92-
102.
[8] Cullinane D.M., Einhorn T.A., “Biomechanics of Bone”, Principles of Bone
Biology, Second Edition, 1 (2002) 17–32.
[9] Ribeiro C.C., Gibson I.,Barbosa M. A., “The uptake of tianium ions by
hydroxyapatite particles-structural changes and possible mechanism”,
Biomaterials, 27 (2006) 1749-1761.
116
[10] Bilezikian J.P., Raisz L.G., Rodan G.A. ‘Principles of Bone Biology’ Academic
Press, San Diego, USA, (1996) 16-23.
[11] Jee W.S.S., “Integrated Bone Tissue Physiology: Anatomy and Physiolog; Bone
Mechanics Handbook”, 2nd edition, CRC Press, Utah, USA (2001) 42-51.
[12] Currey J.D., “Bones: Structure and Mechanics”, Princeton University Press,
Princeton, NJ, USA, (2002) 63-81.
[13] Fratzl P., Gupta H.S., Paschalis E.P., Roschger P., “Structure and mechanical
quality of the collagen-mineral nano-composite in bone”, Journal of Materials
Chemistry, 14 (2004) 2115 -2123.
[14] Liu H.S, Chin T.S., Lai L.S., Chiu S.Y., Chung K.H., Chang C.S., Lui M.T.,
“Hydroxyapatite synthesized by a simplified hydrothermal method”, Ceramics
International, 23 (1997) 19-25.
[15] Fathi M.H., Hanifi A., “Evaluation and characterization of nanostructure
hydroxyapatite powder prepared by simple sol–gel method”, Materials Letters,
61 (2007) 3978–3983.
[16] Elliot J.C., “Structure and Chemistry of the Apatites and Other Calcium
Orthophosphates”, Studies in Inorganic Chemistry, Elsevier (1994) 18-20.
[17] Weatherell J.A., Robinson C., “The inorganic composition of teeth”; in Zipkin I.
(ed): Biological Mineralization, John Wiley, NY, USA, (1973) 43-74.
[18] Song Q., Wang C., Wen S., “Effects of doping on crystal and grain boundary in
human enamel”, Materials Science and Engineering A, 297 (2001) 272-280.
[19] Yuan H., Kurashina K., de Bruijn J., Li Y., de Groot K., Zhang X., “A
preliminary study on osteoinduction of two kinds of calcium phosphate
ceramics”, Biomaterials, 20 (1999) 1799-1806.
117
[20] Toth J.M., Lynch K.L., Hackbarth D.A., “Ceramic-induced osteogenesis
following subcutaneous implantation of calcium phosphates”, Bioceramics, 6
(1993) 9-13.
[21] Yang Z., Yuan H., Tong W., Zou P., Chen W., Zhang X., “Osteogenesis in
extraskeletally implanted porous calcium phosphate ceramics: Variability among
different kinds of animals”, Biomaterials, 17 (1996) 2131-2137.
[22] Yuan H., Li Y., Yang Z., Zhang X., “Osteoinduction of pure β-TCP ceramic in
dogs”, Biomedical Materials Research in the Far East, 3 (1997) 188-197.
[23] Park E., Lee Y., Choi J., Oh S., Shin H., Kim K., Kim S.Y., Kim S., “Cellular
biocompatibility and stimulatory effects of calcium metaphosphate on
osteoblastic differentiation of human bone marrow-derived stromal cells”,
Biomaterials, 25 (2004) 3403–3411.
[24] Besta S.M., Porterb A.E., Thiana E.S., Huang J., “Bioceramics: Past, present and
for the future”, Journal of the European Ceramic Society, 28 (2008) 1319–1327.
[25] Ryu H., Youn H., Hong K., Chang B., Lee C., Chung S., “An improvement in
sintering property of β-tricalcium phosphate by addition of calcium
pyrophosphate”, Biomaterials, 23 (2002) 909–914.
[26] Moseke C., Gbureck U., “Tetracalcium phosphate: Synthesis, properties and
biomedical applications”, Acta Biomaterialia, 6 (2010) 3815–3823.
[27] Chow L.C., Markovic M., Frukhtbeyn S.A., Takagi S., “Hydrolysis of
tetracalcium phosphate under a near-constant-composition condition--effects of
pH and particle size”, Biomaterials, 26 (2005) 393-401.
[28] Combes C., Rey C., “Amorphous calcium phosphates: Synthesis, properties and
uses in biomaterials”, Acta Biomaterialia, 6 (2010) 3362–3378.
118
[29] Sun J., Chang W., Chen L., Huang Y., Juang L., Lin F., “The influence on gene
expression profiling ofosteoblasts behavior following treatment with the ionic
products of sintered β-dicalcium pyrophosphate dissolution”, Biomaterials, 25
(2004) 607–616.
[30] Sekar C., Kanchana P., Nithyaselvi R., Girija E.K., “Effect of fluorides (KF and
NaF) on the growth of dicalcium phosphate dehydrates (DCPD) crystal”,
Materials Chemistry and Physics, 115 (2009) 21–27.
[31] Suzuki O., Kamakura S., Katagiri T., Nakamura M., Zhao B., Honda Y., Kamijo
R., “Bone formation enhanced by implanted octacalcium phosphate involving
conversion into Ca-deficient hydroxyapatite”, Biomaterials, 27 (2006) 2671–
2681.
[32] Huan Z., Chang J., “Novel bioactive composite bone cements based on the β-
tricalcium phosphate–monocalcium phosphate monohydrate composite cement
system”, Acta Biomaterialia, 5 (2009) 1253-1264.
[33] Yingguang L., Zhuoru Y., Jiang C., “Preparation, characterization and
antibacterial property of cerium substituted hydroxyapatite nanoparticles”,
Journal of Rare Earths, 25 (2007) 452-456.
[34] Muralithran G., Ramesh S., “The effects of sintering temperature on the
properties of hydroxyapatite”, Ceramics International, 26 (2000) 221-230.
[35] Rhee S.-H., “Synthesis of hydroxyapatite via mechanochemical treatment”,
Biomaterials, 23 (2002) 1147-1152.
[36] Bett J.A.S., Christner L.G., Hall W.K., “Studies of the hydrogen held by solids.
XII. hydroxyapatite catalysts”, Journal of the American Chemical Society, 89
(1967) 5535-5541.
119
[37] Pramanik S., Agarwal A.K., Rai K.N., Garg A., “Development of high strength
hydroxyapatite by solid-state-sintering process”, Ceramics International, 33
(2007) 419-426.
[38] Lim G.K., Wang J., Ng S.C., Chew C.H., Gan L.M., “Processing of
hydroxyapatite via microemulsion and emulsion routes”, Biomaterials, 18 (1997)
1433-1439.
[39] Jarudilokkul S., Tanthapanichakoon W., Boonamnuayvittaya V., “Synthesis of
hydroxyapatite nanoparticles using an emulsion liquid membrane system”,
Colloids and Surfaces A: Physicochemical and Engineering Aspects, 296 (2007)
149–153.
[40] Koumoulidis G., Katsoulidis A., Ladavos A., Pomonis P., Trapalis C., Sdoukos
A., Vaimakis T., “Preparation of hydroxyapatite via microemulsion route”,
Journal of Colloid and Interface Science, 259 (2003) 254–260.
[41] Yang J., Yang P., Wang W., Gai S., Wang J., Zhang M., Lin J., “Synthesis and
characterization of Eu-doped hydroxyapatite through a microwave assisted
microemulsion process”, Solid State Sciences, 11 (2009) 1923–1928.
[42] Guo G., Sun Y., Wang Z., Guo H., “Preparation of hydroxyapatite nanoparticles
by reverse microemulsion”, Ceramics International, 31 (2005) 869–872.
[43] Shih W.J., Chen Y.H., Wang M.C., Hon , M.H. “Crystal growth and morphology
of the nano-sized hydroxyapatite powders synthesized from CaHPO4・2H2O and
CaCO3 by hydrolysis method”, Journal of Crystal Growth, 270 (2004) 211–218.
[44] Zhang X., Vecchio K., “Hydrothermal synthesis of hydroxyapatite rods”, Journal
of Crystal Growth, 308 (2007) 133–140.
[45] Feng W., Mu-Sen L., Yu-Peng L., Yong-Xin Q., “A simple sol–gel technique for
preparing hydroxyapatite nanopowders”, Materials Letters, 59 (2005) 916–919.
120
[46] Padmanabhan S., Balakrishnan A., Chu M., Lee Y., Kim T., Cho S., “Sol–gel
synthesis and characterization of hydroxyapatite nanorods”, Particuology, 7
(2009) 466–470.
[47] Liu D., Troczynski T., Tseng W., “Water-based sol-gel synthesis of
hydroxyapatite: Process development”, Biomaterials, 22 (2001) 1721-1730.
[48] Mobasherpour I., Heshajin M.S., Kazemzadeh A., Zakeri M., “Synthesis of
nanocrystalline hydroxyapatite by using precipitation method”, Journal of Alloys
and Compounds, 430 (2007) 330–333.
[49] Cengiz B., Gokce Y., Yildiz N., Aktas Z., Calimli A., “Synthesis and
characterization of hydroxyapatite nanoparticles”, Colloids and Surfaces A:
Physicochemical and Engineering Aspects, 322 (2008) 29-33.
[50] LeGeros R.Z., Lin S., Rohanizadeh R., Mijares D., LeGeros J.P., “Biphasic
calcium phosphate ceramics: Preparation, properties and applications”, Journal of
Materials Science: Materials in Medicine, 14 (2003) 201-209.
[51] Kay M.I., Young R.A., Posner A.S., “Crystal structure of hydroxyapatite”,
Nature, 204 (1964) 1050-1052.
[52] http://www.pentax.jp/english/lifecare/newceramics/apaceram/index.html, last
visited on 20 September 2010.
[53] Helson L.L., Wilson J., “An Introduction to Bioceramics”, World Scientific,
(1993) 139-180.
[54] Ramesh S., Tan C.Y., Sopyan I., Hamdi M., Teng W.D., “Consolidation of
nanocrystalline hydroxyapatite powder”, Science and Technology of Advanced
Materials, 8 (2007) 124-130.
121
[55] Kalita S.J., Bhardwaj A., Bhatt H.A., “Nanocrystalline calcium phosphate
ceramics in biomedical engineering”, Materials Science and Engineering C, 27
(2007) 441–449.
[56] Fernândez E., Gil F.J., Ginebra M.P., Driessens F.C.M., Planell J.A., Best S.M.,
“Calcium phosphate bone cements for clinical applications. Part I: Solution
chemistry”, Journal of Materials Science: Materials in Medicine, 10 (1999) 169-
176.
[57] Webster T.J., Ergun C., Doremus R.H., Siegel R.W., Bizios R., “Enhanced
osteoclast-like cell functions on nanophase ceramics”, Biomaterials, 22 (2001)
1327–1333.
[58] Webster T.J., Ergun C., Doremus R.H., Siegel R.W., Bizios R., “Enhanced
functions of osteoblasts on nanophase ceramics”, Biomaterials, 21 (2000) 1803–
1810.
[59] Catros S., Guillemot F., Lebraud E., Chanseau C., Perez S., Bareille R., Amedee
J., Fricain J.C., “Physico-chemical and biological properties of a nano
hydroxyapatite powder synthesized at room temperature”, Ingénierie et
Recherche Biomédicale (BioMedical Engineering and Research), 31 (2010) 226–
233.
[60] Chu C., Xue X., Zhu J., Yin Z., “Mechanical and biological properties of
hydroxyapatite reinforced with 40 vol.% titanium particles for use as hard tissue
replacement”, Journal of Materials Science: Materials in Medicine, 15 (2004)
665-670.
[61] Evis Z., Doremus R.H., “Coatings of hydroxyapatite-nanosize alpha alumina
composites on Ti-6Al-4V”, Materials Letters, 59 (2005) 3824-3827.
[62] He L.-H., Standard O.C., Huang T.T.Y., Latella B.A., Svain M.V., “Mechanical
behavior of porous hydroxyapatite”, Acta Biomaterialia, 4 (2008) 577-586.
122
[63] Bezzi G., Celotti G., Landi E., La Torretta T.M.G., Sopyan I., Tampieri A., “A
novel sol–gel technique for hydroxyapatite preparation”, Materials Chemistry
and Physics, 78 (2003) 816–824.
[64] Banerjee A., Bandyopadhyay A., Bose S., “Hydroxyapatite nanopowders:
Synthesis, densification and cell–materials interaction”, Materials Science and
Engineering C, 27 (2007) 729–735.
[65] Hench L.L., “Bioceramics: From concept to clinic” Journal of the American
Ceramic Society, 74 (1991) 1487-1510.
[66] Legeros R.Z., Legeros J.P., in An Introduction to Bioceramics, edited by Hench
L.L. and Wilson J., World Scientific, Singapore (1993) 33-39.
[67] Ahn E.S., Gleason N.J., Nakahira A., Ying J.Y., “Nanostructure processing of
hydroxyapatite-based bioceramics”, Nano Letters, 1 (2001) 149-153.
[68] Meyers M.A., Chen P.Y., Lin A.Y.M., Seki Y., “Biological materials: Structure
and mechanical properties”, Progress in Materials Science, 53 (2008) 1-206.
[69] Huang J., Best S.M., Bonfield W., Buckland T., “Development and
characterization of titanium-containing hydroxyapatite for medical applications”,
Acta Biomaterialia 6 (2010) 241–249.
[70] Ergun C., “Effect of Ti ion substitution on the structure of hydroxylapatite”,
Journal of the European Ceramic Society, 28 (2008) 2137-2149.
[71] Ergun C., Doremus R.H., Lanford W., “Hydroxylapatite and titanium: Interfacial
reactions”, Journal of Biomedical Materials Research Part A, 65A (2003) 336-
343.
[72] Kanchana P., Sekar C., “Influence of sodium fluoride on the synthesis of
hydroxyapatite by gel method”, Journal of Crystal Growth, 312 (2010) 808–816.
123
[73] Machoy-Mokrzynska A., “Fluoride- magnesium interaction”, Fluoride, Journal
of the International Society for Fluoride Research, 28 (1995) 175-177.
[74] Eslami H., Solati-Hashjin M., Tahriri M., “The comparison of powder
characteristics and physicochemical, mechanical and biological properties
between nanostructure ceramics of hydroxyapatite and fluoridated
hydroxyapatite”, Materials Science and Engineering A, 29 (2009) 1387-1398.
[75] Okazaki M., Miake Y., Tohda H., Yanagisawa T., Matsumoto T., Takahashi J.,
“Functionally graded fuoridated apatites”, Biomaterials, 20 (1999) 1421-1426.
[76] Cheng K., Weng W., Wang H., Zhang S., “In vitro behavior of osteoblast-like
cells on fluoridated hydroxyapatite coatings”, Biomaterials, 26 (2005) 6288–
6295.
[77] Gross K.A., Rodriguez-Lorenzo L.M., “Sintered hydroxyfluorapatites Part II:
mechanical properties of solid solutions determined by microindentation”
Biomaterials, 25 (2004) 1385–1394.
[78] Evis Z., Doremus R.H., “Effect of MgF2 on hot pressed hydroxylapatite and
monoclinic zirconia composites”, Journal of Materials Science, 42 (2007) 3739-
3744.
[79] Kuwahara H., Mazaki N., Takahashi M., Watanabe T., Yang X., Aizawa T.,
Materials Science and Engineering A 319-321 (2001) 687-691.
[80] Ponton C.B, Rawlings R.D., “Vickers indentation fracture toughness test part 1:
Review of literature and formulation of standardized indentation toughness
equation”, Materials Science and Technology, 5 (1989) 865-872.
[81] Kalita S.J., Bhatt H.A, “Nanocrystalline hydroxyapatite doped with magnesium
and zinc: Synthesis and characterization”, Materials Science and Engineering C,
27 (2007) 837-848.
124
[82] http://en.wikipedia.org/wiki/Dicalcium_phosphate last visited on July 2010.
[83] Gross K.A., Rodriguez-Lorenzo L.M., “Sintered hydroxyfluorapatites Part I:
Sintering ability of precipitated solid solution powders”, Biomaterials, 25 (2004)
1375–1384.
[84] Chenglin C., Jingchuan Z., Zhongda Y., Shidong W., “Hydroxyapatite–Ti
functionally graded biomaterial fabricated by powder metallurgy”, Materials
Science and Engineering A271 (1999) 95–100.
[85] Fang Y., Agrawal D.K., Roy D.M., “Fabrication of transparent hydroxyapatite
ceramics by ambient-pressure sintering”, Materials Letters, 23 (1995) 147-151.
[86] Basar B., Tezcaner A., Keskin D., Evis Z., “Improvements in microstructural,
mechanical, and biocompatibility properties of nano-sized hydroxyapatites doped
with yttrium and fluoride”, Ceramics International, 36 (2010) 1633-1643.
[87] Azami M., Jalilifiroozinezhad S., Mozafari M., Rabiee M., “Synthesis and
solubility of calcium fluoride/hydroxy-fluorapatite for dental application”,
Ceramics International, 37 (2011) 2007-2014.
[88] Slosarczyk A., Paluszkiewicz C., Gawlicki M., Paszkiewicz Z., “The FTIR
spectroscopy and QXRD studies of calcium phosphate based materials produced
from the powder precursors with different Ca/P ratios”, Ceramics International,
23 (1997) 297-304.
[89] Torrent-Burgues J., Rodriguez-Clemente R., “Hydroxyapatite precipitation in a
semibatch process”, Crystal Research and Technology, 36 (2001) 1075-1082.
[90] Kannan S., Ferreira J.M., “Synthesis and thermal stability of hydroxyapatite-
beta-tricalcium phosphate composites with cosubstituted sodium, magnesium,
and fluorine”, Chemistry of Materials, 18 (2006) 198-203.
125
[91] Azami M., Jalilifiroozinezhad S., Mozafari M., Rabiee M., “Synthesis and
solubility of calcium fluoride/hydroxy-fluorapatite for dental application”,
Ceramics International, 37(2011) 2007-2014.
[92] Ozek S.N., Tuna S., Erson-Bensan A.E., Severcan F., “Characterization of
microRNA-125b expression in MCF7 breast cancer cells by ATR-FTIR
spectroscopy”, Analyst, 135 (2010) 3094–3102.
[93] Qu H., Wei M., “Effect of fluorine content on mechanical properties of sintered
hydroxyapatite”, Materials Science and Engineering C, 26 (2006) 46-53.
[94] Linghong G., Hui L., “Phase transformations and structure characterization of
calcium polyphosphate during sintering process”, Journal of Materials Science,
39 (2004) 7041-7047.
[95] Toker S.M., Evis Z., Tezcaner A., “Investigation of microstructure,
microhardness and biocompatibility characteristics of yttrium and fluoride doped
hydroxyapatite”, 15th National Biomedical Engineering Meeting, Turkey (2010)
1-5.
[96] Bertoni E., Bigi A., Cojazzi G., Gandolfi M., Panzavolta S., Roveri N.,
“Nanocrystals of magnesium and fluoride substituted hydroxyapatite”, Journal of
Inorganic Biochemistry, 72 (1998) 29-35.
[97] Shannon R.D., “Revised effective ionic-radii and systematic studies of
interatomic distances in halides and chalcogenides”, Acta Crystallographica
Section A, 32 (1976) 751-767.
[98] Jha L.J., Best M., Knowles J.C., Rehman I., Santos J.D., Bonfield W.,
“Preparation and characterization of fluoride substituted apatites”, Journal of
Materials Science: Materials in Medicine, 8 (1997) 185-191.
126
[99] Ribeiro, C.C., Gibson I., Barbosa M.A., “The uptake of titanium ions by
hydroxyapatite particles — structural changes and possible mechanisms”,
Biomaterials, 27 (2006) 1749.
[100] El Kady A., Mohamed K.R., El-Bassyouni G.T., “Fabrication, characterization
and bioactivity evaluation of calcium pyrophosphate/polymeric biocomposites”,
Ceramics International, 35 (2009) 2933–2942.
[101] Douard N., Detsch R., Ghodsina R.C., Damia C., Deisinger U., Champion E.,
“Processing, physico-chemical characterisation and in vitro evaluation of silicon
containing β-tricalcium phosphate ceramics”, Materials Science and Engineering
C, 31 (2011) 531-539.
[102] Chen L., Wang Z., Lin C., “Preparation and characterization of nano-sized HA
particles and HA/chitosan naano-composite for use in biomedical materials”,
Materials Letters, 57 (2002) 858-861.
[103] Oliveira Ugarte J.F., Sena L.A., Castro Perez C.A., Aguiar P.F., Rossi A.M.,
Soares G.A., “Influence of processing parameters on structural characteristics of
porous calcium phosphate samples: A study using an experimenta design
method”, Materials Research, 8 (2005) 71-76.
[104] Sanosh K.P., Chu M.C., Balakrishan A., Lee Y.J., Kim T.N., Cho S.J.,
“Preparation and characterization of nano-hydroxyapatite powder using sol-gel
technique”, Current Applied Physics, 9 (2009) 1459-1462.
[105] Pushpakanth S., Srinivasan B., Sreedhar B., Sastry T.P., “An in situ approach to
prepare nanorods of titania-hydroxyapatite (TiO2-HAp) nanocomposite by
microwave hydrothermal technique”, Material Chemical Physics, 107 (2008)
492-498.
127
[106] Ergun C., Evis Z., Webster T. J., Sahin F. C.,“Synthesis and microstructural
characterization of nano-size calcium phosphates with different stoichiometry”,
Ceramics International, 37 (2011) 971-977.
[107] Kannan S., Rocha J.H.G, Ventura J.M.G., Lemos A.F., Ferreira J.M.F., “Effect
of Ca/P ratio of precursors on the formation of different apatitic ceramics-an X-
ray diffraction study”, Scripta Materialia, 53 (2005) 1259-1262.
[108] Bandyopadhyay A., Withey E.A., Moore J., Bose S., “Influence of ZnO doping
in calcium phosphate ceramics”, Materials Science and Engineering C, 27 (2007)
14-17.
[109] Maciejewski M., Brunner T.J., Loher S.L., Stark W.J., Baiker A., “Phase
transitions in amourphous calcium phosphates with different Ca/P ratios”,
Thermochimia Acta, 468 (2008) 75-80.
[110] Petrov O.E., Dyulgerova E., Petrov L., Popova R., “Characterization of calcium
phosphate phases obtained during the preparation of sintered biphase Ca-P
ceramics”, Materials Letters, 48 (2001) 162-167.
[111] Raynaud S., Champion E., Bernache-Assollant D., “Calcium phosphate apatites
with variable Ca/P atomic ratio II. Calcination and sintering”, Biomaterials, 23
(2002) 1073-1080.
[112] Ergun C., Doremus R.H., “Thermal stability of hydroxylapatite-titanium and
hydroxylapatite-titania composites”, Turkish Journal Engineering and
Environmental Sciences, 27 (2003) 423-429.
[113] Wang Q.B., Wang Q.G., Wan C.X., “Effect of sintering time on the
microstructure and properties of inorganic polyphosphate bioceramics”, Science
of Sintering, 42 (2010) 337-343.
128
[114] Bohner M., Galea L., Doebelin N., “Calcium phosphate bone graft substitute:
failures and hopes”, Journal of the European Ceramic Society, (2012)
doi:10.1016/j.jeurceramsoc.2012.02.028.
[115] Wu S.C., Hsu H.C., Hsu S.K., Wang W.S., Ho W.F., “Preparation and
characterization of four different compositions of calcium phosphate scaffolds
for bone tissue engineering”, Materials Characterization, 62 (2011) 526-534.
[116] Klawitter J.J., Hulbert S.F., “Application of porous ceramics for the attachment
of load bearing internal orthopedic applications”, Journal of Biomedical
Materials Research Symposium, 2 (1971) 151-229.
[117] Chou L., Marek B., Wagner W.R., “Effects of hydroxylapatite coating
crystallinity on biosolubility, cell attachment efficiency and proliferation in
vitro”, Biomaterials, 20 (1999) 977-985.
[118] Slosarczyk A., Zima A., Paszkiewicz, Szczepaniak J., Aza A.H., Chroscicka A.,
“The influence of titanium on physicochemical properties of Ti-modified
hydroxyapatite materials”, Ceramic Materials, 62 (2010) 369-375.
[119] Graeve O.A., Kanakala R., Madadi A., Williams B.C., Glass K.C.,
“Luminescence variations in hydroxyapatites doped with Eu2+ and Eu3+ ions”,
Biomaterials, 31 (2010) 4259-4267.
[120] Cakmak G., Togan I., Severcan F., “17β- Estradial induced compositional,
structural and functional changes in rainbow throut liver, revealed by FTIR
spectroscopy: A comparative study with nonylphenol”, Aquatic Toxicology 77
(2006)53-63.
[121] Kim H.W., Noh Y.J., Koh Y.H., Kim H.E., “ Enhanced performance of fluorine
substituted hydroxyapatite composites for hard tissue engineering ”, Journal of
Materials Science: Materials in Medicine 14 (2003) 899-904.
129
Personal Details
Nationality TurkishMarital Status MarriedEducation and Qualifications
09.2002 – Today Middle East Technical University, PhD. Student at Dept. ofEngineering Sciences.
09.1997 – 09.2002 Ankara University. Bachelor degree, Dept. of Physics.09.1991 – 01.1996 Milli Piyango Anatolian High School.Publications/Conferences
2008 Güngör-Geridönmez S., Birlik G., Sezgin Ö.C., ‘Vibration Exposure of Lying Persons in an Ambulance’16th Japan Conference on Human Response to Vibration, Yonago, Japan.
2009 Güngör-Geridönmez S., Birlik G., Sezgin Ö.C., ‘Vibration Exposure of Supine and Semi Supine Subjects’ 4th International Conference on Whole Body Vibration Injuries, Montreal, Canada.
2011 Maeda S., Güngör Geridönmez S., Miyashita K., Ishimatsu K., ‘Frequency weighting of Hand-Transmitted Vibration for Evaluating Comfort’ 12th International Conference on Hand-Arm Vibration, Ottowa, Canada.
2011 Maeda S., Güngör Geridönmez S., Miyashita K., Ishimatsu K., ‘Transition of Frequency-Weighting Curves of Hand-Arm Vibration Evaluation’ 19th Japan Conference on Human Response to Vibration, Nagoya, Japan.
2011 Maeda S., Güngör Geridönmez S., Miyashita K., Ishimatsu K., ‘Validation of Frequency Weightings of Hand-Transmitted Vibration for Evaluating Comfort’ Inter-noise 2011, Osaka, Japan.
2011 Kalyoncuoğlu, T., Yılmaz, B., Güngör-Geridönmez S., Kansu, G., ‘An attempt to improve clinical performance of dental implants: A pilot study’ European Prosthodontic Association (EPA) Congress, Bern, Switzerland.
2012 Güngör-Geridönmez S., Evis Z., ‘Synthesis and microstructural characterization of nano-sized hydroxyapatite doped with titanium and fluoride ions ’ Nanomaterials for Biomedical Technologies Conference, Frankfurt, Germany.
English, Dutch Very Good, Good
Güngör-Geridönmez S., Birlik G., Sezgin Ö.C., ‘Response of Recumbent Persons to Random Vibrations’ Inter-Noise 2007, Istanbul, Turkey.
Serap Güngör GeridönmezGüzeltepe Sok. 35 / 3 Demirlibahçe ANKARA
2007
VITA