The City of New York Mayor’s Office of Operations Office ...

NEW YORK STATE DEPARTMENT OF HEALTH Office of Quality and Patient Safety
EXTERNAL QUALITY REVIEW
TECHNICAL REPORT
FOR
NEIGHBORHOOD HEALTH PROVIDERS, LLC
Reporting Year 2011
Published May 2013

Table of Contents
I. About This Report ............................................................................................................. 1
II. Corporate Profile ............................................................................................................... 2
III. Enrollment and Provider Network .................................................................................. 3
Enrollment ............................................................................................................................................................................................ 3 Provider Network ................................................................................................................................................................................ 4 NYSDOH Primary Care and OB/GYN Access and Availability Survey – 2011 ................................................................ 7
IV. Utilization ........................................................................................................................... 8
Encounter Data ................................................................................................................................................................................... 8 QARR Use of Services Measures.................................................................................................................................................... 9
V. Quality Indicators ............................................................................................................ 10
Validation of Performance Measures Reported by Plans and Performance Measures Calculated by the NYSDOH ..................................................................................................................................... 10 Summary of HEDIS® 2012 Information System Audit™ ................................................................................................... 10 QARR Access to/Availability of Care Measures ....................................................................................................................... 14 QARR Prenatal Care Measures Calculated by the NYSDOH ............................................................................................. 15 Consumer Satisfaction .................................................................................................................................................................... 16 Quality Performance Matrix Analysis 2011 Measurement Year ....................................................................................... 17 Quality Incentive – PQI/Compliance/Satisfaction/Quality Points ........................................................................................ 19 Performance Improvement Project ............................................................................................................................................. 21 Clinical Study ..................................................................................................................................................................................... 22
VI. Deficiencies and Appeals ................................................................................................. 24
Compliance with NYS Structure and Operation Standards ................................................................................................ 24
VII. Strengths and Opportunities for Improvement ........................................................... 27
Strengths ............................................................................................................................................................................................ 27 Opportunities for Improvement ................................................................................................................................................... 27 Recommendations ........................................................................................................................................................................... 28 Response to Previous Year’s Recommendations ..................................................................................................................... 28
VIII. Appendix ........................................................................................................................... 31
References ......................................................................................................................................................................................... 31
Neighborhood Health Providers, LLC Page i of ii Reporting Year 2011
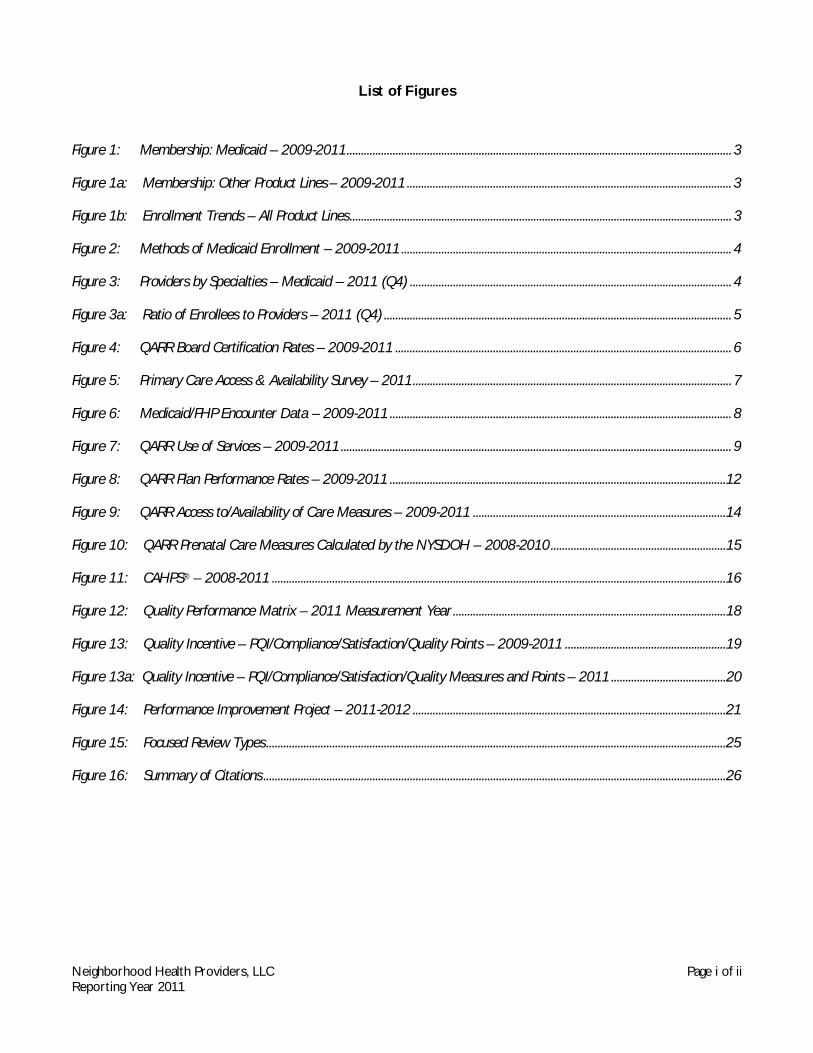
List of Figures
Figure 1: Membership: Medicaid – 2009-2011 ...................................................................................................................................... 3
Figure 1a: Membership: Other Product Lines – 2009-2011 ................................................................................................................. 3
Figure 1b: Enrollment Trends – All Product Lines ..................................................................................................................................... 3
Figure 2: Methods of Medicaid Enrollment – 2009-2011 ................................................................................................................... 4
Figure 3: Providers by Specialties – Medicaid – 2011 (Q4) ................................................................................................................ 4
Figure 3a: Ratio of Enrollees to Providers – 2011 (Q4) ......................................................................................................................... 5
Figure 4: QARR Board Certification Rates – 2009-2011 ..................................................................................................................... 6
Figure 5: Primary Care Access & Availability Survey – 2011 ............................................................................................................... 7
Figure 6: Medicaid/FHP Encounter Data – 2009-2011 ....................................................................................................................... 8
Figure 7: QARR Use of Services – 2009-2011 ........................................................................................................................................ 9
Figure 8: QARR Plan Performance Rates – 2009-2011 ..................................................................................................................... 12
Figure 9: QARR Access to/Availability of Care Measures – 2009-2011 ........................................................................................ 14
Figure 10: QARR Prenatal Care Measures Calculated by the NYSDOH – 2008-2010 ............................................................. 15
Figure 11: CAHPS® – 2008-2011 .............................................................................................................................................................. 16
Figure 12: Quality Performance Matrix – 2011 Measurement Year ............................................................................................... 18
Figure 13: Quality Incentive – PQI/Compliance/Satisfaction/Quality Points – 2009-2011 ........................................................ 19
Figure 13a: Quality Incentive – PQI/Compliance/Satisfaction/Quality Measures and Points – 2011 ........................................ 20
Figure 14: Performance Improvement Project – 2011-2012 ............................................................................................................. 21
Figure 15: Focused Review Types ................................................................................................................................................................ 25
Figure 16: Summary of Citations ................................................................................................................................................................. 26
Neighborhood Health Providers, LLC Page ii of ii Reporting Year 2011
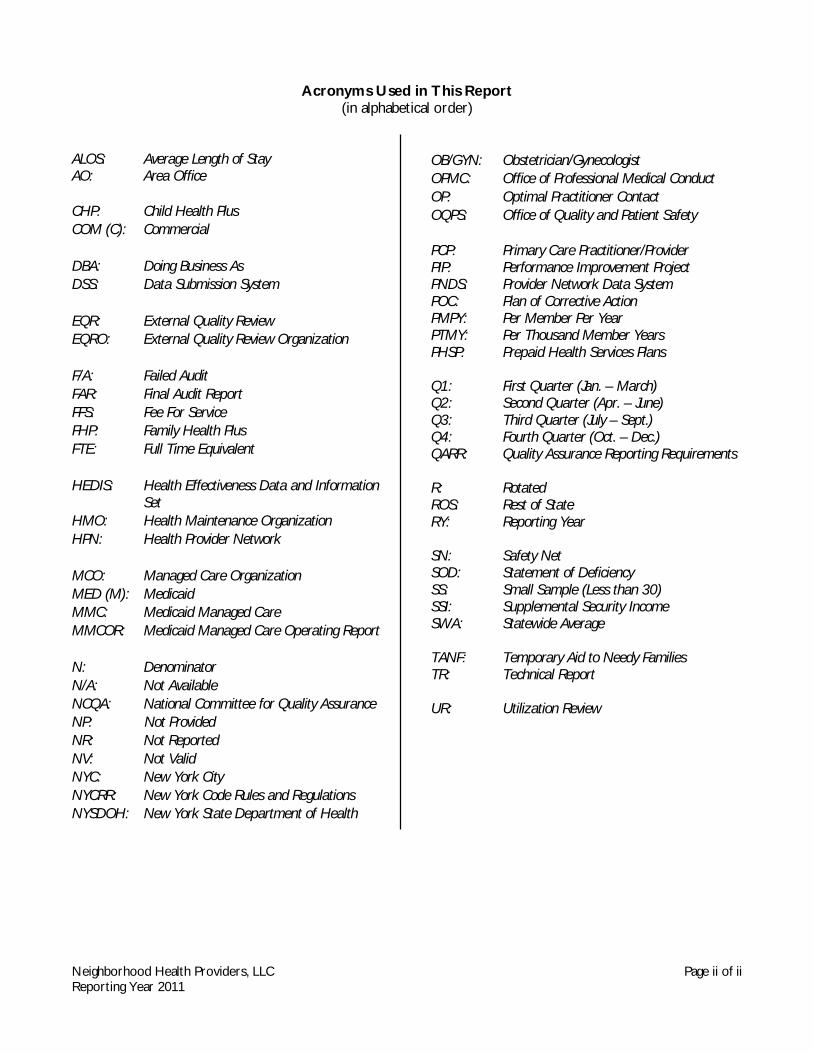
Acronyms Used in This Report
(in alphabetical order) ALOS: Average Length of Stay AO: Area Office CHP: Child Health Plus COM (C): Commercial DBA: Doing Business As DSS: Data Submission System EQR: External Quality Review EQRO: External Quality Review Organization F/A: Failed Audit FAR: Final Audit Report FFS: Fee For Service FHP: Family Health Plus FTE: Full Time Equivalent HEDIS: Health Effectiveness Data and Information
Set HMO: Health Maintenance Organization HPN: Health Provider Network MCO: Managed Care Organization MED (M): Medicaid MMC: Medicaid Managed Care MMCOR: Medicaid Managed Care Operating Report N: Denominator N/A: Not Available NCQA: National Committee for Quality Assurance NP: Not Provided NR: Not Reported NV: Not Valid NYC: New York City NYCRR: New York Code Rules and Regulations NYSDOH: New York State Department of Health
OB/GYN: Obstetrician/Gynecologist OPMC: Office of Professional Medical Conduct OP: Optimal Practitioner Contact OQPS: Office of Quality and Patient Safety PCP: Primary Care Practitioner/Provider PIP: Performance Improvement Project PNDS: Provider Network Data System POC: Plan of Corrective Action PMPY: Per Member Per Year PTMY: Per Thousand Member Years PHSP: Prepaid Health Services Plans Q1: First Quarter (Jan. – March) Q2: Second Quarter (Apr. – June) Q3: Third Quarter (July – Sept.) Q4: Fourth Quarter (Oct. – Dec.) QARR: Quality Assurance Reporting Requirements R: Rotated ROS: Rest of State RY: Reporting Year SN: Safety Net SOD: Statement of Deficiency SS: Small Sample (Less than 30) SSI: Supplemental Security Income SWA: Statewide Average TANF: Temporary Aid to Needy Families TR: Technical Report UR: Utilization Review

Neighborhood Health Providers, LLC Page 1 of 31 Reporting Year 2011
I. About This Report New York State (NYS) is dedicated to providing and maintaining the highest quality of care for enrollees in managed health care plans. The New York State Department of Health’s (NYSDOH) Office of Quality and Patient Safety (OQPS) employs an ongoing strategy to improve the quality of care provided to plan enrollees, to ensure the accountability of these plans and to maintain the continuity of care to the public. The technical reports are individualized reports on the managed care organizations (MCOs) certified to provide Medicaid coverage in NYS. In accordance with federal requirements, these reports summarize the results of the 2011 External Quality Review (EQR) to evaluate access to, timeliness of and quality of care provided to NYS Medicaid beneficiaries. Mandatory EQR-related activities (as per Federal Regulation 42 CFR §438.358) reported include validation of performance improvement projects (PIPs), validation of plan-reported and NYSDOH-calculated performance measures and review for plan compliance with NYSDOH structure and operation standards. Optional EQR-related activities (as per Federal Regulation 42 CFR §438.358) reported include administration of a consumer survey of quality of care (CAHPS®) by an NCQA-certified vendor and technical assistance by the NYS EQRO to plans regarding PIPs and reporting performance measures. Other data incorporated to provide additional background on the MCOs include the following: health plan corporate structure, enrollment and disenrollment data, provider network information, encounter data summaries, PQI/compliance/satisfaction/quality points and incentive and appeal summaries. These reports are organized into the following domains: Corporate Profile, Enrollment and Provider Network, Utilization, Quality Indicators and Deficiencies and Appeals. Although the reports focus primarily on Medicaid and Child Health Plus (CHP) data, selected sections of these reports also include data from the plans’ Family Health Plus (FHP) and Commercial product lines. Additionally, when available and appropriate, the plans’ data are compared with statewide benchmarks. Unless otherwise noted, when benchmarks are utilized for rates other than HEDIS®/QARR or CAHPS®, comparative statements are based on differences determined by standard deviations: a difference of one standard deviation is used to determine rates that are higher or lower than the statewide average. Section VII provides an assessment of the MCO’s strengths and opportunities for improvement in the areas of accessibility, timeliness and quality of services. For areas in which the plan has opportunities for improvement, recommendations for improving the quality of the MCO’s health care services are provided. To achieve full compliance with federal regulations, this section also includes an assessment of the degree to which the MCO has effectively addressed the recommendations for quality improvement made by the NYS EQRO in the previous year’s EQR report. The MCO was given the opportunity to describe current and proposed interventions that address areas of concern, as well as an opportunity to explain areas that the MCO did not feel were within its ability to improve. The response by the MCO is appended to this section of the report. In an effort to provide the most consistent presentation of this varied information, the technical report is prepared based on data for the most current calendar year available. Where trending is desirable, data for prior calendar years may also be included. This report includes data for Reporting Year 2011.
Neighborhood Health Providers, LLC Page 2 of 31 Reporting Year 2011
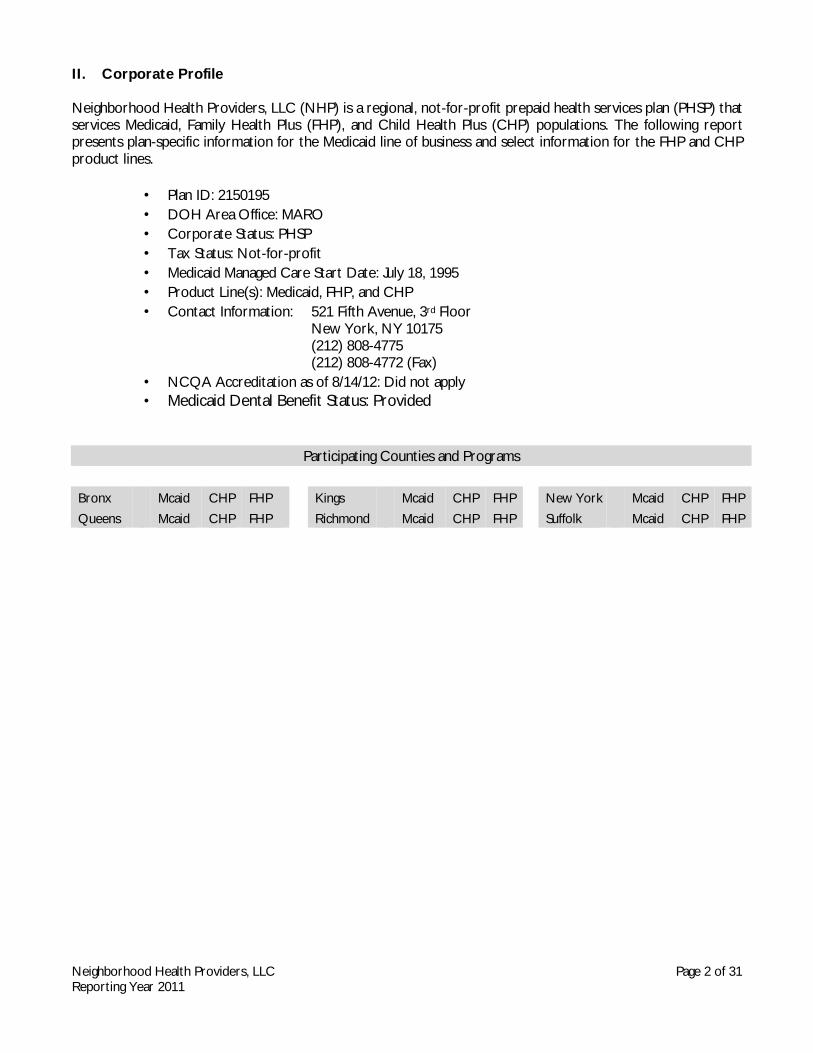
II. Corporate Profile Neighborhood Health Providers, LLC (NHP) is a regional, not-for-profit prepaid health services plan (PHSP) that services Medicaid, Family Health Plus (FHP), and Child Health Plus (CHP) populations. The following report presents plan-specific information for the Medicaid line of business and select information for the FHP and CHP product lines.
• Plan ID: 2150195 • DOH Area Office: MARO • Corporate Status: PHSP • Tax Status: Not-for-profit • Medicaid Managed Care Start Date: July 18, 1995 • Product Line(s): Medicaid, FHP, and CHP • Contact Information: 521 Fifth Avenue, 3rd Floor
New York, NY 10175 (212) 808-4775 (212) 808-4772 (Fax)
• NCQA Accreditation as of 8/14/12: Did not apply • Medicaid Dental Benefit Status: Provided
Participating Counties and Programs
Bronx Mcaid CHP FHP
Kings Mcaid CHP FHP
New York Mcaid CHP FHP
Queens Mcaid CHP FHP
Richmond Mcaid CHP FHP
Suffolk Mcaid CHP FHP

Neighborhood Health Providers, LLC Page 3 of 31 Reporting Year 2011
III. Enrollment and Provider Network Enrollment Figure 1 depicts total membership for the plan’s Medicaid product line for calendar years 2009 to 2011, as well as the percent change from the previous year. Membership has fluctuated over this period, decreasing by 3.2% from 2009 to 2010 and increasing by 1.7% from 2010 to 2011. Figure 1a represents the membership for other product lines carried by the plan. Figure 1b trends Medicaid membership and membership in these other product lines.
Figure 1: Membership: Medicaid – 2009-2011
2009 2010 2011 Number of Members 179,893 174,077 176,989
% Change From Previous Year -3.2% 1.7% Data Source: MEDS II
Figure 1a: Membership: Other Product Lines – 2009-2011 2009 2010 2011
FHP 20,529 18,609 19,711
CHP 12,860 12,633 12,911 Data Source: Managed Care Enrollment Report
Figure 1b: Enrollment Trends – All Product Lines
Neighborhood Health Providers, LLC Page 4 of 31 Reporting Year 2011
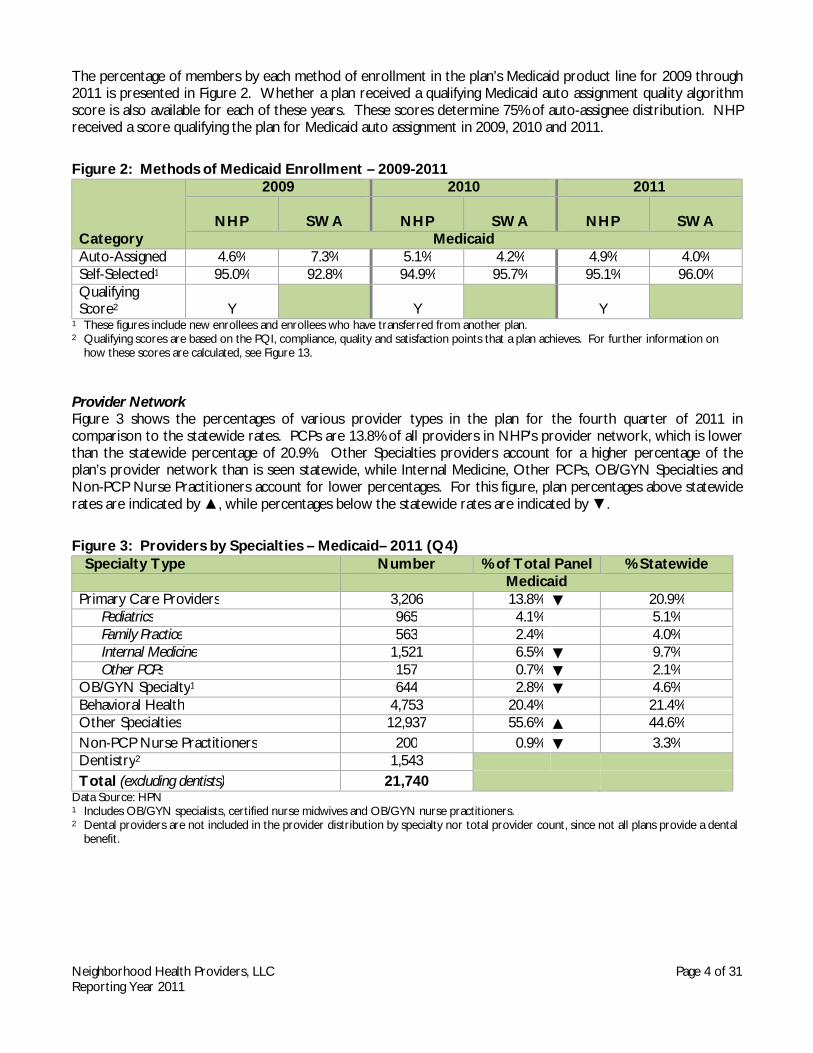
The percentage of members by each method of enrollment in the plan’s Medicaid product line for 2009 through 2011 is presented in Figure 2. Whether a plan received a qualifying Medicaid auto assignment quality algorithm score is also available for each of these years. These scores determine 75% of auto-assignee distribution. NHP received a score qualifying the plan for Medicaid auto assignment in 2009, 2010 and 2011.
Figure 2: Methods of Medicaid Enrollment – 2009-2011
Category
2009 2010 2011
NHP
SWA NHP
SWA NHP
SWA Medicaid
Auto-Assigned 4.6% 7.3% 5.1% 4.2% 4.9% 4.0% Self-Selected1 95.0% 92.8% 94.9% 95.7% 95.1% 96.0% Qualifying Score2 Y Y Y
1 These figures include new enrollees and enrollees who have transferred from another plan. 2 Qualifying scores are based on the PQI, compliance, quality and satisfaction points that a plan achieves. For further information on
how these scores are calculated, see Figure 13. Provider Network Figure 3 shows the percentages of various provider types in the plan for the fourth quarter of 2011 in comparison to the statewide rates. PCPs are 13.8% of all providers in NHP’s provider network, which is lower than the statewide percentage of 20.9%. Other Specialties providers account for a higher percentage of the plan’s provider network than is seen statewide, while Internal Medicine, Other PCPs, OB/GYN Specialties and Non-PCP Nurse Practitioners account for lower percentages. For this figure, plan percentages above statewide rates are indicated by ▲, while percentages below the statewide rates are indicated by ▼.
Figure 3: Providers by Specialties – Medicaid– 2011 (Q4)
Specialty Type Number % of Total Panel % Statewide Medicaid
Primary Care Providers 3,206 13.8% ▼ 20.9% Pediatrics 965 4.1% 5.1% Family Practice 563 2.4% 4.0% Internal Medicine 1,521 6.5% ▼ 9.7% Other PCPs 157 0.7% ▼ 2.1%
OB/GYN Specialty1 644 2.8% ▼ 4.6% Behavioral Health 4,753 20.4% 21.4% Other Specialties 12,937 55.6% ▲ 44.6% Non-PCP Nurse Practitioners 200 0.9% ▼ 3.3% Dentistry2 1,543 Total (excluding dentists) 21,740
Data Source: HPN 1 Includes OB/GYN specialists, certified nurse midwives and OB/GYN nurse practitioners. 2 Dental providers are not included in the provider distribution by specialty nor total provider count, since not all plans provide a dental
benefit.
Neighborhood Health Providers, LLC Page 5 of 31 Reporting Year 2011
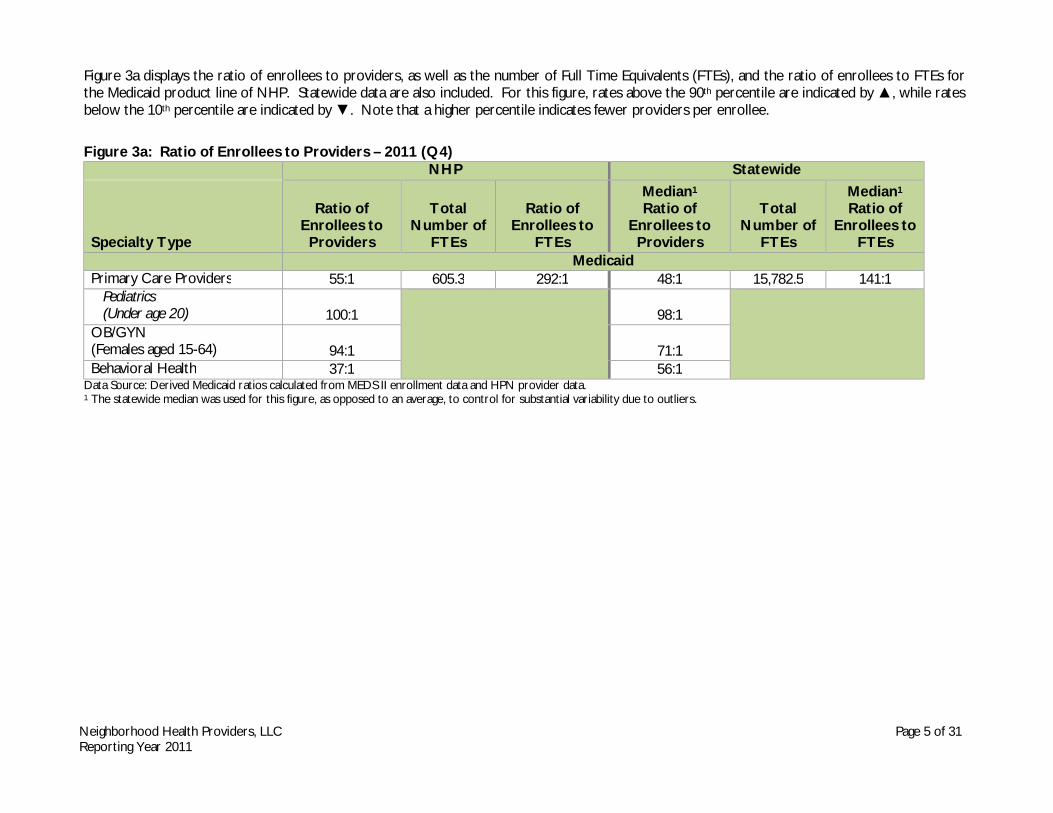
Figure 3a displays the ratio of enrollees to providers, as well as the number of Full Time Equivalents (FTEs), and the ratio of enrollees to FTEs for the Medicaid product line of NHP. Statewide data are also included. For this figure, rates above the 90th percentile are indicated by ▲, while rates below the 10th percentile are indicated by ▼. Note that a higher percentile indicates fewer providers per enrollee.
Figure 3a: Ratio of Enrollees to Providers – 2011 (Q4) NHP Statewide
Specialty Type
Ratio of Enrollees to
Providers
Total Number of
FTEs
Ratio of Enrollees to
FTEs
Median1 Ratio of
Enrollees to Providers
Total Number of
FTEs
Median1 Ratio of
Enrollees to FTEs
Medicaid Primary Care Providers 55:1 605.3 292:1 48:1 15,782.5 141:1
Pediatrics (Under age 20) 100:1
98:1
OB/GYN (Females aged 15-64) 94:1 71:1 Behavioral Health 37:1 56:1
Data Source: Derived Medicaid ratios calculated from MEDS II enrollment data and HPN provider data. 1 The statewide median was used for this figure, as opposed to an average, to control for substantial variability due to outliers.

Neighborhood Health Providers, LLC Page 6 of 31 Reporting Year 2011
Figure 4 displays QARR Board Certification rates for 2009 through 2011 of providers in the plan’s network in comparison to the statewide averages (SWAs). The Figure also indicates whether the plan’s rate was above (indicated by ▲) or below (indicated by ▼) the statewide average. The plan’s 2011 Medicaid and CHP board certification rates are higher than the statewide averages for Internal Medicine, Geriatricians and Other Physician Specialists.
Figure 4: QARR Board Certification Rates – 2009-2011
Provider Type 2009 2010 2011
NHP SWA NHP SWA NHP SWA Medicaid
Family Medicine 77% ▼ 81% 77% 80% 78% 80% Internal Medicine 85% 83% 83% ▲ 81% 84% ▲ 81% Pediatricians 79% ▼ 82% 77% ▼ 82% 81% 82% OB/GYN 76% 77% 75% 76% 79% 77% Geriatricians 81% ▲ 73% 77% 73% 82% ▲ 73% Other Physician Specialists 82% ▲ 79% 84% ▲ 79% 86% ▲ 80%
Child Health Plus (CHP) Family Medicine 78% 79% Internal Medicine 84% ▲ 80% Pediatricians 81% 81% OB/GYN 79% 77% Geriatricians 82% ▲ 70% Other Physician Specialists 86% ▲ 80%

Neighborhood Health Providers, LLC Page 7 of 31 Reporting Year 2011
NYSDOH Primary Care and OB/GYN Access and Availability Survey – 2011 On behalf of the NYSDOH’s Division of Health Plan Contracting and Oversight, the NYS EQRO conducts the Medicaid Managed Care Access and Availability Survey to assess the compliance of network providers in NYS MCOs with appointment timeframe requirements as per the NYS Medicaid/Family Health Plus Managed Care Contract. The survey evaluates the availability of routine and non-urgent “sick” office hour appointments with primary care physicians, including OB/GYNs, as well as the availability of after hours access. The timeliness standard for routine office hour appointments with PCPs and OB/GYNs is within 28 days of the enrollee’s request, while non-urgent “sick” office hour appointments with PCPs and OB/GYNs must be scheduled within 72 hours (excluding weekends and holidays) as clinically indicated. Prenatal appointments with OB/GYN providers within the 2nd trimester must be given within 14 days, while 3rd trimester appointments must be given within 7 days. After hours access is considered compliant if a live voice representing the named provider is reached or if the named provider’s beeper number is reached. A random sample of 240 provider sites was selected from each region in which a health plan operated and provided primary care as a Medicaid and/or Family Health Plus benefit. Of these 240 provider sites, 120 were surveyed for routine appointments, 80 were surveyed for non-urgent “sick” appointments and 40 were surveyed for after hours access. For MCOs with less than the 240 available provider sites, all providers were selected. For call type categories in which compliance is below the 75% threshold, plans will receive a Statement Of Deficiency (SOD) issued by the NYSDOH and will be required to develop a Plan Of Correction (POC). These POCs must be approved by the NYSDOH before implementation. Following an allowable time period for plans to execute their POCs, a resurvey will be conducted of the failed providers. Figure 5 illustrates the plan’s Primary Care and OB/GYN Access and Availability results for 2011. NHP exceeded the 75% threshold for routine and non-urgent appointments in Regions 6 and 7, and exceeded the threshold for after hours access in Region 7.
Figure 5: Primary Care Access & Availability Survey – 2011
Region Call Type NHP Region Average
6 Routine 88.3% 71.8% Non-Urgent “Sick” 78.8% 70.0% After Hours Access 47.5% 44.9%
7 Routine 83.8% 72.4% Non-Urgent “Sick” 85.9% 69.6% After Hours Access 78.9% 64.7%

Neighborhood Health Providers, LLC Page 8 of 31 Reporting Year 2011
IV. Utilization This section of the report explores utilization of the health plan’s services by examining encounter and health screening data, as well as QARR Use of Services rates. Encounter Data Figure 6 depicts selected Medicaid encounter data for 2009 through 2011. The plan’s rates for these periods are also compared to the average plan rates. For this figure, rates above the statewide average are indicated by ▲, while rates below the statewide average are indicated by ▼.
Figure 6: Medicaid/FHP Encounter Data – 2009-2011
Encounters (PMPY)
2009 2010 2011
NHP SWA NHP SWA NHP SWA PCPs and OB/GYNs 3.96 4.32 4.21 4.71 4.27 4.65 Specialty 1.85 1.76 2.17 2.12 2.32 2.07 Emergency Room 0.58 0.68 0.63 0.65 0.63 0.63 Inpatient Admissions 0.16 0.15 0.18 0.16 0.18 ▲ 0.15 Dental – Medicaid 0.71 0.95 0.81 0.93 0.90 0.96 Dental – FHP 0.78 1.10 0.85 1.10 1.09 1.12
Data Source: MEDS II PMPY: Per Member Per Year

Neighborhood Health Providers, LLC Page 9 of 31 Reporting Year 2011
QARR Use of Services Measures For this domain of measures, the QARR reports assess performance by indicating whether the plan’s rates reached the 90th or 10th percentiles. Figure 7 lists the Use of Services rates for the selected plan product lines for 2009 through 2011. The Figure indicates whether the plan’s rate was higher than 90% of all rates for that measure (indicated by ▲) or whether the plan’s rate was lower than 90% of all rates for that measure (indicated by ▼).
Figure 7: QARR Use of Services – 2009-2011
Measure
Medicaid/FHP Child Health Plus
2009 2010 2011 SWA 2011 2009 2010 2011
SWA 2011
Outpatient Utilization (PTMY) Outpatient Visits 4,711.6 4,899.0 5,110.1 5,487.6 3,137.3 ▼ 3,089.3 3,294.6 ▼ 4,205.6 Outpatient ER Visits 628.2 608.9 623.4 568.7 356.8 315.1 344.4 286.3 Inpatient ALOS Medicine 3.9 3.6 4.0 3.7 3.1 2.8 3.5 2.8 Surgery 5.7 6.1 5.6 5.7 4.3 6.4 ▲ 5.1 ▲ 4.2 Maternity 3.1 ▲ 3.1 ▲ 3.0 2.9 SS 2.4 ▼ SS 2.7 Total (Medicine, Surgery & Maternity) 3.9 3.9 3.9 3.7 3.3 3.9 3.9 3.2 Inpatient Utilization (PTMY) Medicine Cases 61.8 ▲ 54.4 55.2 47.9 22.1 ▲ 15.1 19.6 ▲ 11.8 Surgery Cases 16.2 19.9 16.3 15.9 5.2 8.2 ▲ 7.4 ▲ 4.5 Maternity Cases 56.1 60.4 60.2 ▲ 44.2 SS 3.8 ▲ SS 1.6 Total Cases 116.3 115.9 112.9 ▲ 95.3 28.6 ▲ 25.8 ▲ 28.5 ▲ 17.2 PTMY: Per Thousand Member Years ALOS: Average Length of Stay. These rates are measured in days. SS: Sample size too small to report (less than 30 members) but included in the statewide average.
Neighborhood Health Providers, LLC Page 10 of 31 Reporting Year 2011
V. Quality Indicators
To measure the quality of care provided by the plans, the State prepares and reviews a number of reports on a variety of quality indicators. This section is a summary of findings from these reports, including HEDIS® 2012/QARR 2011 audit findings, as well as results of quality improvement studies, enrollee surveys and plan Performance Improvement Projects (PIPs). Validation of Performance Measures Reported by Plans and Performance Measures Calculated by the NYSDOH Performance measures are reported and validated using several methodologies. Plans submitted member- and provider-level data for several measures to the NYSDOH. The NYS EQRO audited all member- and provider-level data for internal consistency. Several performance measures are calculated by the NYSDOH, with source code validated by the NYS EQRO. Finally, plans report a subset of HEDIS® measures to the NYSDOH annually, along with several NYS-specific measures. Plan-reported performance measures were validated as per HEDIS® 2012 Compliance AuditTM specifications developed by the National Committee for Quality Assurance (NCQA). The results of each plan’s HEDIS® 2012 Compliance AuditTM are summarized in its Final Audit Report (FAR). Summary of HEDIS® 2012 Information System Audit™ As part of the HEDIS® 2012 Compliance AuditTM, auditors assessed the plan’s compliance with NCQA standards in the six designated information system categories, as follows:
1. Sound Coding Methods for Medical Data 2. Data Capture, Transfer and Entry – Medical Data 3. Data Capture, Transfer and Entry – Membership Data 4. Data Capture, Transfer and Entry – Practitioner Data 5. Data Integration Required to Meet the Demands of Accurate HEDIS® Reporting 6. Control Procedures that Support HEDIS® Reporting and Integrity
In addition, two HEDIS® related documentation categories were assessed:
1. Documentation 2. Outsourced or Delegated HEDIS® Reporting Functions
The NYS EQRO provided technical assistance to plans throughout the performance measure reporting process in the following forms: 1) introductory and technical workshops prior to the audit, 2) readiness reviews for new plans, 3) serving as a liaison between the plans and NCQA to clarify questions regarding measure specifications, 4) preparation of and technical support for the Data Submission System (DSS) used to submit data to the NYSDOH and 5) clarifications to plan questions regarding the submission of member- and provider-level data, as well as general questions regarding the audit process. The HEDIS® 2012 Final Audit Report (FAR) prepared for NHP indicates that the plan had no significant problems in any area related to reporting. The plan demonstrated compliance with all areas of the Information Systems and all areas of measure determination required for successful HEDIS®/QARR reporting. The plan used NCQA-certified software to produce HEDIS® measures. Supplemental databases used to capture additional data were validated and determined to be HEDIS®-compliant by the auditors. No issues were identified with the transfer or mapping of the data elements for reporting. The plan passed Medical Record Review for the two measures validated. The plan was able to report all measures for Medicaid and CHP product lines.
Neighborhood Health Providers, LLC Page 11 of 31 Reporting Year 2011
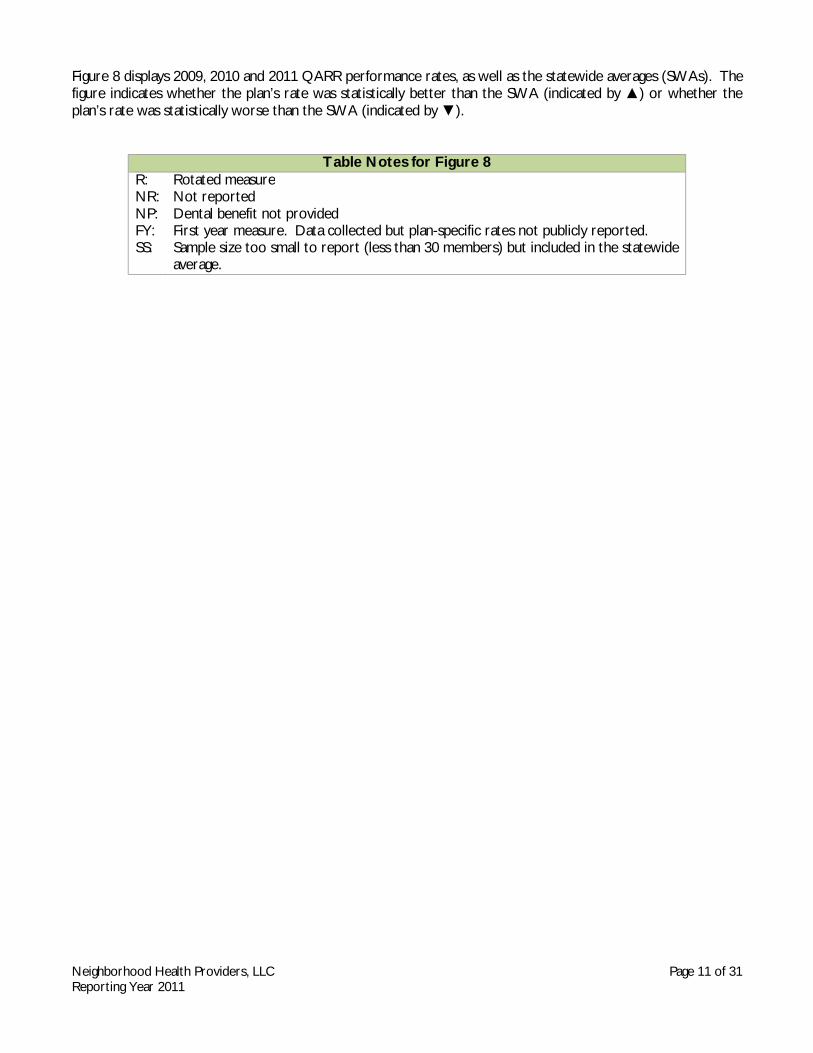
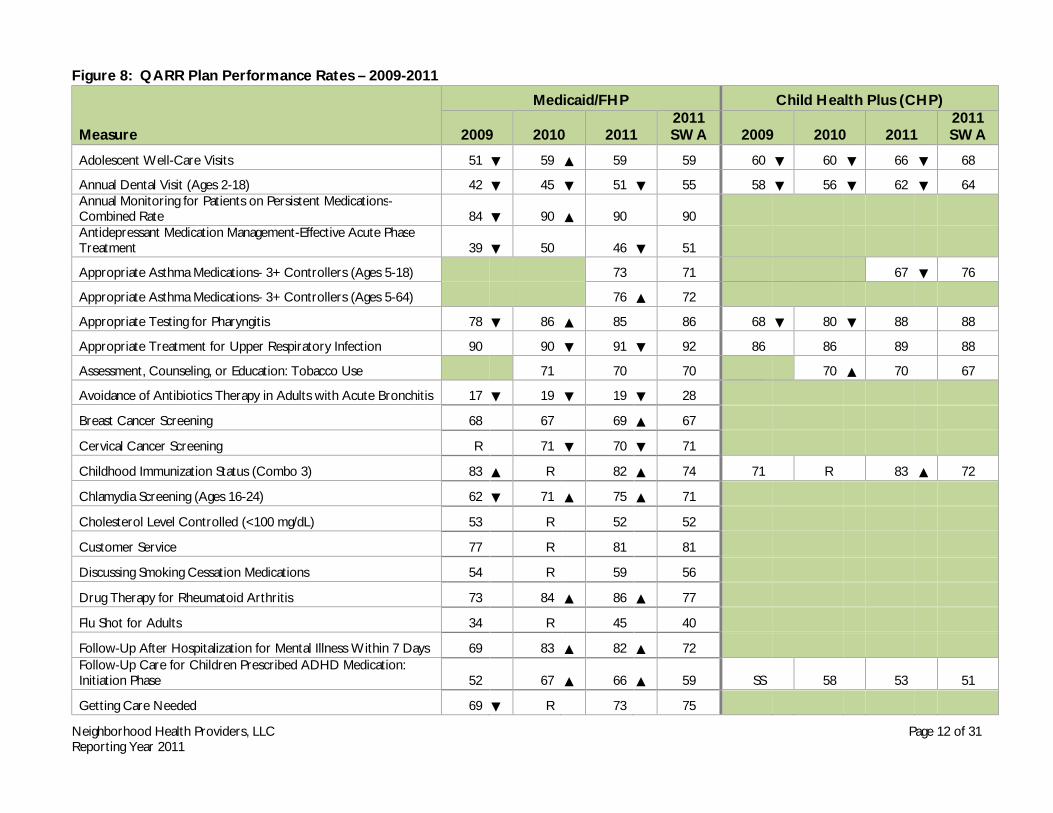
Figure 8 displays 2009, 2010 and 2011 QARR performance rates, as well as the statewide averages (SWAs). The figure indicates whether the plan’s rate was statistically better than the SWA (indicated by ▲) or whether the plan’s rate was statistically worse than the SWA (indicated by ▼).
Table Notes for Figure 8 R: NR: NP: FY: SS:
Rotated measure Not reported Dental benefit not provided First year measure. Data collected but plan-specific rates not publicly reported. Sample size too small to report (less than 30 members) but included in the statewide average.
Neighborhood Health Providers, LLC Page 12 of 31 Reporting Year 2011
Figure 8: QARR Plan Performance Rates – 2009-2011
Measure
Medicaid/FHP Child Health Plus (CHP)
2009 2010 2011 2011 SWA 2009 2010 2011
2011 SWA
Adolescent Well-Care Visits 51 ▼ 59 ▲ 59
59 60 ▼ 60 ▼ 66 ▼ 68
Annual Dental Visit (Ages 2-18) 42 ▼ 45 ▼ 51 ▼ 55 58 ▼ 56 ▼ 62 ▼ 64 Annual Monitoring for Patients on Persistent Medications- Combined Rate 84 ▼ 90 ▲ 90
90
Antidepressant Medication Management-Effective Acute Phase Treatment 39 ▼ 50
46 ▼ 51
Appropriate Asthma Medications- 3+ Controllers (Ages 5-18)
73
71 67 ▼ 76
Appropriate Asthma Medications- 3+ Controllers (Ages 5-64)
76 ▲ 72
Appropriate Testing for Pharyngitis 78 ▼ 86 ▲ 85
86 68 ▼ 80 ▼ 88
88
Appropriate Treatment for Upper Respiratory Infection 90
90 ▼ 91 ▼ 92 86
86
89
88
Assessment, Counseling, or Education: Tobacco Use
71
70
70
70 ▲ 70
67
Avoidance of Antibiotics Therapy in Adults with Acute Bronchitis 17 ▼ 19 ▼ 19 ▼ 28
Breast Cancer Screening 68
67
69 ▲ 67
Cervical Cancer Screening R
71 ▼ 70 ▼ 71
Childhood Immunization Status (Combo 3) 83 ▲ R
82 ▲ 74 71
R 83 ▲ 72
Chlamydia Screening (Ages 16-24) 62 ▼ 71 ▲ 75 ▲ 71
Cholesterol Level Controlled (<100 mg/dL) 53
R
52
52
Customer Service 77
R
81
81
Discussing Smoking Cessation Medications 54
R
59
56
Drug Therapy for Rheumatoid Arthritis 73
84 ▲ 86 ▲ 77
Flu Shot for Adults 34
R
45
40
Follow-Up After Hospitalization for Mental Illness Within 7 Days 69
83 ▲ 82 ▲ 72 Follow-Up Care for Children Prescribed ADHD Medication:
Initiation Phase 52
67 ▲ 66 ▲ 59 SS
58
53
51
Getting Care Needed 69 ▼ R
73
75

Neighborhood Health Providers, LLC Page 13 of 31 Reporting Year 2011
Figure 8: QARR Plan Performance Rates – 2009-2011 (Continued)
Measure
Medicaid/FHP Child Health Plus (CHP)
2009 2010 2011 2011 SWA 2009 2010 2011
2011 SWA
Lead Testing 94 ▲ R
96 ▲ 89 97 ▲ R 92 ▲ 83 Managing Diabetes Outcomes - Blood pressure controlled (<140/90 mm Hg)
71 ▲ 66
Monitoring Diabetes - Received All Tests 52
R
52
51
Pharmacotherapy Management of COPD Exacerbation- Bronchodilator 87
91 ▲ 91 ▲ 84
Rating of Health Plan 65 ▼ R
72
71
Use of Imaging Studies for Low Back Pain 80
80
80 ▲ 79
Use of Spirometry Testing in the Assessment and Diagnosis of COPD 47
43
44 ▼ 50
Viral Load Monitoring 39
68 ▲ 66
64
Weight Assessment- BMI Percentile 41 ▼ 68
76
73 53
67
63 ▼ 70
Well-Child & Preventive Care Visits in 3rd, 4th, 5th & 6th Year of Life 79
83 ▲ 84 ▲ 83 80
79 ▼ 86
84
Well-Child & Preventive Care Visits in First 15 Months of Life (5+ Visits) 70 ▼ 80 ▲ 84 ▲ 83 SS
SS
85
87
R: Rotated measure. SS: Sample size too small to report (less than 30 members) but included in the statewide average.
Neighborhood Health Providers, LLC Page 14 of 31 Reporting Year 2011
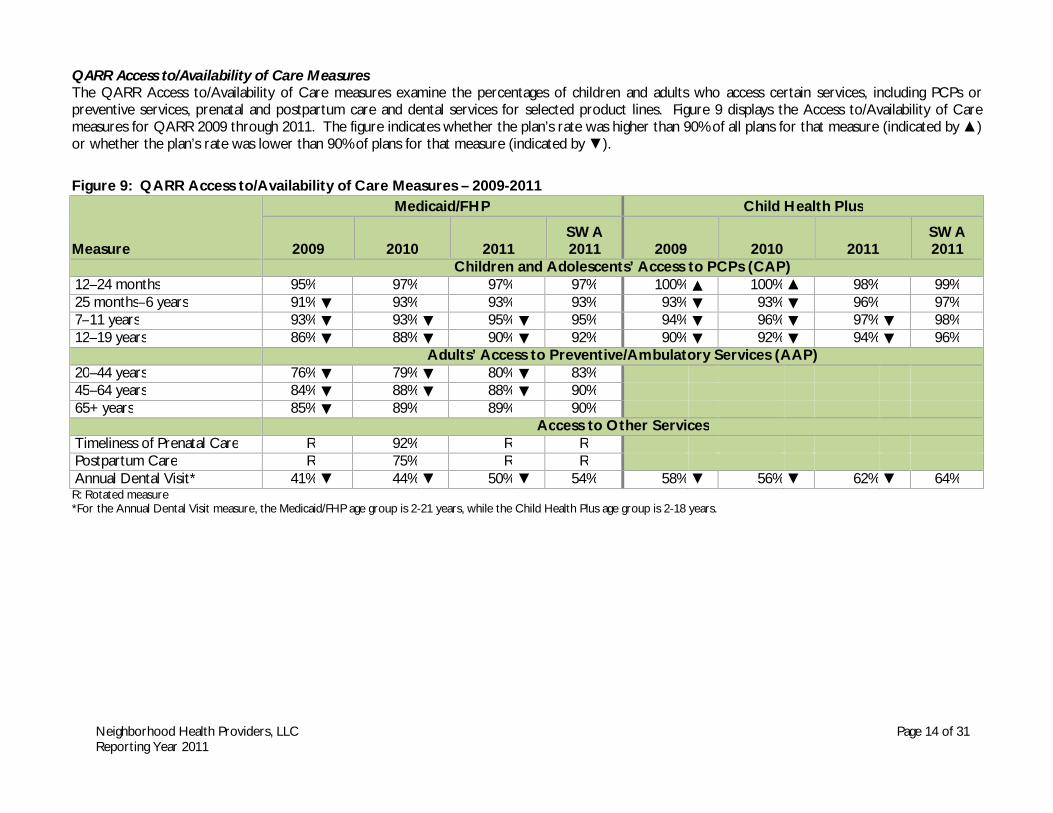
QARR Access to/Availability of Care Measures The QARR Access to/Availability of Care measures examine the percentages of children and adults who access certain services, including PCPs or preventive services, prenatal and postpartum care and dental services for selected product lines. Figure 9 displays the Access to/Availability of Care measures for QARR 2009 through 2011. The figure indicates whether the plan’s rate was higher than 90% of all plans for that measure (indicated by ▲) or whether the plan’s rate was lower than 90% of plans for that measure (indicated by ▼).
Figure 9: QARR Access to/Availability of Care Measures – 2009-2011
Measure
Medicaid/FHP Child Health Plus
2009 2010 2011 SWA 2011 2009 2010 2011
SWA 2011
Children and Adolescents’ Access to PCPs (CAP) 12–24 months 95% 97% 97% 97% 100% ▲ 100% ▲ 98% 99% 25 months–6 years 91% ▼ 93% 93% 93% 93% ▼ 93% ▼ 96% 97% 7–11 years 93% ▼ 93% ▼ 95% ▼ 95% 94% ▼ 96% ▼ 97% ▼ 98% 12–19 years 86% ▼ 88% ▼ 90% ▼ 92% 90% ▼ 92% ▼ 94% ▼ 96% Adults’ Access to Preventive/Ambulatory Services (AAP) 20–44 years 76% ▼ 79% ▼ 80% ▼ 83% 45–64 years 84% ▼ 88% ▼ 88% ▼ 90% 65+ years 85% ▼ 89% 89% 90% Access to Other Services Timeliness of Prenatal Care R 92% R R Postpartum Care R 75% R R Annual Dental Visit* 41% ▼ 44% ▼ 50% ▼ 54% 58% ▼ 56% ▼ 62% ▼ 64% R: Rotated measure *For the Annual Dental Visit measure, the Medicaid/FHP age group is 2-21 years, while the Child Health Plus age group is 2-18 years.

Neighborhood Health Providers, LLC Page 15 of 31 Reporting Year 2011
QARR Prenatal Care Measures Calculated by the NYSDOH Certain QARR prenatal care measures are calculated by the NYSDOH using birth data submitted by the plans as well as from NYSDOH’s Vital Statistics Birth File. Since some health events such as low birth weight births and cesarean deliveries do not occur randomly across all plans, risk adjustment is used to remove or reduce the effects of confounding factors that may influence a plan’s rate. Figure 10 presents prenatal care rates calculated by the NYSDOH for QARR 2008 through 2010. This Figure indicates whether the plan’s rate was significantly better than the average (indicated by ▲) or whether the plan’s rate was significantly worse than the average (indicated by ▼).
Figure 10: QARR Prenatal Care Measures Calculated by the NYSDOH – 2008-2010
Measure
Medicaid/FHP 2008 2009 2010
NHP NYC/ROS Average NHP
NYC/ROS Average NHP
NYC/ROS Average
NYC Risk-Adjusted Low Birth Weight* 8% 8% 7% 7% 9% ▼ 7% Prenatal Care in the First Trimester 70% 70% 71% 72% 72% 72% Risk-Adjusted Primary Cesarean Delivery* 18% 17% 18% 17% Vaginal Birth After Cesarean 6% ▼ 14% 7% ▼ 16%
ROS Risk-Adjusted Low Birth Weight* 10% 7% 10% 7% 14% ▼ 8% Prenatal Care in the First Trimester 48% ▼ 68% 58% 69% 67% 70% Risk-Adjusted Primary Cesarean Delivery* 12% 15% 18% 16% Vaginal Birth After Cesarean SS 11% 7% 11%
*A low rate is desirable for this measure. NYC: New York City ROS: Rest of State

Neighborhood Health Providers, LLC Page 16 of 31 Reporting Year 2011
Consumer Satisfaction In 2011, the CAHPS® survey of adult Medicaid managed care plan enrollees was conducted on behalf of the NYSDOH by an NCQA-certified survey vendor. Each selected category is compared to the respective SWA. Plans with a Commercial product line also collected these data from their Commercial members, using an NCQA-certified survey vendor. Figure 11 gives the question category, the plan’s rate and the SWA for measurement years 2008, 2010 and 2011. The Figure indicates whether the plan’s rate was significantly better than the SWA (indicated by ▲) or whether the plan’s rate was significantly worse than the SWA (indicated by ▼).
Figure 11: CAHPS® – 2008-2011
Measure 2008
2008 SWA 2010
2010 SWA 2011
2011 SWA
Medicaid Flu Shots for Adults Ages 50-64 34 ▼ 43 34 35 45 40 Medical Assistance With Smoking Cessation 75 74 69 74 78 78 Getting Care Needed1 68 ▼ 75 69 ▼ 74 73 75 Satisfaction with Provider Communication1 84 88 86 86 87 87 Care Coordination 71 74 75 74 70 68 Customer Service1 74 80 77 80 81 81 Collaborative Decision Making 54 57 60 58 Rating of Healthcare 58 ▼ 65 63 65 66 67 Rating of Health Plan – High Users 64 67 71 71 73 73 Getting Care Quickly1 71 ▼ 78 70 ▼ 77 74 76 Rating of Counseling 59 57 61 59 Overall Rating of Health Plan 63 66 65 ▼ 69 72 71 Rating of Personal Doctor 73 74 76 74 74 73 Rating of Specialist 62 ▼ 71 65 67 68 69 Getting Needed Counseling/Treatment 57 66 77 71 Recommend Plan to Family/Friends 88 90 86 ▼ 90 89 91 Wellness Discussion 50 52 57 55
1 These indicators are composite measures.
Neighborhood Health Providers, LLC Page 17 of 31 Reporting Year 2011
Quality Performance Matrix Analysis 2011 Measurement Year (Effectiveness of Care Measures) Figure 12 displays the Quality Performance Matrix, which predominantly summarizes Effectiveness of Care measures, though it also contains select Use of Services and Access to/Availability of Care measures reported annually in the New York State Managed Care Plan Performance Report. This year’s matrix includes 32 measures for the Medicaid product line and 12 for the Child Health Plus product line. The matrix diagrams the plan’s performance in relation to its previous year’s quality rates and also compares its rates to the SWA. With the issuance of the 2008 measurement year (MY) matrix, the NYSDOH modified its MCO requirements for follow-up action. In previous years, MCOs were required to develop root cause analyses and plans of action for all measures reported in the D and F categories of the matrix. Starting with the 2008 MY matrix, MCOs are now required to follow-up on no more than three measures from the D and F categories of the matrix. However, if an MCO has more than three measures reported in the F category, the MCO must submit root cause analyses and plans of action on all measures reported in the F category. If an MCO has fewer than three measures reported in the F category, the remaining measures must be selected from the D category for a total of three measures. If the MCO has no measures in the D and F categories, the MCO is not required to follow-up. Due to the large number of measures reported, the NYSDOH modified the format of the 2011 MY Quality Performance Matrix in order to help the plans focus their efforts on the measures in most immediate need of improvement. With this modification, the center cell in the bottom row was changed from a category D cell to a category C cell. As such, measures reported in this cell do not qualify to be the focus of the MCO’s root cause analyses. Rather, it is the intention of the NYSDOH that the plans focus their attention on only those measures which were reported as either below statewide average with no change or below statewide average and trending downwards.

Neighborhood Health Providers, LLC Page 18 of 31 Reporting Year 2011
Figure 12: Quality Performance Matrix – 2011 Measurement Year
Statewide Statistical Significance
Trend * Below Average
Average Above Average
C
B Appropriate Testing for Pharyngitis (CHP) WC 3-6 year olds (CHP) WCC - BMI Assessment (M)
A
No Change
D Annual Dental Visits (CHP, M) Antidepress. Med Mgmt - Acute Phase (M) Appropriate Treatment for URI (M) Asthma 3+ controllers - 5-18 yrs (CHP) Avoid Antibiotics for Adult Bronchitis (M) Cervical Cancer Screening (M) Spirometry Testing for COPD (M) WCC - BMI Assessment (CHP) Well Care Visits for Adolescents (CHP)
C Adolescent Care - Tobacco Use (CHP, M) Appropriate Testing for Pharyngitis (M) Appropriate Treatment for URI (CHP) Cholesterol Mgmt for Pts w/CVE - below 100 (M) Customer Service and Information (M) Diabetes Screening Composite (M) FU ADHD Meds - Initiation Phase (CHP) Flu Shots (M) Getting Care Needed (M) HIV/AIDS - Viral Load Monitoring (M) Monitoring of Persist Meds - Combined (M) Rating of Health Plan (M) Tobacco Cessation - Medication Discussion (M) WC 1st 15 months - 5 or more (CHP) Well Care Visits for Adolescents (M)
B Asthma 3+ controllers - 5-64 yrs (M) Breast Cancer Screening (M) Childhood Immunization - Combo 3 (CHP, M) Chlamydia Testing - 16-24 yrs (M) DMARD for Arthritis (M) Diabetes BP below 140/90 (M) FU ADHD Meds - Initiation Phase (M) FUH for Mental Illness - 7 Days (M) Lead Testing (CHP, M) PCE for COPD Exacerbation - Bronchodilator (M) Use of Imaging Studies for Low Back Pain (M) WC 1st 15 months - 5 or more (M) WC 3-6 year olds (M)
F
C
C
CHP: Child Health Plus M: Medicaid and Family Health Plus *Trending analysis used rates from 2010 when the measure was not collected in 2011.

Neighborhood Health Providers, LLC Page 19 of 31 Reporting Year 2011
Quality Incentive – PQI/Compliance/Satisfaction/Quality Points The percentage of the potential financial incentive that a plan receives is based on quality of care, consumer satisfaction and compliance. Points earned are derived from an algorithm that considers QARR 2011 rates in comparison to statewide percentiles, the most recent Medicaid CAHPS® scores, and compliance information from 2010 and 2011. The total score, based out of 150 possible points, determines what percent of the available premium increase the plan qualifies for. For 2011, there were four levels of incentive awards that could be achieved by plans based on the results. Figure 13 displays the points the plan earned from 2009 to 2011, as well as the percentage of the financial incentive that these points generated based on the previous measurement year’s data. Figure 13a displays the measures that were used to calculate the 2011 incentive, as well as the points NHP earned for each measure.
Figure 13: Quality Incentive – PQI/Compliance/Satisfaction/Quality Points – 2009-2011 2009 2010 2011
Category NHP
SWA NHP
SWA NHP
SWA Total Points (150 Possible Points) 63 66.8 100 77.5 101 72.9
PQI Points (20 Possible Points) 10 9.7 10 9.9 7 9.5 Compliance Points (-20 Possible Points) -4 -4.9 0 -4.3 -4 -5.9 Satisfaction Points (30 Possible Points) 5 16.1 5 16.1 15 15.8 Quality Points (100 Possible Points) 52 45.8 85 55.8 83 53.1
Percentage of Financial Incentive Earned 33% 60% 75%

Neighborhood Health Providers, LLC Page 20 of 31 Reporting Year 2011
Figure 13a: Quality Incentive – PQI/Compliance/Satisfaction/Quality Measures and Points – 2011 Measure NHP PQI 6.5
Pediatric Asthma PQI (5 points) 2.5 Pediatric Composite PQI (5 points) 2.5 Adult Respiratory PQI (3 points) 1.5 Adult Composite PQI (7 points) 0.0
Compliance (-4 points each, except where noted) -4.0 MMCOR 0.0 MEDS 0.0 Access/Availability -2.0 Provider Directory (-2 points) -2.0 Member Services 0.0 QARR 0.0
Satisfaction (10 points each) 15.0 Rating of Health Plan (CAHPS®) 5.0 Getting Care Needed (CAHPS®) 5.0 Customer Service and Information (CAHPS®) 5.0
Quality (3.3 points each, except where noted) 53.6 Adolescent Well-Care Visits 1.7 Annual Dental Visit (Ages 2-18) 0.0 Annual Monitoring for Patients on Persistent Medications - Combined Rate 1.7 Antidepressant Medication Management - Effective Acute Phase Treatment 0.0 Appropriate Asthma Medications- 3 or More Controllers (Ages 5-64) 3.3 Appropriate Testing for Children with Pharyngitis 1.7 Appropriate Treatment for Children with Upper Respiratory Infection (URI) 0.0 Assessment Counseling or Education: Tobacco Use 1.7 Avoidance of Antibiotics Therapy in Adults with Acute Bronchitis 0.0 Breast Cancer Screening 2.5 Cervical Cancer Screening 1.7 Childhood Immunization Status (Combo 3) 3.3 Chlamydia Screening in Women (Ages 16-24) 3.3 Cholesterol Level Controlled (<100mg/dL) 0.0 Discussing Smoking Cessation Medications 1.7 Drug Therapy for Rheumatoid Arthritis 3.3 Flu Shot for Adults 2.5 Follow-Up After Hospitalization for Mental Illness Within 7 days 2.5 Follow-Up Care for Children Prescribed ADHD Medication - Initiation Phase 2.5 Lead Testing 3.3 Managing Diabetes Outcomes- Blood Pressure Controlled (<140/90 mm Hg) 2.5 Monitoring Diabetes- Received All Tests (6.7 points) 3.3 Pharmacotherapy Management of COPD Exacerbation - Bronchodilator 3.3 Use of Imaging Studies for Low Back Pain 1.7 Use of Spirometry Testing in the Assessment and Diagnosis of COPD 0.0 Viral Load Monitoring 1.7 Weight Assessment for Children/Adolescents- BMI Percentile 2.5 Well-Child & Preventive Care Visits in the 3rd, 4th, 5th & 6th Year of Life 2.5 Well-Child & Preventive Care Visits in the First 15 Months of Life - 5 or More Visits 0.0
Total Points Earned 100.5 MMCOR: Medicaid Managed Care Operating Report MEDS: Medicaid Encounter Data Set

Neighborhood Health Providers, LLC Page 21 of 31 Reporting Year 2011
Performance Improvement Project Each plan is required by the Medicaid Health Maintenance Organization contract to conduct at least one Performance Improvement Project (PIP) each year. A PIP is a methodology for facilitating plan and provider-based improvements in quality of care. PIPs place emphasis on evaluating the success of interventions to improve quality of care. Through these projects, plans and providers determine what processes need to be improved and how they should be improved. The NYS EQRO provided technical assistance to plans throughout the PIP process in the following forms: 1) review of the plan’s Project Proposal prior to the start of the PIP, 2) quarterly teleconferences with the plan for progress updates and problem-solving, 3) feedback on methodology, data collection tools and implementation of interventions, and 4) feedback on drafts of the plan’s final report. In addition, the NYS EQRO validated the plan’s PIP by reviewing the project topic, aim statement, performance indicators, study population, sampling methods (if sampling was used), data collection procedures, data analysis and interpretation of project results, as well as assessing the plan’s improvement strategies, the likelihood that the reported improvement is “real” improvement and whether the plan is likely to be able to sustain its documented improvement. Validation teams met quarterly to review any issues that could potentially impact the credibility of PIP results, thus ensuring consistency among validation teams. The validation process concluded with a summary of the strengths and opportunities for improvement in the conduct of the PIP, including any validation findings that indicated the credibility of the PIP results was at risk. Neighborhood Health Provider’s 2011-2012 PIP topic is “Eliminating Disparities in Asthma Care”. In 2011, the plan implemented the following strategies:
• The Plan promoted system changes at both practice sites by working with the practice site to design and establish an asthma registry to capture, track and trend patient asthma information. To better manage patients with persistent asthma, the registry gives providers access to accurate and timely information to ensure that planned care is consistent with the asthma guidelines and comprehensive services are delivered.
• PDSA: To ensure that every patient with persistent asthma has an up-to-date written asthma action plan in his or her medical record. Identify educational patient asthma materials and help patients understand self-management goals. Through customized individual feedback via the action plan, patients will understand how to follow treatment instructions, use medications, and adhere to scheduled routine follow-up visits to measure the effectiveness of asthma treatment.
• PDSA: Day-to-day leaders at both practice sites were provided with training on registry data collection, patient self-management asthma tools and were coached on how to educate patients and clinical staff.
• During the 3rd & 4th Qtr. of 2011, the Plan conducted an onsite Medical Record Review (MRR) to identify opportunities for improvement in data collection and ensure adherence to asthma guidelines.
Figure 14: Performance Improvement Project – 2011-2012 Results not displayed; 2011 was the first phase of a two-year study.
Neighborhood Health Providers, LLC Page 22 of 31 Reporting Year 2011
Clinical Study Recent Prenatal Care Experience in Relation to the 2009 NYSDOH Medicaid Prenatal Care Standards New York State Standards for the provision of perinatal care to low income, uninsured and underinsured pregnant women were updated in 2009 to include a comprehensive model of care addressing access to care, management of pre-existing conditions, comprehensive risk assessment, reassessment, health education and counseling/referral/care coordination, in addition to prenatal and postpartum services. The Standards incorporated current professional guidelines, evidence-based practices, and expert consensus. The study goal was evaluation of prenatal care in the context of the recently disseminated Standards. The eligible population for medical record review was Medicaid members having delivered a live birth in 2009. A random sample comprised of 30 cases per each Medicaid Managed Care (MMC) Health Plan, 200 cases having received Fee-For-Service (FFS) care, and a ten percent oversample from each reimbursement category was generated, with 601 records ultimately available for review. All 18 MMC health plans were represented, although analysis did not include comparisons between plans. Study domains included each component of the comprehensive care model noted above. In general, study results revealed a high-risk patient population. Demographics were not well documented, but where known, 68.8% (300/436)1 of members were unmarried and 54.3% (133/245) had not graduated high school. Twenty-four percent (144/598) were pregnant for the first time, placing them at higher risk for adverse birth outcomes. Forty percent of all member records noted at least one medical or psychiatric comorbidity, most notably obesity (14.0%), anemia (11.0%), asthma (10.1%) and depression (9.7%). Over 15% of records documented the development of a pregnancy-related condition, most frequently vaginal bleeding (7.8%) and gestational diabetes (7.3%). Ten percent of members did not have prenatal care documented until the third trimester of pregnancy. The Standards stipulate a comprehensive risk assessment should be conducted at the initial visit for prenatal care, reviewed at each subsequent visit, and formally repeated early in the third trimester and postpartum to identify issues developed over time. Categories of risk to be assessed include medical/obstetrical, psychosocial, behavioral, nutritional, environmental and genetic. A thorough risk assessment was documented in 83.7% of records at initial visit, but in only 5.8% (31/539) during the third trimester, exclusive of women entering care in the third trimester. Documented initial visit assessments focused on medical/surgical and obstetrical histories and substance use. Third trimester and postpartum assessments covered predominantly depression, tobacco use and nutritional status, although overall rates of reassessment in the third trimester were low. Oral health and maternal/infant exposure to environmental tobacco smoke were poorly evaluated at all three time intervals. Importantly, a postpartum visit was evident in only 47.9% of all prenatal care records. Based on American Congress of Obstetricians and Gynecologists (ACOG) guidelines, routine laboratory screening and diagnostic testing should be performed at the recommended gestational age. Suboptimal performance was noted for documentation of urine culture at 12-16 weeks or at first visit if later (74.2%) and vaginal/anal culture for group B streptococcus at 28-37 weeks (72.9%). HIV testing at initial visit or in the first trimester was evident in 82.9% (485/585) of records, but HIV testing in the third trimester to identify seroconversion or in response to identified risk was apparent in only 23.7% (119/502), again exclusive of women entering care in the third trimester.
1 If less than all records are included in the denominator, the numerator and denominator are provided.

Neighborhood Health Providers, LLC Page 23 of 31 Reporting Year 2011
The Standards strongly recommend certain vaccines during the prenatal period; prenatal visit notes indicated only 14.4% (84/582) of pregnant members seen during flu season, and not already vaccinated, were offered influenza vaccination. The postpartum visit provides a second opportunity to evaluate immunization status and bring women up-to-date with vaccinations; postpartum visit notes documented evaluation in only 8.0% (23/288) of members with a postpartum visit. Health education, particularly in support of appropriate weight gain and breast-feeding, was identified as another component of care with opportunity for improvement. Fewer than 50% of records demonstrated provision of education beyond the symptoms of pregnancy complications. Only 17.3% documented a pre-pregnancy or initial visit BMI and 5.0% documented a BMI-based discussion of weight gain. Counseling regarding the benefits of breast feeding was noted in 22.0%, and exclusive breastfeeding for the first six months of life in 2.0% of prenatal records. Similarly, counseling on infant feeding choices was noted in 19.4% (56/288) of postpartum records. The study report is being finalized as of this writing, with recommendations (specific to the NYSDOH, Health Plans, providers, members and community agencies) forthcoming. Preliminary results were presented on a NYSDOH Office of Health Insurance Programs/Health Plan Medical Directors’ conference call on February 9, 2012 for input on next steps in Prenatal Care evaluation. Subsequently, preliminary results informed the development of a Prenatal Care Self-Evaluation and Quality Improvement Tool for providers, currently being constructed on a web-based data collection and reporting platform by IPRO technical staff.
Neighborhood Health Providers, LLC Page 24 of 31 Reporting Year 2011
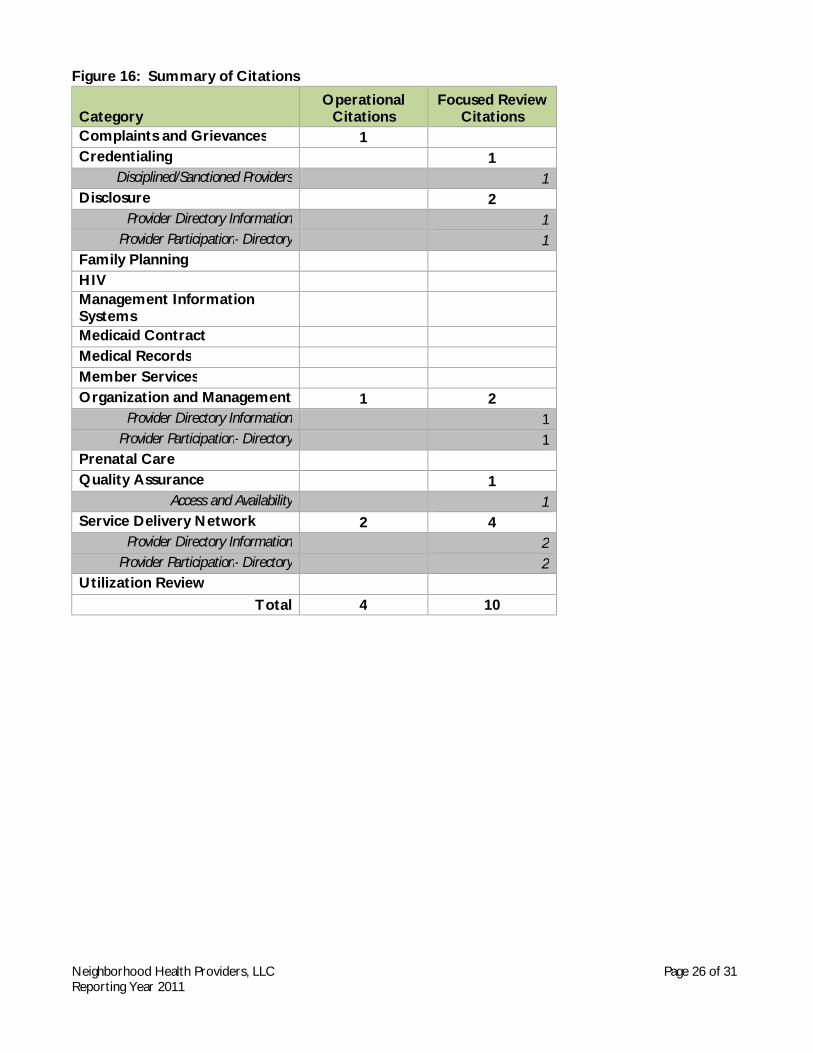
VI. Deficiencies and Appeals This section of the report examines deficiencies identified by the NYSDOH in operational and focused surveys, as well as external appeals, as part of the EQRO’s evaluation of the plan’s compliance with State structure and operation standards. Compliance with NYS Structure and Operation Standards To assess the compliance of a health plan with Article 44 of the Public Health Law and Part 98 of the New York Code of Rules and Regulations (NYCRR), the NYSDOH conducts a full monitoring review of the plan’s compliance with structure and operation standards once every two years. These standards are reflected in the 14 categories in Figure 16. “Deficiencies” represent a failure to comply with these standards. Each deficiency can result in multiple “citations” to reflect each standard with which the plan is not in compliance. The full monitoring review consists of an operational survey. The on-site component includes review of the following: policy and procedures, executed contracts and credentialing files of randomly selected providers; adverse determination utilization review files; complaints and grievances files; meeting minutes and other documentation. Staff interviews are also conducted. These reviews are conducted using two standardized tools, the “Medicaid Managed Care Contract Surveillance Tool” and the “Review Tool and Protocol for MCO Operational Surveys.” The NYSDOH retains the option to deem compliance with standards for credentialing/recredentialing, quality assurance/improvement and medical record review. The monitoring review report documents any data obtained and deficiencies cited in the survey tools. Any statements of deficiencies (SODs) are submitted to the plan after the monitoring review, and the plan is required to respond with a plan of corrective action (POC). POCs must be submitted to the NYSDOH for acceptance. In some cases, revisions may be necessary and plans are required to resubmit. Ultimately, all plans with SODs must have a POC that is accepted by the NYSDOH. During the alternate years when the full review is not conducted, the NYSDOH reviews any modified documentation and follows up with the plan to ensure that all deficiencies or issues from the operational survey have been remedied. In addition to the full operational survey conducted every two years, the NYSDOH also conducts several focused reviews as part of the monitoring of structure and operation standards. The focused review types are summarized in Figure 15. Plans are also required to submit POCs in response to deficiencies identified in any of these reviews. Figure 16 reflects the total number of citations for the most current operational survey of the plan, which ended in 2011, as well as from the focused reviews conducted in 2011. This figure reflects the findings from reviews of the plan as a whole and deficiencies are not differentiated by product line. It is important to note that the number of deficiencies and the number of citations may differ, since each deficiency can have multiple citations. NHP was in compliance with 8 of 14 categories. The categories in which NHP was not in compliance were Complaints and Grievances (1 citation), Credentialing (1 citation), Disclosure (2 citations), Organization and Management (3 citations), Quality Assurance (1 citation) and Service Delivery Network (6 citations).

Neighborhood Health Providers, LLC Page 25 of 31 Reporting Year 2011
Figure 15: Focused Review Types Review Name Review Description
Access and Availability Provider telephone survey of all MMC plans performed by the NYSDOH EQRO to examine appointment availability for routine and urgent visits; re-audits are performed when results are below 75%.
Complaints Investigations of complaints that result in an SOD being issued to the plan.
Contracts Citations reflecting non-compliance with requirements regarding the implementation, termination or non-renewal of MCO provider and management agreements.
Disciplined/Sanctioned Providers Survey of HPN to ensure providers that have been identified as having their licenses revoked or surrendered, or otherwise sanctioned, are not listed as participating with the MCO.
MEDS (Medicaid Encounter Data Set) Citations reflecting non-compliance with requirements to report MCO encounter data to the Department of Health.
Member Services Phone Calls Telephone calls are placed to Member Services by AO staff to determine telephone accessibility and to ensure correct information is being provided to callers.
Other Used for issues that do not correspond with the available focused review types.
Provider Directory Information Provider directories are reviewed to ensure that they contain the required information.
Provider Info-Web Review of MCO’s web-based provider directory to assess accuracy and required content.
Provider Network Quarterly review of HPN network submissions for adequacy, accessibility and correct listing of primary, specialty and ancillary providers for enrolled population.
Provider Participation – Directory Telephone calls are made to a sample of providers included in the provider directory to determine if they are participating, if panels are open and if they are taking new Medicaid patients. At times, this survey may be limited to one type of provider.
QARR (Quality Assurance Reporting Requirements)
Citations reflecting non-compliance with requirements to submit MCO QARR data to the Department of Health.
Ratio of PCPs to Medicaid Clients Telephone calls are placed to PCPs with a panel size of 1,500 or more Medicaid clients. The calls are used to determine if appointment availability standards are met for routine, non-urgent sick and urgent appointments.
AO: Area Office HPN: Health Provider Network SOD: Statement of Deficienc
Neighborhood Health Providers, LLC Page 26 of 31 Reporting Year 2011
Figure 16: Summary of Citations
Category Operational
Citations Focused Review
Citations Complaints and Grievances 1
Credentialing
1 Disciplined/Sanctioned Providers
1
Disclosure
2 Provider Directory Information
1
Provider Participation- Directory
1 Family Planning
HIV Management Information
Systems Medicaid Contract Medical Records Member Services Organization and Management 1 2
Provider Directory Information
1 Provider Participation- Directory
1
Prenatal Care Quality Assurance
1 Access and Availability
1
Service Delivery Network 2 4 Provider Directory Information
2
Provider Participation- Directory
2 Utilization Review
Total 4 10

Neighborhood Health Providers, LLC Page 27 of 31 Reporting Year 2011
VII. Strengths and Opportunities for Improvement1 This section summarizes the accessibility, timeliness and quality of services provided by NHP to Medicaid and Child Health Plus recipients based on data presented in the previous sections of this report. The plan’s strengths in each of these areas are noted, as well as opportunities for improvement. Recommendations for enhancing the quality of healthcare are also provided based on the opportunities for improvement noted. An assessment of the degree to which the MCO has effectively addressed the recommendations for quality improvement made by the NYS EQRO in the previous year’s EQR report is also included in this section. The MCO’s response to the previous year’s recommendations, wherein the plan was given the opportunity to describe current and proposed interventions that address areas of concern, as well as an opportunity to explain areas that the MCO did not feel were within its ability to improve, is appended to this section of the report. Strengths
• The 2012 HEDIS® Final Audit Report revealed no significant problems and the plan was able to report all required Medicaid and CHP rates for QARR.
• The plan received PQI, compliance, satisfaction and quality scores that qualified it for 75% of the available financial incentive, as well as for the auto-assignment of new members.
• The plan performed well on several HEDIS®/QARR measures as indicated by better than average rates for Appropriate Asthma Medications- 3+ Controllers (ages 5-64) (Med), Breast Cancer Screening (Med), Childhood Immunization Status (Combo 3) (Med, CHP) Chlamydia Screening (Med), Drug Therapy for Rheumatoid Arthritis (Med), Follow-Up After Hospitalization for Mental Illness within 7 Days (Med), Follow-Up Care for Children Prescribed ADHD Medication –Initiation Phase (Med), Lead Testing (Med, CHP), Managing Diabetes Outcomes – Blood Pressure Controlled (Med), Pharmacotherapy Management of COPD Exacerbation – Bronchodilator (Med), Use of Imaging Studies for Low Back Pain (Med), Well-Child and Preventive Care Visits in First 15 Months of Life (Med) and Well-Child and Preventive Care Visits in 3rd, 4th, 5th, and 6th Years of Life (Med).
• The plan performed well in regard to access and availability in the EQRO’s 2011 Primary Care and OB/GYN Access and Availability Study as the plan exceeded the 75% threshold for routine and non-urgent “sick” appointments in Region 6 and all call types in Region 7.
• The plan reported better than average Medicaid and CHP QARR Board Certification for Internal Medicine, Geriatricians and Other Physician Specialists.
Opportunities for Improvement • The plan continues to demonstrate an opportunity for improvement on three HEDIS®/QARR measures
as indicated by below average performance for at least three consecutive reporting years for Adolescent Well-Care Visits (CHP), Annual Dental Visit (Med, CHP) and Avoidance of Antibiotic Treatment in Adults With Acute Bronchitis (Med). The plan also reported below average rates for the following measures: Antidepressant Medication Management- Effective Acute Phase Treatment (Med), Appropriate Asthma Medications- 3+ Controllers (Ages 5-18) (CHP), Appropriate Treatment for Upper Respiratory Infection (Med), Cervical Cancer Screening (Med), Use of Spirometry Testing in the Assessment and Diagnosis of COPD (Med) and Weight Assessment- BMI Percentile (CHP). (Note: Annual Dental Visit and Avoidance of Antibiotic Treatment in Adults With Acute Bronchitis were opportunities for improvement in the previous year’s report.)
• Despite performing well on the EQRO’s Access and Availability Study, and although plan rates are continually trending upwards for the HEDIS®/QARR Children and Adolescents’ Access to PCPs and Adults’ Access to Preventive/Ambulatory Services measure, the plan continues to demonstrate an opportunity for
1 This section of the report emphasizes the maintenance of current good practices and the development of additional practices resulting in improved processes and outcomes, and thus refers to “Strengths” and “Opportunities for Improvement” rather than “Strengths” and “Weaknesses” as indicated in federal regulations.
Neighborhood Health Providers, LLC Page 28 of 31 Reporting Year 2011
improvement in regard to access as reported rates are below the 10th percentile for age groups 7-11 years (Med, CHP), 12-19 years (Med, CHP), 20-44 years (Med) and 45-64 years (Med). (Note: access to care was an opportunity for improvement in the previous year’s report.)
• In regard to compliance with NYS structure and operational standards, the plan received a total of 14 citations, including 4 Article 44 Review citations in the Complaints and Grievances, Organization and Management and Service Delivery Network categories; and 10 focused review citations related to Disciplined/Sanctioned Providers, Provider Directory Information, Provider Participation-Directory and Access and Availability in the following categories: Credentialing, Disclosure, Organization and Management, Quality Assurance and Service Delivery Network.
Recommendations • The plan should continue to work to improve HEDIS®/QARR rates that perform below the statewide
average. The plan should also evaluate the effectiveness of the initiatives outlined in the plan’s response to the previous year’s recommendation, specifically those initiatives that address plan rates that are continually underperforming. [Repeat recommendation.]
• As the plan’s access to preventive/ambulatory care rates continue to trend upward, the plan should continue and expand upon the efforts described in the plan’s response to the previous year’s recommendation, especially those which target members. The plan should also continually assess the effectiveness of these efforts and modify them accordingly. [Repeat recommendation]
• The plan should work to address the issues noted in the Article 44 Review and focused surveys.
Response to Previous Year’s Recommendations • 2010 Recommendation: The plan should work to improve HEDIS®/QARR rates that perform below
the statewide average, specifically Annual Dental Visit and Avoidance of Antibiotic Treatment in Adults With Acute Bronchitis. As the plan’s Annual Dental Visit rate trends upward, the plan should continue with the initiatives described in the plan’s response to the previous year’s recommendation. [Repeat recommendation.]
Plan Response: Annual Dental Visits: Neighborhood Health Providers (NHP) continues to implement and repeat many of the dental quality improvement (QI) activities described in the "Response to Reporting CY 2010 EQR Recommendations." The QI actions include educational efforts through the member and provider newsletters and the plan's website; targeted member mailings and telephonic outreach; outreach to primary care physicians (PCP) and selected dentists whose patients have not had an annual dental visit. The Plan's case management program also provides pregnant members with educational information on the importance of dental care during and after pregnancy and helps members choose a dental home. Additional outreach strategies include directing patients who come in for a medical visit to see the dentist on the same day at sites that offer both services. The Plan works closely with the dental benefits vendor to assess the effectiveness of the QI actions and determine which have the most impact. The 2011 QARR dental visit rate was 50.23%, demonstrating a 10% improvement from 2010 (45%), but still below the SWA (54%). Root cause analysis indicates:
– Lack of parent/guardian education/knowledge of benefits of preventive dental care. – Lack of member education/knowledge of the relationship between poor dental hygiene general
health. – Lack of referrals for dental care by practitioners serving children and/or pregnant members. – Lack of ease in scheduling dental appointments with selected dental practices.
Modifications made to the following areas will continue as they seem to have had an impact in improving dental rates:
– Ongoing enhancement to the vendor's website so that members can more easily identify their selected plan and choose a dentist.

Neighborhood Health Providers, LLC Page 29 of 31 Reporting Year 2011
– Continue to ensure that educational materials are sent to members and available in various languages upon member request.
– Annual targeted reminder letters to parents of members to encourage them to bring their children in for routine dental visits.
– Continue to send "No Dentist Selected" postcard - sent by vendor post enrollment. – Continue to assist members to schedule appointments upon request. – Encourage providers to utilize web portal to identify and refer patients to dentists, adhere to
dental codes, and continue fluoride varnish for age appropriate children. – The Plan works closely with the dental vendor, including a monthly meeting during which the
Plan reviews dental practice patterns and utilization and discusses effectiveness of QI actions and opportunities for improvement.
Avoidance of Antibiotic Treatment in Adults with Acute Bronchitis: Neighborhood Health Providers (NHP) partnered in 2011 with the New York State Department of Health (NYSDOH) of a review on the appropriate usage of antibiotics in patients diagnosed with acute bronchitis, upper respiratory infections (URI) and acute pharyngitis. The review indicated that despite the overall downward trend in antibiotic prescriptions, providers still continue to routinely prescribe unnecessary broad spectrum antibiotics to treat common viral infections for which antibiotics simply do not work. This is largely attributed to providers who think that patients need, expect and/or demand a prescription for an antibiotic whenever they have any type of infection. Also, some providers may not be familiar with, understand, or adhere to guidelines for appropriate antibiotic use in upper respiratory infections. Furthermore, physicians may tend to overestimate acute bronchitis among otherwise healthy adults based on physical examination alone. Patients may be also be prescribed antibiotics both in the emergency room and in the provider office. NHP will continue to educate providers on overuse of antibiotics in patients diagnosed with acute bronchitis via the provider newsletter [spring/summer, 2012, 2013], web portal, QARR orientation and provider website [1st Qt. 2013]. Education is targeted to providers to inform them that when prescribing an antibiotic, especially for members with co-morbidities or with a secondary diagnosis, they should thoroughly document these details to justify the need for antibiotics. NHP will also stress patient education at the provider level, regardless of whether an antibiotic is prescribed. This will help ensure that patients have a better understanding of self-management practices to prevent the spread of respiratory infections, thereby improving satisfaction with care. The Plan will also educate members on appropriate antibiotic treatment of upper respiratory infections such as bronchitis and remind them that antibiotics does not hasten illness resolution nor prevent complications and are therefore not necessarily always the preferred treatment. The Plan will also educate members on the growing problem of bacterial resistance to antibiotics and the role of overuse of antibiotics in this public health problem. [Member Newsletter, January 2013].
• 2010 Recommendation: As the plan’s access to preventive/ambulatory care rates continue to trend
upward, the plan should continue the efforts described in the plan’s response to the previous year’s recommendation. The plan should intensify member-specific interventions as the plan’s root-cause analysis did not identify any issues suggesting inadequacy of its provider network. [Repeat recommendation.] Plan Response: Access to Preventive/Ambulatory Services: The actions described in the “Response to Reporting Year 2010 EQR Recommendations” continue to be evaluated for effectiveness and new activities implemented. Education of the entire membership about the need to see a doctor for a checkup is done

Neighborhood Health Providers, LLC Page 30 of 31 Reporting Year 2011
during new member orientation calls, the bi-annual member newsletter, and the member website. Targeted reminder letters and postcards are sent to members if they have not accessed primary and preventive care during the CY. Primary Care Providers are also informed of all patients on their panel in need of outreach for preventive services via the web portal. Since 2011, there continues to be a major push to identify and contact members who have not accessed care. The Plan continues to conduct root cause analyses to identify potential barriers to access. The Plan continues to strive to improve access to preventive and ambulatory services. Outreach and educational efforts continue to include a screen in the Member Services software module that allows representatives to identify members who have not had a visit or are missing preventive services. This function enables the member services representative to counsel, educate and assist the member with scheduling an appointment during the time of the call.
In 2010, the Plan implemented a "QARR Services Needed" prompt on its provider web portal and continues to encourage physicians to utilize the system. The prompt allows providers to view which patients on their panel are missing preventive care services and require outreach. Providers are reminded of the feature during provider representative site visits, QARR onsite orientation, fax blast and through the Plan's provider newsletter [Spring/Summer 2013].

Neighborhood Health Providers, LLC Page 31 of 31 Reporting Year 2011
VIII. Appendix
References A. Corporate Profile
• Updated Corporate Profile information provided by the NYSDOH • NYSDOH OMC DataLink Reports
• Managed Care Plan Directory, Accessed August 14, 2012 • NCQA Accreditation website, http://hprc.ncqa.org/index.asp, Accessed August 14, 2012
B. Enrollment/Provider Network
1) Enrollment • NYSDOH OMC Membership Data, 2009 - 2011 • Auto Assignment Data, 2009 - 2011 • Auto Assignment Quality Algorithm Scores, 2009 - 2011
2) Provider Network • Providers Statewide by Specialty, Medicaid Managed Care in New York State Provider Network
File Summary, December 2011 • Total Number of FTEs by Managed Care Plans, December 31, 2011 • QARR Measurement Year, 2009 – 2011 • NYSDOH Primary Care Access and Availability Survey, 2011
C. Utilization
1) Encounter Data • MMC Encounter Data System, 2009 - 2011
2) QARR Use of Services • QARR Measurement Year, 2009 - 2011
D. Quality Indicators
1) Summary of HEDIS® Information Systems AuditTM Findings • 2012 Final Audit Report prepared by the MCO’s Certified HEDIS® Auditors
2) QARR Data • Performance Category Analysis, Quality Performance Matrix (2011 Measurement Year) • QARR Measurement Year, 2009 - 2011
3) CAHPS® 2011 Data • QARR Measurement Year, 2011
4) Quality/Satisfaction Points and Incentive • Quality/Satisfaction Points and Incentive, 2009 - 2011
5) Performance Improvement Project • 2011-2012 PIP Interim Report
E. Deficiencies and Appeals
1) Summary of Deficiencies • MMC Operational Deficiencies by Plan/Category, 2011 • Focus Deficiencies by Plan/Survey Type/Category, 2011