NEW YORK STATE DEPARTMENT OF HEALTH york state department of health office of quality and patient...
45
NEW YORK STATE DEPARTMENT OF HEALTH OFFICE OF QUALITY AND PATIENT SAFETY EXTERNAL QUALITY REVIEW TECHNICAL REPORT FOR: HEALTHFIRST PHSP, INC. Reporting Year 2015 Published April 2017
Transcript of NEW YORK STATE DEPARTMENT OF HEALTH york state department of health office of quality and patient...

NEW YORK STATE DEPARTMENT OF HEALTH
OFFICE OF QUALITY AND PATIENT SAFETY
EXTERNAL QUALITY REVIEW
TECHNICAL REPORT FOR:
HEALTHFIRST PHSP, INC.
Reporting Year 2015
Published April 2017

Healthfirst PHSP, Inc. | Reporting Year 2015 Technical Report i
Table of Contents
I. About This Report ..................................................................................................................................1
II. MCO Corporate Profile ...........................................................................................................................2
III. Enrollment and Provider Network ...........................................................................................................3
ENROLLMENT .....................................................................................................................................................3
PROVIDER NETWORK .........................................................................................................................................6
PRIMARY CARE AND OB/GYN ACCESS AND AVAILABILITY SURVEY—2015 ........................................................9
IV. Utilization ............................................................................................................................................ 10
ENCOUNTER DATA .......................................................................................................................................... 10
HEALTH SCREENINGS....................................................................................................................................... 11
QARR USE OF SERVICES MEASURES ................................................................................................................ 12
V. Quality Indicators ................................................................................................................................. 13
VALIDATION OF PERFORMANCE MEASURES .................................................................................................. 13
SUMMARY OF HEDIS® 2016 INFORMATION SYSTEM AUDIT™ ....................................................................... 13
QARR ACCESS TO/AVAILABILITY OF CARE MEASURES .................................................................................... 17
NYSDOH-CALCULATED QARR PRENATAL CARE MEASURES ............................................................................ 18
MEMBER SATISFACTION.................................................................................................................................. 19
QUALITY PERFORMANCE MATRIX ANALYSIS—2015 MEASUREMENT YEAR ................................................... 20
NYSDOH QUALITY INCENTIVE .......................................................................................................................... 22
PERFORMANCE IMPROVEMENT PROJECT ...................................................................................................... 23
HEALTH DISPARITIES ....................................................................................................................................... 25
VI. Health Information Technology ............................................................................................................ 26
VII. Deficiencies and Appeals ...................................................................................................................... 29
COMPLIANCE WITH NYS STRUCTURE AND OPERATION STANDARDS............................................................. 29
EXTERNAL APPEALS ......................................................................................................................................... 32
VIII. Financial Data ...................................................................................................................................... 33
IX. Strengths and Opportunities for Improvement ...................................................................................... 35
X. Appendix ............................................................................................................................................. 39
REFERENCES .................................................................................................................................................... 39

Healthfirst PHSP, Inc. | Reporting Year 2015 Technical Report ii
List of Tables
Table 1: Medicaid Enrollment—2013-2015 ...............................................................................................................3
Table 2: Enrollment: Other Product Lines—2013-2015 .............................................................................................3
Table 3: Medicaid Membership Age and Gender Distribution—December 2015 .....................................................4
Table 4: Medicaid Providers by Specialty—2015 (4th Quarter) ..................................................................................6
Table 5: Ratio of Enrollees to Medicaid Providers—2015 (4th Quarter) ....................................................................7
Table 6: Medicaid PCPs with an Open Panel—2013-2015 (4th Quarter) ....................................................................7
Table 7: HEDIS®/QARR Board Certification Rates—2013-2015 .................................................................................8
Table 8: Medicaid Encounter Data—2013-2015 ..................................................................................................... 10
Table 9: Health Screenings—2013-2015 ................................................................................................................. 11
Table 10: QARR Use of Services—2013-2015 .......................................................................................................... 12
Table 11: QARR MCO Performance Rates—2013-2015 .......................................................................................... 15
Table 12: QARR Access to/Availability of Care Measures—2013-2015 .................................................................. 17
Table 13: QARR Prenatal Care Measures—2012-2014 ........................................................................................... 18
Table 14: CAHPS®—2011, 2013, and 2015 .............................................................................................................. 19
Table 15: Quality Performance Matrix—2015 Measurement Year ........................................................................ 21
Table 16: Quality Incentive Points Earned—2013-2015 ......................................................................................... 22
Table 17: Quality Incentive Measures and Points Earned—2015 ........................................................................... 23
Table 18: Performance Improvement Project—2015-2016 .................................................................................... 24
Table 19: MCO Use of Health Information Technology—2015 Survey of NYS MCOs ............................................. 27
Table 20: Focused Review Types ............................................................................................................................. 30
Table 21: Summary of Citations .............................................................................................................................. 31
Table 22: External Appeals—2013-2015 ................................................................................................................. 32
Table 23: Selected Financial Ratios—2014-2015 .................................................................................................... 33

Healthfirst PHSP, Inc. | Reporting Year 2015 Technical Report iii
List of Figures
Figure 1: Enrollment Trends—All Product Lines.........................................................................................................3
Figure 2: Medicaid Enrollees by Age—December 2015 .............................................................................................4
Figure 3: Medicaid Enrollees by Aid Category—December 2015 ..............................................................................5
Figure 4a: Assets to Net Worth and Current Ratio .................................................................................................. 34
Figure 4b: Medical Loss Ratio and Administrative Ratio ......................................................................................... 34

Healthfirst PHSP, Inc. | Reporting Year 2015 Technical Report iv
Acronyms Used in This Report
ALOS: Average Length of Stay AO: Area Office CHP: Child Health Plus COM (C): Commercial DBA: Doing Business As DSS: Data Submission System EQR: External Quality Review EQRO: External Quality Review Organization F/A: Failed Audit FAR: Final Audit Report FFS: Fee For Service FHP: Family Health Plus FTE: Full Time Equivalent HCS: Health Commerce System HEDIS: Health Effectiveness Data and
Information Set HIE: Health Information Exchange HIT: Health Information Technology HMO: Health Maintenance Organization HPN: Health Provider Network MCO: Managed Care Organization MED (M): Medicaid MMC: Medicaid Managed Care MMCOR: Medicaid Managed Care Operating
Report N: Denominator N/A: Not Available NCQA: National Committee for Quality
Assurance NP: Not Provided NR: Not Reported NV: Not Valid NYC: New York City NYCRR: New York Code Rules and Regulations NYSDOH: New York State Department of Health
OB/GYN: Obstetrician/Gynecologist OPMC: Office of Professional Medical Conduct OP: Optimal Practitioner Contact OQPS: Office of Quality and Patient Safety PCP: Primary Care Practitioner/Provider PIP: Performance Improvement Project PNDS: Provider Network Data System POC: Plan of Corrective Action PMPY: Per Member Per Year PTMY: Per Thousand Member Years PHSP: Prepaid Health Services Plans PQI: Prevention Quality Indicator Q1: First Quarter (Jan. – March) Q2: Second Quarter (Apr. – June) Q3: Third Quarter (July – Sept.) Q4: Fourth Quarter (Oct. – Dec.) QARR: Quality Assurance Reporting
Requirements R: Rotated ROS: Rest of State RY: Reporting Year SN: Safety Net SOD: Statement of Deficiency SS: Small Sample (Less than 30) SSI: Supplemental Security Income SWA: Statewide Average TANF: Temporary Aid to Needy Families TR: Technical Report UR: Utilization Review

Healthfirst PHSP, Inc. | Reporting Year 2015 Technical Report 1
I. About This Report
New York State (NYS) is dedicated to providing and maintaining the highest quality of care for enrollees in managed health care plans. The New York State Department of Health’s (NYSDOH) Office of Quality and Patient Safety (OQPS) employs an ongoing strategy to improve the quality of care provided to plan enrollees, to ensure the accountability of these plans, and to maintain the continuity of care to the public.
The technical reports are individualized reports on the Managed Care Organizations (MCOs) certified to provide Medicaid coverage in NYS. In accordance with federal requirements, these reports summarize the results of the 2015 External Quality Review (EQR) to evaluate access to, timeliness of, and quality of care provided to NYS Medicaid beneficiaries. Mandatory EQR-related activities (as per Federal Regulation 42 CFR §438.358) reported include validation of performance improvement projects (PIPs), validation of MCO-reported and NYSDOH-calculated performance measures, and review for MCO compliance with NYSDOH structure and operation standards. Optional EQR-related activities (as per Federal Regulation 42 CFR §438.358) reported include administration of a consumer survey of quality of care (CAHPS®) by an NCQA-certified survey vendor and technical assistance by the NYS EQRO to MCOs regarding PIPs and reporting performance measures. Other data incorporated to provide additional background on the MCOs include the following: health plan corporate structure, enrollment data, provider network information, encounter data summaries, PQI/compliance/ satisfaction/quality points and incentive, deficiencies and appeals summaries, and financial data.
These reports are organized into the following domains: Corporate Profile, Enrollment and Provider Network, Utilization, Quality Indicators, Health Information Technology, Deficiencies and Appeals, and Financial Data. Although the reports focus primarily on Medicaid data, selected sections of these reports also include data from the MCOs’ Child Health Plus (CHP) and Commercial product lines. For some measures, including QARR 2016 (MY 2015) aggregate rates are used, which represent the population of various product lines. These measures are noted as such. Additionally, when available and appropriate, the MCOs’ data are compared with statewide benchmarks. Unless otherwise noted, when benchmarks are utilized for rates other than HEDIS®/QARR or CAHPS®, comparative statements are based on differences determined by standard deviations: a difference of one standard deviation is used to determine rates that are higher or lower than the statewide average.
Section IX provides an assessment of the MCO’s strengths and opportunities for improvement in the areas of accessibility, timeliness, and quality of services. For areas in which the MCO has opportunities for improvement, recommendations for improving the quality of the MCO’s health care services are provided. To achieve full compliance with federal regulations, this section also includes an assessment of the degree to which the MCO has effectively addressed the recommendations for quality improvement made by the NYS EQRO in the previous year’s EQR report. The MCO was given the opportunity to describe current and proposed interventions that address areas of concern, as well as an opportunity to explain areas that the MCO did not feel were within its ability to improve. The response by the MCO is appended to this section of the report.
In an effort to provide the most consistent presentation of this varied information, the technical report is prepared based on data for the most current calendar year available. Where trending is desirable, data for prior calendar years may also be included. This report includes data for Reporting Year 2015.

Healthfirst PHSP, Inc. | Reporting Year 2015 Technical Report 2
II. MCO Corporate Profile
Healthfirst PHSP, Inc. (Healthfirst) is a regional, not-for-profit prepaid health services plan (PHSP) that services Medicaid (MCD), Health and Recovery Plan (HARP), and Child Health Plus (CHP) populations. The following report presents plan-specific information for the Medicaid line of business and selected information for the CHP product line.
Plan ID: 2090194 DOH Area Office: MARO Corporate Status: PHSP Tax Status: Not-for-profit Medicaid Managed Care Start Date: August 30, 1994 Product Line(s): Medicaid (MCD), Health and Recovery Plan (HARP), and Child Health Plus (CHP) Contact Information: 100 Church Street
New York, NY 10007 NCQA Accreditation Status as of 02/15/17: Did not apply Medicaid Dental Benefit Status: Mandatory Benefit
Participating Counties and Products
Bronx: MCD CHP Kings: MCD CHP Nassau: MCD CHP New York: MCD CHP Queens: MCD CHP Richmond: MCD CHP Suffolk: MCD CHP

Healthfirst PHSP, Inc. | Reporting Year 2015 Technical Report 3
III. Enrollment and Provider Network
ENROLLMENT Table 1 displays enrollment for the MCO’s Medicaid product line for 2013, 2014, and 2015, as well as the percent change from the previous year. Enrollment has increased from 2014 to 2015 by a rate of 11.2%. Table 2 presents enrollment from other product lines carried by the MCO. Figure 1 trends enrollment for all product lines. Table 1: Medicaid Enrollment—2013-2015
2013 2014 2015
Number of Members 697,674 856,361 952,548
% Change From Previous Year 22.7% 11.2% Data Source: MEDS II
Table 2: Enrollment: Other Product Lines—2013-2015
2013 2014 2015
FHP1 70,096
CHP 27,687 27,281 30,419 1 In RY 2014, the MCO discontinued its Family Health Plus product line.
Figure 1: Enrollment Trends—All Product Lines
Medicaid CHP
2013
2014
2015
0
25,000
50,000
950,000
850,000
750,000
650,000
550,000
1,050,000

Healthfirst PHSP, Inc. | Reporting Year 2015 Technical Report 4
Table 3 and Figure 2 display a breakdown of the MCO’s enrollment by age and gender as of December 31, 2015, for the Medicaid product line. The table also indicates whether the MCO’s rate is above (indicated by ▲) or below (indicated by ▼) the statewide average. Table 3: Medicaid Membership Age and Gender Distribution—December 2015
Age in Years Male Female Total MCO
Distribution Statewide Under 1 15,655 14,910 30,565 3.2% 2.9%
1-4 48,022 46,044 94,066 9.9% 9.6%
5-14 101,072 96,004 197,076 20.7% 21.4%
15-19 40,876 41,087 81,963 8.6% 9.0%
20-44 128,565 210,655 339,220 35.6% 35.3%
45-64 80,356 110,105 190,461 20.0% 20.4%
65 and Over 7,032 12,165 19,197 2.0% 1.5%
Total 421,578 530,970 952,548 Under 20 205,625 198,045 403,670 42.4% 42.9%
Females 15-64 361,847 38.0% ▲ 36.5%
Figure 2: Medicaid Enrollees by Age—December 2015
0%
5%
10%
15%
20%
25%
30%
35%
40%
<1 1-4 5-14 15-19 20-44 45-64 65+
Healthfirst
Statewide

Healthfirst PHSP, Inc. | Reporting Year 2015 Technical Report 5
A breakdown of MCO membership by aid category, as reported by the NYSDOH for December 31, 2015, is shown in Figure 3.
Figure 3: Medicaid Enrollees by Aid Category—December 2015
TANF: Temporary Aid to Needy Families SN: Safety Net SSI: Supplemental Security Income UNAS: Unassigned
65.1%
27.2%
7.0%
0.7%
Healthfirst
65.2%
27.0%
7.0%
0.6%
Statewide
Healthfirst PHSP, Inc. | Reporting Year 2015 Technical Report 6
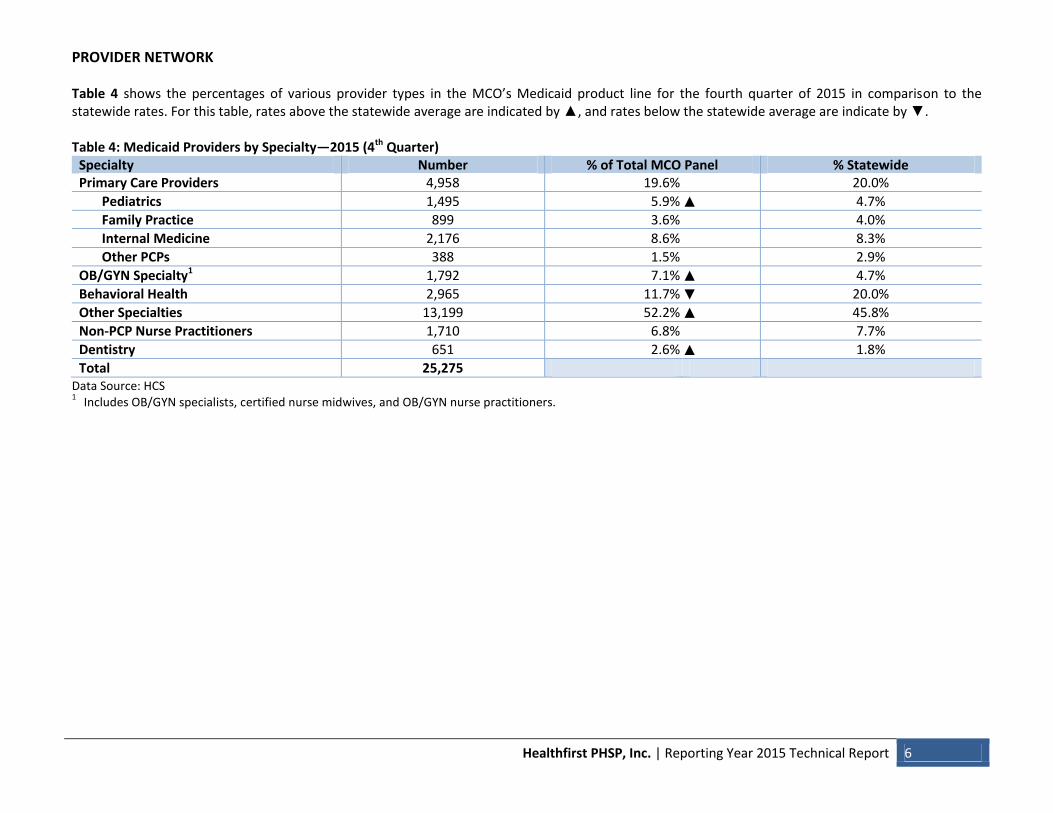
PROVIDER NETWORK Table 4 shows the percentages of various provider types in the MCO’s Medicaid product line for the fourth quarter of 2015 in comparison to the statewide rates. For this table, rates above the statewide average are indicated by ▲, and rates below the statewide average are indicate by ▼. Table 4: Medicaid Providers by Specialty—2015 (4th Quarter)
Specialty Number % of Total MCO Panel % Statewide Primary Care Providers 4,958 19.6% 20.0%
Pediatrics 1,495 5.9% ▲ 4.7%
Family Practice 899 3.6% 4.0%
Internal Medicine 2,176 8.6% 8.3%
Other PCPs 388 1.5% 2.9%
OB/GYN Specialty1 1,792 7.1% ▲ 4.7%
Behavioral Health 2,965 11.7% ▼ 20.0%
Other Specialties 13,199 52.2% ▲ 45.8%
Non-PCP Nurse Practitioners 1,710 6.8% 7.7%
Dentistry 651 2.6% ▲ 1.8%
Total 25,275 Data Source: HCS 1 Includes OB/GYN specialists, certified nurse midwives, and OB/GYN nurse practitioners.

Healthfirst PHSP, Inc. | Reporting Year 2015 Technical Report 7
Table 5 displays the ratio of enrollees to providers, as well as the number of Full Time Equivalents (FTEs), and the ratio of enrollees to FTEs for the fourth quarter of 2015. Statewide data are also included. For this table, rates above the 90th percentile are indicated by ▲, while rates below the 10th percentile are indicated by ▼. Note that a higher percentile indicates fewer providers per enrollee. Table 5: Ratio of Enrollees to Medicaid Providers—2015 (4th Quarter)
Healthfirst Statewide
Specialty Type
Ratio of Enrollees to
Providers
Total Number of
FTEs
Ratio of Enrollees to
FTEs
Median Ratio of Enrollees to Providers1
Total Number of
FTEs
Median Ratio of Enrollees
to FTEs Medicaid Primary Care Providers 192:1 ▲ 4,141 230:1 ▲ 100:1 42,807 104:1
Pediatrics (Under age 20) 270:1 ▲ 158:1
OB/GYN (Females age 15-64) 202:1 ▲ 110:1
Behavioral Health 321:1 ▲ 89:1
Data Source: Derived ratios calculated from MEDS II enrollment data and HCS provider data. 1 The statewide median was used for this table, as opposed to an average, to control for substantial variability due to outliers.
The number of Medicaid PCPs with an “Open Panel” is presented in Table 6 for the fourth quarters of 2013 through 2015. Panels are considered “open” if a provider has less than 1,500 Medicaid members. For this table, rates above the statewide average are indicated by ▲, while rates below the statewide average are indicated by ▼. Table 6: Medicaid PCPs with an Open Panel—2013-2015 (4th Quarter)
2013 2014 2015
Healthfirst Statewide Healthfirst Statewide Healthfirst Statewide
Number % of
Providers % of
Providers Number % of
Providers % of
Providers Number % of
Providers % of
Providers Medicaid Providers with Open Panel 4,579 97.2% 88.8% 4,625 87.8% 87.6% 4,617 97.0% 86.1%
Data Source: HCS

Healthfirst PHSP, Inc. | Reporting Year 2015 Technical Report 8
Table 7 displays HEDIS®/QARR Board Certification rates for 2013 through 2015 of providers in the MCO’s network in comparison to the statewide averages. The table also indicates whether the MCO’s rate was above (indicated by ▲) or below (indicated by ▼) the statewide average. Table 7: HEDIS®/QARR Board Certification Rates—2013-2015
2013 2014 2015
Provider Type Healthfirst Statewide Average Healthfirst
Statewide Average Healthfirst
Statewide Average
Medicaid/CHP Family Medicine 76% 78% 74% 77% 74% 77%
Internal Medicine 81% ▲ 78% 82% ▲ 77% 81% ▲ 76%
Pediatricians 82% 80% 82% 80% 83% ▲ 79%
OB/GYN 78% 78% 80% ▲ 75% 82% ▲ 76%
Geriatricians 71% 69% 73% ▲ 64% 73% ▲ 63%
Other Physician Specialists 79% 78% 82% ▲ 76% 84% ▲ 76%

Healthfirst PHSP, Inc. | Reporting Year 2015 Technical Report 9
PRIMARY CARE AND OB/GYN ACCESS AND AVAILABILITY SURVEY—2015 On behalf of the NYSDOH’s Division of Health Plan Contracting and Oversight, the NYS EQRO conducts the Medicaid Managed Care Access and Availability Survey to assess the compliance of network providers in NYS MCOs with appointment timeframe requirements as per the NYS Medicaid/Family Health Plus Managed Care Contract. The survey evaluates the availability of routine and non-urgent “sick” office hour appointments with primary care physicians, including OB/GYNs, as well as the availability of after hours access. The timeliness standard for routine office hour appointments with PCPs and OB/GYNs is within 28 days of the enrollee’s request, while non-urgent “sick” office hour appointments with PCPs and OB/GYNs must be scheduled within 72 hours (excluding weekends and holidays) as clinically indicated. Prenatal appointments with OB/GYN providers within the 2nd trimester must be given within 14 days, while 3rd trimester appointments must be given within 7 days. After hours access is considered compliant if a “live voice” representing the named provider is reached or if the named provider’s beeper number is reached. Note: At the time of publication of this report, the Access and Availability Survey was in progress. The results of the 2016 Access and Availability Survey will be published in the RY 2016 Technical Reports.

Healthfirst PHSP, Inc. | Reporting Year 2015 Technical Report 10
IV. Utilization
This section of the report explores utilization of the MCO’s services by examining encounter and health screening data, as well as QARR Use of Services rates.
ENCOUNTER DATA Table 8 displays selected Medicaid encounter data for 2013 through 2015. The MCO’s rates for these periods are also compared to the statewide averages. For this table, rates above the statewide average are indicated by ▲, while rates below the statewide average are indicate by ▼. Table 8: Medicaid Encounter Data—2013-2015
Encounters (PMPY)
2013 2014 2015
Healthfirst Statewide Average Healthfirst
Statewide Average Healthfirst
Statewide Average
PCPs and OB/GYNs 4.85 4.45 4.95 4.36 4.81 4.12
Specialty 2.16 1.90 2.31 1.94 2.41 1.92
Emergency Room 0.63 0.60 3.04 2.11 0.59 0.54
Inpatient Admissions 0.16 0.14 0.17 0.15 0.14 0.14
Dental 0.89 1.00 0.98 1.03 1.02 0.99 Data Source: MEDS II PMPY: Per Member Per Year

Healthfirst PHSP, Inc. | Reporting Year 2015 Technical Report 11
HEALTH SCREENINGS In accordance with 13.6(a)(ii) of the Medicaid Managed Care and Family Health Plus Model Contract, MCOs must make reasonable efforts to contact new enrollees within 30 days of enrollment either in person, by telephone, or by mail, and conduct a brief health screening to assess special health care needs (e.g., prenatal care or behavioral health services), as well as language and communication needs. MCOs are required to submit a quarterly report to the NYSDOH showing the percentage of new enrollees for which the MCO was able to complete health screenings. Table 9 summarizes the percentage of Medicaid enrollees receiving health screenings within 30 days of enrollment from 2013 through 2015, in addition to displaying the statewide averages for these years. For this table, rates above the statewide average are indicated by ▲, and rates below the statewide average are indicated by ▼. Table 9: Health Screenings—2013-2015
2013 2014 2015
Healthfirst SWA Healthfirst SWA Healthfirst SWA Medicaid Enrollee Health Screenings 24.3% 25.3% 10.4% 15.1% 14.6% 14.9%

Healthfirst PHSP, Inc. | Reporting Year 2015 Technical Report 12
QARR USE OF SERVICES MEASURES For this domain of measures, performance is assessed by indicating whether the MCO’s rates reached the 90th or 10th percentiles. Table 10 lists the Use of Services rates for the selected product lines for 2013 through 2015. The table displays whether the MCO’s rate was higher than 90% of all rates for that measure (indicated by ▲) or whether the MCO’s rate was lower than 90% of all rates for that measure (indicated by ▼). Table 10: QARR Use of Services—2013-2015
Medicaid/CHP
Measure 2013 2014 2015 2015
Statewide Average Outpatient Utilization (PTMY) Visits 5,452 5,666 5,457 5,398
ER Visits 601 599 574 554 Inpatient ALOS Medicine 4.0 5.0 ▲ 4.2 4.1
Surgery 4.7 ▼ 5.9 5.7 6.2
Maternity 3.0 3.0 3.0 2.8
Total 4.1 4.3 4.1 4.1 Inpatient Utilization (PTMY) Medicine Cases 52 ▲ 48 42 36
Surgery Cases 14 8 ▼ 17 15
Maternity Cases 42 45 ▲ 38 32
Total Cases 107 ▲ 88 88 75 PTMY: Per Thousand Member Years ALOS: Average Length of Stay. These rates are measured in days.

Healthfirst PHSP, Inc. | Reporting Year 2015 Technical Report 13
V. Quality Indicators
To measure the quality of care provided by the MCOs, the State prepares and reviews a number of reports on a variety of quality indicators. This section is a summary of findings from these reports, including HEDIS®/QARR 2016 audit findings, as well as results of quality improvement studies, enrollee surveys, and MCO Performance Improvement Projects (PIPs).
VALIDATION OF PERFORMANCE MEASURES Performance measures are reported and validated using several methodologies. MCOs submitted member- and provider-level data for several measures to the NYSDOH. The NYS EQRO audited all member- and provider-level data for internal consistency. Several performance measures are calculated by the NYSDOH, with source code validated by the NYS EQRO. Finally, MCOs report a subset of HEDIS® measures to the NYSDOH annually, along with several NYS-specific measures. MCO-reported performance measures were validated as per HEDIS® 2016 Compliance Audit™ specifications developed by the National Committee for Quality Assurance (NCQA). Since measurement year (MY) 2013, the methodology for reporting performance rates was modified. Previously, Medicaid and Child Health Plus (CHP) were reported separately; however, for QARR 2016 (MY 2015), rates for these populations were combined, following HEDIS® methodology (summing numerators and denominators from each population). Trend analysis has been applied over the time period, as the effect of combining the CHP and Medicaid populations was determined to be negligible through an analysis of historical QARR data. The results of each MCO’s HEDIS® Compliance Audit™ are summarized in its Final Audit Report (FAR).
SUMMARY OF HEDIS® 2016 INFORMATION SYSTEM AUDIT™ As part of the HEDIS® 2016 Compliance Audit™, auditors assessed the MCO’s compliance with NCQA standards in the six designated information system categories, as follows:
1. Sound Coding Methods for Medical Data 2. Data Capture, Transfer, and Entry—Medical Data 3. Data Capture, Transfer, and Entry—Membership Data 4. Data Capture, Transfer, and Entry—Practitioner Data 5. Data Integration Required to Meet the Demands of Accurate HEDIS® Reporting 6. Control Procedures that Support HEDIS® Reporting and Integrity
In addition, two HEDIS®-related documentation categories were assessed:
1. Documentation 2. Outsourced or Delegated HEDIS® Reporting Functions
The NYS EQRO provided technical assistance to MCOs throughout the performance measure reporting process in the following forms: 1) introductory and technical workshops prior to the audit, 2) readiness reviews for new MCOs, 3) serving as a liaison between the MCOs and NCQA to clarify questions regarding measure specifications, 4) preparation of and technical support for the Data Submission System (DSS) used to submit data to the NYSDOH, and 5) clarifications to MCO questions regarding the submission of member- and provider-level data, as well as general questions regarding the audit process. The HEDIS® Final Audit Report for Healthfirst indicated that the MCO demonstrated compliance with all areas of Information Systems and all areas of measure determination required for successful HEDIS®/QARR reporting.

Healthfirst PHSP, Inc. | Reporting Year 2015 Technical Report 14
However, in regard to the standard IS AD 1.0 Audit Documentation, it was determined that the MCO did not submit all required documentation for the audit in a timely manner. As noted in the FAR, it is recommended that Healthfirst should try to submit all required data on time in order to allow sufficient time for auditor review and validation, as well as time for the MCO to address any identified issues. The MCO used NCQA-certified software to produce its HEDIS® measures. Supplemental databases were used to capture additional data, as well. These databases were validated and determined to be HEDIS®-compliant by the auditors. Healthfirst passed Medical Record Review for the five measures validated, as well as for Exclusions. The MCO was able to report all measures for its Medicaid product line. Table 11 displays QARR performance rates for Measurement Years 2013, 2014, and 2015, as well as the statewide averages (SWAs). The table indicates whether the MCO’s rate was statistically better than the SWA (indicated by ▲) or whether the MCO’s rate was statistically worse than the SWA (indicated by ▼).
Table Notes for Table 11 R:
NR:
NP:
FY:
SS:
Rotated measure.
Not reported.
Dental benefit not provided.
First-Year Measure, MCO-specific rates not reported.
Sample size too small to report (less than 30 members) but included in the statewide average.

Healthfirst PHSP, Inc. | Reporting Year 2015 Technical Report 15
Table 11: QARR MCO Performance Rates—2013-2015 Medicaid/CHP
Measure 2013 2014 2015 2015 SWA Follow-up Care for Children on ADHD Meds—Continue 82 ▲ 82 ▲ 86 ▲ 67
Follow-up Care for Children on ADHD Meds—Initial 67 ▲ 68 ▲ 69 ▲ 58
Adolescents—Alcohol and Other Drug Use 71 R 67 68
Adolescents—Depression 66 R 60 60
Adolescents—Sexual Activity 73 R 63 65
Adolescents—Tobacco Use 70 R 72 74
Adolescent Immunization—Combo 73 R 80 ▲ 74
Adolescent Immunization—HPV 35 ▲ 35 ▲ 39 ▲ 31
Adult BMI Assessment 86 R 91 90
Flu Shot for Adults (Ages 18-64) 49 R 44 40
Advising Smokers to Quit 80 R 76 80
Follow-up After Hospitalization for Mental Illness—30 Days 86 ▲ 87 ▲ 86 ▲ 79
Follow-up After Hospitalization for Mental Illness—7 Days 74 ▲ 76 ▲ 75 ▲ 65
Antidepressant Medication Management—Continue 34 38 ▲ 38 37
Antidepressant Medication Management—Acute Phase 49 52 ▲ 53 ▲ 52
Drug Therapy for Rheumatoid Arthritis 80 81 81 81
Asthma Medication Ratio (Ages 19-64) 62 ▲ 47 ▼ 49 ▼ 54
Asthma Medication Ratio (Ages 5-18) 68 ▼ 53 ▼ 54 ▼ 62
Use of Imaging Studies for Low Back Pain 80 ▲ 80 ▲ 78 ▲ 76
Persistence of Beta-Blocker Treatment After a Heart Attack 83 88 86 86
Avoidance of Antibiotics for Adults with Acute Bronchitis 29 ▲ 31 ▲ 35 ▲ 30
Chlamydia Screening (Ages 16-24) 77 ▲ 78 ▲ 80 ▲ 73
Colon Cancer Screening 64 ▲ R 67 ▲ 61
Dental Visit (Ages 19-21) 42 ▼ 43 44 44
Annual Dental Visits (Ages 2-18) 57 ▼ 58 ▼ 59 ▼ 60
Diabetes BP Controlled (<140/90 mm Hg) 64 ▼ R 68 68
Diabetes HbA1c below 8% 51 ▼ R 56 57
Diabetes Eye Exam 62 R 65 63
Diabetes Nephropathy Monitor 87 ▲ R 95 ▲ 93
Diabetes HbA1c Test 91 R 93 ▲ 91

Healthfirst PHSP, Inc. | Reporting Year 2015 Technical Report 16
Table 11: QARR MCO Performance Rates—2013-2015 (continued) Medicaid/CHP
Measure 2013 2014 2015 2015 SWA HIV—Engaged in Care 85 ▲ 83 ▲ 82 82
HIV—Syphilis Screening 76 ▲ 76 ▲ 76 ▲ 74
HIV—Viral Load Monitoring 72 ▲ 73 ▲ 75 ▲ 71
Childhood Immunization—Combo 3 74 R 82 ▲ 75
Lead Testing 92 ▲ R 88 87
Breast Cancer Screening 76 ▲ 76 ▲ 76 ▲ 71
Smoking Cessation Medications 64 R 56 59
Medical Management for People with Asthma 50% (Ages 19-64) 72 ▲ 68 ▲ 67 68
Medical Management for People with Asthma 50% (Ages 5-18) 56 ▲ 51 51 ▼ 53
Smoking Cessation Strategies 54 R 45 51
Monitor Patients on Persistent Medications—Combined 91 ▲ 93 ▲ 92 ▲ 92
Pharmacotherapy Management for COPD—Bronchodilator 91 ▲ 89 90 ▲ 88
Pharmacotherapy Management for COPD—Corticosteroid 74 75 74 75
Testing for Pharyngitis 86 86 ▼ 86 ▼ 88
Diabetes Monitoring for Schizophrenia 83 ▲ 83 ▲ 84 ▲ 80
Diabetes Screen for Schizophrenia or Bipolar Disorder on Antipsychotic Meds 86 ▲ 85 ▲ 85 ▲ 82
Antipsychotic Meds for Schizophrenia 65 63 61 61
Spirometry Testing for COPD 53 63 ▲ 70 ▲ 56
Treatment for Upper Respiratory Infection 94 ▲ 95 ▲ 95 ▲ 94
Well-Child Visits—First 15 Months 69 66 68 ▲ 65
Well-Child Visits—3 to 6 Years 85 ▲ 88 ▲ 88 ▲ 84
Well-Care Visits for Adolescents 65 ▲ 69 ▲ 70 ▲ 65
Children BMI 66 ▼ R 73 77
Children Counseling for Nutrition 72 ▼ R 81 80
Children Counseling for Physical Activity 62 ▼ R 66 ▼ 72

Healthfirst PHSP, Inc. | Reporting Year 2015 Technical Report 17
QARR ACCESS TO/AVAILABILITY OF CARE MEASURES The QARR Access to/Availability of Care measures examine the percentages of children and adults who access certain services, including PCPs or preventive services, prenatal and postpartum care, and dental services for selected product lines. Table 12 displays the Access to/Availability of Care measures for Measurement Years 2013 through 2015. The table indicates whether the MCO’s rate was higher than 90% of all MCOs for that measure (indicated by ▲) or whether the MCO’s rate was lower than 90% of MCOs for that measure (indicated by ▼). Table 12: QARR Access to/Availability of Care Measures—2013-2015
Medicaid/CHP
Measure 2013 2014 2015 2015 SWA Children and Adolescents’ Access to PCPs (CAP) 12-24 Months 97% 96% 94% ▼ 95%
25 Months-6 Years 94% 95% ▲ 95% ▲ 94%
7-11 Years 97% 97% ▲ 97% ▲ 97%
12-19 Years 94% 94% 95% ▲ 94% Adults’ Access to Preventive/Ambulatory Services (AAP) 20-44 Years 86% ▲ 86% ▲ 85% ▲ 83%
45-64 Years 92% ▲ 93% ▲ 92% ▲ 90%
65+ Years 91% ▲ 91% ▲ 92% ▲ 90% Access to Other Services Timeliness of Prenatal Care R 91% ▲ 88% 88%
Postpartum Care R 69% 68% 70%
Annual Dental Visit1 56% ▼ 56% ▼ 57% ▼ 59% R: Rotated measure 1 For the Annual Dental Visit measure, the Medicaid age group is 2-21 years, while the Child Health Plus age group is 2-18 years.
Healthfirst PHSP, Inc. | Reporting Year 2015 Technical Report 18
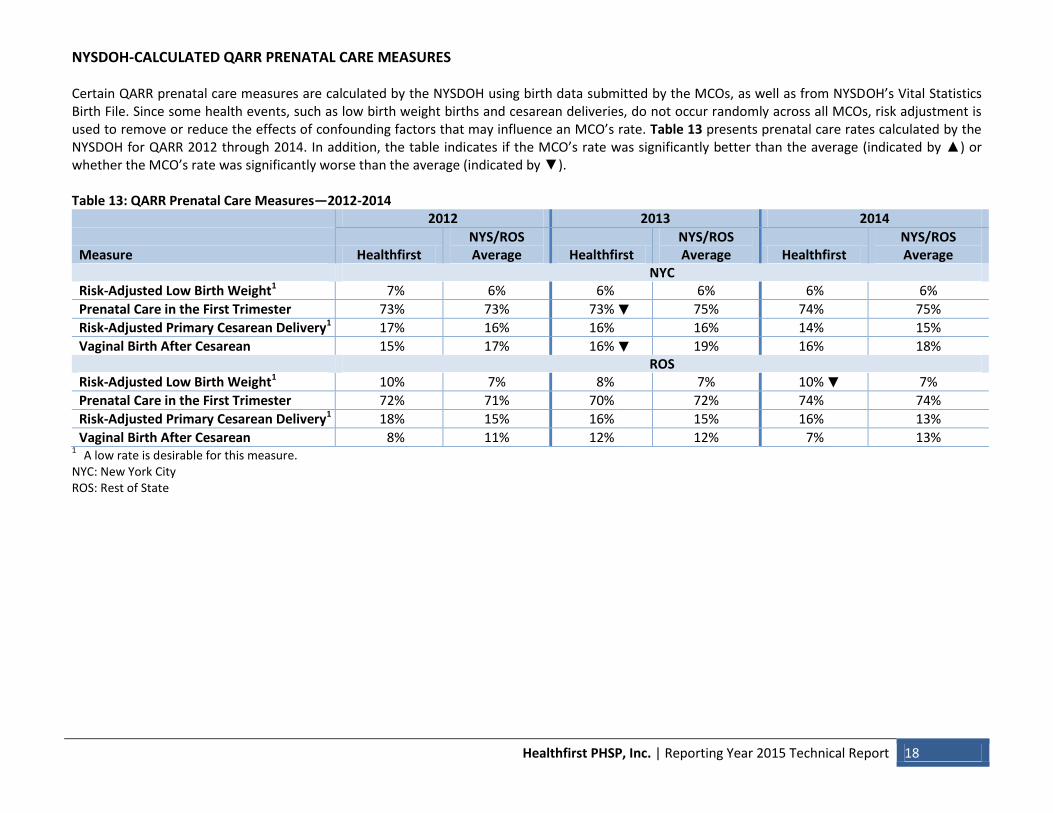
NYSDOH-CALCULATED QARR PRENATAL CARE MEASURES Certain QARR prenatal care measures are calculated by the NYSDOH using birth data submitted by the MCOs, as well as from NYSDOH’s Vital Statistics Birth File. Since some health events, such as low birth weight births and cesarean deliveries, do not occur randomly across all MCOs, risk adjustment is used to remove or reduce the effects of confounding factors that may influence an MCO’s rate. Table 13 presents prenatal care rates calculated by the NYSDOH for QARR 2012 through 2014. In addition, the table indicates if the MCO’s rate was significantly better than the average (indicated by ▲) or whether the MCO’s rate was significantly worse than the average (indicated by ▼). Table 13: QARR Prenatal Care Measures—2012-2014
2012 2013 2014
Measure Healthfirst NYS/ROS Average Healthfirst
NYS/ROS Average Healthfirst
NYS/ROS Average
NYC Risk-Adjusted Low Birth Weight1 7% 6% 6% 6% 6% 6%
Prenatal Care in the First Trimester 73% 73% 73% ▼ 75% 74% 75%
Risk-Adjusted Primary Cesarean Delivery1 17% 16% 16% 16% 14% 15%
Vaginal Birth After Cesarean 15% 17% 16% ▼ 19% 16% 18% ROS Risk-Adjusted Low Birth Weight1 10% 7% 8% 7% 10% ▼ 7%
Prenatal Care in the First Trimester 72% 71% 70% 72% 74% 74%
Risk-Adjusted Primary Cesarean Delivery1 18% 15% 16% 15% 16% 13%
Vaginal Birth After Cesarean 8% 11% 12% 12% 7% 13% 1 A low rate is desirable for this measure.
NYC: New York City ROS: Rest of State

Healthfirst PHSP, Inc. | Reporting Year 2015 Technical Report 19
MEMBER SATISFACTION In 2015, the CAHPS® survey for Medicaid enrollees was conducted on behalf of the NYSDOH by an NCQA-certified survey vendor. Table 14 displays the question category, the MCO’s rates, and statewide averages for Measurement Years 2011, 2013, and 2015. The table also indicates whether the MCO’s rate was significantly better than the statewide average (SWA) (indicated by ▲) or whether the MCO’s rate was significantly worse than the SWA (indicated by ▼). Table 14: CAHPS®—2011, 2013, and 2015
2011 2013 2015
Measure Healthfirst Statewide Average Healthfirst
Statewide Average Healthfirst
Statewide Average
Medicaid Flu Shots for Adults Ages 18-641 49 44 44 40
Advising Smokers to Quit 77 78 80 78 76 80
Getting Care Needed2 72 75 72 ▼ 78 77 79
Satisfaction with Provider Communication2 86 87 89 89 89 91
Coordination of Care2 71 68 78 78 78 80
Customer Service2 79 81 83 82 80 84
Collaborative Decision Making2 58 58 51 48 80 79
Rating of Healthcare 65 67 70 71 77 75
Rating of Health Plan—High Users 70 73 82 77 80 77
Getting Care Quickly2 72 76 76 78 78 80
Rating of Counseling/Treatment 56 59 68 61 57 64
Overall Rating of Health Plan 72 71 79 76 79 76
Rating of Personal Doctor2 74 73 79 78 80 80
Rating of Specialist 64 69 73 76 79 80
Getting Needed Counseling/Treatment 56 ▼ 71 66 70 63 74
Recommend Plan to Family/Friends 95 ▲ 91 93 92 94 93
Wellness Discussion 54 55 69 71 65 68 1 Prior to 2013, this measure was reported for adults age 50-64 years.
2 These indicators are composite measures.
Healthfirst PHSP, Inc. | Reporting Year 2015 Technical Report 20
QUALITY PERFORMANCE MATRIX ANALYSIS—2015 MEASUREMENT YEAR Table 15 displays the Quality Performance Matrix, which predominantly summarizes Effectiveness of Care measures, though it also contains select Use of Services and Access to/Availability of Care measures reported annually in the New York State Managed Care Plan Performance Report. Fifty-eight measures were selected for the 2015 Measurement Year (MY) Quality Performance Matrix, which included combined measures for the Medicaid and CHP product lines. The matrix diagrams the MCO’s performance in relation to its previous year’s quality rates and also compares its rates to those of other Medicaid Managed Care Organizations through a percentile ranking. For the MY 2012 Quality Performance Matrix, the NYSDOH made modifications in order to focus on those measures in need of the most improvement statewide. For previous measurement years, the cell category (A-F) was determined by the year-over-year trend of the measure (vertical axis) and by any significant difference from the statewide average (horizontal axis). For the 2012 MY, the matrix was reformatted to maintain the year-over-year evaluation on the vertical axis, but to evaluate the MCO’s performance based on a percentile ranking on the horizontal axis. The new percentile ranking was partitioned into three categories: 0-49th percentile, 50th-89th percentile, and 90th-100th percentile. The 2012 matrix included only those measures for which the 2011 Medicaid statewide average was less than a predetermined benchmark; however, for MY 2015, additional measures were included to provide MCOs with a broader overview of quality performance, and further assist MCOs in identifying and prioritizing quality improvement. With the issuance of the 2008 MY Matrix, the NYSDOH modified its MCO requirements for follow-up action. In previous years, MCOs were required to develop root cause analyses and plans of action for all measures reported in the D and F categories of the matrix. Starting with the 2008 MY Matrix, MCOs were required to follow-up on no more than three measures from the D and F categories of the matrix. However, if an MCO had more than three measures reported in the F category, the MCO was required to submit root causes analyses and plans of action on all measures reported in the F category. For the MY 2015 Matrix, this requirement was modified, requiring the MCO to submit a maximum of three root cause analyses and plans of action, regardless of the number of measures reported in the F category. Beginning with MY 2008, if an MCO has fewer than three measures reported in the F category, the remaining measures must be selected from the D category for a total of three measures. If the MCO has no measures in the D and F categories, the MCO is not required to follow up.

Healthfirst PHSP, Inc. | Reporting Year 2015 Technical Report 21
Table 15: Quality Performance Matrix—2015 Measurement Year
Percentile Ranking Trend* 0 to 49% 50% to 89% 90 to 100%
C Weight Assessment—BMI Percentile
B Childhood Immunization Status (Combo 3) Counseling for Nutrition
A Follow-Up Care for Children Prescribed ADHD
Medication—Continuation Phase
No Change
D Advising Smokers to Quit Annual Dental Visits (Ages 2-18) Counseling for Physical Activity Discussing Smoking Cessation Strategies HIV—Engaged in Care Medical Mgmt for People with Asthma 50%
(Ages 5-64) Medical Mgmt for People with Asthma 75%
(Ages 5-64) Tobacco Cessation—Medication Discussion Well Care Visits—First 15 Months (5+ Visits)
C Adherence to Antipsychotic Medications for Individuals with
Schizophrenia Adult BMI Assessment Annual Monitoring for Patients on Persistent Medications—
ACE Inhibitors/ARBs Annual Monitoring for Patients on Persistent Medications—
Diuretics Antidepressant Medication Management—Acute Phase Antidepressant Medication Management—Continuation
Phase Appropriate Testing for Pharyngitis Managing Diabetes Outcomes—HbA1c Control (<8.0%) Use of Imaging Studies for Low Back Pain Postpartum Care Timeliness of Prenatal Care
B Adolescent Immunization—Combo Adolescent Immunization—HPV Avoidance of Antibiotics Therapy in Adults
with Acute Bronchitis Breast Cancer Screening Cervical Cancer Screening Chlamydia Screening (Ages 16-20) Chlamydia Screening (Ages 21-24) Colon Cancer Screening Diabetes Monitoring for Diabetes and
Schizophrenia Follow-Up After Hospitalization for Mental
Illness—7 Days Follow-Up Care for Children Prescribed ADHD
Medication—Initiation Phase Monitoring Diabetes—Received All Tests Use of Spirometry Testing in the Assessment
of COPD Well Care Visits—3
rd, 4
th, 5
th, & 6
th Year of Life
F Annual Monitoring for Patients on Persistent
Medications—Digoxin Controlling High Blood Pressure
D Persistence of Beta-Blocker Treatment after a Heart Attack Frequency of Ongoing Prenatal Care
C

Healthfirst PHSP, Inc. | Reporting Year 2015 Technical Report 22
NYSDOH QUALITY INCENTIVE The percentage of the potential financial incentive that an MCO receives is based on quality of care, consumer satisfaction, and compliance. Points earned are derived from an algorithm that considers QARR 2016 (MY 2015) rates in comparison to statewide percentiles, the most recent Medicaid CAHPS® scores, and compliance information from MY 2013 and MY 2014. The total score, based out of 150 possible points, determines what percentage of the available premium increase the MCO qualifies for. For 2015, there were five tiers of incentive awards that could be achieved by MCOs based on the results. Table 16 displays the points the MCO earned from 2013 to 2015, as well as the percentage of the financial incentive that these points generated based on the previous measurement year’s data. Table 17 displays the measures that were used to calculate the 2015 incentive, as well as the points the MCO earned for each measure. Table 16: Quality Incentive Points Earned—2013-2015
2013 2014 2015
Healthfirst Statewide Average Healthfirst
Statewide Average Healthfirst
Statewide Average
Total Points (150 Possible Points) 113.3 80.8 118 73.8 108.4 75.2
PQI Points (20 Possible Points) 9.3 6.9 0 6.9 0 6.9
Compliance Points (-20 Possible Points) -6 -5.4 -2 -4 -6 -3.6
Satisfaction Points (30 Possible Points) 10 15.9 20 16.3 15 20
Quality Points1
(100 Possible Points) 100 63.4 100 54.5 99.4 56
Financial Incentive Award Designation2 75% 100% Tier 1
1 Quality Points presented here are normalized.
2 For Reporting Year 2015, the incentive award designation was changed from a percentile ranking to a tier ranking. The highest performing tier level is Tier 1, while the
lowest performing tier level is Tier 5.

Healthfirst PHSP, Inc. | Reporting Year 2015 Technical Report 23
Table 17: Quality Incentive Measures and Points Earned—2015 Measure MCO Points PQI 0.0
Adult Composite PQI (10 points) 0.0
Pediatric Composite PDI (10 points) 0.0 Compliance -6.0
MMCOR 0.0 MEDS 0.0
QARR 0.0
Access/Availability 0.0
Provider Directory -2.0
Member Services -4.0 Satisfaction (10 points each) 15.0
Rating of Health Plan 5.0
Getting Care Needed 5.0
Customer Service 5.0 Quality (3.03 points each, except where noted) 61.4
Adult BMI Assessment 1.52
Adherence to Antipsychotic Medications for Individuals with Schizophrenia 1.52
Antidepressant Medication Management 2.27
Annual Monitoring for Patients on Persistent Medications 2.27 Appropriate Testing for Pharyngitis 1.52
Avoidance of Antibiotics Therapy in Adults with Acute Bronchitis 3.03
Breast Cancer Screening 3.03
Cervical Cancer Screening 3.03
Chlamydia Screening 3.03 Childhood Immunization Status (Combo 3) 2.27
Colorectal Cancer Screening 3.03
Comprehensive Care for People Living with HIV/AIDS—Engaged in Care 0.0
Comprehensive Diabetes Care—Received All Tests 3.03
Comprehensive Diabetes Care—HbA1C Control < 8.0% 1.52 Controlling High Blood Pressure 0.0
Diabetes Monitoring for People with Diabetes and Schizophrenia 3.03
Flu Shot for Adults (CAHPS) 1.52
Follow Up After Hospitalization for Mental Illness Within 7 Days 3.03
Follow Up for Children Newly Prescribed ADHD Medication 3.03
Human Papillomavirus Vaccination for Female Adolescents 3.03 Immunizations for Adolescents 3.03
Medical Assistance with Tobacco Cessation (CAHPS) 0.0
Medication Management for People with Asthma (Ages 5-64) 0.0
Persistence of Beta-Blocker Treatment After a Heart Attack 1.52
Use of Imaging Studies for Low Back Pain 1.52 Use of Spirometry Testing in the Assessment and Diagnosis of COPD 3.03
Weight Assessment and Counseling for Children and Adolescents 0.0
Annual Dental Visit (Ages 2-18) 0.0
Frequency of Ongoing Prenatal Care (81% and more) 1.52
Timeliness of Prenatal Care 1.52 Postpartum Care 1.52
Well Child Visits in the First 15 Months—Five or more visits 0.0
Well Child Visits in the 3rd, 4th, 5th and 6th Year 3.03 Total Normalized Quality Points
1 99.4
Total Points Earned 108.4 MMCOR: Medicaid Managed Care Operating Report MEDS: Medicaid Encounter Data Set 1 Quality Points were normalized before being added to the total points earned. The points each MCO earned for each quality measure
were aggregated and converted to normalized quality points. Quality points were normalized in order to control for a difference in base points, as not every MCO could earn points for each measure due to small sample sizes (less than 30 members)

Healthfirst PHSP, Inc. | Reporting Year 2015 Technical Report 24
PERFORMANCE IMPROVEMENT PROJECT Each MCO is required by the Medicaid Health Maintenance Organization contract to conduct at least one Performance Improvement Project (PIP) each year. A PIP is a methodology for facilitating MCO- and provider-based improvement in quality of care. PIPs place emphasis on evaluating the success of interventions to improve quality of care. Through these projects, MCOs and providers determine what processes need to be improved and how they should improve. The NYS EQRO provided technical assistance to MCOs throughout the PIP process in the following forms: 1) review of the MCO’s Project Proposal prior to the start of the PIP; 2) quarterly teleconferences with the MCO for progress updates and problem-solving; 3) feedback on methodology, data collection tools, and implementation of interventions; and 4) feedback on drafts of the MCO’s final report. In addition, the NYS EQRO validated the MCO’s PIP by reviewing the project topic, aim statement, performance indicators, study population, sampling methods (if sampling was used), data collection procedures, data analysis, and interpretation of project results, as well as assessing the MCO’s improvement strategies, the likelihood that the reported improvement is “real” improvement, and whether the MCO is likely to be able to sustain its documented improvement. Validation teams met quarterly to review any issues that could potentially impact the credibility of PIP results, thus ensuring consistency among validation teams. The validation process concluded with a summary of the strengths and opportunities for improvement in the conduct of the PIP, including any validation findings that indicated the credibility of the PIP results was at risk. Healthfirst’s 2015-2016 PIP topic is “Improving the Identification of Smokers in the Adult 18-64 y.o. Medicaid Population and Increasing the Utilization of Smoking Cessation Benefits”. During 2015, the MCO implemented the following interventions:
PCPs with a high volume of adult Medicaid members who are smokers and who are not utilizing cessation benefits will be sent a list of their members identified as smokers, as well as cessation information. PCPs with members who were referred to the NYS QuitLine will also receive a reminder letter and provider bulletin.
Partner with NYC Treat Tobacco for Provider education to conduct a presentation during an MCO-sponsored event with the American Lung Association on how to implement organizational-level policies, integrate a seamless system to refer smokers to the QuitLine, and discuss evidence-based strategies for treating tobacco use. Community and sponsor hospitals, as well as high-volume physicians will be invited.
Ongoing web postings on the provider website of toolkits for tobacco cessation and on the member website of cessation education materials, online/community resources, and the NYS QuitLine.
Member Services, Clinical Quality Member Outreach team, and Care Management will refer members to the NYS QuitLine.
Semi-annual newsletter articles will be published to educate members on the hazards of smoking, effective cessation strategies, online/community resources, cessation benefits, and the QuitLine.
Smoking cessation promotion at MCO-sponsored and ADA-sponsored community events.
Creation of an internal smokers’ registry. Table 18 presents a summary of Healthfirst’s 2015-2016 PIP. Table 18: Performance Improvement Project—2015-2016 Results not shown, as 2015 was the first phase of the MCO’s two-year PIP. Results will be included in the 2016 EQRO Technical Report.

Healthfirst PHSP, Inc. | Reporting Year 2015 Technical Report 25
HEALTH DISPARITIES For this year’s technical report, the NYS EQRO evaluated MCOs with respect to their activities to identify and/or address gaps in health outcomes and/or health care among their Medicaid population according to at-risk characteristics such as race, ethnicity, gender, geography, etc. This information was obtained through surveying MCOs regarding the following activities:
1. Characterization, identification, or analysis of the MCO’s Medicaid population according to at-risk characteristics.
2. Identification of differences in health outcomes or health status that represent measurable gaps between the MCO’s Medicaid population and other types of health care consumers.
3. Identification of gaps in quality of care for the MCO’s Medicaid members and/or Medicaid subgroups. 4. Identification of determinants of gaps in health outcomes, health status, or quality of care for at-risk
populations. 5. Development and/or implementation of interventions that aim to reduce or eliminate differences in
health outcomes or health status and to improve the quality of care for MCO members with at-risk characteristics.
Healthfirst reported that the following activities were performed in 2015 to identify and/or address disparities in health outcomes and/or health care among its Medicaid population:
A Community Health Worker maternal health program was launched in 2016 in an effort to target women in zip codes who are significantly less likely to receive timely postpartum care than the MCO’s Medicaid population overall.
Healthfirst collaborated with Mount Sinai’s Icahn School of Medicine on a Robert Wood Johnson Foundation project aimed toward disparities in care for high-risk postpartum women. The study showed postpartum visit rates are low among high-risk Healthfirst members at Mount Sinai, the majority of whom are Latina or African American, and especially low for mothers with diabetes and/or hypertension. He study’s intervention adapts evidence-based care management protocols using a social worker and community health worker in the postpartum period.
The MCO and a predictive analytics vendor analyzed the Medicaid population and risk-stratified members in order to see outreach engagement impact as it relates to HEDIS compliance. Some key findings and follow-up actions include: strategies for non-English-/Spanish-/Mandarin-speaking members, higher quality IVR capabilities, dental outreach, and better understanding of the well-care visits measure.
Healthfirst developed a strategy to support members in accessing routine and urgent appointment and close care gaps. Use of telehealth was developed, but ultimately denied, as a pathway for Medicaid, but it is being rolled out for the Commercial population. The MCO has contracted with about 125 Urgent Care networks since the start of this initiative in 2015 in order to increase access to care. There was an increase in utilization of urgent care and a decrease in utilization of the Emergency Room by the Medicaid population. The MCO is also pursuing a nurse help line for the Medicare population.
Healthfirst PHSP, Inc. | Reporting Year 2015 Technical Report 26
VI. Health Information Technology
According to the US Department of Health & Human Services, health information technology (HIT) allows comprehensive management of medical information and its secure exchange between health care consumers and providers. Broad use of HIT will improve health care quality, prevent medical errors, reduce health care costs, increase administrative efficiencies, decrease paperwork, and expand access to affordable health care. In 2015, the NYS EQRO surveyed Medicaid MCOs regarding the use of HIT to improve the care of its Medicaid members. Specifically, MCOs were asked to report on:
1. Secure electronic transfer of Health Insurance Portability and Accountability Act (HIPAA) protected information to patients and/or providers and support staff
2. Use of telecommunications technologies 3. Use of Electronic Health Records (EHR) 4. Use of electronic internal registries 5. Use of clinical risk group (CRG) or similar software 6. Secure electronic transfer of member data between the MCO, its vendors, and network providers 7. Electronic communication with providers 8. Electronic communication with members 9. Participation in a Regional Health Information Organization (RHIO) or Health Information Exchange
(HIE)1 10. Participation in State, Federal, or privately funded HIT initiatives 11. Participation in a medical home pilot or program 12. Future plans to implement HIT
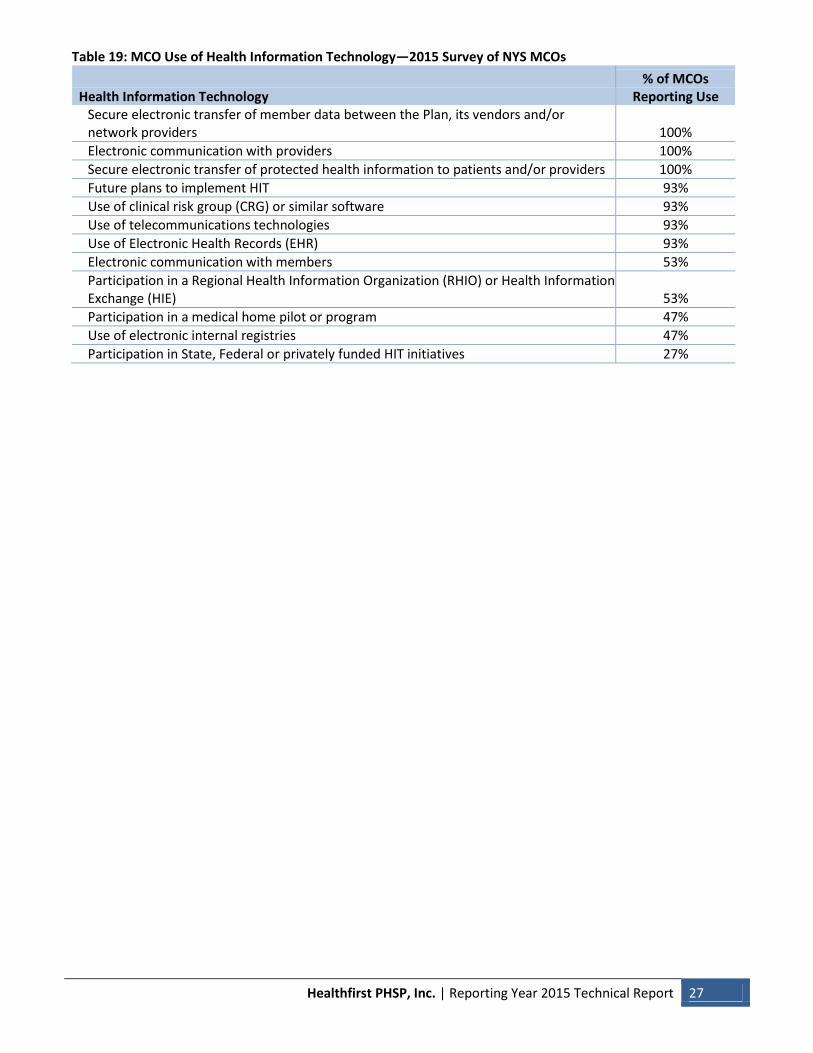
Table 19 displays the statewide results of the HIT survey. Of the fifteen MCOs who responded to the survey, 100% utilized secure electronic transfer of member data between the MCO, its vendors, and/or network providers. Additionally, 100% of MCOs utilized electronic communication with providers and secure electronic transfer of PHI to patients and/or providers. Some of the other forms of HIT utilized by the majority of MCOs (93%) include telecommunications technologies, Electronic Health Records (EHR), and use of clinical risk group (CRG) or similar software. In addition, 93% of MCOs reported future plans to implement HIT.
1 Regional Health Information Organizations/Health Information Exchanges are organizations that exist to enable
interoperable health information exchange through governance and collaboration with an overall mission to improve health care quality and safety, and reduce costs.
Healthfirst PHSP, Inc. | Reporting Year 2015 Technical Report 27
Table 19: MCO Use of Health Information Technology—2015 Survey of NYS MCOs
Health Information Technology % of MCOs
Reporting Use Secure electronic transfer of member data between the Plan, its vendors and/or network providers 100%
Electronic communication with providers 100%
Secure electronic transfer of protected health information to patients and/or providers 100%
Future plans to implement HIT 93%
Use of clinical risk group (CRG) or similar software 93%
Use of telecommunications technologies 93%
Use of Electronic Health Records (EHR) 93%
Electronic communication with members 53%
Participation in a Regional Health Information Organization (RHIO) or Health Information Exchange (HIE) 53%
Participation in a medical home pilot or program 47%
Use of electronic internal registries 47%
Participation in State, Federal or privately funded HIT initiatives 27%

Healthfirst PHSP, Inc. | Reporting Year 2015 Technical Report 28
Healthfirst has indicated that it performs the following HIT-related activities:
Secure electronic transfer of protected health information to patients and/or providers: Use of Intersystem’s Healthshare, secure encrypted email platform, and sFTP
Use of telecommunications technologies: Use of Interactive Voice Recording (IVR) and Text messaging
Use of Electronic Health Records (EHR): Healthfirst does not have its own EHR, but the HIE does allow capture of data shared from
provider EHRs in the standards-based HL7 formats
Use of clinical risk group (CRG) or similar software; Use of logistic regression-based predictive model to calculate the probability that a member will
experience one or more inpatient admission events in a year Third-party vendor performs predictive analytics for clinical risk stratification and member
utilization propensity
Secure electronic transfer of member data between the MCO, its vendors, and/or network providers: Via secure FTP site and QlikView platform
Electronic communication with providers: Via secure email, sFTP, and encrypted transactions
Electronic communication with members: Via secure email
Participation in a Regional Health Information Organization (RHIO) or Health Information Exchange (HIE):
HIE team is working with New York State and some RHIO partners to assist in the roadmap for interconnectivity
Participation in any State, Federal, or privately funded initiatives: Working collaboratively with the Office of Quality and Patient Safety to assist in the long-term
roadmap for connectivity, including SHIN-NY and its affiliated organizations
Future plans to implement HIT: HIE Implementation continues to proceed as one of the primary HIT initiatives

Healthfirst PHSP, Inc. | Reporting Year 2015 Technical Report 29
VII. Deficiencies and Appeals
COMPLIANCE WITH NYS STRUCTURE AND OPERATION STANDARDS This section of the report examines deficiencies identified by the NYSDOH in operational and focused surveys, as well as external appeals, as part of the EQRO’s evaluation of the MCO’s compliance with State structure and operation standards. Compliance with NYS Structure and Operation Standards To assess the compliance of an MCO with Article 44 of the Public Health Law and Part 98 of the New York Code of Rules and Regulations (NYCRR), the NYSDOH conducts a full monitoring review of the MCO’s compliance with structure and operation standards once every two years. These standards are reflected in the 14 categories in Table 21. ”Deficiencies” represent a failure to comply with these standards. Each deficiency can result in multiple “citations” to reflect each standard with which the MCO is not in compliance. The full monitoring review consists of an operational survey. The on-site component includes review of the following: policy and procedures, executed contracts and credentialing files of randomly selected providers, adverse determination utilization review files, complaints and grievances files, meeting minutes, and other documentation. Staff interviews are also conducted. These reviews are conducted using two standardized tools, the “Medicaid Managed Care Contract Surveillance Tool” and the “Review Tool and Protocol for MCO Operational Surveys”. The NYSDOH retains the option to deem compliance with standards for credentialing/ recredentialing, quality assurance/improvement, and medical record review. The Monitoring Review Report documents any data obtained and deficiencies cited in the survey tools. Any statements of deficiencies (SODs) are submitted to the MCO after the monitoring review, and the MCO is required to respond with a plan of corrective action (POC). POCs must be submitted to the NYSDOH for acceptance. In some cases, revisions may be necessary and MCOs are required to resubmit. Ultimately, all MCOs with SODs must have a POC that is accepted by the NYSDOH. During the alternate years when the full review is not conducted, the NYSDOH reviews any modified documentation and follows up with the MCO to ensure that all deficiencies or issues from the operational survey have been remedied. In addition to the full operational survey conducted every two years, the NYSDOH also conducts several focused reviews as part of the monitoring of structure and operation standards. The focused review types are summarized in Table 20. MCOs are also required to submit POCs in response to deficiencies identified in any of these reviews. Table 21 reflects the total number of citations for the most current operational survey of the MCO, which ended in 2015, as well as from the focused reviews conducted in 2015. This table reflects the findings from reviews of the MCO as a whole and deficiencies are not differentiated by product line. It is important to note that the number of deficiencies and the number of citations may differ, since each deficiency can have multiple citations. Healthfirst was in compliance with 12 of 14 categories. The categories in which Healthfirst was not in compliance were Organization and Management (1 citation) and Service Delivery Network (3 citations).

Healthfirst PHSP, Inc. | Reporting Year 2015 Technical Report 30
Table 20: Focused Review Types Review Name Review Description Access and Availability Provider telephone survey of all MMC plans performed
by the NYSDOH EQRO to examine appointment availability for routine and urgent visits; re-audits are performed when results are below 75%.
Complaints Investigations of complaints that result in an SOD being issued to the plan.
Contracts Citations reflecting non-compliance with requirements regarding the implementation, termination, or non-renewal of MCO provider and management agreements.
Disciplined/Sanctioned Providers Survey of HCS to ensure providers that have been identified as having their licenses revoked or surrendered, or otherwise sanctioned, are not listed as participating with the MCO.
MEDS (Medicaid Encounter Data Set) Citations reflecting non-compliance with requirements to report MCO encounter data to the Department of Health.
Member Services Phone Calls Telephone calls are placed to Member Services by AO staff to determine telephone accessibility and to ensure correct information is being provided to callers.
Other Used for issues that do not correspond with the available focused review types.
Provider Directory Information Provider directories are reviewed to ensure that they contain the required information.
Provider Information – Web Review of MCO’s web-based provider directory to assess accuracy and required content.
Provider Network Quarterly review of HCS network submissions for adequacy, accessibility, and correct listing of primary, specialty, and ancillary providers for enrolled population.
Provider Participation – Directory Telephone calls are made to a sample of providers included in the provider directory to determine if they are participating, if panels are open, and if they are taking new Medicaid patients. At times, this survey may be limited to one type of provider.
QARR (Quality Assurance Reporting Requirements) Citations reflecting non-compliance with requirements to submit MCO QARR data to the Department of Health.
Ratio of PCPs to Medicaid Clients Telephone calls are placed to PCPs with a panel size of 1,500 or more Medicaid clients. The calls are used to determine if appointment availability standards are met for routine, non-urgent “sick”, and urgent appointments.
AO: Area Office HCS: Health Commerce System SOD: Statement of Deficiency

Healthfirst PHSP, Inc. | Reporting Year 2015 Technical Report 31
Table 21: Summary of Citations
Category
Review Type/Name ( indicates
focused review) Citations Complaints and Grievances 0
Credentialing 0
Disclosure 0
Family Planning 0
HIV 0
Management Information Systems 0
Medicaid Contract 0
Medical Records 0
Member Services 0
Organization and Management 1 Provider participation issues remain unresolved for one provider previously identified as non-par during the 2013 Phase 2 Provider Directory Survey.
Provider Participation—
Directory
Prenatal Care 0
Quality Assurance 0
Service Delivery Network 3 Provider participation issues remain unresolved for one provider previously identified as non-par during the 2013 Phase 2 Provider Directory Survey.
Provider Participation—
Directory
The Plan failed to ensure that the physician information included in the printed provider directory was 75% accurate. Specifically, the information for 11 of 40 provider sampled from the printed Provider Directory was determined to be inaccurate. (2 citations)
Provider Participation—
Directory
Utilization Review 0 TOTAL 4

Healthfirst PHSP, Inc. | Reporting Year 2015 Technical Report 32
EXTERNAL APPEALS Table 22 displays external appeals for 2013 to 2015 for the Medicaid and CHP product lines. This table reflects absolute numbers, and is not weighted by MCO enrollment. Table 22: External Appeals—2013-2015
2013 2014 2015 Medicaid Overturned 21 37 71
Overturned in Part 3 5 4
Upheld 27 86 180
Medicaid Total 51 128 255 CHP Overturned 0 0 0
Overturned in Part 0 0 0
Upheld 0 0 0
CHP Total 0 0 0

Healthfirst PHSP, Inc. | Reporting Year 2015 Technical Report 33
VIII. Financial Data
The financial summary is based on data reported in each MCO’s 2014 and 2015 Medicaid Managed Care Operating Report (MMCOR). The data contained in the MMCOR reflect the MCO’s Medicaid line of business only. The data are not audited and are reported on an accrual basis; thus, total expenses are impacted by an MCO’s estimate of services that have been incurred by MCO members but have not been billed to the MCO. The following is a list of the ratios displayed in Table 23 and their definitions:
Assets to Net Worth: Reflects the relationship of assets to net worth. For example, an MCO with an asset to net worth ratio of 3.0 indicates the MCO has $3 of assets for every $1 of net worth. The formula is total assets divided by net worth. Assets and net worth are the net of intangible assets.
Premium Surplus Ratio: Indicates what percentage of premium dollars goes towards surplus. This ratio is calculated by dividing premium income by total premium revenue. It indicates whether an MCO is generating sufficient revenue from its premiums to cover medical and administrative expenses.
Medical Loss Ratio: Indicates what percentage of premium dollars is spent on medical costs. This ratio is calculated by dividing total medical costs by total premium revenue.
Administrative Ratio: Indicates what percentage of premium dollars is spent on administrative costs. This ratio is calculated by dividing total administrative costs by total premium revenue.
Current Ratio: Reflects to what degree current assets cover current liabilities. The formula is current assets divided by current liabilities.
Table 23: Selected Financial Ratios—2014-2015
2014 2015
Healthfirst SWA Healthfirst SWA Profitability Assets to Net Worth = (Total Assets-Intangibles)/ (Net Worth-Intangibles) 3.22 2.09 3.55 2.14
Premium Surplus Ratio = Premium Income/ Revenue Income 0.3% -12.3% 0.0% 0.0%
Medical Loss Ratio = Medical Expenses/ Premium Revenue 93.3% 101.5% 93.5% 90.6%
Administrative Ratio = Admin. Expenses/ Premium Revenue 0.9% 7.3% 7.7% 10.0% Liquidity Current Ratio = Current Assets/Current Liabilities 1.5 2.1 1.5 2.1

Healthfirst PHSP, Inc. | Reporting Year 2015 Technical Report 34
Figure 4a: Assets to Net Worth and Current Ratio
Figure 4b: Medical Loss Ratio and Administrative Ratio
0.0
0.5
1.0
1.5
2.0
2.5
3.0
3.5
4.0
2014 2015
Assets to NetWorth
Current Ratio
0%
10%
20%
30%
40%
50%
60%
70%
80%
90%
100%
2014 2015
Medical LossRatio
AdministrativeRatio

Healthfirst PHSP, Inc. | Reporting Year 2015 Technical Report 35
IX. Strengths and Opportunities for Improvement2
This section summarizes the accessibility, timeliness, and quality of services provided by the MCO to Medicaid and Child Health Plus recipients based on data presented in the previous sections of this report. The MCO’s strengths in each of these areas are noted, as well as opportunities for improvement. Recommendations for enhancing the quality of health care are also provided based on the opportunities for improvement noted. An assessment of the degree to which the MCO has effectively addressed the recommendations for quality improvement made by the NYS EQRO in the previous year’s EQR report is also included in this section. The MCO’s response to the previous year’s recommendations, wherein the MCO was given the opportunity to describe current and proposed interventions that address areas of concern, as well as an opportunity to explain areas that the MCO did not feel were within its ability to improve, is appended to this section of the report. Strengths
Healthfirst earned PQI, compliance, satisfaction, and quality points that qualified the MCO for the Tier 1 financial incentive award designation, the highest tier level.
In regard to compliance with NYS structure and operation standards, Healthfirst was fully compliant with Article 44.
The MCO reported rates above the statewide average for the HEDIS®/QARR Board Certification measure for Internal Medicine, Pediatricians, OB/GYN, Geriatricians, and Other Physician Specialists.
In regard to overall HEDIS®/QARR performance, the MCO demonstrated a strong performance, as evidenced by rates reported above the statewide average for at least three consecutive reporting years for the following measures: Follow-Up Care for Children Prescribed ADHD Medication—Continuation Phase, Follow-Up Care for Children Prescribed ADHD Medication—Initiation Phase, Adolescent Immunization—HPV, Follow-Up After Hospitalization for Mental Illness—30 Days, Follow-Up After Hospitalization for Mental Illness—7 Days, Use of Imaging Studies for Low Back Pain, Avoidance of Antibiotics Therapy in Adults with Acute Bronchitis, Chlamydia Screening (Ages 16-24), HIV—Syphilis Screening, HIV—Viral Load Monitoring, Breast Cancer Screening, Annual Monitoring for Patients on Persistent Medications—Combined Rate, Diabetes Monitoring for People with Diabetes and Schizophrenia, Diabetes Screen for People with Schizophrenia or Bipolar Disorder Using Antipsychotic Medications, Appropriate Treatment for Upper Respiratory Infection, Well-Child Visits—3 to 6 Year Olds, and Well-Care Visits for Adolescents. Additional measures for which the MCO reported above average rates include Adolescent Immunization—Combo, Antidepressant Medication Management—Acute Phase, Colon Cancer Screening, Diabetes Nephropathy Monitor, Diabetes HbA1c Test, Childhood Immunization Status (Combo 3), Pharmacotherapy Management for COPD—Bronchodilators, Spirometry Testing for COPD, and Well-Child Visits—First 15 Months.
The MCO reported above average rates for the Children and Adolescents’ Access to PCPs and Adults’ Access to Preventive/Ambulatory Services for the following age groups: 25 Months-6 Years, 7-11 Years, 12-19 Years, 20-44 Years, 45-64 years, and 65+ Years.
Opportunities for Improvement
The 2016 HEDIS® Final Audit Report indicated that the MCO was not fully compliant with the standard IS AD 1.0 Audit Documentation, as the MCO did not submit all required documentation in a timely manner.
2 This section of the report emphasizes the maintenance of current good practices and the development of additional
practices resulting in improved processes and outcomes, and thus refers to “Strengths” and “Opportunities for Improvement” rather than “Strengths” and “Weaknesses” as indicated in federal regulations.
Healthfirst PHSP, Inc. | Reporting Year 2015 Technical Report 36
The MCO demonstrates an opportunity for improvement in regard to overall HEDIS®/QARR performance. The MCO’s rates were below the statewide average for at least three consecutive reporting years for the measures Asthma Medication Ratio (Ages 5-18) and Annual Dental Visits (Ages 2-18). Additionally, the MCO’s rates were below the statewide average for the following measures: Asthma Medication Ratio (Ages 19-64), Medical Management for People with Asthma 50% of Days Covered (Ages 5-18), Appropriate Testing for Pharyngitis, and Children—Counseling for Physical Activity. (Note: Asthma Medication Ratio (Ages 19-64), Asthma Medication Ratio (Ages 5-18), Annual Dental Visits (Ages 2-18), and Appropriate Testing for Pharyngitis were opportunities for improvement in the previous year’s report.)
Despite being fully compliant with Article 44, the MCO demonstrates an opportunity for improvement. The MCO received four focused review citations related to Organization and Management and Service Delivery Network. (Note: compliance with NYS structure and operation standards was an opportunity for improvement in the previous year’s report.)
Recommendations
The MCO should continue with its quality improvement strategy and identify interventions that were successful for certain measures or populations and modify them to apply to the HEDIS®/QARR measures that continue to perform poorly. [Repeat recommendation.]
The MCO should re-evaluate its strategy aimed toward improving the accuracy of the information presented in the provider directories, and consider taking a more proactive approach to identify inaccuracies. [Repeat recommendation.]
Response to Previous Year’s Recommendations
2014 Recommendation: To ensure that members continue to receive appropriate care, and that the MCO continues to quality for a percentage of the available financial incentive, the MCO should continue with its overall quality improvement strategy. As the MCO reported below average rates for several asthma-related measures, the MCO should conduct thorough root cause analyses for each measure and implement initiatives that address identified barriers to care. [Repeat recommendation.] MCO Response: Healthfirst has conducted root cause analyses for the HEDIS® measures Asthma Medication Ratio (AMR) and Medication Management of Asthma (MMA) in response to the plan’s annual Quality Matrix. We discovered several provider and member barriers to care. Provider: Our providers are either not fully informed of the current best practices for asthma management and/or are not always adherent to the clinical guidelines. Some Primary care Providers (PCPs) have difficulty identifying their patients who do not comply with their long-term controller (LTC) medication regimen as prescribed and they are unaware of any gaps in care because they do not know their patients’ AMR or MMA performance. PCPs do not have the staff resources to outreach members to remind them to fill their long-term controller (LTC) prescriptions, nor do they have the bandwidth to call the pharmacies to verify that their patients are filling their prescriptions timely. To address the above-mentioned provider barriers, PCP adherence to the National Heart, Lung, & Blood Institute (NHLBI) Expert Panel Report 3: Guidelines for the Diagnosis and Management of Asthma: August 28, 2007 and the HEDIS® requirements, is being reinforced through asthma educator trainings that Healthfirst co-sponsors with the American Lung Association; newsletter publications; an asthma provider toolkit; and postings of clinical tools and resources on the Healthfirst website.

Healthfirst PHSP, Inc. | Reporting Year 2015 Technical Report 37
PCPs receive a list of their non-adherent members and their MMA rates on a monthly basis from Healthfirst Clinical Quality staff. Efforts are being initiated to have this data available to PCPs on an internet-accessible Healthfirst Quality APP. Clinical Quality staff routinely conduct face-to-face meetings with providers to review their performance and recommend actions for improvement. Healthfirst also has Outreach Coordinators located in several high-volume practices who conduct educational calls to members to remind them of the importance of medication adherence in managing their asthma and assist them with scheduling provider appointments. PCPs that meet a minimum membership requirement are eligible to earn a bonus payment through the Healthfirst Quality Incentive Program (HQIP) & Overall Quality Rating Incentive when their MMA rate meets or exceeds a targeted rate. Member: The root cause analyses revealed that member barriers to asthma care pertain to a lack of knowledge; poor compliance; and/or forgetfulness. Members do not understand the importance of taking long-term controller (LTC) asthma medications routinely in order to manage their chronic condition. They are not well-educated on the difference between LTC and rescue (“quick relief”) medications. They may sometimes forget to take their prescribed medications, discontinue them due to side effects, or stop taking them when they feel better. To address this gap in knowledge, Healthfirst has implemented multi-modal quality initiatives to provide asthma education and support self-management through the following reminder systems: live outreach calls by the Clinical Quality Member Outreach Team; Interactive Voice Response (IVR) calls; emails; and texts. Education on the importance of taking LTC medications routinely in maintaining health and well-being is provided during Care Management assessments and members are advised to speak to their providers about their asthma action plans. Self-management tools, including asthma action plans and educational resources, are being promoted at community events, in newsletters, and through Healthfirst website postings. In a more targeted approach, pediatric members residing in Harlem, the South Bronx, and Brooklyn (our communities with the highest prevalence of asthma) who are at high risk for a preventable hospitalization or emergency room visit are referred to Asthma Intervention Relief (A.I.R.) NYC by the Care Management team. This is an evidenced-based program that provides education, environmental assessments/mitigation, Integrated Pest Management (IPM), social support services, and care coordination in the member’s home. Last, Healthfirst has a reward program that encourages members to adhere to their prescribed asthma medication regimen. Members are eligible to receive a $10 incentive per quarter upon completing at least three fills of LTC medication every three months. A review of pharmacy data automatically generates a reward card to members that are adherent to their asthma medication regime.
2014 Recommendation: The MCO should continue to work to address the issues identified in the operational and focused review surveys. As many of the citations the MCO received related to member services and the provider directory, the MCO should focus its efforts on the accuracy of provider network data and member services requirements. [Repeat recommendation.] MCO Response: During the third quarter of 2015, Healthfirst implemented the Provider Demographic Data Quality Program. Under the oversight of the Provider Operations and Network Management
Healthfirst PHSP, Inc. | Reporting Year 2015 Technical Report 38
departments, this program seeks to improve network data quality and the accuracy through provider data scrubs, provider outreach campaigns, and proactive roster procurement. To facilitate continuous improvement, the Plan has contracted with a vendor that conducts a comparative analysis of our Provider Network to the information listed in our Provider Database on a bi-monthly basis (approximately every 60 days). Once this analysis is received, the Provider Operations and Network Management teams collaborate to validate all demographic changes and update individual provider information within our systems accordingly. This ensures the most accurate information is available in our online and printed directories. In addition, the Healthfirst Member Services Department continues with its mission to provide quality customer service and first call resolution for our members while maintaining compliance standards. Our Quality Assurance team currently performs weekly secret shopper calls and monthly reviews of approximately eight (8) calls for each Member Services Representative (MSR) to ensure the accuracy of information provided to our members. Each MSR’s performance is monitored, tracked, and relayed to our Member Services Management team for use during one-on-one coaching sessions and performance development. All Member Services representatives must also participate in quarterly refresher training sessions that incorporate questions from focused surveys to ensure departmental compliance with established policies and procedures.

Healthfirst PHSP, Inc. | Reporting Year 2015 Technical Report 39
X. Appendix
REFERENCES
A. Corporate Profile
Updated Corporate Profile information provided by the NYSDOH
NYSDOH OMC DataLink Reports
Managed Care Plan Directory
NCQA Accreditation website, http://hprc.ncqa.org/index.asp
B. Enrollment/Provider Network 1. Enrollment/Disenrollment
NYSDOH OMC Membership Data, 2013-2015
Enrollment by Age and Sex Report as of December 2015
Enrollment Status by Aid Category and County as of December 2015
Auto Assignment Data, 2013-2015
Auto Assignment Quality Algorithm Scores, 2013-2015
Enrollment Status Report, 2015 2. Provider Network
Providers Statewide by Specialty, Medicaid Managed Care in New York State Provider Network File Summary, December 2015
Total Number of FTEs by Managed Care Plans, December 31, 2015
NYSDOH OMC Primary Care Providers Open and Closed Panels by Plans, Provider Network Data as of December 31, 2015
QARR Measurement Year, 2013-2015
C. Utilization 1. Encounter Data
MMC Encounter Data System, 2013-2015 2. QARR Use of Services
QARR Measurement Year, 2013-2015
D. Quality Indicators 1. Summary of HEDIS® Information Systems AuditTM Findings
2016 Final Audit Report prepared by the MCO’s Certified HEDIS® Auditors 2. QARR Data
Performance Category Analysis, Quality Performance Matrix (2015 Measurement Year)
QARR Measurement Year, 2013-2015 3. CAHPS® 2015 Data
QARR Measurement Year, 2015 4. Quality/Satisfaction Points and Incentive
Quality/Satisfaction Points and Incentive, 2013-2015 5. Performance Improvement Project
2015-2016 PIP Report 6. Health Disparities
NYSDOH Health Disparities Survey, 2015

Healthfirst PHSP, Inc. | Reporting Year 2015 Technical Report 40
E. Health Information Technology
NYSDOH Health Information Technology Survey, 2015
F. Deficiencies and Appeals 1. Summary of Deficiencies
MMC Operational Deficiencies by Plan/Category, 2015
Focus Deficiencies by Plan/Survey Type/Category, 2015 2. Appeals
MMC External Appeals Data, 2015
G. Financial Data
Medicaid Managed Care Operations Report, 2015