
Munich Personal RePEc Archive - mpra.ub.uni-muenchen.de · paradox” (Keith et al.,2013;Sutanto et...
46
Munich Personal RePEc Archive An experimental method for the elicitation of implicit attitudes to privacy risk Alisa Frik and Alexia Gaudeul International Computer Science Institute, Georg-August-Universit¨ at G¨ ottingen 11 July 2018 Online at https://mpra.ub.uni-muenchen.de/87845/ MPRA Paper No. 87845, posted 15 July 2018 12:32 UTC
Transcript of Munich Personal RePEc Archive - mpra.ub.uni-muenchen.de · paradox” (Keith et al.,2013;Sutanto et...

MPRAMunich Personal RePEc Archive
An experimental method for theelicitation of implicit attitudes to privacyrisk
Alisa Frik and Alexia Gaudeul
International Computer Science Institute, Georg-August-UniversitatGottingen
11 July 2018
Online at https://mpra.ub.uni-muenchen.de/87845/MPRA Paper No. 87845, posted 15 July 2018 12:32 UTC
An experimental method for the elicitation of implicit
attitudes to privacy risk1
Alisa Frik2 and Alexia Gaudeul3
July 11, 2018
1The authors thank Marco Tecilla for technical assistance, as well as Alessandro Acquisti,Caterina Giannetti, Alex Imas, Luigi Mittone, Matteo Ploner, Michele Vescovi and other col-leagues and faculty members for valuable comments and feedback that helped us to improvethe manuscript. The study was carried out while Alisa Frik was doing her PhD at the Schoolof Social Sciences of the Universita degli Studi di Trento, in collaboration with SKIL JointOpen Lab (Trento, Italy). Funding for the doctoral scholarship of Alisa Frik was supported bya fellowship from TIM - Telecom Italia.
2International Computer Science Institute, 1948 Centre St. 600, Berkeley (CA), USA.Email: [email protected].
3Chair of Behavioral Development Economics, Faculty of Economic Sciences, Georg-August-Universitat Gottingen, Platz der Gottinger Sieben 5, 37073, Gottingen, Germany.Email: [email protected].

Abstract
We test an experimental method for the elicitation of implicit attitudes to privacy
risk. We ask individuals to decide whether to incur the risk of revealing private
information to other participants. This type of risk that involves a social component
corresponds to privacy threats that individuals may face in the field. We derive a
measure of individual attitudes to privacy risk with our method. We empirically test
the validity of this measure by running a laboratory experiment with 148 participants.
Our results confirm that the willingness to incur a privacy risk is driven by a complex
array of factors including risk attitudes, self-reported value for private information,
and general attitudes to privacy (derived from survey methods in our study). We also
observe that attitudes to privacy risk depend on the order in which measures of risk
attitude are elicited, but do not depend on whether there is a preexisting threat to
privacy, over which participants have no control. We explain how our method can be
simplified and extended for use in eliciting attitudes to a wide range of privacy risks
and various types of private information.
Keywords: privacy; attitudes; disclosure; risk; control; personal information; lab-
oratory experiment.
JEL Codes: C91, D81, O30.
1 Introduction
The widespread use of the Internet for a broad range of daily activities means that
privacy concerns are not only a personal issue. Privacy issues are now debated from
the economic, legislative, technological and policy perspectives. Further elaboration
of policies and solutions for the regulation, protection, exchange, and use of per-
sonal information raise a serious measurement challenge: what value does personal
information have, to whom, and under what conditions? While numerous empiri-
cal studies have attempted to measure the value of personal information (Grossklags
and Acquisti, 2007; Tsai et al., 2011; Beresford et al., 2012; Carrascal et al., 2013;
Motiwalla and Li, 2016; Benndorf and Normann, 2017), an important dimension of
privacy-related behavior - attitudes to privacy risk - has been largely understudied.
In our view, due to stochastic nature of the hazardous consequences of a privacy
breach, the decision to disclose personal information depends not only on the value
of information and on the context, but also on individual risk tolerance. In this pa-
per we make the first step towards closing this empirical and methodological gap in
the experimental privacy literature: we offer a conceptual framework for incentivized
implicit elicitation of attitudes to privacy risk. We validate our method in a labo-
ratory experiment with 148 participants. We then recommend further extension of
the method to cover a large variety of contexts and real-world scenarios that involve
privacy-related behavior.
In contrast to commonly used survey methods, we do not directly ask participants
to evaluate their risk attitudes. Instead, we offer participants the option to play incen-
tivized privacy lotteries that result in personal information disclosure with a certain
probability. Based on observed behavior, we infer their implicit risk preferences. We
validate our method by correlating the behavior of participants in a laboratory ex-
periment with a range of established measures of attitudes to privacy and to risk.
We find that the behavior of participants in our experiment is consistent with their
general attitude to risk, with their expressed level of concern with privacy, with the
amounts they are ready to pay to protect their information from disclosure, and with
the amounts they are willing to accept to disclose their information. We therefore
propose an index of attitudes to privacy risk as a robust and meaningful monetary
measure of the level of tolerance for risks to privacy. This measures how much peo-
ple are ready to pay to protect themselves from privacy threats. Finally, we discuss
why our method is a good guide for policy-makers when asked to judge the level of
concern with different types of privacy risks within the population.
2 Motivation
At present, two popular approaches to investigate individual privacy attitudes are
surveys and experiments. Surveys involve questionnaires asking respondents about
their attitudes, for example how they would respond to hypothetical scenarios that
1

involve privacy concerns (e.g., Westin’s Privacy Index (Westin, 1968), Internet Users’
Information Privacy Concerns (Malhotra et al., 2004)). Other surveys directly ask
participants for their willingness to accept (WTA) payment for revealing, or their will-
ingness to pay (WTP) to avoid revealing private information to others. Experiments
differ from surveys in that they indirectly elicit participants’ privacy preferences based
on their behaviors. For example, they offer them a choice between more and less
privacy-friendly options, such as purchasing a product from a website that requests
more or less personal information (Gideon et al., 2006; Tsai et al., 2011; Beresford
et al., 2012; Egelman et al., 2013). They may also be asked to disclose personal in-
formation in exchange for discounts or rewards (Huberman et al., 2005; Grossklags
and Acquisti, 2007; Hann et al., 2007; Acquisti et al., 2013; Benndorf and Normann,
2017). Elicited values for privacy vary a lot across individuals and studies, depend-
ing on the type of information being traded and on the context (Hann et al., 2007;
Carrascal et al., 2013; Schreiner and Hess, 2013; Motiwalla and Li, 2016).
In our study, we use an experimental approach rather than a survey for two main
reasons. First, Acquisti et al. (2016) note that stated preferences often differ from
observed behavior: people claim to care about privacy (Turow et al., 2015; Madden
and Rainie, 2015) but they disclose personal information relatively freely (Norberg
et al., 2007). A number of studies have provided evidence of this so called “privacy
paradox” (Keith et al., 2013; Sutanto et al., 2013; Taddicken, 2014). The explana-
tion of this phenomenon may partly lie in the use of imperfect methods for eliciting
privacy attitudes and valuations, which as a result do not correspond to behaviors.
Therefore, preferences derived from observed choices, even in the relatively artificial
context of a laboratory experiment, may be better predictors of actual behavior than
general self-reported attitudes to possibly more realistic but hypothetical scenarios.
Second, direct measurements of attitudes to privacy, for example asking for WTA
and WTP, force people to consciously choose answers to them. This may not be reli-
able because people may find it difficult to accurately and explicitly assess risks and
losses associated with privacy. Indeed, Wilson and Brekke (1994) claim that explicit
measurements suffer from limits in the ability of people to retrieve, translate and
report their attitudes. Sometimes such attitudes are not accessible to introspection.
In addition, participants are more inclined towards expressing extreme values when
asked explicitly for their valuation for privacy than when those valuations are elicited
indirectly (Schwarz, 1999). Due to the emotional component of privacy decisions,
participants are more prone to provide biased or irrational responses to high-risk sit-
uations when asked directly (Braunstein et al., 2011). The superior performance of
indirect methods over direct surveys in measuring privacy concerns was supported
in a number of studies (Graeff and Harmon, 2002; Lewis et al., 2008; Preibusch,
2013). In our experiment, we ask people to choose how much money they require
as compensation for being exposed to some probability that they will have to reveal
their private information to others. We therefore we avoid forcing people into the very
difficult task of making explicit calculations of the value of their private information
2

to them.
Moreover, with our approach we seek to avoid several weaknesses of the currently
established methods for assessing the value of privacy. First, when decisions are not
incentivized, such as in surveys, participants do not face the hard economic question
of how to balance monetary rewards and their personal preferences. When people
consider privacy outcomes in isolation from actual economic tradeoffs, they may over-
estimate the weight of privacy concerns, without considering the monetary payment
for personal information disclosure. Therefore, our method offers both monetary and
behavioral incentive (i.e. the decisions entails balancing monetary gains and privacy
loss). Second, privacy scenarios in existing studies present participants with a well
defined, immediate and certain threat to – or guaranteed protection from – revealing
private information. In real life scenarios however, people rather have to decide how
much to invest to protect their information from a non-specific threat that may or
may not be realized in the future and that has uncertain consequences. This means
that many if not most privacy decisions are taken in a context of risk, not certainty.
Therefore, when preferences are elicited in a context of threat certainty, rather than
spelling out the probability of realization of this threat, then behavior that is observed
may not translate to behavior in risky situation, as it does not take into account peo-
ple’s level of risk tolerance for privacy risk. For example, someone may assign a high
value to protecting their privacy from a sure threat, but have a high tolerance for
privacy risk, so that they may not be ready to invest that much to reduce the proba-
bility of that threat. Thus, in order to control for attitude to privacy risk, we spell out
the probability of disclosure in our study. We believe that the behavior of people who
are confronted with the risk of a loss of privacy is a more nuanced predictor of their
behavior than their attitudes about certain privacy outcomes.
The above mentioned reasons lead us to propose using an implicit measure to
provide an assessment of privacy attitudes without requiring intentional deliberate
processing and awareness about the relation between the response to the privacy
threat and the mental representation of this threat (Nosek and Greenwald, 2009). We
thereby avoid limitations that are typical of self-reported estimations, such as their
lack of relation with actual behavior (Nosek et al., 2011). Moreover, our method for
measuring privacy risk attitude meets all four criteria that privacy valuations should
comply with according to Hirschprung et al. (2016), namely our metric is explicitly
numeric and in monetary measurable units (Euros, USD, or any other currency),
reliable, applicable to common transactions, and reflects individual preferences. This
paper presents our method and tests our measure.
3 Synthetic generation of a privacy concern
We collected personal information from our participants by combining standard pri-
vacy items (name, photo) and opinions on a range of sensitive topics. This information
remained unknown to other participants in the room unless the outcome of the exper-
3

iment was such that the participant had to reveal it at the very end of the experiment.
When making decisions, participants knew the probability of this disclosure.
As standard privacy items, we used name, surname, and photo of each partici-
pant, which we took after signature of consent forms after arrival in the laboratory.
Combined together, those pieces of data can be classified as personally identifiable
information (McCallister, 2010). We merge this information with a synthetically gen-
erated source of private information, by asking participant to answer a questionnaire
about their opinion on potentially sensitive or socially relevant topics, such as abor-
tion, illegal immigration, and appropriate methods of birth contraception (appendix
C.1). We are not concerned about the truthfulness of the answers, because there is
no right or wrong answer in such a survey. We chose questions for which no clear
majority opinion was likely to emerge, so as to discourage participants from choosing
to answer in conformity with what they see as the norm. Because opinions always
differed within the population for these questions, even a participant who does not
report a truthful answer will see some of his expressed opinions contradict the opin-
ions of some other people. In other words, the potential conflict of opinions does
not depend on whether one’s expressed opinion corresponds to one’s truthfully heldopinion. Therefore, no matter whether the participant answers truthfully or not, the
risk of public revelation of the opinions together with name, surname and photo is
expected to cause concerns related to the information disclosure. This concern is
therefore related to the fear of being shunned by some other people, which occurs if
a participant expresses opinions contradict theirs (see Noelle-Neumann, 1974; Kim,
1999; Clemente and Roulet, 2015) and is relevant in many situations involving face-
to-face conversations with others or discussions in online social networks.
Statistics on the answers to the preliminary questionnaire are shown in appendix
C.1. Intraclass correlation coefficient among answers on preliminary questionnaire
equals 0.56, proving that a large proportion of participants expressed opinions that
differed from others. In other words, opinions of our participants for most of the
sensitive questions were split almost equally, meaning that there was no universal
truth or socially preferable norm in the group, and therefore regardless of expressed
belief, once revealed, about half of the participants in the laboratory would disagreed
with it. This is the core mechanism of our method to elicit concern.
There are a few other experimental studies that synthetically produce personal
information for the purpose of investigating privacy attitudes. Rivenbark (2012) used
a public good game to endogenously generate valuable private information for further
elicitation of values and beliefs. Grossklags and Acquisti (2007) used quiz perfor-
mance to estimate willingness to sell or protect personal information. Feri et al.
(2016) created sensitive information via a logic test score, which results in a division
of participants into “bad” and “good” types, connected to the real name of the par-
ticipant. Such methods suffer from an overconfidence bias (Griffin and Varey, 1996;
Wallsten, 1996), which is difficult to control for, whereby people have a tendency to
believe that they belong to a group with a test score above median.
4

Our novel method of synthetic elicitation of personal information overcomes the
disadvantages of using intelligence test scores, and by covering multiple contexts,
increases the probability to capture an issue that is sensitive for an individual. Our
method induces a privacy concern without falling into issues with truth-telling. While
eliciting information that is sensitive in the laboratory context, the personal informa-
tion we obtained cannot be misused to damage the participants materially, which
helps overcome legal constraints in the collection, storage, and use of personal infor-
mation.
4 The elicitation of attitude to privacy risk
After collecting personal data we generated privacy concern by putting private infor-
mation under the risk of disclosure to other participants. Specifically, we elicited risk
attitude by asking participants to make choices between gambles in a variation of the
multiple price list (MPL) design that is commonly used to elicit preferences in exper-
imental economics. MPLs are easy to understand for participants and are incentive
compatible (Miller et al., 1969; Holt and Laury, 2002; Harrison and Rutstrom, 2008;
Andersen et al., 2006). Participants were offered 8 lists (See tables 1 to 8 in appendix
C.3), each requiring 11 decisions between safe options and risky lotteries. Payoffs
were expressed in Experimental Currency Units (ECU), with 1 ECU = 0.1 Euro. There
were two types of lotteries: monetary lotteries that involved only monetary outcomes,
which participant would receive with a certain probability, and privacy lotteries that
in addition to monetary reward involved a certain known risk of personal information
revelation to other experimental participants. Fig. 1 provides an example of MPL list
in privacy task.
5

Figure 1: Screenshot of one of the MPL menus in the privacy task
Subjects were asked to indicate the option they preferred to play for every row.
The order of MPL menus, within each task, was randomized across participants.
In each row, participants had to choose between a safe payoff x and a lottery L.
Lottery L offered monetary payoff y, but this amount is reduced by c with probability
1 − p (in monetary lotteries), or accompanied by individual’s personal information
disclosure t with probability 1− p (in privacy lotteries).1 Values of x, y, and p were the
same in monetary and privacy tasks.
We kept the probability of loss fixed at 30%2 and not lower in order to avoid the
issue of probability weighting, whereby low probabilities are over-weighted (Tversky
and Kahneman, 1992). We chose to vary the safe payoff across rows rather than prob-
abilities of a loss because comparisons of monetary payoffs is easier for participants
than comparisons of event probabilities.
1We varied c across monetary lotteries to be able to condition our measure of a participant’s riskaversion to the level of loss he is facing. This is because we do not know in advance what value a partic-ipant attaches to privacy, and we therefore need to consider risk aversion for a range of possible values.c took a negative value in one of the tables, to consider how participants respond to the probability of again.
2We also chose 30%, because 50% probability of personal information disclosure is unrealisticallyhigh for privacy risk domain. Same level of risk was used in the experimental study in Maier and Ruger(2010); Hirschprung et al. (2016).
6

4.1 Measure of financial risk attitudes
For our measurements of financial risk attitude, we calculate the rate of return(“ror”) required by each participant to take the lottery. If a participant is indifferent
between safe payoff xkj and expected value of the monetary lottery Lk = (y, p; y−c, 1−p)in row j ∈ [1, 11] of table k ∈ [1, 4], then xkj ·(1+rorkj) = yk ·p+(yk−ck) ·(1−p). Therefore,
to take lottery he requires a rate of return ror of:
rorkj =yk · p+ (yk − ck) · (1− p)− xkj
xkj. (1)
We first compute rorkj for each row of each table in monetary task. Then we iden-
tify the indifference point by looking at which row participant i switches from safe
to risky option, and use the midpoint of the relevant interval of rorik as a measure-
ment of his financial risk attitude. Adopting the idea that back-and-forth switching
behavior could be the result of indifference, we use the mean value between the lower
bound of the first switch and the upper bound of the last switch in MPL table for our
estimate of rorik in cases where participants switched more than once (see Andersen
et al., 2006; Harrison et al., 2012; Charness et al., 2013). We also compute rori, the
average individual ror across all MPL tables in monetary task.
Tab. 1 shows that with our MPL menus in monetary task, we are able to obtain
an estimate of the risk premium even for very high or low values of ror.
Table 1: Interval estimation of financial risk attitude (ror) across MPL tables.
MPL table, Range of safe Lottery option, Elicitation intervalk outcomes (in ECU), x L = (y, p; y − c, 1− p) for ror
1 46 - 56 Get 55, but Pr=.3 to lose 10 −7% < ror < 13%2 38 - 68 Get 65, but Pr=.3 to lose 30 −18% < ror < 47%3 30 - 80 Get 75, but Pr=.3 to lose 50 −25% < ror < 100%4 35 - 65 Get 30, but Pr=.3 to gain 30 −32% < ror < 26%
If a participant never switched in a table then we consider the level of rorik to
be unobserved. If a participant never chose to play a lottery in any table for any
value of the safe alternative then we consider this participant to have ror > 100%. If
a participant always chose the lottery rather than any safe option then we consider
this participant to have ror < −32%.
While we use this measure of risk attitude for monetary payoffs, none of our
later results depend on this; indeed, we consider also other measures including the
number of safe choices made (option A in tables), and parametric measures such as
r in a CRRA utility function and α in a CARA utility function.
4.2 Measure of privacy risk attitudes
We measure attitude to privacy risk (“APR”) as the monetary equivalent of the risk of
personal information disclosure for a risk neutral participant. Closest to our measure
7
of APR is the notion in Hirschprung et al. (2016), which defines the value of privacy
as “the value of the benefits at the equilibrium point, when an individual is indiffer-
ent to the information disclosure”. Our measure of APR is therefore an indicator of
participant combined attitudes to both risk and personal information disclosure.
If a risk neutral participant is indifferent between safe payoff xkj and expected
value of the privacy lottery Lk = (y, p; y −APR, 1− p) in row j ∈ [1, 11] of table k ∈ [5, 8],
then it must be that xkj = yk · p + (yk − APRkj) · (1 − p) . The APR is therefore an
implicit monetary measure of the (dis)utility of privacy risk for a participant who is
risk neutral.
APRkj =yk − xkj1− p
(2)
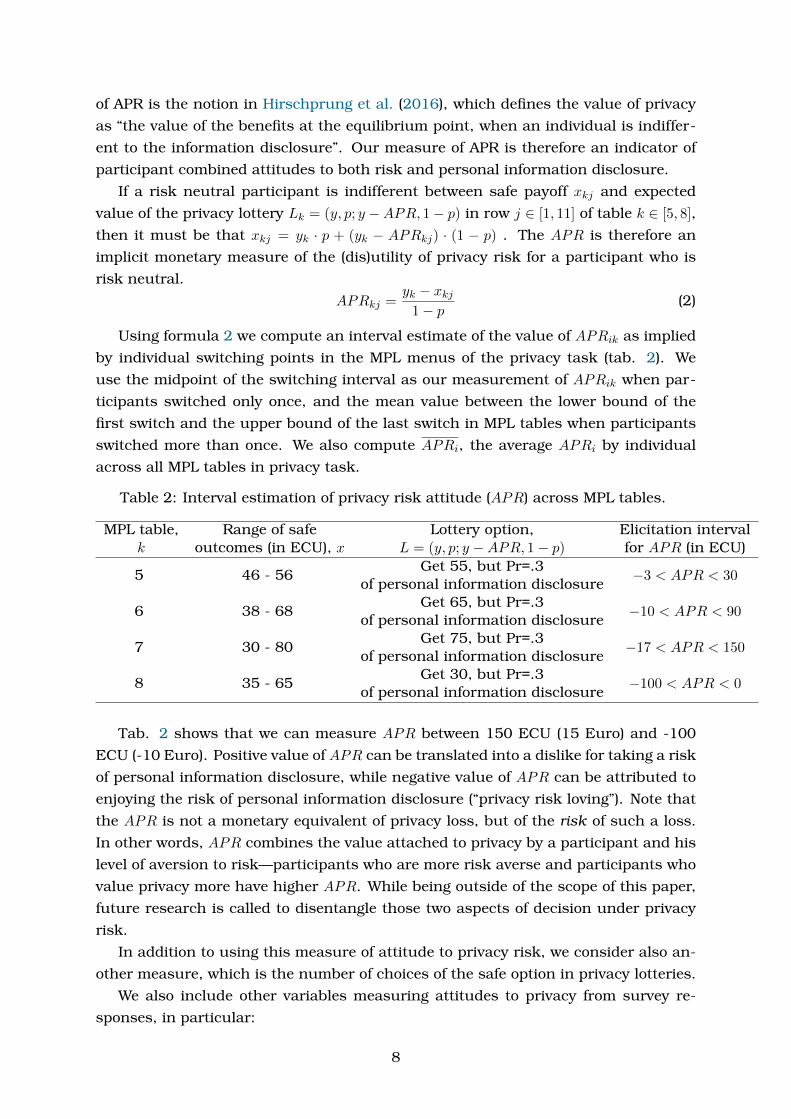
Using formula 2 we compute an interval estimate of the value of APRik as implied
by individual switching points in the MPL menus of the privacy task (tab. 2). We
use the midpoint of the switching interval as our measurement of APRik when par-
ticipants switched only once, and the mean value between the lower bound of the
first switch and the upper bound of the last switch in MPL tables when participants
switched more than once. We also compute APRi, the average APRi by individual
across all MPL tables in privacy task.
Table 2: Interval estimation of privacy risk attitude (APR) across MPL tables.
MPL table, Range of safe Lottery option, Elicitation intervalk outcomes (in ECU), x L = (y, p; y −APR, 1− p) for APR (in ECU)
5 46 - 56Get 55, but Pr=.3 −3 < APR < 30
of personal information disclosure
6 38 - 68Get 65, but Pr=.3 −10 < APR < 90
of personal information disclosure
7 30 - 80Get 75, but Pr=.3 −17 < APR < 150
of personal information disclosure
8 35 - 65Get 30, but Pr=.3 −100 < APR < 0
of personal information disclosure
Tab. 2 shows that we can measure APR between 150 ECU (15 Euro) and -100
ECU (-10 Euro). Positive value of APR can be translated into a dislike for taking a risk
of personal information disclosure, while negative value of APR can be attributed to
enjoying the risk of personal information disclosure (“privacy risk loving”). Note that
the APR is not a monetary equivalent of privacy loss, but of the risk of such a loss.
In other words, APR combines the value attached to privacy by a participant and his
level of aversion to risk—participants who are more risk averse and participants who
value privacy more have higher APR. While being outside of the scope of this paper,
future research is called to disentangle those two aspects of decision under privacy
risk.
In addition to using this measure of attitude to privacy risk, we consider also an-
other measure, which is the number of choices of the safe option in privacy lotteries.
We also include other variables measuring attitudes to privacy from survey re-
sponses, in particular:
8
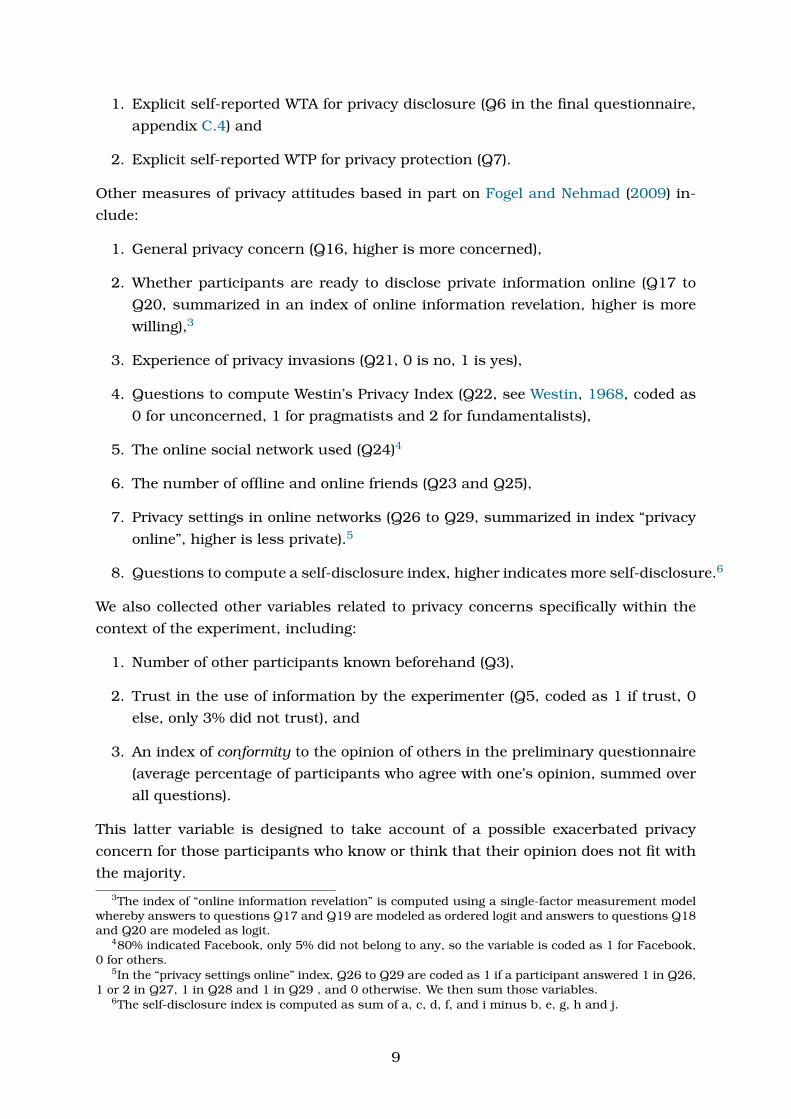
1. Explicit self-reported WTA for privacy disclosure (Q6 in the final questionnaire,
appendix C.4) and
2. Explicit self-reported WTP for privacy protection (Q7).
Other measures of privacy attitudes based in part on Fogel and Nehmad (2009) in-
clude:
1. General privacy concern (Q16, higher is more concerned),
2. Whether participants are ready to disclose private information online (Q17 to
Q20, summarized in an index of online information revelation, higher is more
willing),3
3. Experience of privacy invasions (Q21, 0 is no, 1 is yes),
4. Questions to compute Westin’s Privacy Index (Q22, see Westin, 1968, coded as
0 for unconcerned, 1 for pragmatists and 2 for fundamentalists),
5. The online social network used (Q24)4
6. The number of offline and online friends (Q23 and Q25),
7. Privacy settings in online networks (Q26 to Q29, summarized in index “privacy
online”, higher is less private).5
8. Questions to compute a self-disclosure index, higher indicates more self-disclosure.6
We also collected other variables related to privacy concerns specifically within the
context of the experiment, including:
1. Number of other participants known beforehand (Q3),
2. Trust in the use of information by the experimenter (Q5, coded as 1 if trust, 0
else, only 3% did not trust), and
3. An index of conformity to the opinion of others in the preliminary questionnaire
(average percentage of participants who agree with one’s opinion, summed over
all questions).
This latter variable is designed to take account of a possible exacerbated privacy
concern for those participants who know or think that their opinion does not fit with
the majority.
3The index of “online information revelation” is computed using a single-factor measurement modelwhereby answers to questions Q17 and Q19 are modeled as ordered logit and answers to questions Q18and Q20 are modeled as logit.
480% indicated Facebook, only 5% did not belong to any, so the variable is coded as 1 for Facebook,0 for others.
5In the “privacy settings online” index, Q26 to Q29 are coded as 1 if a participant answered 1 in Q26,1 or 2 in Q27, 1 in Q28 and 1 in Q29 , and 0 otherwise. We then sum those variables.
6The self-disclosure index is computed as sum of a, c, d, f, and i minus b, e, g, h and j.
9
We also take into account socio-demographic indicators including gender, age,
field of study, level of education, nationality, parents’ education, size of the locality
(city, town, village, etc.) and revenue(Monthly spend) (Q8 to Q15).
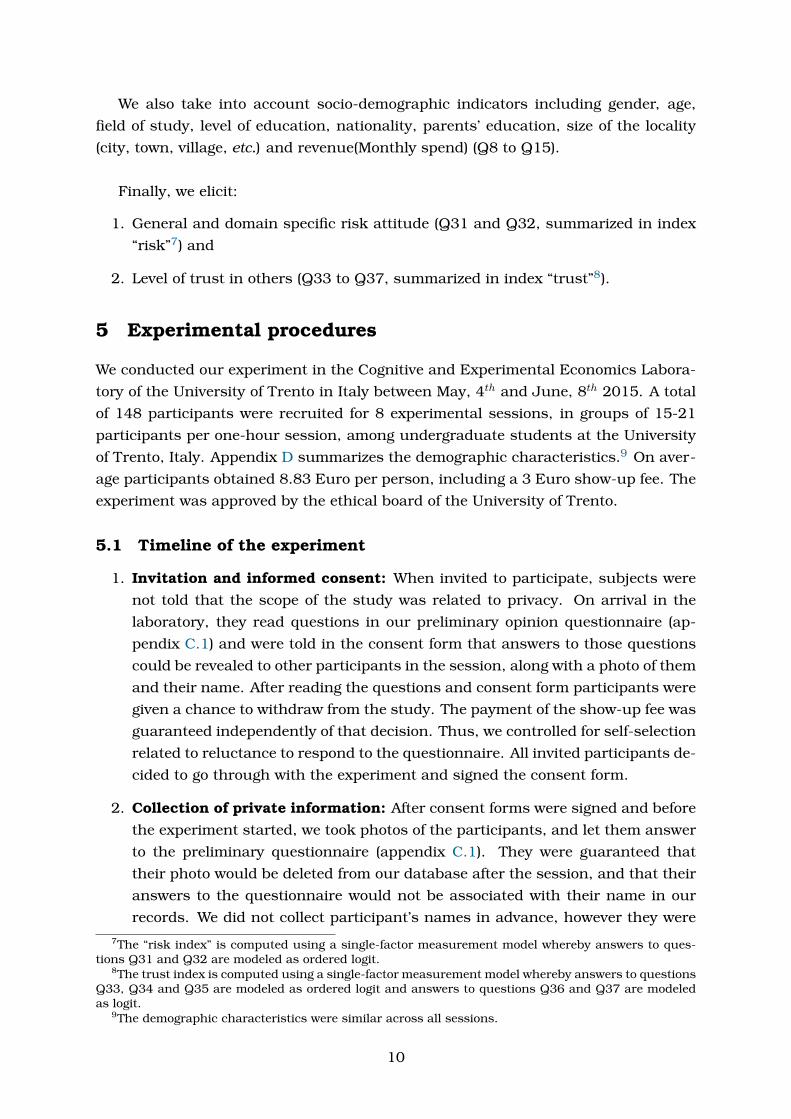
Finally, we elicit:
1. General and domain specific risk attitude (Q31 and Q32, summarized in index
“risk”7) and
2. Level of trust in others (Q33 to Q37, summarized in index “trust”8).
5 Experimental procedures
We conducted our experiment in the Cognitive and Experimental Economics Labora-
tory of the University of Trento in Italy between May, 4th and June, 8th 2015. A total
of 148 participants were recruited for 8 experimental sessions, in groups of 15-21
participants per one-hour session, among undergraduate students at the University
of Trento, Italy. Appendix D summarizes the demographic characteristics.9 On aver-
age participants obtained 8.83 Euro per person, including a 3 Euro show-up fee. The
experiment was approved by the ethical board of the University of Trento.
5.1 Timeline of the experiment
1. Invitation and informed consent: When invited to participate, subjects were
not told that the scope of the study was related to privacy. On arrival in the
laboratory, they read questions in our preliminary opinion questionnaire (ap-
pendix C.1) and were told in the consent form that answers to those questions
could be revealed to other participants in the session, along with a photo of them
and their name. After reading the questions and consent form participants were
given a chance to withdraw from the study. The payment of the show-up fee was
guaranteed independently of that decision. Thus, we controlled for self-selection
related to reluctance to respond to the questionnaire. All invited participants de-
cided to go through with the experiment and signed the consent form.
2. Collection of private information: After consent forms were signed and before
the experiment started, we took photos of the participants, and let them answer
to the preliminary questionnaire (appendix C.1). They were guaranteed that
their photo would be deleted from our database after the session, and that their
answers to the questionnaire would not be associated with their name in our
records. We did not collect participant’s names in advance, however they were7The “risk index” is computed using a single-factor measurement model whereby answers to ques-
tions Q31 and Q32 are modeled as ordered logit.8The trust index is computed using a single-factor measurement model whereby answers to questions
Q33, Q34 and Q35 are modeled as ordered logit and answers to questions Q36 and Q37 are modeledas logit.
9The demographic characteristics were similar across all sessions.
10

told that if according to the outcome of the experiment their data was to be
disclosed to others, they would be required to demonstrate to the experimenter
their photo ID, and their name would be revealed to other participants in the
session along with the picture and questionnaire answers.
3. Distribution of envelopes: To improve the clarity of decision consequences, we
employed the prior incentive system (PRINCE) (Johnson et al., 2015). Instead
of picking one of the decisions from MPL tables for payment only at the end of
the experiment, the PRINCE system involves distributing closed envelopes with
a description of the real choice situation (particular row from an MPL table) that
would determine an individual’s payoff before the experiment starts.10 Partic-
ipants thus picked at random an envelope before entering the laboratory and
taking a randomly assigned seat.
4. Decisions in privacy and monetary lotteries: Then, participants read the in-
structions for the main part of the experiment (appendix C.2). Before proceeding
to making choices in privacy and monetary lotteries, participants had to answer
correctly the control questions designed to ensure comprehension of the experi-
mental procedures, tasks, and incentive scheme. Then they were asked to make
a sequence of binary choices between safe and risky options in two types of
lotteries: monetary lotteries that imply changes in monetary outcome; and pri-vacy lotteries that imply the disclosure of personal information (appendix C.3).
Participants either played monetary lotteries first, or privacy lotteries first.
5. Final questionnaire: Finally, participants answered a final questionnaire about
the experiment, basic demographic information, attitudes towards privacy, risk,
self-disclosure, fairness, trust, and WTA and WTP for their personal information
(appendix C.4).
6. Outcome and payment: At the end of each session participants came one-by-
one to the experimenter’s table and opened their envelopes. The decision of the
participant that was made in the situation described in the envelope was im-
plemented. A dice roll decided the outcome if the participant chose to play the
lottery in that situation. If the result was that personal information had to be
disclosed to other participants, then the participant stood in front of the audi-
ence in the lab, the experimenter verified his name and surname from the ID
card, and then announced it aloud. Other participants saw on the screen the
10Decision-makers find it easier to condition on the events determined in the past rather than inthe future (see Keren, 1991; Shafir and Tversky, 1992; Cubitt et al., 1998; Hey and Lee, 2005; Bardsleyet al., 2010). This system makes it more obvious to the participants that any situation might be relevantfor them, and which decision is relevant depends on the chance that has already realized at the momentthey picked an envelope. Therefore, participants have to consider each decision they make as potentiallypayoff-relevant. Johnson et al. (2015) claims that PRINCE system improves participants’ understandingthat the payoff-relevant decision is chosen at random, and gives them better reassurance that this istrue randomization, i.e. that the experimenter does not deceive them. This also makes isolation of eachdecision “maximally salient” (p. 3) and makes the issue of hedging across decisions (Holt, 1986) lessimportant.
11
picture of the participant and the answers that this participant gave in the pre-
liminary questionnaire. To emphasize differences in opinions, we presented the
answers to the preliminary questionnaire in terms of the fraction of participants
who answered in a different way, e.g., “John Smith agrees that it is morally jus-
tified to abort after discovering serious disability in the fetus, while 53% of other
participants do not agree”.
We now proceed to the description and analysis of the experimental results.
6 Results
In total our data set is made of 88 binary choices made by each of 148 individuals.
There were 70 participants in the privacy lotteries first condition group, and 78 partic-
ipants in the monetary lotteries first condition group. In 95.86% of cases participants
switched from the safe to the risky option in the MPLs only once, demonstrating
consistent monotonic preferences.11
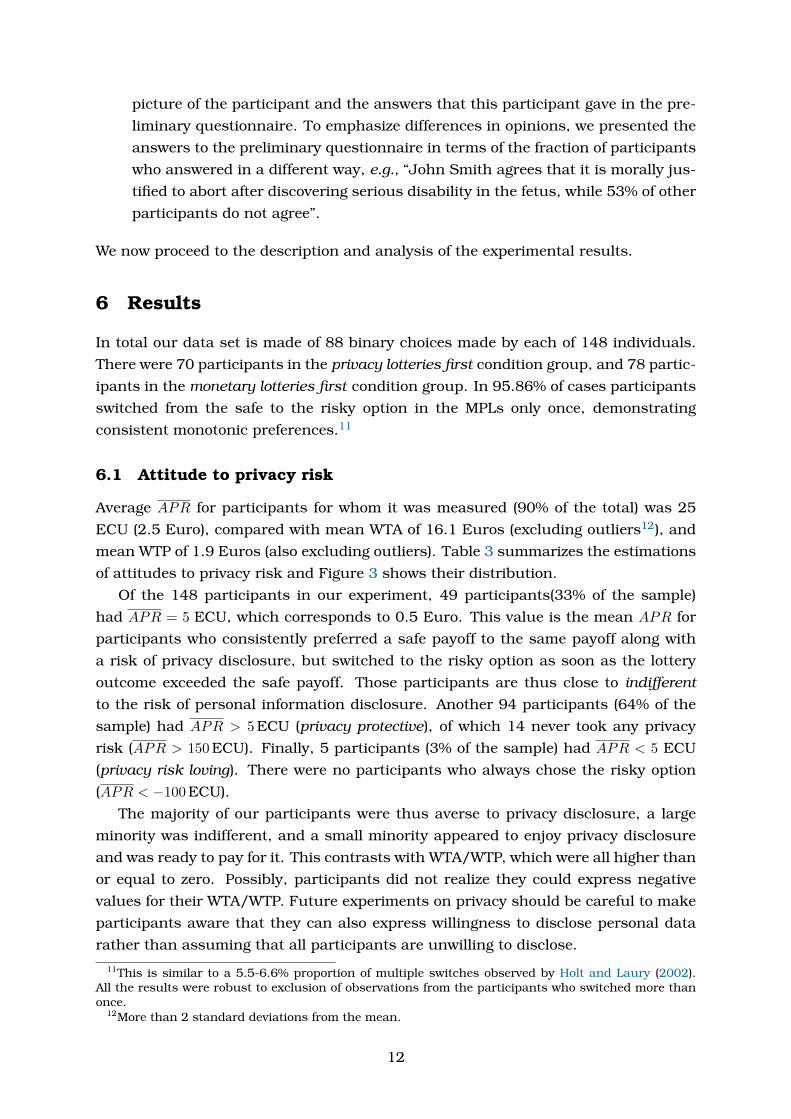
6.1 Attitude to privacy risk
Average APR for participants for whom it was measured (90% of the total) was 25
ECU (2.5 Euro), compared with mean WTA of 16.1 Euros (excluding outliers12), and
mean WTP of 1.9 Euros (also excluding outliers). Table 3 summarizes the estimations
of attitudes to privacy risk and Figure 3 shows their distribution.
Of the 148 participants in our experiment, 49 participants(33% of the sample)
had APR = 5 ECU, which corresponds to 0.5 Euro. This value is the mean APR for
participants who consistently preferred a safe payoff to the same payoff along with
a risk of privacy disclosure, but switched to the risky option as soon as the lottery
outcome exceeded the safe payoff. Those participants are thus close to indifferentto the risk of personal information disclosure. Another 94 participants (64% of the
sample) had APR > 5ECU (privacy protective), of which 14 never took any privacy
risk (APR > 150ECU). Finally, 5 participants (3% of the sample) had APR < 5 ECU
(privacy risk loving). There were no participants who always chose the risky option
(APR < −100ECU).
The majority of our participants were thus averse to privacy disclosure, a large
minority was indifferent, and a small minority appeared to enjoy privacy disclosure
and was ready to pay for it. This contrasts with WTA/WTP, which were all higher than
or equal to zero. Possibly, participants did not realize they could express negative
values for their WTA/WTP. Future experiments on privacy should be careful to make
participants aware that they can also express willingness to disclose personal data
rather than assuming that all participants are unwilling to disclose.
11This is similar to a 5.5-6.6% proportion of multiple switches observed by Holt and Laury (2002).All the results were robust to exclusion of observations from the participants who switched more thanonce.
12More than 2 standard deviations from the mean.
12

With the exception of a few people, most of our participants were not comfortable
with personal information disclosure, and they chose safe options in privacy lotteries
at least some of the time, demonstrating the presence of privacy concerns.
While the majority of people did tend to protect private information from disclo-
sure, some appeared to want to make their personal information and opinions public.
This may reflect differences in goals, attitudes, personality traits and other factors
(see Zywica and Danowski, 2008; Krasnova et al., 2009; Ross et al., 2009; Correa
et al., 2010). This minority tendency to disclose is consistent with the use of so-
cial technologies, such as online social networks, blogs, etc., and could be especially
prevalent for the active users of such technologies, extensively present in the popu-
lation of students, and, consequently, in our sample.13
6.2 The drivers of attitudes to privacy risk
We test the drivers of attitudes to privacy risk by specifying two models for regres-
sion analysis. The first model relates APR and ror while taking into account right-
censoring of the dependent variable:
APRi = β0 + β1 · rori + β2 · Orderi + ... + εik (3)
where APRi is average APR for individual i across tables k ∈ [5, 8], except if the
individual never switched in any table, in which case we have APRi > 150 ECU. roriis average ror for participant i from his choices in tables k ∈ [1, 4]. 14 Orderk takes
value 0 if monetary task appeared before privacy task, 1 otherwise.
We test the robustness of our results by running a second regression model, where
we input the number of safe choices made in privacy task as the dependent variable,
and the average number of safe choices made in monetary task, instead of rori, as an
independent variable. This second model specification therefore takes the following
form:
safe privacyik = β0 + β1 · safe monetaryik + β2 · Orderi + β3 · Tablek + ... + εik (4)
whereby safe privacyik is the number of safe choices made by individual i in pri-
vacy MPL tables k ∈ [5, 8] and safe monetaryik is the average number of safe choices
made by individual i in monetary MPL tables k ∈ [1, 4] (see Appendix C.3). Orderk
takes value 0 if monetary task appeared before privacy task, 1 otherwise; Tablek is a
control for differences in the number of safe choices across tables. For the estimation13Only about 5% of our participants indicated they were not members of any online social network.14Because three participants always avoided financial risk (rori > 100%), meaning that their level of
risk aversion is not observed, we also include in our regressions a dummy Highly Risk Averse, whichis equal to 1 if rori > 100%, and equal to 0 else. Formally, our regression is therefore of the formAPRi = β0 + β1 · rori · 1(rori < 100%) + β′
1 · 1(rori > 100%) + β2 ·Orderi + ...+ εik
13
of this second model, we run panel random-effects interval regressions, which allows
us to take into account right- and left-censoring (when a participant always chooses
option A or option B in a given MPL table).
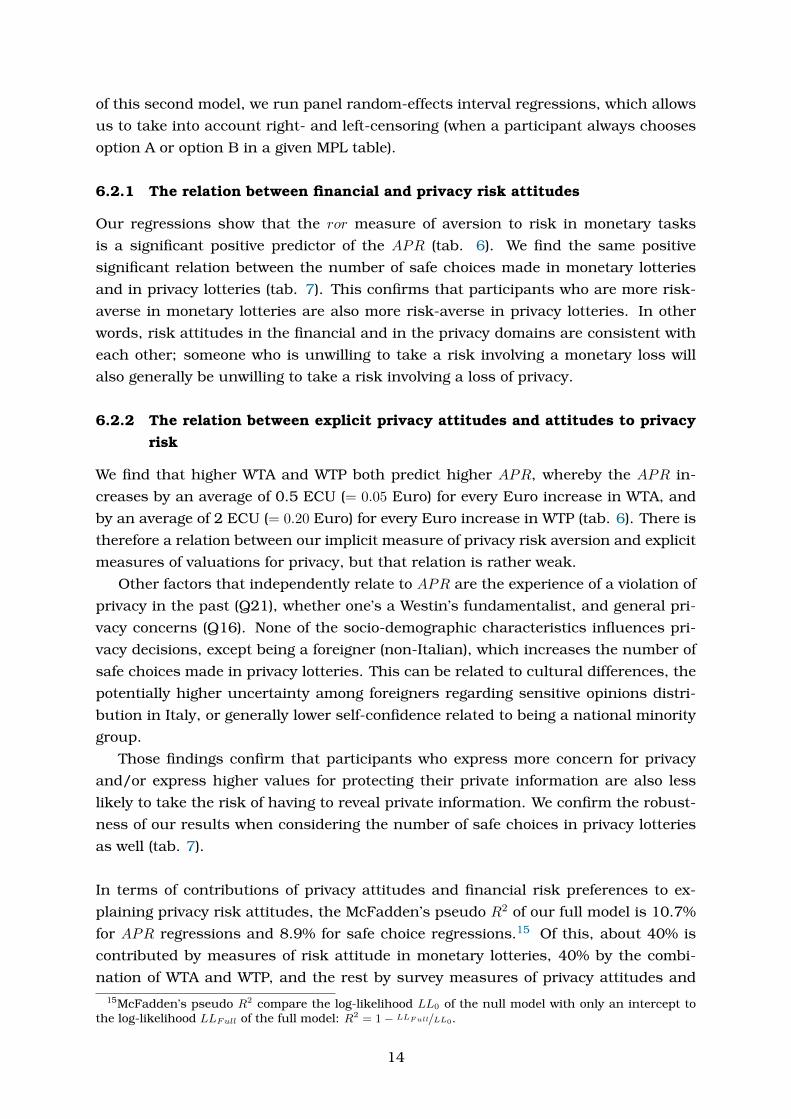
6.2.1 The relation between financial and privacy risk attitudes
Our regressions show that the ror measure of aversion to risk in monetary tasks
is a significant positive predictor of the APR (tab. 6). We find the same positive
significant relation between the number of safe choices made in monetary lotteries
and in privacy lotteries (tab. 7). This confirms that participants who are more risk-
averse in monetary lotteries are also more risk-averse in privacy lotteries. In other
words, risk attitudes in the financial and in the privacy domains are consistent with
each other; someone who is unwilling to take a risk involving a monetary loss will
also generally be unwilling to take a risk involving a loss of privacy.
6.2.2 The relation between explicit privacy attitudes and attitudes to privacyrisk
We find that higher WTA and WTP both predict higher APR, whereby the APR in-
creases by an average of 0.5 ECU (= 0.05 Euro) for every Euro increase in WTA, and
by an average of 2 ECU (= 0.20 Euro) for every Euro increase in WTP (tab. 6). There is
therefore a relation between our implicit measure of privacy risk aversion and explicit
measures of valuations for privacy, but that relation is rather weak.
Other factors that independently relate to APR are the experience of a violation of
privacy in the past (Q21), whether one’s a Westin’s fundamentalist, and general pri-
vacy concerns (Q16). None of the socio-demographic characteristics influences pri-
vacy decisions, except being a foreigner (non-Italian), which increases the number of
safe choices made in privacy lotteries. This can be related to cultural differences, the
potentially higher uncertainty among foreigners regarding sensitive opinions distri-
bution in Italy, or generally lower self-confidence related to being a national minority
group.
Those findings confirm that participants who express more concern for privacy
and/or express higher values for protecting their private information are also less
likely to take the risk of having to reveal private information. We confirm the robust-
ness of our results when considering the number of safe choices in privacy lotteries
as well (tab. 7).
In terms of contributions of privacy attitudes and financial risk preferences to ex-
plaining privacy risk attitudes, the McFadden’s pseudo R2 of our full model is 10.7%
for APR regressions and 8.9% for safe choice regressions.15 Of this, about 40% is
contributed by measures of risk attitude in monetary lotteries, 40% by the combi-
nation of WTA and WTP, and the rest by survey measures of privacy attitudes and15McFadden’s pseudo R2 compare the log-likelihood LL0 of the null model with only an intercept to
the log-likelihood LLFull of the full model: R2 = 1− LLFull/LL0.
14
socio-demographic variables.16
Overall, therefore, participants who are more risk averse than others when faced
with monetary lotteries, are also more risk averse than others when faced with pri-
vacy lotteries. We also find that participants who express more concern for privacy
and who are ready to pay more to protect it, or who require more money to reveal it,
are less likely to take a risk in privacy lotteries.
7 Robustness to order effect and preexisting threat
We test in this section two issues of robustness of our measure of attitude to privacy
risk. The first is whether the order of elicitation of monetary risk and privacy risk
attitude matters, and the second is whether our measure can be used to elicit attitude
when privacy is already under threat. The first issue is important for experimenters
since they have to choose what attitude to elicit first, and the order of elicitation
may impact how participants perceive the tasks. The second issue is important for
policy-makers since they are interested in eliciting attitude to privacy risks that the
population is already incurring. Therefore, we need to know whether attitudes change
depending on whether people can avoid taking a privacy risk entirely, vs. when taking
some risk is unavoidable.
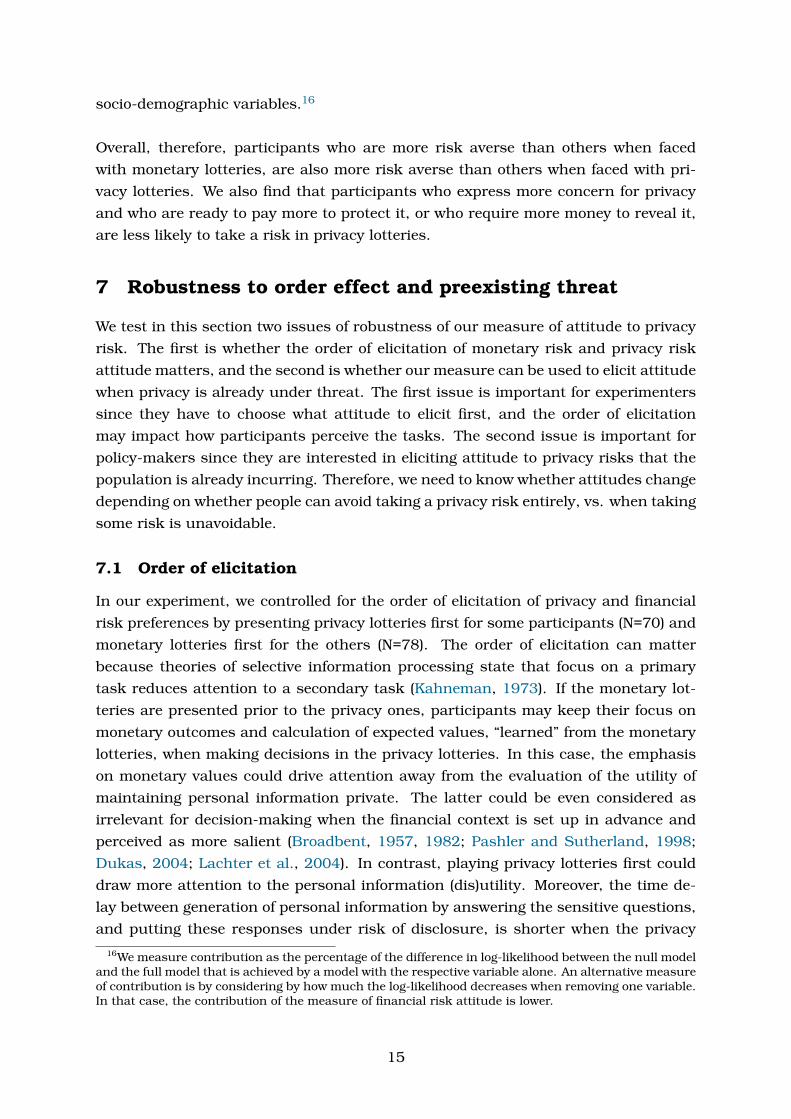
7.1 Order of elicitation
In our experiment, we controlled for the order of elicitation of privacy and financial
risk preferences by presenting privacy lotteries first for some participants (N=70) and
monetary lotteries first for the others (N=78). The order of elicitation can matter
because theories of selective information processing state that focus on a primary
task reduces attention to a secondary task (Kahneman, 1973). If the monetary lot-
teries are presented prior to the privacy ones, participants may keep their focus on
monetary outcomes and calculation of expected values, “learned” from the monetary
lotteries, when making decisions in the privacy lotteries. In this case, the emphasis
on monetary values could drive attention away from the evaluation of the utility of
maintaining personal information private. The latter could be even considered as
irrelevant for decision-making when the financial context is set up in advance and
perceived as more salient (Broadbent, 1957, 1982; Pashler and Sutherland, 1998;
Dukas, 2004; Lachter et al., 2004). In contrast, playing privacy lotteries first could
draw more attention to the personal information (dis)utility. Moreover, the time de-
lay between generation of personal information by answering the sensitive questions,
and putting these responses under risk of disclosure, is shorter when the privacy
16We measure contribution as the percentage of the difference in log-likelihood between the null modeland the full model that is achieved by a model with the respective variable alone. An alternative measureof contribution is by considering by how much the log-likelihood decreases when removing one variable.In that case, the contribution of the measure of financial risk attitude is lower.
15

lotteries are played right after the completion of the preliminary questionnaire rather
than in the second part of the experiment. Adjerid et al. (2013) found that even 15-
second delay between demonstration of privacy notice and disclosure decisions was
sufficient to distract participants and mute the perception of risk.
To test the order effect we consider the number of safe choices and APR across dif-
ferent ordering of monetary and privacy tasks in the experiment. Statistical tests and
cumulative distribution function show a significant order effect in privacy task: par-
ticipants made more safe choices in the privacy lotteries and had higher APR when
privacy tasks appeared before the monetary tasks.17 A similar effect is observed also
in terms of the percentage of participants who took only safe alternative in privacy
tasks (20% when privacy task first vs. 12% when monetary task first).18 The propor-
tion of people who behaved as if they had value for privacy close to zero – switching
to the risky choice as soon as its payoff was higher than the safe choice – was sig-
nificantly lower when privacy lotteries appeared first than when monetary lotteries
appeared first (25% vs. 36%, respectively).19 Our findings show that the willingness
to protect personal information from the risk of revelation increases when decisions
involving risk of personal information disclosure are made before the decisions in-
volving risk of a monetary loss.
Figure 2: Scatter plot of ror and (dis)utility of privacy risk, APR, by order of elicitation,with prediction line of linear regression and 95% confidence interval for forecast.
While cumulative distribution function and statistical tests show that values of
APR are greater when privacy task appears first, coefficients on this condition dummy
17Tests of the difference in the number of safe choices: two-sample Wilcoxon rank-sum test: Prob> |z| = 0.01; t-test: Pr(T < t) = 0.01; Kolmogorov-Smirnov equality-of-distributions test: correctedp-value is 0.04; ANOVA: coefficient is 0.77, P>|t|=0.02; Kruskal-Wallis equality-of-populations ranktest: Prob=0.01. NID = 148; Nobs = 592(312 and 280 in monetary and privacy tasks first conditions,respectively). Estimated statistical power is 0.66.Tests of the difference in APR: two-sample Wilcoxon rank-sum test: Prob > |z| = 0.028; t-test: Pr(T < t)= 0.03; Kolmogorov-Smirnov equality-of-distributions test: corrected p-value is 0.10; ANOVA: coefficientis 5.53, P>|t|=0.06; Kruskal-Wallis equality-of-populations rank test: Prob=0.03. NID = 148; Nobs = 375(206 and 169 in monetary and privacy tasks first conditions, respectively). Estimated statistical poweris 0.45.
18Excluding MPL table 4, proportion test Pr(Z < z) = 0.01. Pearson chi2(1) = 5.32 (Pr = 0.021).Estimated power is 0.63.
19Two-sample test of proportions: Pr(Z > z) = 0.00. Estimated power is 0.83.
16
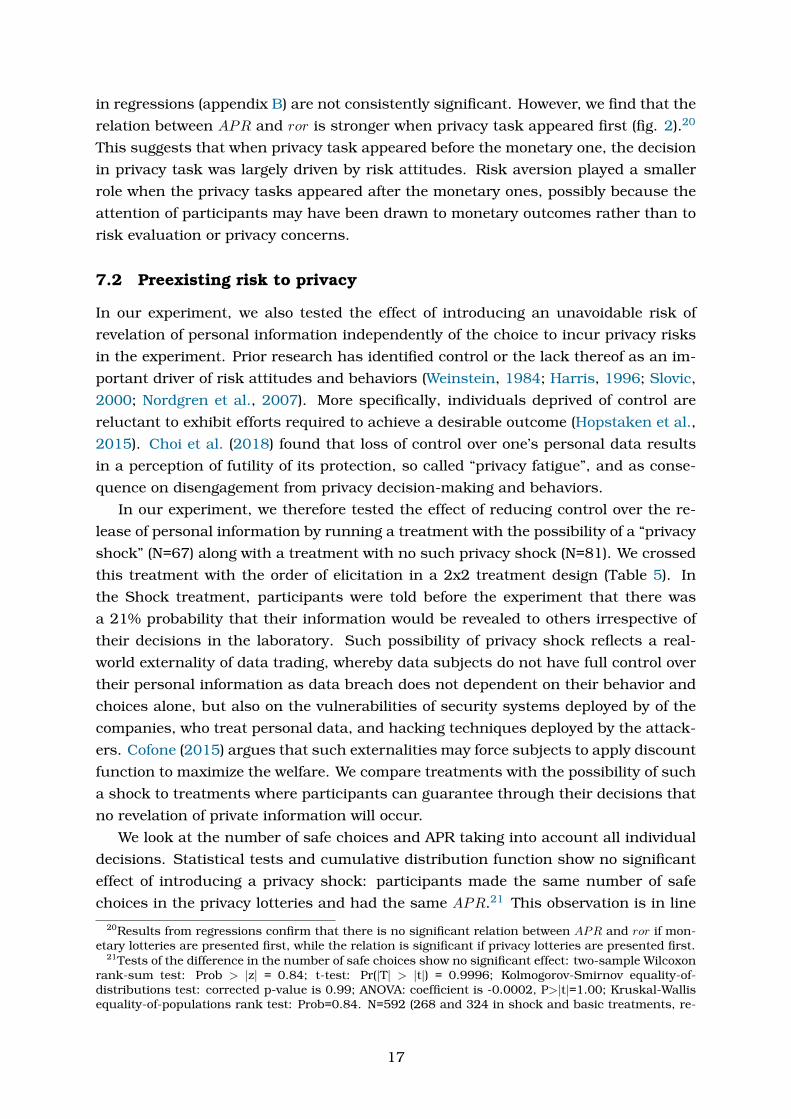
in regressions (appendix B) are not consistently significant. However, we find that the
relation between APR and ror is stronger when privacy task appeared first (fig. 2).20
This suggests that when privacy task appeared before the monetary one, the decision
in privacy task was largely driven by risk attitudes. Risk aversion played a smaller
role when the privacy tasks appeared after the monetary ones, possibly because the
attention of participants may have been drawn to monetary outcomes rather than to
risk evaluation or privacy concerns.
7.2 Preexisting risk to privacy
In our experiment, we also tested the effect of introducing an unavoidable risk of
revelation of personal information independently of the choice to incur privacy risks
in the experiment. Prior research has identified control or the lack thereof as an im-
portant driver of risk attitudes and behaviors (Weinstein, 1984; Harris, 1996; Slovic,
2000; Nordgren et al., 2007). More specifically, individuals deprived of control are
reluctant to exhibit efforts required to achieve a desirable outcome (Hopstaken et al.,
2015). Choi et al. (2018) found that loss of control over one’s personal data results
in a perception of futility of its protection, so called “privacy fatigue”, and as conse-
quence on disengagement from privacy decision-making and behaviors.
In our experiment, we therefore tested the effect of reducing control over the re-
lease of personal information by running a treatment with the possibility of a “privacy
shock” (N=67) along with a treatment with no such privacy shock (N=81). We crossed
this treatment with the order of elicitation in a 2x2 treatment design (Table 5). In
the Shock treatment, participants were told before the experiment that there was
a 21% probability that their information would be revealed to others irrespective of
their decisions in the laboratory. Such possibility of privacy shock reflects a real-
world externality of data trading, whereby data subjects do not have full control over
their personal information as data breach does not dependent on their behavior and
choices alone, but also on the vulnerabilities of security systems deployed by of the
companies, who treat personal data, and hacking techniques deployed by the attack-
ers. Cofone (2015) argues that such externalities may force subjects to apply discount
function to maximize the welfare. We compare treatments with the possibility of such
a shock to treatments where participants can guarantee through their decisions that
no revelation of private information will occur.
We look at the number of safe choices and APR taking into account all individual
decisions. Statistical tests and cumulative distribution function show no significant
effect of introducing a privacy shock: participants made the same number of safe
choices in the privacy lotteries and had the same APR.21 This observation is in line
20Results from regressions confirm that there is no significant relation between APR and ror if mon-etary lotteries are presented first, while the relation is significant if privacy lotteries are presented first.
21Tests of the difference in the number of safe choices show no significant effect: two-sample Wilcoxonrank-sum test: Prob > |z| = 0.84; t-test: Pr(|T| > |t|) = 0.9996; Kolmogorov-Smirnov equality-of-distributions test: corrected p-value is 0.99; ANOVA: coefficient is -0.0002, P>|t|=1.00; Kruskal-Wallisequality-of-populations rank test: Prob=0.84. N=592 (268 and 324 in shock and basic treatments, re-
17
with the experimental results in Wathieu and Friedman (2009), whereby introduc-
ing the certainty of personal information dissemination against probabilistic risk of
revelation did not increase privacy concerns.
Thus, we conclude that the introduction of a privacy shock does not lead people
to change their attitude towards protection of personal information. In other words,
even when losing complete control over personal information, whereby one introduces
a risk of information disclosure that is independent of one’s choices, people keep on
considering the level of risk that remains under their control in the same way as if
they had full control over whether to incur this risk.
8 Discussion and conclusion
We presented a novel method for the implicit elicitation of the attitude to the risk of
personal information disclosure based on choices in privacy lotteries. Our method
is based on observed behavior instead of surveyed attitudes, it is incentivized, and
involves probabilistic privacy risk, which is more common in real-life privacy decision
space than certain privacy threats. .
We tested our methods in a laboratory experiment with 148 participants. They
had to choose between sure monetary payoff and lotteries of two types. Lotteries in
the financial domain served to elicit financial risk preferences, while privacy lotteries
elicited the willingness to protect personal information, which included individuals’
name, surname, photo, and responses to a questionnaire about their opinion on a
range of controversial topics.
We found a consistent positive relationship between financial and privacy risk
aversion. We also found that the decision to take privacy risk was not only dependent
on risk attitudes, but also on survey measures of privacy attitudes and WTA/WTP
for privacy. This supports the idea that willingness to protect personal information is
driven at least in part by risk aversion rather than only, or even mainly, by differences
in values for personal information and privacy attitudes. Therefore, future attempts
to measure privacy attitudes should take into consideration not only attitudes to
privacy, but also attitudes to risk.
We tested our measure for its sensitivity to the order in which risk and privacy
attitudes are elicited, and to an already present threat to privacy. We found qualified
support for the existence of an order effect, whereby presenting privacy choices prior
to financial ones leads to a more privacy-protective behavior.
Further research is needed in order to test the external validity of our measure,
that is, whether it correlates with actual behavior in terms of willingness to compro-
mise or protect private information. Already however, our measure correlates well
with reported behavior in terms of attitude to risk and to privacy.
spectively). Statistical power is 0.05. Tests of the difference in APR also show no significant effect: two-sample Wilcoxon rank-sum test: Prob > |z| = 0.41; t-test: Pr(|T| > |t|) = 0.91; Kolmogorov-Smirnov test:corrected p-value is 0.79; ANOVA: coefficient is -0.30, P>|t|=0.91; Kruskal-Wallis rank test: Prob=0.41.N=375 (171 and 204 in shock and basic treatments, respectively). Estimated statistical power is 0.05.
18

Our paper makes several methodological, empirical, and practical contributions:
First, we propose a new method to elicit a privacy concern in the laboratory that
overcomes the disadvantages of other methods for the synthetic generation of privacy
concerns in lab experiments by 1) avoiding the overconfidence bias about one’s per-
sonal abilities and avoiding a dichotomous division between “bad” and “good” types
as in intelligence tests , 2) avoiding problems with truth-telling, since any opinion
is guaranteed to contradict the opinion of some other people, and 3) not being suffi-
ciently sensitive that it could be misused to damage the participants materially. The
information we elicit is sensitive in the laboratory context, but not beyond; this helps
overcome legal constraints in the collection, storage, and use of such private data.
Second, we propose a novel technique for the implicit elicitation of attitudes to
privacy risks. This method is incentive compatible, and implies a series of deci-
sions that are more intuitive for participants than direct calculation of not readily
cognitively available value of personal information. In our study, for demonstration
purposes of the conceptual framework of the elicitation method we used a simplified
privacy behavior scenario. For practical or academic purposes, the scenarios may
be further modified to better suit real-world decisions. For instance, a realistic sce-
nario could be spelled out as follows: “There is a 35% probability that data generatedfrom your health-tracking wristband will be hacked. In that case, the metrics related toyour physical activity would be sold to an advertising company. That company woulduse this information to try to sell you fake ineffective drugs against your inferred med-ical issues.” The safe option for such a scenario would involve purchasing a cyber-
insurance that would compensate the buyer for negative consequences of such a
hacking. The level of concern with privacy in such a scenario would correspond to
the maximum price an individual would be ready to pay for such a cyber-insurance.
By changing predictor variables (e.g., type of personal information, type of security
threat, proposed means of protection, etc.), we would be able to map privacy risk
attitudes across multiple contexts.
In this way, our method can be applied to any type of private information, for
example, financial, health, social network information, etc. Moreover, this method is
not limited to a particular type of risk, as it may be applied to a range of other risks,
such as unauthorized sharing with third parties, use for unsolicited marketing pur-
poses, fraud, price discrimination when calculating the insurance cost or premium,
etc. The probability of encountering such risk and the entities responsible for risk
occurrence (e.g., banks, insurance companies, government surveillance bodies, mar-
keting companies, independent hackers and attackers, etc.) may be also changed
depending on the research question. Finally, the means and range of cost for pri-
vacy protection, represented by safe options in our experiment, may vary and could
include purchasing of a cybersecurity insurance, privacy-enhancing technologies, or
software for data protection. Future research is called on to explore those possibili-
ties further by comparing privacy risk attitudes across cultures and various contexts,
involving different types of data, kinds and probabilities of privacy risks.
19
Our technique can also serve a practical role for the corporate and social as-
sessment of privacy risks, computation of premiums, and policy evaluation by re-
searchers, policy-makers, managers and other participants in the market for private
information. The conversion of our method into practical tool may involve improving
the usability of the elicitation method. Instead of offering many long predefined MPL
tables, one could use a dynamic iterative elicitation method, in which a participant
would be first asked to make decisions between few lotteries with wide coarse-grained
range of outcomes. Then based on previous choices, the outcomes of the next small
batches of the lotteries would be refined until a desirable level of measurement ac-
curacy is achieved. This way, participants would have to make only few decisions to
achieve the result, and no censoring of the data would be involved (i.e. there will be
no unobserved attitudes as may happen with poorly predefined tables’ limits). More-
over, even only one lottery is already enough to validate a hypothesis (e.g., that the
privacy risk aversion level is greater than zero or than any other value of interest).
Third, we found qualified support for the existence of an order effect, whereby
presenting privacy choices prior to financial ones leads to a more privacy-protective
behavior. We have at least two interpretations for this: 1) privacy attitudes are af-
fected by an immediacy effect (subjects make more privacy protective decisions right
after answering private questions), and 2) thinking about financial risk first, leads
subjects to consider privacy in monetary terms, thus possibly leading to less risk-
averse behavior. This finding may find application in creating privacy policies, in
the architecture of privacy choices and in personal data marketplaces. For example,
emphasizing monetary benefits before asking for privacy-related choices may lead to
more disclosure. Conversely, making privacy more salient may result in more protec-
tive behavior with respect to one’s personal data.
Fourth, we found that taking away the full control over one’s personal information
does not make individual change his willingness to take risk of its disclosure. This
has an important methodological and practical implication: privacy risk attitudes can
be measured (and will not be biased) in the situations where participants’ personal
information is already jeopardized by the factors out of their control, for example, if
they have already provided information to a company or other entity and therefore
exposed it to an existing probability of data breach or another risk. In such situation,
one can rely on decisions to incur or protect against the privacy risk as comparable
to the decisions that those people would make in an ideal fully controllable situation.
This property is especially useful for natural and field experiments.
Finally, we draw the attention of researchers and practitioners interested in mea-
suring privacy attitudes to consider the existence of people, who enjoy revealing per-
sonal information, rather than protecting it. This consideration should be acknowl-
edged in either providing options that offer to both promote/allow and/or avoid/prohibit
disclosure of personal information, or choosing the neutral wording of these options.
For instance, in eliciting WTP/WTA, participants should be given a chance not only
to accept payments for personal information disclosure or pay for its protection, but
20

also to accept payments for preventing personal information sharing and to pay for
its dissemination, which would reflect the positive utility of information disclosure.
References
Acquisti, A., L. K. John, and G. Loewenstein (2013). What is privacy worth? TheJournal of Legal Studies 42(2), 249–274. 2
Acquisti, A., C. R. Taylor, and L. Wagman (2016). The economics of privacy. Journalof Economic Literature 52(2), 442–492. 2
Adjerid, I., A. Acquisti, L. Brandimarte, and G. Loewenstein (2013). Sleights of pri-
vacy: Framing, disclosures, and the limits of transparency. In Proceedings of theNinth Symposium on Usable Privacy and Security, pp. 9:1–9:11. ACM. 16
Andersen, S., G. W. Harrison, M. I. Lau, and E. E. Rutstrom (2006). Elicitation using
multiple price list formats. Experimental Economics 9(4), 383–405. 5, 7
Bardsley, N., R. Cubitt, G. Loomes, P. Moffatt, C. Starmer, and R. Sugden (2010).
Experimental economics: Rethinking the rules. Princeton University Press. 11
Benndorf, V. and H.-T. Normann (2017). The willingness to sell personal data. TheScandinavian Journal of Economics. Online in advance of print. 1, 2
Beresford, A. R., D. Kubler, and S. Preibusch (2012). Unwillingness to pay for privacy:
A field experiment. Economics Letters 117(1), 25–27. 1, 2
Braunstein, A., L. Granka, and J. Staddon (2011). Indirect content privacy surveys:
measuring privacy without asking about it. In Proceedings of the Seventh Sympo-sium on Usable Privacy and Security, pp. 15. ACM. 2
Broadbent, D. E. (1957). A mechanical model for human attention and immediate
memory. Psychological Review 64(3), 205–215. 15
Broadbent, D. E. (1982). Task combination and selective intake of information. ActaPsychologica 50(3), 253–290. 15
Carrascal, J. P., C. Riederer, V. Erramilli, M. Cherubini, and R. de Oliveira (2013).
Your browsing behavior for a big mac: Economics of personal information online.
In Proceedings of the 22nd International Conference on the World Wide Web, pp.
189–200. ACM. 1, 2
Charness, G., U. Gneezy, and A. Imas (2013). Experimental methods: Eliciting risk
preferences. Journal of Economic Behavior & Organization 87, 43–51. 7
Choi, H., J. Park, and Y. Jung (2018). The role of privacy fatigue in online privacy
behavior. Computers in Human Behavior 81, 42–51. 17
21
Clemente, M. and T. J. Roulet (2015). Public opinion as a source of deinstitution-
alization: A “spiral of silence” approach. Academy of Management Review 40(1),
96–114. 4
Cofone, I. (2015). The value of privacy: Keeping the money where the mouth is. In
14th Annual Workshop on the Economics of Information Security (WEIS). 17
Correa, T., A. W. Hinsley, and H. G. De Zuniga (2010). Who interacts on the Web?:
The intersection of users’ personality and social media use. Computers in HumanBehavior 26(2), 247–253. 13
Cubitt, R. P., C. Starmer, and R. Sugden (1998). On the validity of the random lottery
incentive system. Experimental Economics 1(2), 115–131. 11
Dukas, R. (2004). Causes and consequences of limited attention. Brain, Behavior andEvolution 63(4), 197–210. 15
Egelman, S., A. P. Felt, and D. Wagner (2013). Choice architecture and smartphone
privacy: There’s a price for that. In The Economics of Information Security andPrivacy, pp. 211–236. Springer. 2
Feri, F., C. Giannetti, and N. Jentzsch (2016). Disclosure of personal information
under risk of privacy shocks. Journal of Economic Behavior & Organization 123,
138–148. 4
Fogel, J. and E. Nehmad (2009). Internet social network communities: Risk taking,
trust, and privacy concerns. Computers in Human Behavior 25(1), 153–160. 9
Gideon, J., L. Cranor, S. Egelman, and A. Acquisti (2006). Power strips, prophylactics,
and privacy, oh my! In Proceedings of the Second Symposium on Usable privacy andsecurity, pp. 133–144. ACM. 2
Graeff, T. R. and S. Harmon (2002). Collecting and using personal data: consumers’
awareness and concerns. Journal of Consumer Marketing 19(4), 302–318. 2
Griffin, D. W. and C. A. Varey (1996). Towards a consensus on overconfidence. Orga-nizational Behavior and Human Decision Processes 65(3), 227–231. 4
Grossklags, J. and A. Acquisti (2007). When 25 cents is too much: An experiment on
willingness-to-sell and willingness-to-protect personal information. In Proceedingsof the Sixth Workshop on the Economics of Information Security (WEIS’07), pp. 7–18.
1, 2, 4
Hann, I.-H., K.-L. Hui, S.-Y. T. Lee, and I. P. Png (2007). Overcoming online infor-
mation privacy concerns: An information-processing theory approach. Journal ofManagement Information Systems 24(2), 13–42. 2
22

Harris, P. (1996). Sufficient grounds for optimism?: The relationship between per-
ceived controllability and optimistic bias. Journal of Social and Clinical Psychol-ogy 15(1), 9–52. 17
Harrison, G. W., M. I. Lau, E. E. Rutstrom, and M. Tarazona-Gomez (2012). Prefer-
ences over social risk. Oxford Economic Papers 65(1), 25–46. 7
Harrison, G. W. and E. E. Rutstrom (2008). Risk Aversion in the Laboratory, Vol-
ume 12, Chapter Risk Aversion in Experiments, pp. 41–196. Emerald Group Pub-
lishing Limited. 5
Hey, J. D. and J. Lee (2005). Do subjects separate (or are they sophisticated)?. Ex-perimental Economics 8(3), 233–265. 11
Hirschprung, R., E. Toch, F. Bolton, and O. Maimon (2016). A methodology for esti-
mating the value of privacy in information disclosure systems. Computers in HumanBehavior 61, 443–453. 3, 6, 8
Holt, C. A. (1986). Preference reversals and the independence axiom. American Eco-nomic Review 76(3), 508–515. 11
Holt, C. A. and S. K. Laury (2002). Risk aversion and incentive effects. AmericanEconomic Review 92(5), 1644–1655. 5, 12
Hopstaken, J. F., D. Linden, A. B. Bakker, and M. A. Kompier (2015). A multi-
faceted investigation of the link between mental fatigue and task disengagement.
Psychophysiology 52(3), 305–315. 17
Huberman, B. A., E. Adar, and L. R. Fine (2005). Valuating privacy. IEEE Security &Privacy 3(5), 22–25. 2
Johnson, C. A., A. Baillon, H. Bleichrodt, Z. Li, D. Van Dolder, and P. P. Wakker
(2015). Prince: An improved method for measuring incentivized preferences. SSRN
Working Paper 2504745. 11
Kahneman, D. (1973). Attention and effort. Englewood Cliffs, NJ: Prentice-Hall. 15
Keith, M. J., S. C. Thompson, J. Hale, P. B. Lowry, and C. Greer (2013). Informa-
tion disclosure on mobile devices: Re-examining privacy calculus with actual user
behavior. International Journal of Human-Computer Studies 71(12), 1163–1173. 2
Keren, G. (1991). Calibration and probability judgements: Conceptual and method-
ological issues. Acta Psychologica 77(3), 217–273. 11
Kim, S.-H. (1999). Opinion expression as a rational behavior. In Annual Meeting ofthe Association for Education in Journalism and Mass Communication, New Orleans.4
23

Krasnova, H., E. Kolesnikova, and O. Guenther (2009). ”It won’t happen to me!”:
Self-disclosure in online social networks. In AMCIS 2009 Proceedings. Paper 343.
13
Lachter, J., K. I. Forster, and E. Ruthruff (2004). Forty-five years after Broadbent
(1958): Still no identification without attention. Psychological Review 111(4), 880–
913. 15
Lewis, K., J. Kaufman, and N. Christakis (2008). The taste for privacy: An analysis of
college student privacy settings in an online social network. Journal of Computer-Mediated Communication 14(1), 79–100. 2
Madden, M. and L. Rainie (2015). Americans’ attitudes about privacy, security and
surveillance. Report, Pew Research Center. 2
Maier, J. and M. Ruger (2010). Measuring risk aversion model-independently. Munich
Discussion Paper No. 2010-33, Ludwig- Maximilians-Universitat Munchen. 6
Malhotra, N. K., S. S. Kim, and J. Agarwal (2004). Internet users’ information pri-
vacy concerns (IUIPC): The construct, the scale, and a causal model. Informationsystems research 15(4), 336–355. 2
McCallister, E. (2010). Guide to protecting the confidentiality of personally identifiableinformation. Diane Publishing. 4
Miller, L., D. E. Meyer, and J. T. Lanzetta (1969). Choice among equal expected value
alternatives: Sequential effects of winning probability level on risk preferences.
Journal of Experimental Psychology 79(3p1), 419–423. 5
Motiwalla, L. F. and X.-B. Li (2016). Unveiling consumers’ privacy paradox be-
haviour in an economic exchange. International Journal Of Business InformationSystems 23(3), 307–329. 1, 2
Noelle-Neumann, E. (1974). The spiral of silence: A theory of public opinion. Journalof Communication 24(2), 43–51. 4
Norberg, P. A., D. R. Horne, and D. A. Horne (2007). The privacy paradox: Per-
sonal information disclosure intentions versus behaviors. Journal of ConsumerAffairs 41(1), 100–126. 2
Nordgren, L. F., J. Van Der Pligt, and F. Van Harreveld (2007). Unpacking perceived
control in risk perception: The mediating role of anticipated regret. Journal ofBehavioral Decision Making 20(5), 533–544. 17
Nosek, B. A. and A. G. Greenwald (2009). (Part of) the case for a pragmatic approach
to validity: Comment on De Houwer, Teige-Mocigemba, Spruyt, and Moors. Psy-chological Bulletin 135, 373–376. 3
24
Nosek, B. A., C. B. Hawkins, and R. S. Frazier (2011). Implicit social cognition: From
measures to mechanisms. Trends in Cognitive Sciences 15(4), 152–159. 3
Pashler, H. E. and S. Sutherland (1998). The psychology of attention, Volume 15. MIT
press Cambridge, MA. 15
Preibusch, S. (2013). Guide to measuring privacy concern: Review of survey and ob-
servational instruments. International Journal of Human-Computer Studies 71(12),
1133–1143. 2
Rivenbark, D. R. (2012). Valuing the risk from privacy loss: Experimentally elicited
beliefs explain privacy behavior. Working Paper, University of Central Florida, Or-
lando, FL. 4
Ross, C., E. S. Orr, M. Sisic, J. M. Arseneault, M. G. Simmering, and R. R. Orr (2009).
Personality and motivations associated with Facebook use. Computers in HumanBehavior 25(2), 578–586. 13
Schreiner, M. and T. Hess (2013). On the willingness to pay for privacy as a freemium
model: First empirical evidence. In Proceedings of the 21st European Conference onInformation Systems, pp. 30–36. 2
Schwarz, N. (1999). Self-reports: how the questions shape the answers. AmericanPsychologist 54(2), 93–105. 2
Shafir, E. and A. Tversky (1992). Thinking through uncertainty: Nonconsequential
reasoning and choice. Cognitive Psychology 24(4), 449–474. 11
Slovic, P. E. (2000). The perception of risk. Earthscan publications, London. 17
Sutanto, J., E. Palme, C.-H. Tan, and C. W. Phang (2013). Addressing the
personalization-privacy paradox: An empirical assessment from a field experiment
on smartphone users. MIS Quarterly 37(4), 1141–1164. 2
Taddicken, M. (2014). The ‘privacy paradox’ in the social web: The impact of privacy
concerns, individual characteristics, and the perceived social relevance on different
forms of self-disclosure. Journal of Computer-Mediated Communication 19(2), 248–
273. 2
Tsai, J. Y., S. Egelman, L. Cranor, and A. Acquisti (2011). The effect of online privacy
information on purchasing behavior: An experimental study. Information SystemsResearch 22(2), 254–268. 1, 2
Turow, J., M. Hennessy, and N. Draper (2015). The tradeoff fallacy: How marketers
are misrepresenting American consumers and opening them up to exploitation.
Working Paper, The Annenberg School for Communication, University of Pennsyl-
vania. 2
25
Tversky, A. and D. Kahneman (1992). Advances in prospect theory: Cumulative
representation of uncertainty. Journal of Risk and Uncertainty 5(4), 297–323. 6
Wallsten, T. S. (1996). An analysis of judgment research analyses. OrganizationalBehavior and Human Decision Processes 65(3), 220–226. 4
Wathieu, L. and A. Friedman (2009). An empirical approach to understanding privacy
concerns. Technical report, ESMT Working Paper No. 09-001. 18
Weinstein, N. D. (1984). Why it won’t happen to me: Perceptions of risk factors and
susceptibility. Health Psychology 3(5), 431–457. 17
Westin, A. F. (1968). Privacy and freedom. Atheneum, New York. 2, 9
Wilson, T. D. and N. Brekke (1994). Mental contamination and mental correction:
Unwanted influences on judgments and evaluations. Psychological Bulletin 116(1),
117–142. 2
Zywica, J. and J. Danowski (2008). The faces of Facebookers: Investigating social en-
hancement and social compensation hypotheses; predicting Facebook and offline
popularity from sociability and self-esteem, and mapping the meanings of popular-
ity with semantic networks. Journal of Computer-Mediated Communication 14(1),
1–34. 13
26

A Summary statistics
Table 3: Measures of risk aversion (in %) and (dis)utility of personal informationdisclosure (in Euros)Note: Outliers for WTA and WTP are values that are 2 standard deviations away fromthe mean.
ror APR WTA WTA (excluding outliers) WTP WTP (excluding outliers)Min -11% -1.17 0 0 0 0Max 41% 12.50 1000 200 1000 30Mean 11% 2.52 36.20 16.12 10.00 1.92Std. deviation 10% 2.89 141.84 25.33 83.67 4.85N 145 134 147 144 148 146
0.1
.2.3
.4.5
.6.7
Frac
tion
-5 0 5 10 15 20 25 30APR, in euros
0.1
.2.3
.4.5
.6.7
Frac
tion
-5 0 5 10 15 20 25 30Willingness-to-accept, in euros
0.1
.2.3
.4.5
.6.7
Frac
tion
-5 0 5 10 15 20 25 30Willingness-to-pay, in euros
Figure 3: Distribution of APR, WTA and WTP.
Table 4: Differences across treatments, in Euros.
By pre-existing threat By order of elicitationTotal
Basic Shock Monetary first Privacy firstror
Mean 10% 12% 10% 12% 11%Std. deviation 10% 11% 10% 11% 10%Observations 80 65 78 67 145
APRMean 2.53 2.52 2.25 2.85 2.52Std. deviation 2.91 2.88 2.71 3.08 2.89Observations 73 61 73 61 134
27

Table 5: Number of participants by treatment group
Shock Basic Total
Monetary first 37 41 78Privacy first 30 40 70
Total 67 81 148
28
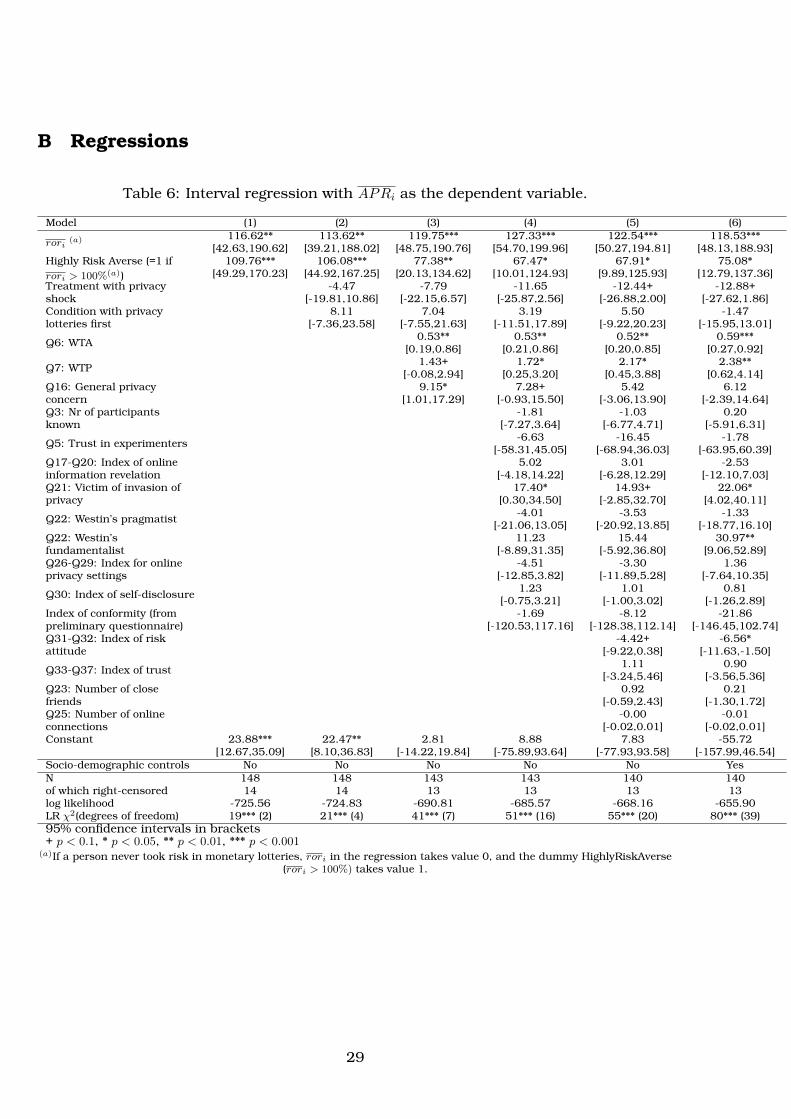
B Regressions
Table 6: Interval regression with APRi as the dependent variable.
Model (1) (2) (3) (4) (5) (6)
rori(a) 116.62** 113.62** 119.75*** 127.33*** 122.54*** 118.53***
[42.63,190.62] [39.21,188.02] [48.75,190.76] [54.70,199.96] [50.27,194.81] [48.13,188.93]Highly Risk Averse (=1 ifrori > 100%(a))
109.76*** 106.08*** 77.38** 67.47* 67.91* 75.08*[49.29,170.23] [44.92,167.25] [20.13,134.62] [10.01,124.93] [9.89,125.93] [12.79,137.36]
Treatment with privacyshock
-4.47 -7.79 -11.65 -12.44+ -12.88+[-19.81,10.86] [-22.15,6.57] [-25.87,2.56] [-26.88,2.00] [-27.62,1.86]
Condition with privacylotteries first
8.11 7.04 3.19 5.50 -1.47[-7.36,23.58] [-7.55,21.63] [-11.51,17.89] [-9.22,20.23] [-15.95,13.01]
Q6: WTA 0.53** 0.53** 0.52** 0.59***[0.19,0.86] [0.21,0.86] [0.20,0.85] [0.27,0.92]
Q7: WTP 1.43+ 1.72* 2.17* 2.38**[-0.08,2.94] [0.25,3.20] [0.45,3.88] [0.62,4.14]
Q16: General privacyconcern
9.15* 7.28+ 5.42 6.12[1.01,17.29] [-0.93,15.50] [-3.06,13.90] [-2.39,14.64]
Q3: Nr of participantsknown
-1.81 -1.03 0.20[-7.27,3.64] [-6.77,4.71] [-5.91,6.31]
Q5: Trust in experimenters -6.63 -16.45 -1.78[-58.31,45.05] [-68.94,36.03] [-63.95,60.39]
Q17-Q20: Index of onlineinformation revelation
5.02 3.01 -2.53[-4.18,14.22] [-6.28,12.29] [-12.10,7.03]
Q21: Victim of invasion ofprivacy
17.40* 14.93+ 22.06*[0.30,34.50] [-2.85,32.70] [4.02,40.11]
Q22: Westin’s pragmatist -4.01 -3.53 -1.33[-21.06,13.05] [-20.92,13.85] [-18.77,16.10]
Q22: Westin’sfundamentalist
11.23 15.44 30.97**[-8.89,31.35] [-5.92,36.80] [9.06,52.89]
Q26-Q29: Index for onlineprivacy settings
-4.51 -3.30 1.36[-12.85,3.82] [-11.89,5.28] [-7.64,10.35]
Q30: Index of self-disclosure 1.23 1.01 0.81[-0.75,3.21] [-1.00,3.02] [-1.26,2.89]
Index of conformity (frompreliminary questionnaire)
-1.69 -8.12 -21.86[-120.53,117.16] [-128.38,112.14] [-146.45,102.74]
Q31-Q32: Index of riskattitude
-4.42+ -6.56*[-9.22,0.38] [-11.63,-1.50]
Q33-Q37: Index of trust 1.11 0.90[-3.24,5.46] [-3.56,5.36]
Q23: Number of closefriends
0.92 0.21[-0.59,2.43] [-1.30,1.72]
Q25: Number of onlineconnections
-0.00 -0.01[-0.02,0.01] [-0.02,0.01]
Constant 23.88*** 22.47** 2.81 8.88 7.83 -55.72[12.67,35.09] [8.10,36.83] [-14.22,19.84] [-75.89,93.64] [-77.93,93.58] [-157.99,46.54]
Socio-demographic controls No No No No No YesN 148 148 143 143 140 140of which right-censored 14 14 13 13 13 13log likelihood -725.56 -724.83 -690.81 -685.57 -668.16 -655.90LR χ2(degrees of freedom) 19*** (2) 21*** (4) 41*** (7) 51*** (16) 55*** (20) 80*** (39)95% confidence intervals in brackets+ p < 0.1, * p < 0.05, ** p < 0.01, *** p < 0.001
(a)If a person never took risk in monetary lotteries, rori in the regression takes value 0, and the dummy HighlyRiskAverse(rori > 100%) takes value 1.
29

Table 7: Panel random-effects interval-data regression, with the number of safe choices inprivacy lotteries as the dependent variable.
Model (1) (2) (3) (4) (5) (6) (7)Safe choices in monetarylotteries
0.632*** 0.659*** 0.617** 0.585** 0.530** 0.489** 0.517**[0.29,0.98] [0.30,1.02] [0.24,0.99] [0.23,0.94] [0.17,0.89] [0.13,0.85] [0.18,0.86]
Table 6 -1.332*** -1.332*** -1.323*** -1.321*** -1.356*** -1.358***[-1.81,-0.86] [-1.81,-0.86] [-1.81,-0.84] [-1.81,-0.83] [-1.85,-0.86] [-1.86,-0.86]
Table 7 -1.799*** -1.800*** -1.798*** -1.795*** -1.840*** -1.841***[-2.27,-1.33] [-2.27,-1.33] [-2.28,-1.31] [-2.28,-1.31] [-2.34,-1.35] [-2.34,-1.35]
Table 8 9.500*** 9.498*** 9.500*** 9.498*** 9.427*** 9.426***[8.70,10.30] [8.70,10.30] [8.68,10.32] [8.68,10.32] [8.59,10.26] [8.59,10.26]
Treatment with privacyshock
-0.226 -0.530 -0.791 -0.843 -1.070+[-1.44,0.99] [-1.66,0.60] [-1.90,0.32] [-1.97,0.28] [-2.20,0.06]
Condition with privacyelicited first
0.701 0.522 0.255 0.449 -0.0883[-0.53,1.94] [-0.65,1.69] [-0.92,1.43] [-0.73,1.62] [-1.22,1.04]
Q6: WTA 0.0470*** 0.0434*** 0.0434*** 0.0483***[0.02,0.07] [0.02,0.07] [0.02,0.07] [0.02,0.07]
Q7: WTP 0.111+ 0.134* 0.168* 0.164*[-0.01,0.23] [0.02,0.25] [0.03,0.30] [0.03,0.30]
Q16: Generally privacyconcern
0.830* 0.721* 0.599+ 0.781*[0.20,1.46] [0.09,1.36] [-0.06,1.25] [0.13,1.43]
Q3: Nr of participantsknown
-0.328 -0.327 -0.225[-0.75,0.09] [-0.77,0.12] [-0.69,0.24]
Q5: Trust in experimenters -1.671 -2.012 -0.0322[-5.82,2.48] [-6.21,2.19] [-4.82,4.76]
Q17-Q20: Index ofinformation revelation
0.457 0.340 -0.125[-0.26,1.17] [-0.38,1.06] [-0.85,0.60]
Q21: Victim of invasion ofprivacy
1.241+ 0.943 1.562*[-0.08,2.56] [-0.43,2.31] [0.20,2.93]
Q22: Westin’s pragmatist -0.456 -0.398 -0.256[-1.78,0.87] [-1.75,0.95] [-1.58,1.07]
Q22: Westin’sfundamentalist
0.973 1.168 2.308**[-0.58,2.52] [-0.48,2.82] [0.66,3.95]
Q26-Q29: Index for onlineprivacy settings
-0.194 -0.162 0.269[-0.84,0.46] [-0.83,0.51] [-0.42,0.95]
Q30: Index of self-disclosure 0.0313 0.00860 0.00305[-0.12,0.19] [-0.15,0.17] [-0.16,0.16]
Index of conformity inpreliminary questionnaire
-2.582 -3.117 -4.301[-11.80,6.64] [-12.44,6.20] [-13.84,5.24]
Q31-Q32: Index of riskattitude
-0.292 -0.472*[-0.67,0.08] [-0.86,-0.08]
Q33-Q37: Index of trust 0.163 0.124[-0.18,0.50] [-0.22,0.46]
Q23: Number of closefriends
0.0722 0.0259[-0.05,0.19] [-0.09,0.14]
Q25: Number of onlineconnections
0.0000371 -0.000180[-0.00,0.00] [-0.00,0.00]
Constant 3.231** 1.672 1.737 0.310 2.705 2.956 -1.400[0.78,5.68] [-0.92,4.27] [-0.86,4.33] [-2.26,2.88] [-4.69,10.10] [-4.50,10.41] [-9.81,7.01]
Socio-demographic controls No No No No No No YesN observations 592 592 592 572 572 560 560of which left-censored 5 5 5 5 5 5 5of which right-censored 212 212 212 204 204 201 201N individuals 148 148 148 143 143 140 140log likelihood -1386 -1030 -1030 -988 -982 -959 -944Wald χ2 (degrees of freedom) 13*** (1) 810*** (4) 812*** (6) 790*** (9) 803*** (18) 776*** (22) 802*** (41)95% confidence intervals in brackets+ p < 0.1, * p < 0.05, ** p < 0.01, *** p < 0.001
30
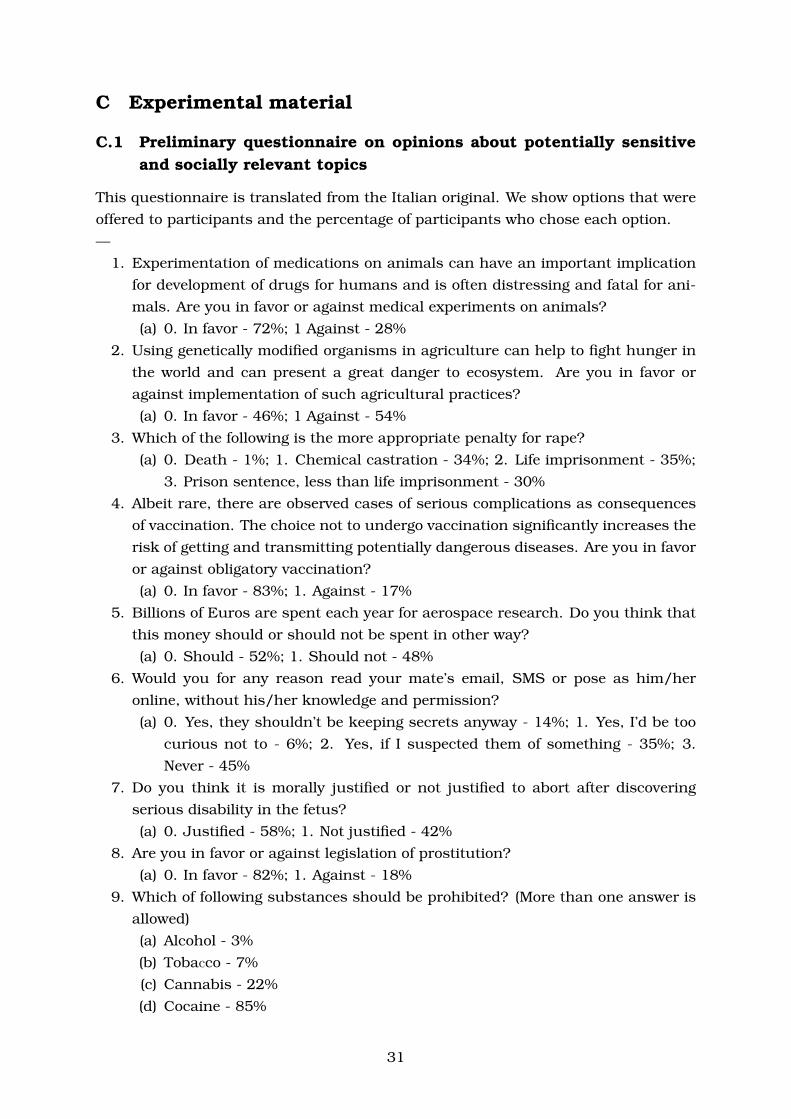
C Experimental material
C.1 Preliminary questionnaire on opinions about potentially sensitiveand socially relevant topics
This questionnaire is translated from the Italian original. We show options that were
offered to participants and the percentage of participants who chose each option.
—
1. Experimentation of medications on animals can have an important implication
for development of drugs for humans and is often distressing and fatal for ani-
mals. Are you in favor or against medical experiments on animals?
(a) 0. In favor - 72%; 1 Against - 28%
2. Using genetically modified organisms in agriculture can help to fight hunger in
the world and can present a great danger to ecosystem. Are you in favor or
against implementation of such agricultural practices?
(a) 0. In favor - 46%; 1 Against - 54%
3. Which of the following is the more appropriate penalty for rape?
(a) 0. Death - 1%; 1. Chemical castration - 34%; 2. Life imprisonment - 35%;
3. Prison sentence, less than life imprisonment - 30%
4. Albeit rare, there are observed cases of serious complications as consequences
of vaccination. The choice not to undergo vaccination significantly increases the
risk of getting and transmitting potentially dangerous diseases. Are you in favor
or against obligatory vaccination?
(a) 0. In favor - 83%; 1. Against - 17%
5. Billions of Euros are spent each year for aerospace research. Do you think that
this money should or should not be spent in other way?
(a) 0. Should - 52%; 1. Should not - 48%
6. Would you for any reason read your mate’s email, SMS or pose as him/her
online, without his/her knowledge and permission?
(a) 0. Yes, they shouldn’t be keeping secrets anyway - 14%; 1. Yes, I’d be too
curious not to - 6%; 2. Yes, if I suspected them of something - 35%; 3.
Never - 45%
7. Do you think it is morally justified or not justified to abort after discovering
serious disability in the fetus?
(a) 0. Justified - 58%; 1. Not justified - 42%
8. Are you in favor or against legislation of prostitution?
(a) 0. In favor - 82%; 1. Against - 18%
9. Which of following substances should be prohibited? (More than one answer is
allowed)
(a) Alcohol - 3%
(b) Tobaсco - 7%
(c) Cannabis - 22%
(d) Cocaine - 85%
31

(e) Acids (LSD, ecstasy, etc.) - 82%
(f) Heroin - 89%
(g) None - 9%
10. Are you in favor or against adoption of children by homosexual couples?
(a) 0. In favor - 56%; 1. Against - 44%
11. Are you in favor or against the closure of Italian borders as a solution for the
problem of illegal immigration?
(a) 0. In favor - 25%; 1. Against - 75%
12. Are you in favor or against euthanasia (i.e. the painless killing of a patient
suffering from an incurable and painful disease or in an irreversible coma)?
(a) 0. In favor - 84%; 1. Against - 16%
13. Some people believe that the trails left by aircrafts in the sky contain chemicals
that are inserted specifically to influence the population. Do you think this is a
plausible theory or not?
(a) 0. Plausible - 10%; 1. Not plausible - 90%
14. Which of the following methods of birth contraception do you consider as the
most appropriate?
(a) 0. Hormonal (oral pills, implants, injections, patches, etc.) - 26%;
(b) 1. Barrier (condoms, cervical caps, diaphragms, sponges with spermicide,
etc.) - 67%;
(c) 2. Intrauterine devices - 1%;
(d) 3. Sterilization (surgical or chemical) - 3%;
(e) 4. Behavioral (interrupted intercourse, fertility awareness method based on
the menstrual cycle, sexual abstinence) - 2%;
(f) 5. None - 1%
C.2 Instructions
The following instructions are for the “privacy choices first” condition and are
translated from the Italian original. In the “monetary choices first”, we simply revert
part I and part II of the instructions.
—
Welcome to the experiment!
The experiment will last about 60 minutes. Please make sure that you can stay
until the end. You will be paid 3 Euros for showing up on time (participation fee). You
can earn more money but this depends on the choices you make in this experiment
and on chance. It is therefore important that you read the following instructions
carefully.
General rulesYou are not allowed to communicate with other participants during the experi-
ment. If you have any doubts or questions, please raise your hand. An assistant will
32

then come to you and answer your question privately. You received an envelope be-
fore the experiment. You are not allowed to open it before the end of the experiment.
You will have to open it in front of an assistant. If you do not follow those rules or
disturb the experiment in other ways, then we will ask you to leave the room and we
will not pay you.
The experimentThere are two parts in the experiment: the first part is described in a separate
sheet now, while you will get the description of the second part only after completing
the first task. You will be presented with tables of choices between two options, one
of which gives a certain payoff while the other gives an outcome that depends on
chance.
PaymentAt the beginning of the experiment, you were asked to pick an envelope from a
bag. In total there were 88 envelopes, which describe a choice situation that you
will face during the experiment. You will get the payoff corresponding to the choice
you made in the situation described in your envelope. This means that any of your
choices during the experiment could be the one that determines your payoff. After
having completed both tasks your final payoff will be calculated, each ECU earned
will be converted into Euro at the rate of 1 euro for 10 ECUs and paid together with
the show-up fee (30 ECUs = 3 euros). For example, if you earned 48 ECUs from your
decision during the experiment, then you will receive 48+30 ECUs = 78 ECUs =7,8
Euro in cash.
AnonymitySince your position in the lab corresponds to the number on a ball taken from a
box randomly we only know you by the number of your seat and not by your name,
surname or other credentials. Thus, we cannot establish any link between your
identity and the decisions you made in the lab, unless the outcome of the experiment
suggests revelation of your personal information so that we need to check your name
and surname from the ID card.
I. First part of the experiment
In the first part of the experiment, you are asked to make choices between two options
of the type described in the following table:
Row Option A Option B Choice1 You get 13 ECUs You get 35 ECUs but with probability 50%
your personal information is revealed to others. . . . . . . . . . . .
Option A guarantees you a certain payoff, while option B is a lottery that gives out
a certain amount of ECUs, but implies some probability of having to disclose your
name, surname, photo and answers in the preliminary questionnaire (from then on
33
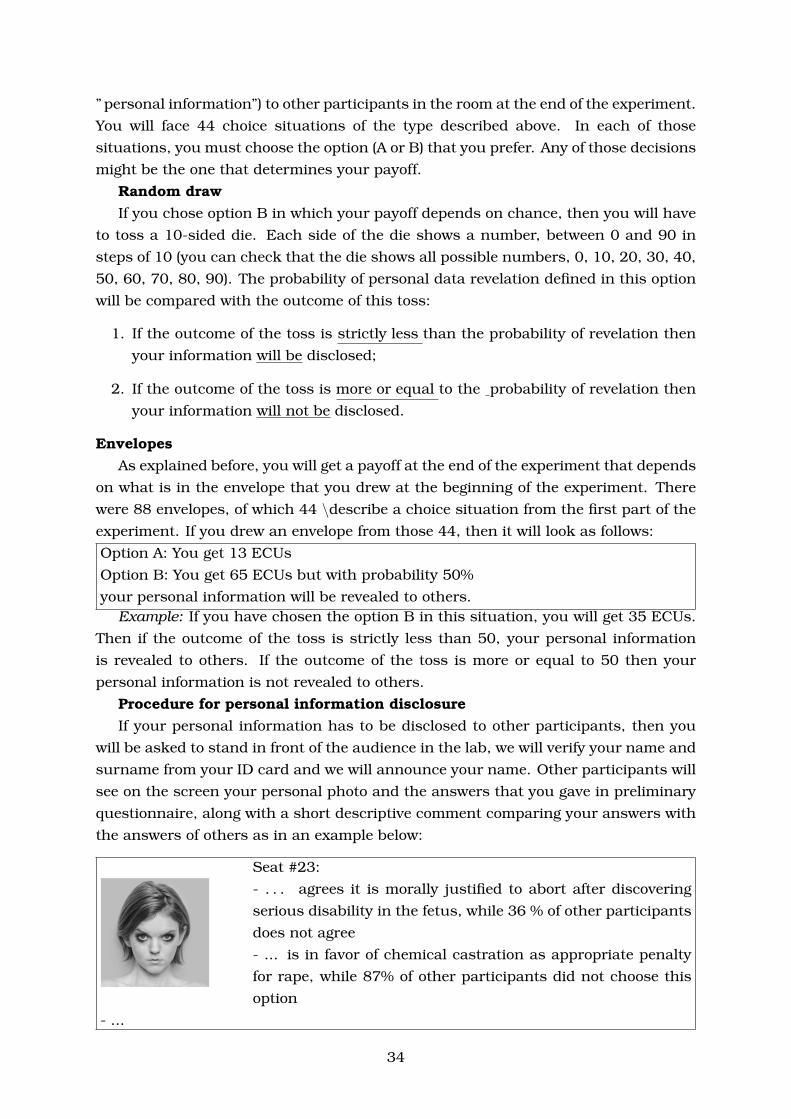
” personal information”) to other participants in the room at the end of the experiment.
You will face 44 choice situations of the type described above. In each of those
situations, you must choose the option (A or B) that you prefer. Any of those decisions
might be the one that determines your payoff.
Random drawIf you chose option B in which your payoff depends on chance, then you will have
to toss a 10-sided die. Each side of the die shows a number, between 0 and 90 in
steps of 10 (you can check that the die shows all possible numbers, 0, 10, 20, 30, 40,
50, 60, 70, 80, 90). The probability of personal data revelation defined in this option
will be compared with the outcome of this toss:
1. If the outcome of the toss is strictly less than the probability of revelation then
your information will be disclosed;
2. If the outcome of the toss is more or equal to the probability of revelation then
your information will not be disclosed.
EnvelopesAs explained before, you will get a payoff at the end of the experiment that depends
on what is in the envelope that you drew at the beginning of the experiment. There
were 88 envelopes, of which 44 \describe a choice situation from the first part of the
experiment. If you drew an envelope from those 44, then it will look as follows:
Option A: You get 13 ECUs
Option B: You get 65 ECUs but with probability 50%
your personal information will be revealed to others.Example: If you have chosen the option B in this situation, you will get 35 ECUs.
Then if the outcome of the toss is strictly less than 50, your personal information
is revealed to others. If the outcome of the toss is more or equal to 50 then your
personal information is not revealed to others.
Procedure for personal information disclosureIf your personal information has to be disclosed to other participants, then you
will be asked to stand in front of the audience in the lab, we will verify your name and
surname from your ID card and we will announce your name. Other participants will
see on the screen your personal photo and the answers that you gave in preliminary
questionnaire, along with a short descriptive comment comparing your answers with
the answers of others as in an example below:
Seat #23:
- . . . agrees it is morally justified to abort after discovering
serious disability in the fetus, while 36 % of other participants
does not agree
- ... is in favor of chemical castration as appropriate penalty
for rape, while 87% of other participants did not choose this
option
- ...
34
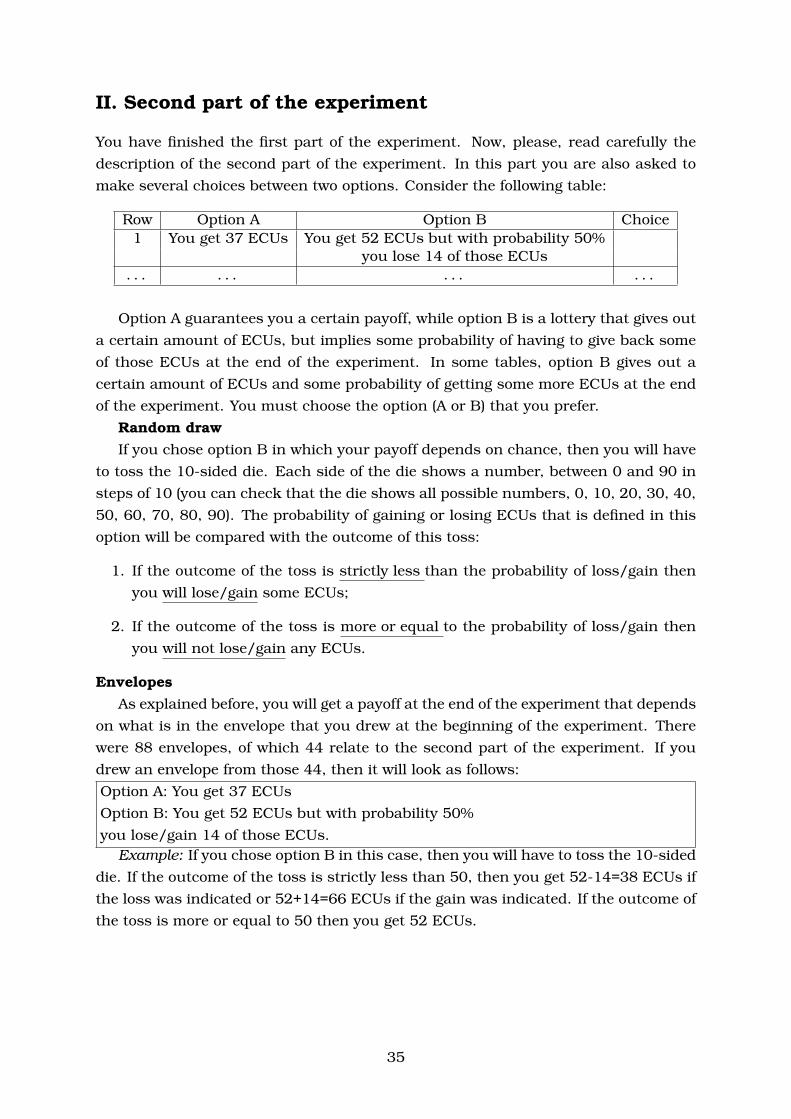
II. Second part of the experiment
You have finished the first part of the experiment. Now, please, read carefully the
description of the second part of the experiment. In this part you are also asked to
make several choices between two options. Consider the following table:
Row Option A Option B Choice1 You get 37 ECUs You get 52 ECUs but with probability 50%
you lose 14 of those ECUs. . . . . . . . . . . .
Option A guarantees you a certain payoff, while option B is a lottery that gives out
a certain amount of ECUs, but implies some probability of having to give back some
of those ECUs at the end of the experiment. In some tables, option B gives out a
certain amount of ECUs and some probability of getting some more ECUs at the end
of the experiment. You must choose the option (A or B) that you prefer.
Random drawIf you chose option B in which your payoff depends on chance, then you will have
to toss the 10-sided die. Each side of the die shows a number, between 0 and 90 in
steps of 10 (you can check that the die shows all possible numbers, 0, 10, 20, 30, 40,
50, 60, 70, 80, 90). The probability of gaining or losing ECUs that is defined in this
option will be compared with the outcome of this toss:
1. If the outcome of the toss is strictly less than the probability of loss/gain then
you will lose/gain some ECUs;
2. If the outcome of the toss is more or equal to the probability of loss/gain then
you will not lose/gain any ECUs.
EnvelopesAs explained before, you will get a payoff at the end of the experiment that depends
on what is in the envelope that you drew at the beginning of the experiment. There
were 88 envelopes, of which 44 relate to the second part of the experiment. If you
drew an envelope from those 44, then it will look as follows:
Option A: You get 37 ECUs
Option B: You get 52 ECUs but with probability 50%
you lose/gain 14 of those ECUs.Example: If you chose option B in this case, then you will have to toss the 10-sided
die. If the outcome of the toss is strictly less than 50, then you get 52-14=38 ECUs if
the loss was indicated or 52+14=66 ECUs if the gain was indicated. If the outcome of
the toss is more or equal to 50 then you get 52 ECUs.
35

C.3 Monetary and privacy lotteries
Table 8: Monetary lotteries (MPL tables 1 to 4)
(a) MPL table 1
Row Option A Option B1 You get 56 ECU You get 55 ECU, but with probability 30 %
you lose 10 of those ECU2 You get 55 ECU You get 55 ECU, but with probability 30 %
you lose 10 of those ECU3 You get 54 ECU You get 55 ECU, but with probability 30 %
you lose 10 of those ECU4 You get 53 ECU You get 55 ECU, but with probability 30 %
you lose 10 of those ECU5 You get 52 ECU You get 55 ECU, but with probability 30 %
you lose 10 of those ECU6 You get 51 ECU You get 55 ECU, but with probability 30 %
you lose 10 of those ECU7 You get 50 ECU You get 55 ECU, but with probability 30 %
you lose 10 of those ECU8 You get 49 ECU You get 55 ECU, but with probability 30 %
you lose 10 of those ECU9 You get 48 ECU You get 55 ECU, but with probability 30 %
you lose 10 of those ECU10 You get 47 ECU You get 55 ECU, but with probability 30 %
you lose 10 of those ECU11 You get 46 ECU You get 55 ECU, but with probability 30 %
you lose 10 of those ECU
(b) MPL table 2
Row Option A Option B1 You get 68 ECU You get 65 ECU, but with probability 30 %
you lose 30 of those ECU2 You get 65 ECU You get 65 ECU, but with probability 30 %
you lose 30 of those ECU3 You get 62 ECU You get 65 ECU, but with probability 30 %
you lose 30 of those ECU4 You get 59 ECU You get 65 ECU, but with probability 30 %
you lose 30 of those ECU5 You get 56 ECU You get 65 ECU, but with probability 30 %
you lose 30 of those ECU6 You get 53 ECU You get 65 ECU, but with probability 30 %
you lose 30 of those ECU7 You get 50 ECU You get 65 ECU, but with probability 30 %
you lose 30 of those ECU8 You get 47 ECU You get 65 ECU, but with probability 30 %
you lose 30 of those ECU9 You get 44 ECU You get 65 ECU, but with probability 30 %
you lose 30 of those ECU10 You get 41 ECU You get 65 ECU, but with probability 30 %
you lose 30 of those ECU11 You get 38 ECU You get 65 ECU, but with probability 30 %
you lose 30 of those ECU
(c) MPL table 3
Row Option A Option B1 You get 80 ECU You get 75 ECU, but with probability 30 %
you lose 50 of those ECU2 You get 75 ECU You get 75 ECU, but with probability 30 %
you lose 50 of those ECU3 You get 70 ECU You get 75 ECU, but with probability 30 %
you lose 50 of those ECU4 You get 65 ECU You get 75 ECU, but with probability 30 %
you lose 50 of those ECU5 You get 60 ECU You get 75 ECU, but with probability 30 %
you lose 50 of those ECU6 You get 55 ECU You get 75 ECU, but with probability 30 %
you lose 50 of those ECU7 You get 50 ECU You get 75 ECU, but with probability 30 %
you lose 50 of those ECU8 You get 45 ECU You get 75 ECU, but with probability 30 %
you lose 50 of those ECU9 You get 40 ECU You get 75 ECU, but with probability 30 %
you lose 50 of those ECU10 You get 35 ECU You get 75 ECU, but with probability 30 %
you lose 50 of those ECU11 You get 30 ECU You get 75 ECU, but with probability 30 %
you lose 50 of those ECU
(d) MPL table 4
Row Option A Option B1 You get 65 ECU You get 35 ECU, but with probability 30 %
you gain 30 additional ECU2 You get 62 ECU You get 35 ECU, but with probability 30 %
you gain 30 additional ECU3 You get 59 ECU You get 35 ECU, but with probability 30 %
you gain 30 additional ECU4 You get 56 ECU You get 35 ECU, but with probability 30 %
you gain 30 additional ECU5 You get 53 ECU You get 35 ECU, but with probability 30 %
you gain 30 additional ECU6 You get 50 ECU You get 35 ECU, but with probability 30 %
you gain 30 additional ECU7 You get 47 ECU You get 35 ECU, but with probability 30 %
you gain 30 additional ECU8 You get 44 ECU You get 35 ECU, but with probability 30 %
you gain 30 additional ECU9 You get 41 ECU You get 35 ECU, but with probability 30 %
you gain 30 additional ECU10 You get 38 ECU You get 35 ECU, but with probability 30 %
you gain 30 additional ECU11 You get 35 ECU You get 35 ECU, but with probability 30 %
you gain 30 additional ECU
36
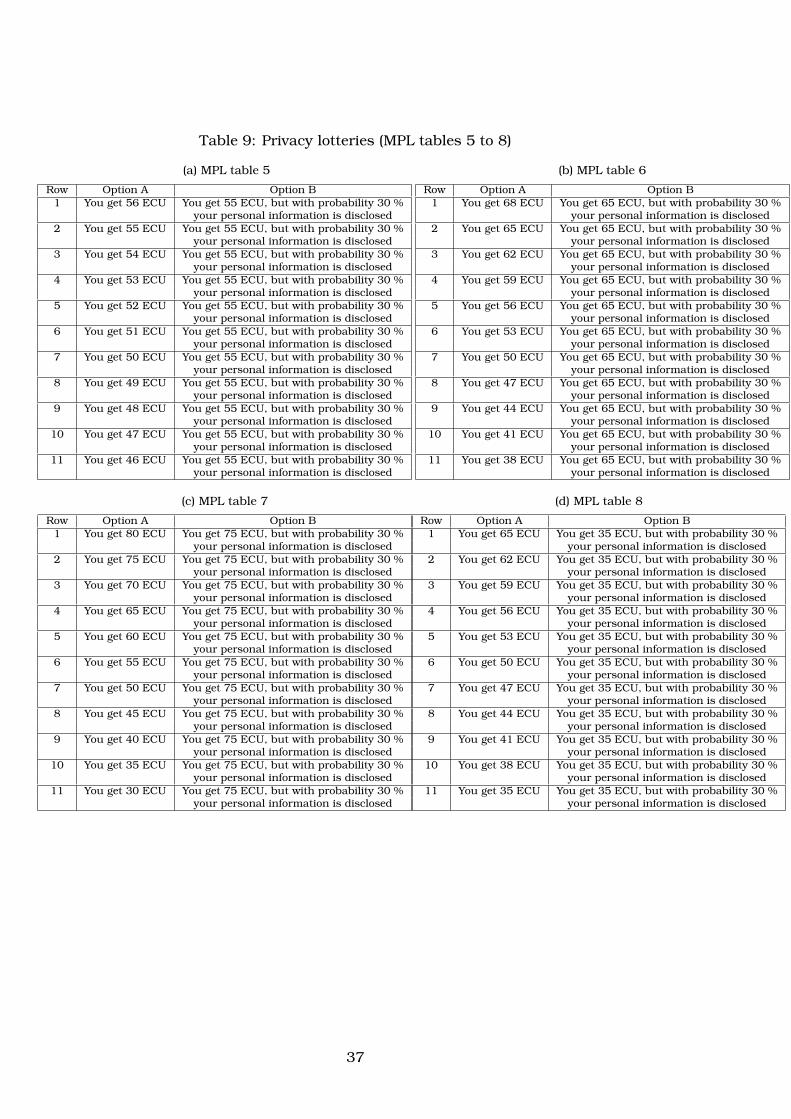
Table 9: Privacy lotteries (MPL tables 5 to 8)
(a) MPL table 5
Row Option A Option B1 You get 56 ECU You get 55 ECU, but with probability 30 %
your personal information is disclosed2 You get 55 ECU You get 55 ECU, but with probability 30 %
your personal information is disclosed3 You get 54 ECU You get 55 ECU, but with probability 30 %
your personal information is disclosed4 You get 53 ECU You get 55 ECU, but with probability 30 %
your personal information is disclosed5 You get 52 ECU You get 55 ECU, but with probability 30 %
your personal information is disclosed6 You get 51 ECU You get 55 ECU, but with probability 30 %
your personal information is disclosed7 You get 50 ECU You get 55 ECU, but with probability 30 %
your personal information is disclosed8 You get 49 ECU You get 55 ECU, but with probability 30 %
your personal information is disclosed9 You get 48 ECU You get 55 ECU, but with probability 30 %
your personal information is disclosed10 You get 47 ECU You get 55 ECU, but with probability 30 %
your personal information is disclosed11 You get 46 ECU You get 55 ECU, but with probability 30 %
your personal information is disclosed
(b) MPL table 6
Row Option A Option B1 You get 68 ECU You get 65 ECU, but with probability 30 %
your personal information is disclosed2 You get 65 ECU You get 65 ECU, but with probability 30 %
your personal information is disclosed3 You get 62 ECU You get 65 ECU, but with probability 30 %
your personal information is disclosed4 You get 59 ECU You get 65 ECU, but with probability 30 %
your personal information is disclosed5 You get 56 ECU You get 65 ECU, but with probability 30 %
your personal information is disclosed6 You get 53 ECU You get 65 ECU, but with probability 30 %
your personal information is disclosed7 You get 50 ECU You get 65 ECU, but with probability 30 %
your personal information is disclosed8 You get 47 ECU You get 65 ECU, but with probability 30 %
your personal information is disclosed9 You get 44 ECU You get 65 ECU, but with probability 30 %
your personal information is disclosed10 You get 41 ECU You get 65 ECU, but with probability 30 %
your personal information is disclosed11 You get 38 ECU You get 65 ECU, but with probability 30 %
your personal information is disclosed
(c) MPL table 7
Row Option A Option B1 You get 80 ECU You get 75 ECU, but with probability 30 %
your personal information is disclosed2 You get 75 ECU You get 75 ECU, but with probability 30 %
your personal information is disclosed3 You get 70 ECU You get 75 ECU, but with probability 30 %
your personal information is disclosed4 You get 65 ECU You get 75 ECU, but with probability 30 %
your personal information is disclosed5 You get 60 ECU You get 75 ECU, but with probability 30 %
your personal information is disclosed6 You get 55 ECU You get 75 ECU, but with probability 30 %
your personal information is disclosed7 You get 50 ECU You get 75 ECU, but with probability 30 %
your personal information is disclosed8 You get 45 ECU You get 75 ECU, but with probability 30 %
your personal information is disclosed9 You get 40 ECU You get 75 ECU, but with probability 30 %
your personal information is disclosed10 You get 35 ECU You get 75 ECU, but with probability 30 %
your personal information is disclosed11 You get 30 ECU You get 75 ECU, but with probability 30 %
your personal information is disclosed
(d) MPL table 8
Row Option A Option B1 You get 65 ECU You get 35 ECU, but with probability 30 %
your personal information is disclosed2 You get 62 ECU You get 35 ECU, but with probability 30 %
your personal information is disclosed3 You get 59 ECU You get 35 ECU, but with probability 30 %
your personal information is disclosed4 You get 56 ECU You get 35 ECU, but with probability 30 %
your personal information is disclosed5 You get 53 ECU You get 35 ECU, but with probability 30 %
your personal information is disclosed6 You get 50 ECU You get 35 ECU, but with probability 30 %
your personal information is disclosed7 You get 47 ECU You get 35 ECU, but with probability 30 %
your personal information is disclosed8 You get 44 ECU You get 35 ECU, but with probability 30 %
your personal information is disclosed9 You get 41 ECU You get 35 ECU, but with probability 30 %
your personal information is disclosed10 You get 38 ECU You get 35 ECU, but with probability 30 %
your personal information is disclosed11 You get 35 ECU You get 35 ECU, but with probability 30 %
your personal information is disclosed
37
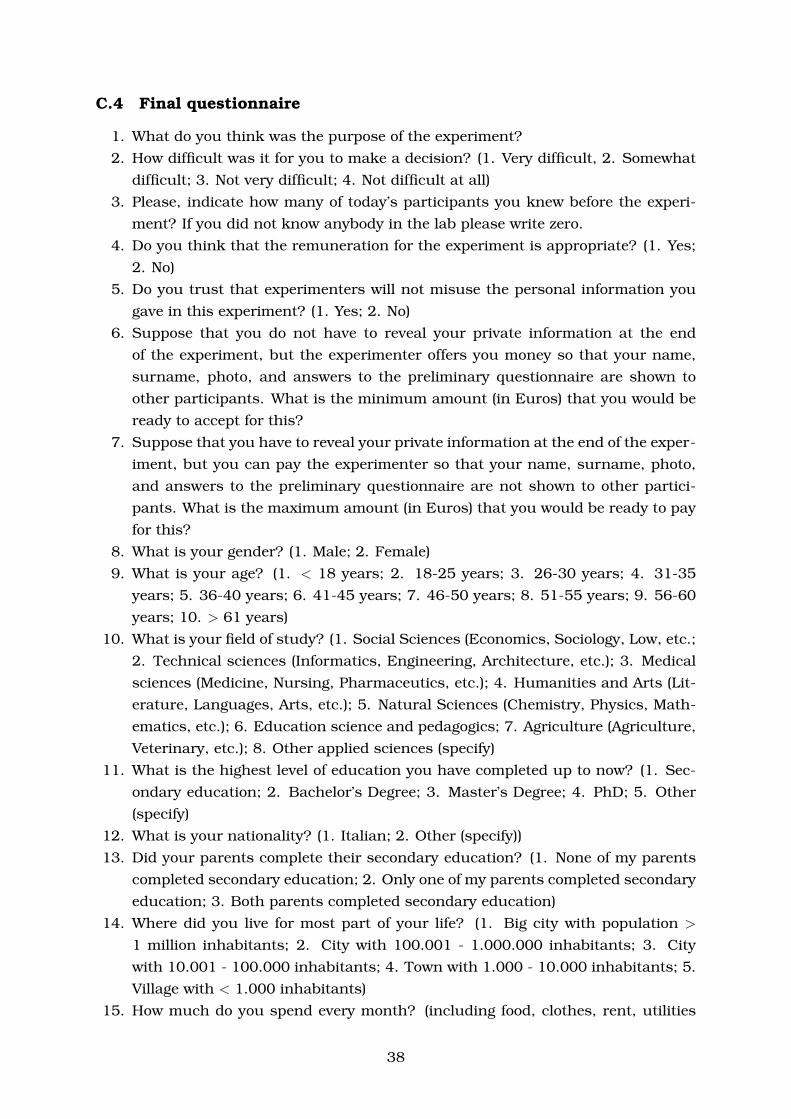
C.4 Final questionnaire
1. What do you think was the purpose of the experiment?
2. How difficult was it for you to make a decision? (1. Very difficult, 2. Somewhat
difficult; 3. Not very difficult; 4. Not difficult at all)
3. Please, indicate how many of today’s participants you knew before the experi-
ment? If you did not know anybody in the lab please write zero.
4. Do you think that the remuneration for the experiment is appropriate? (1. Yes;
2. No)
5. Do you trust that experimenters will not misuse the personal information you
gave in this experiment? (1. Yes; 2. No)
6. Suppose that you do not have to reveal your private information at the end
of the experiment, but the experimenter offers you money so that your name,
surname, photo, and answers to the preliminary questionnaire are shown to
other participants. What is the minimum amount (in Euros) that you would be
ready to accept for this?
7. Suppose that you have to reveal your private information at the end of the exper-
iment, but you can pay the experimenter so that your name, surname, photo,
and answers to the preliminary questionnaire are not shown to other partici-
pants. What is the maximum amount (in Euros) that you would be ready to pay
for this?
8. What is your gender? (1. Male; 2. Female)
9. What is your age? (1. < 18 years; 2. 18-25 years; 3. 26-30 years; 4. 31-35
years; 5. 36-40 years; 6. 41-45 years; 7. 46-50 years; 8. 51-55 years; 9. 56-60
years; 10. > 61 years)
10. What is your field of study? (1. Social Sciences (Economics, Sociology, Low, etc.;
2. Technical sciences (Informatics, Engineering, Architecture, etc.); 3. Medical
sciences (Medicine, Nursing, Pharmaceutics, etc.); 4. Humanities and Arts (Lit-
erature, Languages, Arts, etc.); 5. Natural Sciences (Chemistry, Physics, Math-
ematics, etc.); 6. Education science and pedagogics; 7. Agriculture (Agriculture,
Veterinary, etc.); 8. Other applied sciences (specify)
11. What is the highest level of education you have completed up to now? (1. Sec-
ondary education; 2. Bachelor’s Degree; 3. Master’s Degree; 4. PhD; 5. Other
(specify)
12. What is your nationality? (1. Italian; 2. Other (specify))
13. Did your parents complete their secondary education? (1. None of my parents
completed secondary education; 2. Only one of my parents completed secondary
education; 3. Both parents completed secondary education)
14. Where did you live for most part of your life? (1. Big city with population >
1 million inhabitants; 2. City with 100.001 - 1.000.000 inhabitants; 3. City
with 10.001 - 100.000 inhabitants; 4. Town with 1.000 - 10.000 inhabitants; 5.
Village with < 1.000 inhabitants)
15. How much do you spend every month? (including food, clothes, rent, utilities
38
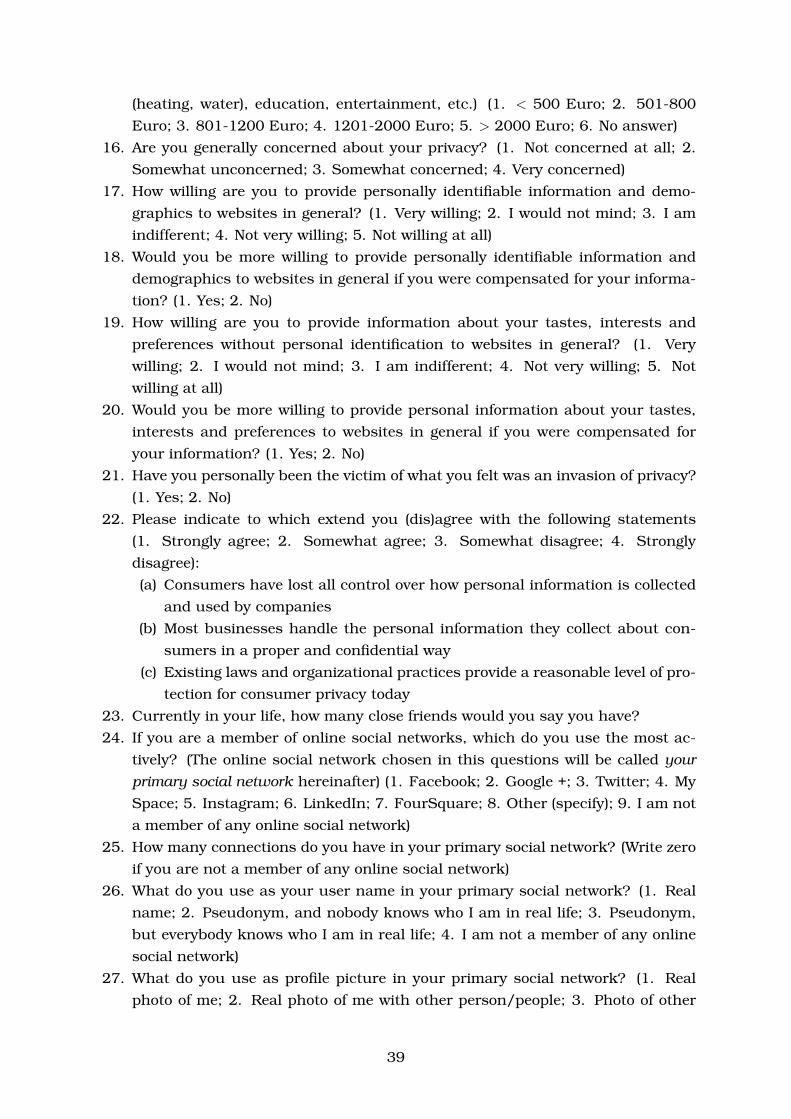
(heating, water), education, entertainment, etc.) (1. < 500 Euro; 2. 501-800
Euro; 3. 801-1200 Euro; 4. 1201-2000 Euro; 5. > 2000 Euro; 6. No answer)
16. Are you generally concerned about your privacy? (1. Not concerned at all; 2.
Somewhat unconcerned; 3. Somewhat concerned; 4. Very concerned)
17. How willing are you to provide personally identifiable information and demo-
graphics to websites in general? (1. Very willing; 2. I would not mind; 3. I am
indifferent; 4. Not very willing; 5. Not willing at all)
18. Would you be more willing to provide personally identifiable information and
demographics to websites in general if you were compensated for your informa-
tion? (1. Yes; 2. No)
19. How willing are you to provide information about your tastes, interests and
preferences without personal identification to websites in general? (1. Very
willing; 2. I would not mind; 3. I am indifferent; 4. Not very willing; 5. Not
willing at all)
20. Would you be more willing to provide personal information about your tastes,
interests and preferences to websites in general if you were compensated for
your information? (1. Yes; 2. No)
21. Have you personally been the victim of what you felt was an invasion of privacy?
(1. Yes; 2. No)
22. Please indicate to which extend you (dis)agree with the following statements
(1. Strongly agree; 2. Somewhat agree; 3. Somewhat disagree; 4. Strongly
disagree):
(a) Consumers have lost all control over how personal information is collected
and used by companies
(b) Most businesses handle the personal information they collect about con-
sumers in a proper and confidential way
(c) Existing laws and organizational practices provide a reasonable level of pro-
tection for consumer privacy today
23. Currently in your life, how many close friends would you say you have?
24. If you are a member of online social networks, which do you use the most ac-
tively? (The online social network chosen in this questions will be called yourprimary social network hereinafter) (1. Facebook; 2. Google +; 3. Twitter; 4. My
Space; 5. Instagram; 6. LinkedIn; 7. FourSquare; 8. Other (specify); 9. I am not
a member of any online social network)
25. How many connections do you have in your primary social network? (Write zero
if you are not a member of any online social network)
26. What do you use as your user name in your primary social network? (1. Real
name; 2. Pseudonym, and nobody knows who I am in real life; 3. Pseudonym,
but everybody knows who I am in real life; 4. I am not a member of any online
social network)
27. What do you use as profile picture in your primary social network? (1. Real
photo of me; 2. Real photo of me with other person/people; 3. Photo of other
39

person or celebrity; 4. Photo/image of non human being; 5. No photo at all; 6. I
am not a member of any online social network; 7. Other (specify))
28. What are your privacy settings in your primary social network? (1. Public.
Everybody can get access to my profile and read my entries; 2. Private. Only
my friends can get access to my profile and read my entries; 3. My profile and
entries are mostly public and partially private; 4. My profile and entries are
mostly private and partially public; 5. I have different accounts for public and
private entries; 6. I am not a member of any online social network; 7. Other
(please describe in details))
29. Did you ever change your privacy settings in primary social network? (1. Never;
2. I changed privacy settings immediately after registration; 3. I changed privacy
settings several times; 4. I changed privacy settings after someone misused my
personal information; 5. I am not a member of any online social network; 6.
Other (please describe in details))
30. Please, read the following statements and using the scale below rate how accu-
rately each statement describes you, as you generally are now, not as you wish
to be in the future. Apart from being anonymous, your responses will be kept in
absolute confidence. (1. Very Inaccurate; 2. Moderately Inaccurate; 3. Neither
Inaccurate nor Accurate; 4. Moderately Accurate; 5. Very Accurate)
(a) I am open about myself.
(b) I don’t talk a lot.
(c) I disclose my intimate thoughts.
(d) I show my feelings.
(e) I reveal little about myself.
(f) I talk about my worries.
(g) I bottle up my feelings.
(h) I prefer to deal with strangers in a formal manner.
(i) I act wild and crazy.
(j) I have little to say.
31. How do you see yourself: Are you generally a person who is fully prepared to
take risks or do you try to avoid taking risks? Please, indicate a number on the
scale from 0 to 10, where the value 0 means: Unwilling to take risks and the
value 10 means Fully prepared to take risk.
32. In different areas you can behave differently too. How would you assess your
risk tolerance with respect to the following areas (please, indicate a number on
the scale from 0 to 10, where the value 0 means: Unwilling to take risks and the
value 10 means Fully prepared to take risk).(a) in car driving
(b) in financial matters
(c) in leisure and sports
(d) in you professional career
(e) in your health
40

(f) in trusting strangers
33. “In general, one can trust people . . . ” (1. I totally agree; 2. I somewhat agree; 3.
I somewhat disagree; 4. I totally disagree)
34. “Nowadays one cannot rely on anyone . . . ” (1. I totally agree; 2. I somewhat
agree; 3. I somewhat disagree; 4. I totally disagree)
35. “When dealing with strangers it’s better to be careful before trusting them. . . ”
(1. I totally agree; 2. I somewhat agree; 3. I somewhat disagree; 4. I totally
disagree)
36. Do you think that the majority of people. . . (1. . . . would exploit you if they had
an opportunity; 2. . . . would try to be fair to you)
37. Do you think that people most of the times. . . (1. . . . try to be considerate of
others; 2. . . . follow their own interests)
D Summary of answers to the post-experimental question-naire
Mean SD Min Max
Part A: About the experimentQ2. Ease of understanding (0 verydifficult, 3 not difficult at all)
2.14 0.61 0 3
Q3. Number of known otherparticipants
1.28 1.31 0 5
Share which knew anotherparticipant (s)
66%
Q4. Appropriate remuneration (0 No,1 Yes)
70%
Q5. Trust experimenters (0 No, 1 Yes) 97%Q6. WTA, Euro 36.2 142 0 1000
WTA excluding outliers, Euro 16.1 25.4 0 200Q7. WTP, Euro 10 83.7 0 1000
WTP excluding outliers, Euro 1.92 4.85 0 30
Part B: DemographicsQ8. Males 66%Q9. Age 18-25 years, 94%; 26-30 years, 6%Q10. Field of study: Social sciences, 82%; Technical sciences, 10%; Humanities and
Arts, 5%; Natural sciences, 1%; Other 1%Q11. Education level: Secondary education 82%; Bachelor’s degree 15%; Master’s
degree 3%Q12. Italians 93%Q13. Parents completed secondaryeducation:
None of the parents, 16%; One of the parents, 25%; Bothparents, 59%
Q14. Size of city (inhabitants): > 1 million, 3%; 100 001 - 1 000 000, 16%; 10 001 - 100 000,49%; 1 001 - 10 000, 28%; < 1 000, 4%
Q15. Expenses per month: < Euro 500, 43%; Euro 501-800, 41%; Euro 801-1200, 11%;Euro 1201-2000, 1%; >Euro 2000, 0%; No answer, 4%
41
Mean SD Min Max
Part C: Privacy preferences, OSN activities and self-disclosureQ16. General privacy concern (0 notconcerned at all, 3 very concerned)
1.12 0.90 0 3
Q17. Willingness to provide PersonalIdentifying Information (“PII”) towebsites (0 very willing, 4 not willingat all)
2.68 0.91 0 4
Q18. Provide PII to websites ifcompensated (0 No, 1 Yes)
57%
Q19. Willingness to provideinformation about tastes, interestsand preferences to websites (0 verywilling, 4 not willing at all)
1.57 1.18 0 4
Q20. Provide information abouttastes, interests and preferences ifcompensated (0 No, 1 Yes)
86%
Q21. Victim of privacy invasion (0 No,1 Yes)
34%
Q22. Westin’s Privacy Index 0: Unconcerned, 44%; 1: Pragmatist, 28%; 2: Fundamentalist,28%
Q23. Number of close friends offline 6.37 4.79 1 30Q24. Primary online social network(POSN)
Facebook, 80%; Google+, 2%;, Twitter, 1%; Pinterest, 1%;LinkedIn, 1%; Instagram, 10%; Not a member, 5%
Q25. Number of connections in POSN 545 488 0 3200Q26. Name in POSN (if use) Real name, 94% ; Pseudonym, and nobody knows who I am in
real life, 2%; Pseudonym, but everybody knows who I am in reallife, 4%
Q27. Profile picture in POSN (if use) Real photo, 74%; Real photo with other people, 19%; Photo ofother person, 2%; Image of non human being, 4%; No photo atall, 1%
Q28. Privacy settings in POSN (if use) Public, 13%; Private, 57%; Mostly public, 11%; Mostly private,19%
Q29. Changed privacy settings inPOSN (if use)
Never, 15%; Immediately after registration, 34%; Several times,48%; After misuse, 3%; Other, 1%
Q30. Self-disclosure index -1.86 3.61 -13 10
Part D: Attitudes to risk and trustQ31. General risk attitude (0 averse,10 risk -seeking)
5.91 1.6 1 10
Q32. Risk attitude in: (0 averse, 10risk-seeking)
Driving 3.6 2.66 0 10Finance 4.28 2.31 0 10Sports 6.69 2.18 0 10Career 4.63 2.34 0 10Health 3.03 2.65 0 10Trusting strangers 4.41 2.54 0 10
Q33. Trust people (0 agree, 3 disagree) 1.6 0.71 0 3Q34. Cannot rely on people (idem) 1.82 0.72 0 3Q35. Should not trust strangers(idem)
0.85 0.65 0 3
42

Mean SD Min Max
Q36. People try to be fair (0 No, 1 Yes) 33%Q37. People follow their own interests(idem)
83%
43


![Linguistic Content and Explanatory Psychological Content...Citation: Roberts, Gavin James (2013) Linguistic Content and Explana-tory Psychological Content. [Thesis] (Unpublished) c](https://static.fdocuments.net/doc/165x107/60c5d3015d283f5d3100770b/linguistic-content-and-explanatory-psychological-content-citation-roberts.jpg)


