Multidimensional Measures of Poverty &...
38
Multidimensional Measures of Poverty & Well-being 1 Report Working Paper of Sabina Alkire Moizza Binat Sarwar Oxford Poverty & Human Development Initiative (OPHI) Oxford Dept of International Development, Queen Elizabeth House University of Oxford January 2009 1 This working paper has been written in the context of the report "An Agenda for a reformed Cohesion Policy". It represents only the opinion of the experts and does not necessarily reflect the views of the European Commission.
Transcript of Multidimensional Measures of Poverty &...
Multidimensional Measures of Poverty & Well-being1
Report Working Paper of
Sabina Alkire Moizza Binat Sarwar
Oxford Poverty & Human Development Initiative (OPHI) Oxford Dept of International Development, Queen Elizabeth House
University of Oxford
January 2009
1 This working paper has been written in the context of the report "An Agenda for a reformed Cohesion
Policy". It represents only the opinion of the experts and does not necessarily reflect the views of the European Commission.
2
TABLE OF CONTENTS
SECTION I INTRODUCTION............................................................................... 3
SECTION II: A BRIEF HISTORY OF MULTIDIMENSIONAL APPROACHES .......... 6
II.1 Physical Quality of Life Index (PQLI).............................................................. 6
II.2 Human Development Index (HDI) .................................................................... 7
II.3 Basic Needs Approach (BNA) ......................................................................... 8
II.4 Integrated Rural Development (IRD)................................................................ 9
II.5 Integrated Development Programmes (IDP) and Community Driven Development (CDD) ......................................................................................... 9
SECTION III: CASE STUDIES ....................................................................................... 10
III.1 Mexico 11
III.2 Philippines ....................................................................................................... 12
III.3 India 14
III.4 Bhutan ............................................................................................................... 16
III.5 Bolivia ............................................................................................................... 17
III.6 The United Kingdom (UK) and South Africa ................................................. 19
SECTION IV. COMMON THEMES................................................................................ 23
IV.1 Motivation ......................................................................................................... 24
IV.2 Choice of Dimensions & Indicators.................................................................. 25
IV.3 Support & Coordination.................................................................................... 28
IV.4 Changes through time...................................................................................... 30
IV.5 Establishment of Standards ............................................................................. 30
IV.6 Aggregation Methodologies.............................................................................. 31
IV.7 Uses & results.................................................................................................. 32
IV.8 Public Debate .................................................................................................... 33
SECTION V. CONCLUSION........................................................................................... 34
BIBLIOGRAPHY ............................................................................................................. 35
3
Section I INTRODUCTION
Overview: This paper surveys current interest in and adoption of multidimensional approaches to poverty and well-being by governmental and intergovernmental actors in developing and developed countries. It identifies crucial issues that are still to be resolved, and also illustrates the different policy contexts in which multidimensional measures are relevant.
The past few years have seen a surge in mainstream multidimensional approaches to poverty and well-being in countries at variable levels of economic development as poverty reduction becomes a shared mandate across the world. In the academic literature, this trend can be seen for example in the two volumes on multidimensional poverty edited by Kakwani and Silber (2008) as well as the proliferation of empirical papers on multidimensional poverty and inequality in traditional journals. In the policy environment, examples of a mainstream interest in multidimensional approaches are exemplified by the Sarkozy commission’s sub-group on Quality of Life measures called the Commission On the Measurement of Economic Performance and Social Progress (CMEPSP).2 The unprecedented level of attention that the OECD’s project on Measuring the Progress of Societies achieved early on from many stakeholders, ranging from international institutions to think tanks to academic bodies to governments and NGOs, testifies to the broad appeal of wider-than-economic representations of human progress.3 At the level of international institutions, since 1997 the World Bank has viewed poverty as a multidimensional phenomenon. The United Nations Development Programme has begun consultations to inform its 2010 report Re-thinking Human Development that will almost certainly include a multidimensional measure to complement the Human Development Index (HDI).
The impetus to develop a multidimensional framework has a range of diverse sources, which gives it a distinctive strength and stability. Amartya Sen, Robert Fogel, and other leading social scientists have given a normative account of the need for broader approaches, while Inglehart, Kahnemann, Layard and others have documented the lack of satisfaction resulting from development based on income alone. At the same time, empirical research has clarified the reach and limitations of income-based measures as well as the flaws in foundational assumptions regarding human preferences and behaviours. In practical terms, relevant data sources have expanded greatly, and better computer infrastructure enables better multidimensional analyses. In terms of policy space, the launch of the Millennium Development Goals (MDGs) in the year 2000 drew attention to eight interconnected aspects of human suffering and achievement which have formed the basis of campaigns that are ongoing in many countries. National and international interest in multidimensional measures of poverty and well-being may be sharpened post Sept 15 2009 (this is less certain), as the economic downturn may lend a political incentive to focus on dimensions of well-being that can grow even during economic recession.
2 http://www.stiglitz-sen-fitoussi.fr/en/index.htm This sub-group is chaired by Alan Kreuger and reports
to the co-chairs of the Commission, Joe Stiglitz and Amartya Sen. 3 http://www.oecd.org/pages/0,3417,en_40033426_40033828_1_1_1_1_1,00.html

4
Regardless of what motivates the interest of different kinds of actors, at national and international levels, in implementing a multidimensional measure of poverty or well-being, any actor will face a similar set of questions and problems:
– Choice of Unit of Analysis (person, household, community, institution)
– Choice of Order of analysis (first across people, or first across dimensions)
– Choice of Dimensions
– Choice of Variables/Indicator(s) for dimensions
– Choice of Cutoffs for each indicator/dimension (if relevant)
– Choice of Weights for indicators within dimensions (if relevant)
– If more than one indicator per dimension, aggregation within dimensions
– Choice of Weights across dimensions
– Identification method (if relevant)
– Aggregation method – across dimensions and possibly within
– Incorporation of inequality or of distributional weights (if relevant)
A traditional approach to a measure of poverty or quality of life is typically based on the net monetary income of a household unit, or on their consumption. For poverty, a traditional approach defines a person as poor if their income is below a poverty line. The poverty line may be subjective, objective, or hybrid. It is often established at a nationally determined level based on a food or consumption basket or as a percentage of the mean or median overall income distribution. Apart from income, other monetary measures of poverty include consumption-expenditure spending as well as savings. Similarly, traditional measures consider the quality of life of a person or nation in terms of their aggregate income or consumption.
A multidimensional approach moves away from the traditional unidimensional approach by arguing against the focus on a single dimension – in particular a monetary dimension – as a sufficient proxy of human welfare. The difficulties in using a single dimension such as income include debates on the extent to which income can translate into utility universally; the heterogeneity of people and contexts in converting income to utility; the role and contribution of the public sector; political limitations and problems such as the effects of incomplete markets. These issues have been highlighted by academic researchers since the 1960s in a range of arguments to broaden the view of societal welfare beyond economics (Seers 1971, Sen 1980, 1987).
The 1960s saw a movement in Europe towards the development of social indicators as a way of moving beyond the income measure (Atkinson et al 2002) by shifting focus from the means to the end of economic activities. Social indicators became an important instrument in measuring “outcomes” as opposed to inputs, thereby enabling assessment of the level of a country’s development as well as of the impact of its policies on human welfare. To date some form of non-monetary measurement of living standard exists in most developed and developing countries.

5
Atkinson et al (2002) classify the social indicators used most commonly in European member states along the following seven dimensions: financial, education, employment, health, social participation and housing. The trend towards social indicators has been underpinned by the work carried out by the European Commission. Globally, international agencies such as the World Bank, USAID, UNRISD, OECD, WHO, UNICEF, and UNDP have contributed to the development of social indicators.
In recent past the debate on “means” and “ends” in the context of developing countries has been dominated by Amartya Sen’s (1992, 1996, 1999) capability approach. Given the criticism of income as a proxy of human welfare, Sen proposed that human well-being should be measured directly, by looking at the capabilities of people, what they are able to do and be. These constitute the ‘ends’ of development (and economic growth is and should be evaluated in so far as it is an efficient and effective means to those ends). Such capabilities are defined as the freedoms that people value (intrinsically) and have reason to value. As such, they cannot be imposed from an external source but nor are they fully relative to each person; rather the identification of the key freedoms for any community is an appropriate topic for public discussion and debate. The capability approach is a multi-dimensional approach to poverty and well-being that provides an overarching picture of a society by moving beyond merely combining results from economic and social sectors to provide a picture of poverty and quality of life that is framed in terms of the valuable freedoms people enjoy and lack.
Although Sen’s capability approach focuses on the ‘ends’ of development, it is also vitally concerned with the identification of efficient ‘means’. From a policy perspective, this means responding to analyses of the interconnections between different dimensions of deprivation that serve to accentuate poverty for those who are trapped with multiple deprivations, or to accelerate progress for when certain high impact dimensions are targeted. The extent to which expansion of one dimension is instrumental to (hence catalyses) advances in another dimension, is a topic of key interest in Sen (1999) due to the need for efficient intervention in addressing interconnected dimensions. Sen (1999) has identified five instrumental freedoms which are particularly relevant to economic development achievements: political freedom, economic facilities, social opportunities, transparency, and security.
The capability approach is extremely attractive in its focus on human outcomes, like most multidimensional approaches. Further it is open-ended, and thus flexible as to the dimensions that should be included in measurement of welfare; how those dimensions should be chosen; the relative weights assigned to each dimension and ultimately the cut off point to identify deprivation. Countries, NGOs, businesses, and other institutions are encouraged to tailor multidimensional measures to suit their particular purposes and abilities. In the interest of examining how these issues have been handled in practice, this paper surveys the current interest in and adoption of multidimensional approaches to poverty and well-being by government and inter-governmental actors in developed and developing countries. By studying a number of cases in which different countries and actors have developed international multidimensional measures, the paper will identify crucial areas of consensus as well as critical issues that are still to be resolved in multidimensional measurement.
6
Section II: A Brief History of Multidimensional Approaches
This section will identify forms of multidimensional approaches that were implemented in the past, and will draw out the main challenges arising from those experiences. It is recognized that other multidimensional approaches have existed in different countries at different levels of government that this paper does not discuss. However for the purposes of this paper, the selection of approaches is restricted to those measures that were developed and gained popularity in a number of countries in the 1970s and 1980s. These approaches are discussed because of the extent to which they were adopted by different countries so as to identify the main challenges on a scale wider than that provided by a single instance. The five main approaches discussed here are as follows:
1. Physical Quality of Life Index (PQLI): The PQLI measured the quality of life in a country by combining the average of three statistics (basic literacy rate, infant mortality, and life expectancy at age one) that are all equally weighted on a 0 to 100 scale.
2. Human Development Index (HDI): The HDI is used to rank countries. The index measures quality of life as a weighted combination of three domains (life expectancy (health), literacy & educational attainment (education), and GDP per capita (income)).
3. Basic Needs Approach (BNA): The BNA expanded the needs included in the measurement of poverty (e.g. consumption of food, shelter, clothing, and access to such essential public services as pure water, sanitation, public transport, health, and education). However the approach did not specify a priori how they were to be chosen or the way in which they were to be weighted.
4. Integrated Rural Development (IRD): This approach focused on small and medium level farmers, and aimed to bring them beyond subsistence farming by implementing a holistic set of interventions. It was primarily implemented in developing countries.
5. Integrated Development Programmes/Planning(IDP): The IDP was primarily an area-based approach that was implemented to decentralize decision – making and spending at the local level to fight local level poverty.
II.1 Physical Quality of Life Index (PQLI)
The Physical Quality of Life Index (PQLI) was developed by David M. Morris in 1979. It combined information on life expectancy, infant mortality and literacy and was a precursor of the HDI (which has different dimensions as discussed below). Similar to the HDI this method gives equal weights to the attributes of the composite index under the assumption that they are equally important in capturing the defined aspects of the concept.
7
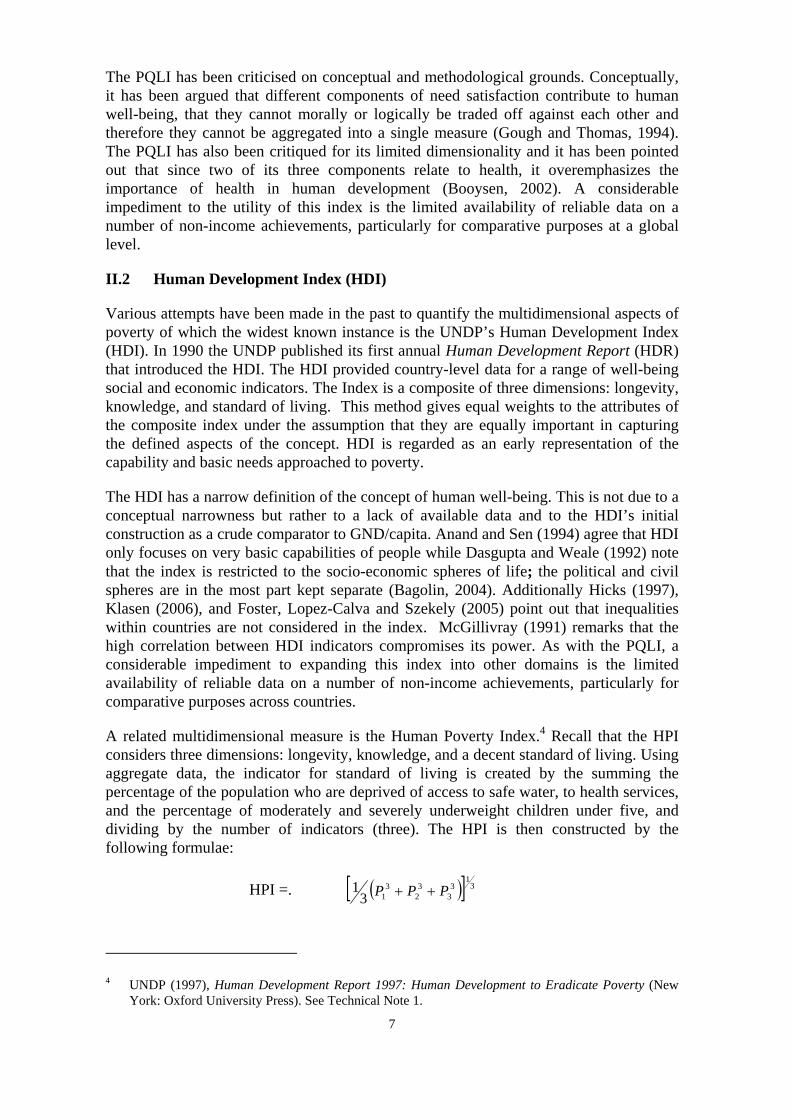
The PQLI has been criticised on conceptual and methodological grounds. Conceptually, it has been argued that different components of need satisfaction contribute to human well-being, that they cannot morally or logically be traded off against each other and therefore they cannot be aggregated into a single measure (Gough and Thomas, 1994). The PQLI has also been critiqued for its limited dimensionality and it has been pointed out that since two of its three components relate to health, it overemphasizes the importance of health in human development (Booysen, 2002). A considerable impediment to the utility of this index is the limited availability of reliable data on a number of non-income achievements, particularly for comparative purposes at a global level.
II.2 Human Development Index (HDI)
Various attempts have been made in the past to quantify the multidimensional aspects of poverty of which the widest known instance is the UNDP’s Human Development Index (HDI). In 1990 the UNDP published its first annual Human Development Report (HDR) that introduced the HDI. The HDI provided country-level data for a range of well-being social and economic indicators. The Index is a composite of three dimensions: longevity, knowledge, and standard of living. This method gives equal weights to the attributes of the composite index under the assumption that they are equally important in capturing the defined aspects of the concept. HDI is regarded as an early representation of the capability and basic needs approached to poverty.
The HDI has a narrow definition of the concept of human well-being. This is not due to a conceptual narrowness but rather to a lack of available data and to the HDI’s initial construction as a crude comparator to GND/capita. Anand and Sen (1994) agree that HDI only focuses on very basic capabilities of people while Dasgupta and Weale (1992) note that the index is restricted to the socio-economic spheres of life; the political and civil spheres are in the most part kept separate (Bagolin, 2004). Additionally Hicks (1997), Klasen (2006), and Foster, Lopez-Calva and Szekely (2005) point out that inequalities within countries are not considered in the index. McGillivray (1991) remarks that the high correlation between HDI indicators compromises its power. As with the PQLI, a considerable impediment to expanding this index into other domains is the limited availability of reliable data on a number of non-income achievements, particularly for comparative purposes across countries.
A related multidimensional measure is the Human Poverty Index.4 Recall that the HPI considers three dimensions: longevity, knowledge, and a decent standard of living. Using aggregate data, the indicator for standard of living is created by the summing the percentage of the population who are deprived of access to safe water, to health services, and the percentage of moderately and severely underweight children under five, and dividing by the number of indicators (three). The HPI is then constructed by the following formulae:
HPI =. ( )[ ] 31
33
32
313
1 PPP ++
4 UNDP (1997), Human Development Report 1997: Human Development to Eradicate Poverty (New
York: Oxford University Press). See Technical Note 1.
8
Where P1 is the percentage of people not expected to survive to the age of 40, P2 is the percentage of adults who are illiterate, and P3 is the standard of living index described above. The HPI differs from HDI by applying poverty cutoffs, by including distinctive set of indicators and using a general means. However like the HDI, it is limited in the scope of dimensions that enter, and hence in the reach of its relevance.
II.3 Basic Needs Approach (BNA)
The Basic Needs Approach (BNA) was a response in the late 1970s to the idea that monetary growth – economic and income – alone would promote human well-being through a trickle down effect. BNA promoted the construction of selective policies to target basic needs of the whole population directly, rather focussing on an indirect approach to satisfying basic human needs. At the basic level, the BNA included the satisfaction of minimum levels of material needs such as consumption of food, shelter, clothing, and access to such essential public services as pure water, sanitation, public transport, health, and education. Under this approach a direct attack on the basic needs of a population was considered cost effective and speedy as well as a mechanism of redistribution of social products by aiming at a direct satisfaction of the most urgent needs of the poor (Streeten, 1982, Stewart 1985). The implications of BNA for public finances and inequality meant that in the era of debt crisis, the imposition of structural adjustment programmes (SAPs) overtook the BN approach and became the prominent method of development particularly in developing countries. (Stewart, 2006)
Structural criticisms levelled against BNA were largely conceptual:
• Basic needs are difficult to quantify, and the trade-offs between improving income equality and reducing savings for investment were not considered sufficiently. (Bagolin, 2004).
• BNA incorporated arbitrary assumptions about human nature (assuming particular western cultural values) and about social change following a universal, linear pattern of development. (Gough and Thomas, 1994).
• Some operational forms of BNA were exclusively focused on resources and inputs, and this particular form overlooked people’s varying abilities to convert resources into what Sen later called ‘functionings’.
• It was not quite clear how the BNA included participation and freedom (Streeten 1984, Sen 1984).
However, Stewart and others point out that the concept of basic needs was internally contested. While some groups did indeed focus on commodity possession, the basic human needs approach focused not on resources but on providing the opportunity for all to have a full life, emphasising the poor (Haq, 1998; Alkire, 2001).
A variation of the BNA approach that has been adopted in a number of countries (e.g. Nicaragua and Bolivia) is the unsatisfied basic human needs (UBN) approach that measures poverty in terms of peoples’ access to basic needs (e.g. housing, basic services, health and education. As with any aggregate method of poverty measurement criticisms of this method often focus on the weights assigned to the chosen needs as well as the method in which basic needs of poor people (an essentially subjective manner) were determined. (Thiele, 2001)
9
II.4 Integrated Rural Development (IRD)
The Integrated Rural Development (IRD) approach became popular in the 1970s and was fuelled by substantial donor allocations during the 1970s and 1980s. IRD was a holistic way to improve well-being in a community unit along social, economic and environmental dimensions. The approach drew on systems thinking, an emphasis on local participation and community ownership, and on observations that economic growth was not necessarily benefiting the rural poor directly. It recognised the complementarity of, and interconnections between, different development objectives. The aim of the programmes carried out under IRD was to assist small and medium level farmers to produce marketable goods that were non-agricultural and moved farmers beyond the level of subsistence farming. At the same time, in some contexts, a parallel move was made to encourage investment and support for agricultural exports to increase returns to farmers (Brohman, 1996). Typically IRD programmes included activities such as increasing agricultural productivity, farm and non-farm employment and income-generation, physical and social infrastructure development (schools, clinics, roads), social and food security, drought and floods mitigation.
While there were some outstanding IRD successes, the barrier seemed to be their scaling up. Too little was invested in the managerial and institutional development, hence project evaluations reported unsustainable and unsatisfactory performance of IRD efforts. While contextual features varied widely, the main shortfalls drawn from IRD experiences in various parts of the world were (USAID, 2005):
• IRD approaches tended to become supply-driven because of the top down method of implementation.
• IRD projects by-passed official agencies to set up their own units for efficiency purposes but this negatively affected sustainability of the programme beyond the donor’s involvement, and did not build local institutions
• There was little interaction, evaluation and training of the social and institutional capital existing in the community therefore negatively affecting operational issues once donor involvement with the project ended.
• The projects allowed state intervention in all sectors of agricultural farming from circulation to distribution while avoiding the vital issue of land distribution thus allowing paternalistic relations to emerge and impeding the sustainability of the exercise.
II.5 Integrated Development Programmes (IDP) and Community Driven Development (CDD)
The Integrated Development Programmes (IDP) and Community Driven Development (CDD) programmes are both primarily an area based approach implemented in a number of developing countries. At the official and state level, IDP was pioneered by the South African government as a key instrument of poverty reduction in its post-apartheid policy and remains in force. The IDP in South Africa includes a development plan of 5 years for each municipality. It is participatory in that it aims to involve all stakeholders in the municipality in planning the development of the area and looks at economic, social and environmental development as a whole. An IDP sets a framework for the long term
10
development of the area by planning the allocation and investment of its resources (infrastructure and personnel) to different areas of development in accordance with the vision for that particular sphere e.g. land management. IDPs were made obligatory under the 2000 Municipals Systems Act that makes it mandatory for every local government to design explicit development strategies for poverty reduction. Although IDPs have had limited success in alleviating poverty by a large margin they have been somewhat effective particularly in providing access to basic services. The participatory nature of IDP plans has also been questioned as plans have been criticized for not reflecting community needs and aspirations (Alebiosu, 2006). However, the IDP seems to be a promising approach that continues many of the positive features of IRD (recognizing the complementarity between interventions, drawing on both community participation and systems thinking), but has a more realistic appreciation of the need to strengthen institutions and develop long-term systems of accountability. Similar comments might be made of quite a few of the CDD projects funded by the World Bank and other donors. CDD projects (called CAP in Africa) draw on the energetic participation of local actors at all stages of the project, and yet provide funds for economic and social development, and for the strengthening of leadership and institutions.
This thumbnail sketch of multidimensional initiatives is of necessity incomplete. A full history of multidimensional approaches would need to mention the many community development and participatory approaches, sustainable livelihoods, women in development/gender and development and the sequence of activities to empower women, micro-credit activities that are set into a broader development initiative, social protection and safety net activities, and so on. However this section has at least indicated that many different approaches to development policy and measurement consciously have chosen to focus on multiple variables of interest. More sophisticated methods of measurement are, however, quite a recent phenomenon as we shall see, and depend both upon the increase in data and in the computational power available.
Section III: Case Studies
This section presents a limited set of case studies of countries and actors that have recently developed multidimensional measures of poverty or well-being, to better represent their objectives. The aim of the section is to provide a flavour of the current interest in and adoption of multidimensional approaches to poverty and well-being by government and inter-governmental actors in developed and developing countries. We will also identify crucial areas of consensus across the spectrum of countries, the common dilemmas in design and implementation as well as critical issues that are still to be resolved in multidimensional measurement.
The case studies have been selected on the basis of two criteria, namely, a) countries at widely differing levels of economic development to provide a balanced picture of the way multidimensional approaches originate and are designed and implemented in countries with varying levels of economic strength and b) countries at varying stages of developing and utilising a multidimensional approach to show the different stakeholders involved in the development of a measure in the past and in the present in order to highlight the roles that can be played by different agencies in furthering a multidimensional approach to poverty.
We discuss seven country case studies
11
1. Mexico: According to Article 36 from the General Law of Social Development (GLSD), Coneval (within the Government of Mexico) has the attribution and obligation to establish the guidelines and criteria for a multidimensional definition, identification and measurement of poverty. The case study looks the impetus for the law and the steps Mexico has taken since then to develop a multidimensional measure.
2. Philippines: This case study examines the features of Community-Based Monitoring System (CBMS), one of the tools developed in the Philippines in the early 1990s to (amongst other aims) facilitate the implementation of targeted poverty reduction programs and monitor and evaluate poverty reduction programmes.
3. India: In 2002, India began to identify families below the poverty line according to a multidimensional survey and in 2008 the Planning Commission announced the intention to develop an index of multiple deprivation.
4. Bhutan: Under the leadership of the 4th King, Bhutan had begun efforts to construct a quantitative measure of Gross National Happiness, its unique poverty measure. The index was released in November 2008. The case study examines how Bhutan has operationalized GNH in quantitative terms.
5. Bolivia: The current Government of Bolivia has declared that its aim is to improve people’s ability ‘to live well’ and this section examines what the term signifies for poverty measurement and the process it entails in designing in a poverty measure.
6. United Kingdom and 7. South Africa: The Governments of South Africa and the UK have both developed an index of multiple deprivation, which uses census and administrative data, in the case of the UK, and survey data, in the case of South Africa. The case studies observe the nature of the index as well as the uses of the data in mapping differences in deprivation across local areas.
Each of the case studies is structured as follows. We begin with a brief history of multidimensional poverty measurement with an emphasis on specific government directives and action in each country. The case study then discusses details of the measure (e.g. dimensions and indicators) where it has been developed as in use; in cases where it is not applicable the case study discusses the current work being done towards the development of a measure. Details of dimensions and indicators as well as the method of implementation and the use of results are then discussed in further detail in Section IV.
III.1 Mexico
In 2000, the Mexican Congress passed a law that required an annual evaluation of all programmes conducted by the Federal Executive Brach to ensure accountability of public programmes. In 2001, the Under Secretary for Planning and Social Evaluation (SEDSOL) was created to fulfil this objective.
In the same year SEDESOL established a committee of experts called the Technical Committee on Poverty Measurement (CTMP) to develop an official methodology for measuring poverty in the country. Based on methodology proposed, in 2002 SEDESOL
12
published the first official measurement for the year 2000 which established three poverty concepts: food poverty, capacities poverty and patrimony poverty by institutionalizing the Foster-Greer-Thorbecke (1984) poverty measure, using non-equivalized income, having the household as the recipient unit, and the expenditure survey (ENIGH) as the main data source.
“Food poverty takes into account the population without enough income to buy a basic food basket: the poverty of capacities considers the population without enough income to simultaneously satisfy their needs for food, health and education: the poverty of patrimony considers the population without enough income to satisfy food, health, education, shelter, public transport, clothing and footwear needs.” (Corona, 2007)
Based on this methodology further measurements were published for 2002 and 2004, 2005 and 2006.
In 2006, the Mexican government published the General Law of Social Development (GLSD). One of its main objectives is to create a National Social Development System to design, monitor and evaluate social policy and programs and SEDSOL was formalized with the creation of the National Council for the Evaluation for Social Policy (CONEVAL) in 2006 under the new law. CONEVAL has two important tasks: a) the evaluation of social policies and programmes and b) the measurement of multidimensional poverty at the national, state and municipal levels. According to Article 36 from the GLSD, CONEVAL within the Government of Mexico has the attribution and obligation to establish the guidelines and criteria for a multidimensional definition, identification and measurement of poverty. Measures of multidimensional poverty are to be constructed at least every two years at the federal and state levels, and every five years at the municipal levels.
The new multidimensional poverty measure by law must include income poverty, as well as seven other dimensions, some of which are considered social rights: health, food security, education, housing, services, social security, and social cohesion. In fact, as social cohesion diverges from the other indicators both in the unit of analysis (community rather than individual) and direction (social cohesion may be quite high among poorer indigenous groups and very low in wealthy urban areas), the measure will include the first 8 domains, and consider social cohesion separately. In 2007, the Government of Mexico commissioned 5 economic teams to propose the indicators and indexing methodology for a new measure. In 2008, the Government of Mexico subjected their proposed methodology to a national expert review and an international expert review. The final methodology is expected to be announced in early 2009.
III.2 Philippines
As part of the Social Reform Agenda (SRA) in the 1990s, the government of Philippines initiated steps to monitor and track poverty as an integral part of managing the eradication of poverty. Data collected at the national level was deemed too aggregate to be of utility to local governments that need disaggregated information for diagnosing poverty at the local level and identifying appropriate interventions. Additionally limited financial resources indicated a need to move away from costly surveys to a different form of data collection that would inform more efficient and targeted programmes for poverty reduction in the Philippines. The need for a diagnostic tool for monitoring poverty trends in different areas gave birth to the Community Based Monitoring System (CBMS). The

13
programme collects census data on a minimum set of 14 Core Local Poverty Indicators and has considerable government support at all levels. In an en banc resolution of the National Anti-Poverty Commission (NAPC) in March 2003, local government units (LGUs) were directed to adopt the core local poverty indicators (CLPI) as a minimum set of community based information for poverty diagnosis and planning and to further integrate such information into their local poverty monitoring systems to be used in the preparation of local level action plans and programmes.
The costs of implementation of CBMS in these localities have been borne largely by the local government units, indicating their support of the system. In 2005, other stakeholders have started to contribute to the implementation of CBMS. Information is collected through surveys of all households in the community. The local people themselves are data collectors and processors. CBMS uses LGU personnel as monitors and is flexible enough to incorporate LGU specific indicators5. The core indicators are categorized under the eight (8) major dimensions of poverty such as: 1) health; 2) nutrition; 3) shelter; 4) water and sanitation; 5) basic education; 6) Income; 7) employment; and 8) peace and order. LGUs may add other indicators or use proxy indicators to monitor area-specific concerns. The list of core indicators- largely output and impact indicators - is as follows:
1. Proportion of child deaths aged 0-5 years
2. Proportion of women deaths due to pregnancy related causes
3. Proportion of malnourished children aged 0-5
4. Proportion of households living in makeshift housing
5. Proportion of households who are squatters
6. Proportion of households with no access to safe water supply
7. Proportion of households with no access to sanitary toilet facilities
8. Proportion of children 6-12 years old not in elementary schools
9. Proportion of children 13-16 years old not in secondary school
10. Proportion of households with income below poverty threshold
11. Proportion of households with income below subsistence threshold
12. Proportion of households who experienced food shortage
13. Proportion of persons who are unemployed
14. Proportion of persons who were victims of crime
5 For instance, indicators related to environmental concerns are included in the CBMS system in
Palawan. On the other hand, Camarines Norte has included indicators related to natural calamities in its indicator system.
14
The CBMS composite index combines the 14 core indicators, indicating the number of households’ unmet needs relating to health, nutrition, education, income, employment, housing, access to water and sanitation facilities, and peace and order. A CBMS composite index of 4 indicates that 4 out of the 14 household needs specified by the core indicators are unmet.
CBMS is a data collection system that integrates the use of data in local level planning and program implementation and supports the decentralization process by providing the LGUs with a system to improve local governance.
In Indonesia, a verification study6 shows that CBMS calculation results have a high accuracy. “CBMS is able to correctly rank the RW7 and hamlets based on the family welfare in each of the respective area. The accuracy of the results will sharpen the area targeting in conducting a program. Furthermore, CBMS is also able to predict the ranking of family welfare with quite high accuracy, so that in the end it is expected that subjectivity in the targeting of a program can be minimized.” (Akhmadi et al, 2006)
III.3 India
India has two relevant multidimensional exercises: one related to the identification of below the poverty families for targeting of government services, and the other is related to a proposed new ‘index of multiple deprivation’, announced in August 2008.
Since 1992, an exercise to identify Below Poverty Line (BPL) families in the country has been conducted every five years by the State governments and Union Territory Administrations. The purpose is to identify and target BPL persons under various programmes of the Ministry.
In 1977, India’s planning commission had defined the poverty line for the country as per capita consumption expenditure level, which meets the average per capita daily calories requirement of 2,400 kcal in rural areas. People who failed to meet this requirement were termed BPL. In 1992, a BPL survey gathered income data, and used the all-India income poverty line to identify BPL households. This generated very high estimates of rural poverty (52.5%), and may have been subject to inaccuracies. As an improvement, the 1997 BPL census used expenditure and multiple criteria rather than income data alone, and excluded the visibly non-poor. It had two parts. The first part was administered to all rural households, and identified as “visibly non-poor” households who satisfied certain criteria. If the household was not registered as visibly non-poor, it was administered a survey which gathered basic socio-demographic information, as well as household
6 Akhmadi, Daniel Suryadarma, Hastuti and Rizki Fillaili (2006) “Verifying the Accuracy of the
Community Based Monitoring System in Targeting Poor Households Verification Results in Two Sample Villages.” SMERU Research Institute. The study is a verification study utilizing the focused group discussion (FGD) method in two of the four villages where CBMS was utilized in Indonesia. The results showed that the CBMS data collection method was able to identify families in need with a high level of accuracy.
7 The administrative levels in Indonesia, starting from the largest to the smallest, are as follows: province (provinsi), district (kabupaten), subdistrict (kecamatan), village (desa), hamlet (dusun), RW, and RT. The word ‘hamlet’ used in Suryadarma et al (2005), meanwhile, refers to RT. Furthermore, there are many instances where a dusun is not available, so the administrative level goes straight from village to RW.

15
characteristics, and consumption expenditures over the past 30 days. However, critics including a subsequent Expert Review criticised the 1997 methodology because the exclusion criteria were too stringent (the possession of a single ceiling fan was grounds for exclusion). Also, the BPL criteria were not uniform across states; hence, the interstate comparison was difficult. Finally, there were no procedures available to add new families to the BPL lists for five years.8
With a view to improving the methodology for identification of BPL households in the BPL Census for the Tenth Plan, the Ministry of Rural Development had constituted an Expert Group comprising administrators, academics, planners and representatives of Assam, Kerala, Orissa, Rajasthan and Uttar Pradesh. The expert group consulted all the State governments/U.T. Administrations as well as the sister Ministries of the Central Government and due credence was given to their views. Based on this and the deliberations, the Group made a number of recommendations to improve the design and content of the BPL Census to be conducted for the Tenth Plan period. As a result in 2002 India moved from an income to a multidimensional methodology of identifying the poor. It did so in rural areas by conducting a census for identification of BPL families for India’s Tenth Five Year Plan (2002-2007) comprising information on 13 aspects of poverty:
Q1: How much land do you own?
Q2: What kind of house do you have? (quality of construction)
Q3: How many clothes do you have?
Q4: How much food do you have? (meals per day)
Q5: Bathroom Access
Q6: Consumer goods you own
Q7: Maximum education in the family
Q8: Labour status in the family
Q9: Livelihood situation
Q10: The status of children in the family (School or work)
Q11: What kind of loans do you have?
Q12: Migration in the family
8 Government of India (2002): Report of the Expert Group on Identification of Households below Poverty Line (BPL Census 2002), New Delhi, submitted to the Ministry of Rural Development, September 2002. I. Hirway, 'Identification of BPL Households for Poverty Alleviation Programmes', Economic and Political Weekly, 38/45 (November 8 2003), 4803-38, Jyotsna Jalan and Rinku Murgai, 'An Effective “Targeting Shortcut”? An Assessment of the 2002 Below-Poverty Line Census Method', Mimeo (New Delhi: World Bank, 2007), K. Sundaram, 'On Identification of Households Below Poverty Line in BPL Census 2002: Some Comments on Proposed Methodology', Economic and Political Weekly, 38/9 (March 1 2003), 4803-08.

16
Q13: What do you want from the Government?
The questions had five answer categories. The 13 equally-weighted parameters were each scored from 0-4. The maximum marks that a household could achieve thus were 52. A poverty line (which varied by state or district) was set across the aggregate score, which determined whether or not a household was identified as poor. On the basis of the survey poor families were given a ‘BPL’ (Below the Poverty Line) card, which made them eligible for certain free social services.
The exercise was subject to data problems because of the incentives to overstate family deprivation, and measurement problems due to the construction of the measures (Alkire and Seth, 2008; Jalan and Murghai, 2007). Furthermore indicators, while clearly linked with an underlying concept of poverty (e.g., food security) did not exhibit enough variation in the population and the assumptions of cardinality and equal weights were not validated by the data. Additionally there were concerns that the implementation of the BPL Census was managed in 2002 in favour of non-poor households by the Panchayat indicates much corruption at the ground level (Mukherjee, 2005). In light of these criticisms, the process is under review and a new methodology for to identify BPL families will be finalized and implemented in 2009.9
On the second multidimensional initiative in India, in August 2008, Montek Singh Ahlewalia, Deputy Chair of the Planning Commission, announced that India would also supplement the data in the NSS survey, and create an index of deprivation to supplement the poverty line (Hindustan Times August 19 2008). At present, a commission has been set up, which is ongoing, to review the poverty line methodology and to consider how other deprivations can enter the integral state instruments of poverty measurement and analysis.
III.4 Bhutan
In 1972 Bhutan announced its intention to measure Gross National Happiness rather than Gross National Product. The concept of Gross National Happiness is based on four pillars: (i) the promotion of equitable and sustainable socio-economic development; (ii) the preservation and promotion of cultural values; (iii) the conservation of the natural environment; and (iv) the promotion of good governance. Under the 5th King, in 2008, a national survey was undertaken to develop a quantitative measure of GNH. In 2008, the GNH commission combined the functions of the Planning Commission and the Committee of Secretaries to streamline the philosophy of Gross National Happiness (GNH) in the country’s plans and policies. The Centre for Bhutan Studies (CBS) within the government undertook the development of practical and target-oriented indicators for GNH.
The Gross National Happiness index was developed by CBS with some collaboration with OPHI, and was released on 26 November 2008.10 The GNH is constructed of 72 indicators covering the 9 elements of the GNH. The nine dimensions of GNH are:
9 For more information, including one of the proposals for improvement, see Alkire and Seth 2008, OPHI Working Paper 15 on www.ophi.org.uk
10 See www.grossnationalhappiness.com The methodology of the GNH is described in Alkire, Santos and Ura, 2008, OPHI Working Paper, November 2008.
17
Psychological Well-being
Time Use
Living Standards
Culture
Health
Education
Ecology
Good Governance
Community Vitality.
In each indicator, a ‘sufficiency’ line was set. This is akin to the poverty line, but identifies people who have achieved ‘sufficient’ for well-being from those who are still lacking. A union method was used for identification, and aggregation was completed according to the Alkire-Foster multidimensional index (2008), then subtracted from one.
If we think of the 9 dimensions as 9 ‘bowls’, we might convey the headline findings as follows:
• Headcount = 100% - No Bhutanese had achieved sufficiency in all 72 indicators.
• GNH0 = 0.64 means: most Bhutanese have six of the nine bowls full.
• GNH1 = 0.76 means: of the bowls that are not full, they are two-thirds full
• GNH2 = 0.80 means: of the bowls that are not full, inequality is low.
The GNH Index is based on a survey of 560 respondents in 12 Dzonkhags; that is, it is not fully nationally representative but will be in subsequent years.11 In future years, the indicators may shift to improve the accuracy of the GNH Index in certain domains, but the nine dimensions are expected to remain the same.
III.5 Bolivia
Evo Morales, Bolivia’s first indigenous president, was elected to power with a large popular following in 2005. The government declared that its aim was to improve people’s ability para vivir bien i.e. ‘to live well’ and has prepared a National Development Plan (NDP) that articulates more fully what it is ‘to live well’.
In the past Bolivia relied on income as well as multidimensional measures such as the HDI and a version of the Basic Needs approach known as the Unsatisfied Basic Needs (UBN).
The UBN is constructed in four stages:
11 Wangdue Phodrang, Thimphu, Haa, Tsirang, Zhemgang, Samdrup Jongkhat, Tashi Yangste, Samtse, Pemagatshel, Dagana, Gasa and Tashigang.

18
“1. Four main criteria are used in the assessment of the unsatisfied basic needs (UBN) of a household, i.e. housing, basic services, educational levels and heath care services.12
2. A minimum standard is set for each variable in order to determine the unsatisfied basic need. For instance the minimum level for constructing a floor is brick or cement, not soil or stones; for energy it is electricity not wood
3. Each level is given a value according to its distance from the average availability and a gap index is calculated for each variable
4. The overall UBN index is then determined by measuring the aggregate value of the four criteria using simple weights.” (O’ Hare and Rivas, 2007)
For the purposes of poverty measurement the concept of ‘para vivir bien’ differs from UBN and HDI in that it encompasses the worldview of the population experiencing poverty. That is, its development measures and indicators are to be informed not only by the material circumstances of the respondents but also by the various culture and social values of different communities in Bolivia – by their harmony with one another and with the environment – and thus their ability to ‘live well’. This will enable material development to occur in a way that does not undermine valued indigenous and spiritual traditions.
12 Criteria (minimum standards) A. Housing (a) Building materials 1. Floor: brick and cement 2. Roof: calamine and plancha 3. Walls: adobe revocado and wood (b) Space 1. Two rooms for every five people 2. One room for another use for every five people 3. One separate room for the kitchen B. Basic services (a) Water and sanitation 1. Minimum level of adequate water supply 2. Water from a pipeline outside the house, or a well connected to the inside of the house by a pipeline 3. Sanitation with sewage system or septic room (urban areas) 4. Sanitation with drainage system to a well or surface (b) Energy 1. House has electricity 2. Liquid gas or electricity for cooking C. Education 1. For those 6–16, access to an institution of formal education 2. For persons ten or older, the ability to read and write 3. For persons 17–29, 10 years of schooling 4. For persons 30–44, 8 years of schooling 5. For persons 45–98, 5 years of schooling D. Health 1. Access to care in an institution under the Ministry of Public Health

19
The Government of Bolivia (GOB) is exploring survey questions by which to capture a policy-relevant measure of para vivir bien. The basis of the work will be the existing Bolivian poverty data, complemented by indicators developed by OPHI (the Oxford Poverty & Human Development Initiative) on missing dimensions of poverty analysis (employment quality, empowerment, physical safety, dignity and self-respect, meaning and value). Some of these dimensions will be aggregated in the Alkire Foster multidimensional poverty measure. The multidimensional measures in conjunction with the missing dimensions will help to elicit information about the meaning and value attached to those areas of poverty so far unaccounted for in monetary measures. If the testing proves successful, the GOB will introduce the indicators and the measure as the basis of the monitoring and evaluation of the National Development Plan.
III.6 The United Kingdom (UK) and South Africa
The United Kingdom and South Africa case studies are discussed together because of the similarities in the model of deprivation that underpins recent efforts at multidimensional measurement of poverty in both countries i.e. formally, the Index of Multiple Deprivation 2007 in the UK and the Provincial Indices for Multiple Deprivation for South Africa 2001. The model is area based and is described as follows:
“The model of multiple deprivation is underpinned by the idea of separate dimensions of deprivation which can be recognized and measured. These are experienced by individuals living in an area. The area itself can be characterized as deprived, relative to other areas, in a particular dimension of deprivation on the basis of the proportion of people in the area experiencing the type of deprivation in question. In other words, the experience of the people in an area gives the area its deprivation characteristics. The area itself is not deprived, though the presence of a concentration of people experiencing deprivation in an area may give rise to a compounding deprivation effect, but this is still measured by reference to those individuals. Having attributed the aggregate of individual experience of deprivation to the area, it is possible to say that an area is deprived in that particular dimension. Having measured specific dimensions of deprivation, these can be understood as elements of multiple deprivation.” (Noble et al, 2008)
The United Kingdom (UK)
In Britain, the interest in measuring geographical variations in social and economic circumstances (to guide urban policy resource allocation) came in the wake of the emergence of the concept of ‘social exclusion’ in the European Union in the 1980s. In the UK it led gradually to the creation of the Index of Multiple Deprivation in the year 2000. As part of its efforts at countering social exclusion the allowed funding schemes such as Neighbourhood Renewal Funding, Sure Start and Urban Bus Challenges to be targeted to the most deprived local authorities in England. Initially the government of England developed indices of deprivation in 2000, and improved upon them first in 2004 and next in 2007. Currently the English Indices of Deprivation 2007 (Noble et al, 2008) are the Government’s official measure of multiple deprivations at small area level and update information provided in the ID 2004.
20
The Index uses census and administrative data to map differences in deprivation across local areas for the targeting and effective provision of government services. The Index combines indicators that cover a range of economic, social and housing issues into a single deprivation score for each small area in England allowing them to be ranked in order of deprivation around the average score. The Indices are then used to analyse patterns of deprivation, to identify areas that would benefit from special state initiatives and are also used to determine eligibility for specific funding streams. The Index of Multiple Deprivation 2007 (IMD 2007) which forms part of the ID 2007 is based on the small area geography known as Lower Super Output Areas (LSOAs). LSOAs have between 1000 and 3000 people living in them with an average population of 1500 people.13 There are also two supplementary indices i.e. Income Deprivation Affecting Children and Income Deprivation Affecting Older People which are subsets of the income deprivation domain.
The model of multiple deprivation which underpins the IMD 2007 is the same as that which underpinned its predecessor – the IMD 2004 (Noble et al., 2004) and is based on the idea of distinct dimensions of deprivation which can be recognized and measured separately. The IMD brings together 37 different indicators which cover 7 dimensions along which deprivation takes place: Income, Employment, Health and Disability, Education, Skills and Training, Barriers to Housing and Services, Living Environment and Crime. Statistical indicators for each domain are combined to produce ward rankings for each domain. The different domains are then combined to create the overall IMD 2007 after being weighted as follows: Income (22.55), Employment (22.5%), Health and Disability (13.5%), Education, Skills and Training (13.5%), Barriers to Housing and Services (9.3%), Living Environment (9.3%) and Crime (9.3%). The weights selected were based on theoretical considerations and took account of established academic work, the results of research on previous Indices and the consultation process. The indicators for each domain were selected according to technical criteria so that all indicators would be:
• 'Domain specific' and appropriate for the purpose (i.e. the best possible measures of that form of deprivation);
• Measure major features of deprivation (not just conditions experienced by a very small number of people or areas);
• Up-to-date;
• Capable of being updated on a regular basis;
• Statistically robust; and
• Available for the whole of England at a small area level in consistent form.
The indicators were constructed using a variety of techniques that included aggregation and modelling. At the district level 6 local authority district level summary measures14 of
13 There are 32,482 LSOAs in England. The LSOA ranked 1 by the IMD 2007 is the most deprived and that ranked 32,482 is the least deprived. In most cases, these are smaller than wards, thus allowing the identification of small pockets of deprivation.
14 The six summary Measure are: AVERAGE SCORE is the population weighted average of the combined scores for the SOAs in a district.

21
the IMD 2007 have been produced. No single summary measure is favoured over another as there is no single best way of describing or comparing England’s 354 local authority districts because of the diversity in population density and composition.
South Africa
The national statistics agency in South Africa, Statistics of South Africa or Stats SA collects data to produce official statistics for dissemination throughout the country. The Demography and Social Analysis Division of Stats SA generates information on poverty and social trends at the national and sub-national levels. Statistics of South Africa runs a household survey on a regular basis called the General Household Survey (GHS) that has been conducted annually by Statistics SA since 2002 and covers a variety of multidimensional poverty measures. In particular the GHS covers six broad areas: education, health, activities related to work and unemployment, nonremunerated trips undertaken by the household, housing and household access to services and facilities. The survey in its present form was instituted as a result of the need identified by the Government of South Africa to determine on a regular basis the level of development in the country and the performance of development programmes and projects.
However, the South African constitution requires the Parliament to ensure that financial resources are distributed equitably among provincial and sub-provincial governments based on levels of poverty and disadvantage (Alderman et al, 2003). Therefore in post-apartheid policy there was always a need for the development of measures to identify deprivation correctly at the national and sub-national level so that resources could be efficiently transferred to the most deprived areas. The development of measures to identify deprivation was in turn based on the following view of the multidimensionality of poverty noted in the Reconstruction and Development Programme (RDP)
“It is not merely the lack of income which determines poverty. An enormous proportion of very basic needs are presently unmet. In attacking poverty and deprivation, the RDP aims to set South Africa firmly on the road to eliminating hunger, providing land and housing to all our people, providing access to safe water and sanitation for all, ensuring the availability of affordable and sustainable energy sources, eliminating illiteracy, raising the quality of education and training for children and adults, protecting the environment, and improving our health services and making them accessible to all (African National Congress, 1994).
AVERAGE RANK is the population weighted average of the combined ranks for the SOAs in a district. EXTENT is the proportion of a district’s population living in the most deprived SOAs in the country. LOCAL CONCENTRATION is the population-weighted average of the ranks of a district’s most deprived SOAs that contain exactly 10% of the district’s population. INCOME SCALE is the number of people who are income deprived. EMPLOYMENT SCALE is the number of people who are employment deprived.
22
Since 2000, Stats SA has been working with international partners to generate area statistics on poverty. In 2000 Stats SA identified two indices: The Household Infrastructure Index and the Household Circumstances Index which encompassed a wider range of social deprivation and inequality indicators than the income-expenditure and consumption measures used previously. However they did not specifically articulate any one model of multiple deprivation and were found to give greater weight in calculation to the issue of access to services than other aspects of deprivation such as housing, education and employment. A further model exemplified in the Lived Poverty Index (LPI) was found lacking in its ability to identify small areas of multiple deprivation for policy targeting since it was based on survey data conducted at the national level.
Since 2000, Stats SA has been working with international partners to generate area statistics on poverty. In 2000 Stats SA identified two indices: The Household Infrastructure Index and the Household Circumstances Index which encompassed a wider range of social deprivation and inequality indicators than the income-expenditure and consumption measures used previously. However they did not specifically articulate any one model of multiple deprivation and were found to give greater weight in calculation to the issue of access to services than other aspects of deprivation such as housing, education and employment. A further model exemplified in the Lived Poverty Index (LPI) was found lacking in its ability to identify small areas of multiple deprivation for policy targeting since it was based on survey data conducted at the national level.
Recently however members of Stats SA partnered with the Centre for the Analysis of South African Social Policy (CASASP) and the Human Sciences Research Council (HSRC) to develop Provincial Indices of Multiple Deprivation (PIMD) for South Africa. A PIMD was constructed for each province in South Africa and consisted of indicators which were combined to form domains of deprivation for each province. A score was produced for each of the domains, which were subsequently ranked to provide a relative picture of each dimension of deprivation for each province. Data from the Statistics of South Africa’s 2001 Census data was used for the construction of the index. PIMD was based on a model of deprivation that allowed separate measurement of different dimensions of deprivation (e.g. health and education) to be combined with appropriate weighting into a single measure of multiple deprivation. Research based on existing data sources e.g. Labour Force Survey, Income and Expenditure Survey and October Household Surveys was used to identify domains that had the greatest impact on the quality of people’s life in South Africa. 5 domains of deprivation were identified: income and material deprivation, employment deprivation, health deprivation, education deprivation and living environment deprivation. Each domain contains a number of indicators that capture a specific deprivation. The 5 domains were combined first by transforming them into a standard distribution and then combined by using equal weights. For each PIMD equal weights were assigned because there was limited evidence in the surveys to support the use of differentiated weights. The main unit of analysis is the electoral ward which is the smallest unit on the spatial scale in the provinces of South Africa. Since each PIMD score is the combined sum of the weighted, exponentially transformed domain rank of the domain scores, therefore the bigger the PIMD score the more deprived the ward.
23
At the current stage each PIMD provides information about relative levels of deprivation within the province in question but does not allow comparison between provinces. The research partnership has extended its efforts to developing a South African Index of Multiple Deprivation (SAIMD) for the whole country. At present, the PIMD can be used to spatially target programme and resources to areas of greatest need within the province in question by the government, aid agencies and NGOs. The report by Stats SA, HSRC and CASASP recommends that each domain score should be used only when it is an appropriate tool for a programme or project since ranks may differ across domains. However for programmes that target deprivation in a general sense, the report recommends the use of the multiple deprivation score. In both cases the actual resources will also need to take into account the population size in deprived areas.
Section IV. Common Themes
The six case studies provide at least an impressionistic account of the interest in multidimensional measures o f poverty and well-being, as well as some of the dimensions and measures that are in use or under development. Clearly interest in non-monetary complex measures has surged and waned across time. How can we interpret the current burgeoning of interest in wider-than-income measures of social progress?
The themes showcased in the following section have been chosen to highlight the extent to which common experiences and denominators have marked the trajectory of developing multidimensional measures in politically and economically varied countries. The themes have been selected to reflect the process of multidimensional poverty measurement from design to implementation i.e. from discussions on why different countries felt a demand for a multidimensional poverty measure to the processes involved in determining a measure and finally to a discussion on the results and uses of the measure where applicable. The themes are briefly described in the list below:
1. Motivation: The theme identifies the most common drivers for multidimensional poverty measurement in the case study countries by looking at whether the approach was adopted as a distinct political choice, a consequence of a funded policy project or if it was the result of past research and experience.
2. Choice of Dimension & Indicators: The theme examines how the dimensions and indicators (discussed in the case studies) were chosen for each country i.e. the paper looks at whether it was a technical exercise or an outcome of an exercise on ‘value judgements”. In either case it examines the nature of stakeholders and the degree and nature of participation in the choice of dimensions and indicators
3. Support and Co-ordination: This theme picks out cases where international involvement in developing a multidimensional approach and measure was markedly high in order to highlight the different resources that can be made available at the international level to further support for a multidimensional approach.
4. Changes through Time: The theme observes how countries have evolved multidimensional poverty measurement over time and correspondingly addressed the issue of comparability.
5. Establishment of Standards: The theme notes the different methods by which countries identify the poor from the non-poor.

24
6. Overall Index: The theme looks at case studies where an overall index was constructed from multiple dimensions to see the different ways in which a summary measure was constructed and the strengths and weaknesses of the approach adopted.
7. Uses & Results: The section seeks to explore how different measures were implemented in different contexts and how the results were compiled and consequently incorporated into policy action.
8. Public Debate: This theme studies the extent to which public participation, public debate, or decentralized decision-making processes were engaged in the development of a multidimensional measure and the degree to which they functioned in different contexts.
IV.1 Motivation
The demand for multidimensional work in the case studies discussed in the previous section emerges from a range of legal and political imperatives. In the case of South Africa and Bolivia the demand for multidimensional work results directly from a recognized mandate to reduce inequality in populations where discrimination against a particular population (e.g. the black population in South Africa and the indigenous population in Bolivia) has placed them in a disadvantageous socioeconomic position.
Similarly in the UK and India, the need for multidimensional poverty measurement has emerged from work on social exclusion that identifies deprived areas/populations for targeting funds and interventions.
In the case of the UK and India there is an additional motivation to target multiply deprived families for policy intervention. In all four countries the importance accorded to the development of multidimensional measures surfaces from the need to identify deprivation correctly at the national and sub-national level so that resources could be efficiently transferred to the most deprived areas and populations for equitable development. Press reports on the case of India followed the series of BPL processes in 1992, 1997, and 2002, and there was widespread protest against corruption and inaccuracies in the BPL criteria.
25
In Philippines and Mexico the drive towards multidimensional measurement appears to have been triggered by the need for transparent monitoring and evaluation of the impact of policy on welfare. In the Philippines, the CBMS was developed in the early 1990s under the Micro Impacts of Macroeconomic Adjustment Policies (MIMAP) Project with the goal of providing policymakers and program implementers with an information base for tracking the impacts of macroeconomic reforms and policy shocks. The initiative was the result of a study led by Philippine Institute for Development Studies (PIDS) into the impact of macro-policies at the household level which showed that macro-economic reforms can have negative consequences, and that policymakers can formulate unfeasible packages of policies because they lack data on how households, especially the poor, are affected as a group. Tracking and monitoring was also the legal impetus driving the demand for multidimensional poverty measures in Mexico. In 2006, the Mexican government published the General Law of Social Development (GLSD). One of its main objectives is to create a National Social Development System to design, monitor and evaluate social policy and programs. According to Article 36 from the GLSD, the government is obliged to establish the guidelines and criteria for a multidimensional definition, identification and measurement of poverty at the federal, state and municipal levels.
In Bhutan the emergence of GNH is a direct rejection of the monetary value placed to social welfare and motivated by an alternative means of gauging what people value and channelling it into a policy priority. The GNH is rooted in the spiritual values of Buddhism which place a high value on contentment and relationship and the belief that material development should be accompanied by a state of happiness if economic and social development is managed well at the state level. To a greater or lesser extent, other countries such as Bolivia clearly also prefer multidimensional measures because they better capture variables of intrinsic interest.
IV.2 Choice of Dimensions & Indicators
It appears that the choice of indicators in some cases is led by past experience and available data, in some cases new survey instruments are developed, and although attempts are made to test technically new dimensions from time to time. Philippines is an outlier case study in this selection because it relies extensively on the local community in a village to design, implement and analyze the data collected on poverty. For some countries in the case study i.e. Mexico and Bolivia, a multidimensional measure of poverty is currently in the phase of development which could explain the lack of community participation so far. These three countries are interested in non-traditional dimensions, for example those suggested by OPHI15 that have not previously been included in a holistic monetary or non-monetary measures used by the countries (discussed below).
In Mexico, India, the UK and South Africa, dimensions and indicators were chosen by academic peer review, consultations of previous surveys and censuses as well as
15 Employment, including both formal and informal employment, with particular attention as to the quality of employment; Empowerment, or agency: the ability to advance goals one values and has reason to value; Physical safety, focusing on security from violence to property and person, as well as domestic violence and perceived violence The ability to go about without shame, to emphasize the importance of dignity, respect and freedom from humiliation and Psychological and subjective wellbeing, to emphasize meaning, satisfaction and their determinants

26
consultations at the government level. In Mexico, the minimal requirements for subsistence, such as minimum caloric intake and some other goods were taken from earlier Mexican literature (Coplamar, 1983; INEGI-CEPAL, 1993) and draw upon rights guaranteed in the Constitution. Following the general discussion of the basket of goods in Ravallion (1998), the definition of the basket of goods and its equivalent on income was done using the theory of the Engel coefficient (CTMP, 2002). In India, the list of questions to determine BPL families was compiled by a committee of experts (administrators, academics, planners and representatives of Assam, Kerala, Orissa, Rajasthan and Uttar Pradesh). The expert group also consulted all the State governments/U.T. Administrations as well as the sister Ministries of the Central Government and due credence was given to their views.
In the UK, the dimensions16 of deprivation were chosen by academic peer review, informed by consultative processes, and are given below. The indicators for each domain were constructed using a variety of techniques that included aggregation and modelling and were selected according to technical criteria i.e. they should be:
• 'Domain specific' and appropriate for the purpose (i.e. the best possible measures of that form of deprivation);
• Measure major features of deprivation (not just conditions experienced by a very small number of people or areas);
• Up-to-date;
• Capable of being updated on a regular basis;
• Statistically robust; and
• Available for the whole of England at a small area level in consistent form.
In South Africa, a review of existing data and studies (Income and Expenditure Surveys, October Household Surveys, Labour Force Surveys and KwaZulu-Natal Income Dynamics Study) on areas of poverty and deprivation central to people’s quality of life was undertaken to select the 5 domains of deprivation (income and material deprivation, employment deprivation, health deprivation, education deprivation and living environment deprivation.) Each domain contains a number of indicators that capture a specific deprivation. There are 13 indicators overall17.
16 Income, Employment (people of working age who are involuntarily excluded from the world of work), Health and Disability (areas with relatively high rates of people who die prematurely, areas with low quality of life for people with disability), Education, Skills and Training (indicators lie in 2 domains: the first looks at lack of attainment among children and young people and the second relates to lack of qualifications in terms of skills), Barriers to Housing and Services (indicators lie in 2 domains-geographical barriers and wider barriers such as social issues, affordability etc), Living Environment (indicators lie in 2 domains: the first looks at the quality housing and the second looks at surrounding air quality and road accidents as a measure of external environment) and Crime (burglary, theft, criminal damage and violence).
17 Income: a) number of people (NoP)living in a household that has an income below 40% of the mean equivalent household income, b) NoP living in a household without a refrigerator, c) with neither a television nor a radio. Employment: a) NoP who are unemployed, b)NoP who are not working due to illness and disability. Health: a) years of potential life lost. Education: a) Number of 18 to 65 year olds who have no schooling at secondary level. Living environment: a) NoP living in a household that has no access to a telephone, b) NoP living in a household that has no piped water inside the dwelling or

27
The choice of dimensions in Bhutan is based upon four pillars consistent with Buddhist teachings (i) the promotion of equitable and sustainable socio-economic development; (ii) the preservation and promotion of cultural values; (iii) the conservation of the natural environment; and (iv) the promotion of good governance. The nine dimensions were selected on normative grounds, and are equally weighted, because each dimension is considered to be relatively equal in terms of equal intrinsic importance as a component of gross national happiness.
In Bolivia dimensions and indicators are being developed through a survey exercise. Both the indicators and the measure will be tested in the following months and enriched by indicators developed by the Government of Bolivia. If the testing proves successful, the GOB will introduce the indicators and the measure as the basis of the monitoring and evaluation of the National Development Plan.
In the Philippines, the CBMS has been singularly successful in diagnosing poverty at the local level. It is a system of data collection that uses the 13 core indicators to assess poverty at the household level in a village. CBMS has been a community focused system at the level of design, collection and implementation and was pioneered by the research led by a group of senior researchers from the Philippines, directed by Mario Lamberte, Gilberto Llanto, and Aniceto Orbeta of the Philippine Institute for Development Studies (PIDS) which was later supported by International Development Research Centre (IDRC) that founded the programme Micro Impacts of Macroeconomic and Adjustment Policies (MIMAP). The MIMAP Philippines piloted a simple Household Profile Questionnaire that used minimum basic needs indicators (already present in many of the existing survey forms and included other poverty indicators). The indicator list was simple and fairly consistent with standard definitions used by national statistical offices. The system was developed in consultation with local government officials, community representatives, and other stakeholders, according to the specific features of the locality in which it would be administered where the nature of basic chosen indicators was confirmed and validated. The pilot also enabled the team to evaluate validate the indicators and information collected by other agencies.
At the collection phase, the data is collected and analyzed by trained community members, in partnership with local government officials, for use by local development planners. While the main intent of the programme is to reduce poverty, it has associated benefits such as an increased capacity of local government officials and community representatives, increased gender equity, and early warning of crisis impacts. Informed from the outset about the survey’s objectives, the community plays a vital role in providing enumerators to collect the data, as well as personnel to process and analyze it. Information is collected from every household and the data is consolidated at the village level. Subsequently the data is returned to the community for verification and discussion which creates a space for communities to actively participate in diagnosing poverty and recommending suitable interventions.
The CBMS is again working on a second phase of deepening its indicators with respect to violence (Peace and order), empowerment, and other areas.
yard nearby, c) NoP living in a household that has no use of electricity for lighting, d) NoP living in a household that is a shack, e) NoP living in a household that has neither a pit latrine with ventilation nor a flush toilet, f) NoP living in a household that has two or more people per room.

28
IV.3 Support & Coordination
International involvement in the construction and implementation of multidimensional poverty measures in the case study countries has been varied but present in almost all cases. In the Philippines, national, local governments, donors and non-government organizations are involved in scaling up the implementation of CBMS. In Bhutan, the Centre for Bhutan Studies (CBS) is a permanent but independent civil service institution within the government, charged with developing the GNH measure, and with developing policy and programme tools to ensure policy coherence with GNH. CBS collaborated with OPHI for the development of the measure. Bolivia has a permanent civil service institution, UDAPE, which is charged with both poverty data collection and with the measurement of para vivir bien. This ensures that multidimensional measures may be sustained even through changes of government. In South Africa, the construction of PIMD has been an international effort with the participation of government (Stats SA), and academic research institutes (Centre for Analysis of South African Social Policy and Human Sciences Research Council). In India, the BPL was a purely state conceptualized and state led measure; that and the new index for multiple deprivation are led by groups within the Planning Commission. In the Philippines, IDRC Canada financed and promoted the pilot phase of CBMS. However because the primary objective of the programme was local ownership in every capacity, the role of IDRC is now limited to supporting further pilots of CBMS initiatives, (in partnership with others agencies) and providing the technical guidance and capacity building for sustainability. The provincial, municipal/city, and village level governments provide the funds to implement CBMS in their localities.
As can be seen from the case above there are three typologies of approaches the international community can take towards supporting and sustaining efforts at multidimensional poverty measurement.
1. State partnerships with research agencies which have the technical and academic expertise to advise the construction of an index of poverty in different contexts e.g. OPHI (Mexico, Bolivia, and Bhutan), CASASP (South Africa) and DPSPSW (UK). Collaborative research programmes between independent research institutes and state agencies allow knowledge gained across countries to be shared through the office of the research institute and allow the agency to constantly re-examine its work in light of its activities in different countries. In practice however, the financing for such a project if often required by a third agency which opens the space for a role by international funding institutions as well as regional blocs and international NGOs.
2. Financing local pilot programmes emulating the role that IDRC played not only in Philippines but in other countries such as Burkina Faso, Ghana, Senegal, Benin where CBMS was piloted in local villages after selecting indicators most relevant to the local context. The pilot was then used to identify problems in implementing CBMS in the area and ways of overcoming those obstacles (e.g. in Burkina Faso, a high level of illiteracy in the posed a challenge in communicating CBMS to the community and was circumnavigated by translating the data into drawings on paper and blackboards, one for each indicator—population size, health and nutrition, sanitation, education—posted at the village assembly offices. The drawings were then used to illustrate handbooks and the information has been translated into the local language as well).

29
3. Dissemination of literature and ideas at international forums on the successes, uses, limitations and failures of different designs, implementation and uses of multidimensional poverty measures. Poverty reduction efforts such as the Millennium Development Goals (MDGs) can use country cases to highlight successes and limitations at international forums to further discussion on the technicalities of how poverty should be eradicated. The OECD measuring the progress of society is one institution that is providing a forum for the exchange of ideas and experiences (See Box 1 below).
Box 1: An example of International Co-ordination
A recent initiative that aims to coordinate multidimensional measures of well-being internationally is the OECD initiative of ‘Measuring Progress of Societies’. Created in 2004, the initiative intends “Working with experts from around the world [so that] the Project will develop a better understanding of how progress can be measured – especially in emerging and complex areas not yet covered by statistical standards.”18 The Project is all inclusive and invites cooperation from “statistical offices, public and private organisations, and academic experts to work alongside representatives of their communities to produce high-quality, facts-based information that can be used by all of society to form a shared view of societal well-being and its evolution over time” expressing the spirit of one of their founding principles that qualifying what is meant by progress in measures can help foster progress through different societies. Every two years the Project organizes a world forum to share these ideas. So far forums have been held in Italy, 2004 and Istanbul, 2007. The next forum will be held in Korea in 2009. At present the Project has developed a number of ICT tools to facilitate sharing of knowledge including a wiki platform Wikigender19 with the aim to “to facilitate the exchange and improve the knowledge about gender-related issues around the world. A special focus of this project is to collect empirical evidence and to identify adequate statistics and measurement tools of gender equality” and an OECD eXplorer, an interactive tool for developing and analysing statistics at the regional level. Given the wide spectrum of organizations and agencies20 collaborating on the Project it can also provide a forum for government agencies to network with organizations that can finance pilot exercises in multidimensional poverty measurement.
18 http://www.oecd.org/document/5/0,3343,en_40033426_40037349_40038469_1_1_1_1,00.html 19 www.wikigender.org 20 International Institute for Design (IIID), Istituto di Studi e Analisi Economica (ISAE), International
Society of Quality of Life Studies (ISQOLS), Arab Institute for Training & Research in Statistics (AITRS), Foundation du Devenir. The World Bank (WB), The United Nations Development Programme (UNDP), The United Nations Children's Fund (UNICEF), Inter-American Development Bank (IDB), African Development Bank (AfDB), United Nations Economic Commission for West Asia (ESCWA), United Nations Economic and Social Commission for Asia and Pacific (ESCAP), International Association of Auditor Generals (INTOSAI), European Commission (EC), Council of Europe (CoE).

30
IV.4 Changes through time
In some of the case studies discussed above the move to multidimensional poverty has been recent. In Mexico, in 2001 the CTMP institutionalized one of the Foster-Greer-Thorbecke (1984) poverty indices, using an expenditure survey as a basis (ENIGH) and having the household as a recipient unit. CONEVAL has now replaced the committee and is developing the multidimensional measure of poverty that will build upon and improve the FGT poverty indices. Bolivia currently uses an income poverty line, the unsatisfied basic need index (UBNI), and the Human Development Index (HDI). The UBNI involves specification of those basic needs where lack of satisfaction is considered to be an indicator of deprivation or poor living conditions. In Bolivia the needs were housing, basic services, health and education. The movement to para vivir bien expands the existing framework by including the value of culture, social and physical environment to indigenous communities in the defining poverty. Previously in India successive planning commission in 1977 defined the poverty line for the country as per capita consumption expenditure level, which meet the average per capita daily calories requirement of 2,400 kcal in rural areas. People who failed to meet this requirement were termed BPL. This has been revised regularly. In 2002 the BPL was based on 13 core dimensions, and the BPL indicators are being revised again in 2008-2009.
In the case of the UK, initially the government developed indices of deprivation in 2000. Following two extensive public consultations, an academic peer review and a significant programme of work, the new Indices of Deprivation 2004 were produced which updated the ID 2000 by using more up-to-date data and by introducing new measures. Following an extensive public consultation, an independent academic peer review and a significant programme of work, new Indices of Deprivation 2007 were produced in December of the same year. The main methodology is the same in 2007 and 2004 and indicators have been kept closely similar to allow for change in time to be observed. However new indicators have been substituted in some domains, particularly in the domain of Income, and that may register a change in output. Meanwhile in South Africa, the change in focus has been on the scale of measurement rather than the quality i.e. movement from measurement of multiple deprivation at a general level to measurement of multiple deprivation at the area level. Work on the development of a national index of multiple deprivation is currently underway after work on the PIMD.
IV.5 Establishment of Standards
The UK and South Africa’s measure of poverty uses a system of ranking to establish standards for poverty. In the UK, the Lower Super Output Area (LSOA) ranked 1 by the IMD 2007 is the most deprived and that ranked 32,482 is the least deprived. In the case of South Africa, the Provincial Indices of Multiple Deprivation (PIMD) provides a rank order of areas from the least deprived to the most deprived.
31
Mexico and India however establish a threshold for the identification of poor households. In the case of Mexico, in 2002 CTMP produced a document called ‘Medición de la pobreza: variantes metodológicas y estimación preliminar’ (‘Measurement of poverty: methodological variants and preliminary estimation’). In this document the committee institutionalized the Foster-Greer-Thorbecke (1984) poverty measure, using non-equivalized income, having the household as the recipient unit, and the expenditure survey (ENIGH) as the main data source and poverty was defined in relation to three poverty lines. This was the starting point for the consideration of human deprivation in Mexico. The standards for the multidimensional measure are drawn from the economic and social rights that are active in Mexico; however specific features of normalization are not present India has used a clearly flawed methodology of standards by instituting a poverty line whereby families that have less than a certain number (varying state) out of the maximum 52 marks on the 13 dimensions are classified as BPL.
In the Philippines, the CBMS composite index combines the 14 core indicators, indicating the number of households’ unmet needs relating to health, nutrition, education, income, employment, housing, access to water and sanitation facilities, and peace and order. A CBMS composite index of 4 indicates that 4 out of the 14 household needs specified by the core indicators are unmet thereby facilitating targeting. Alternatively, a CBMS data on assets, socio-economic and demographic characteristics, and spatial attributes can be used to estimate a measure of income or poverty status which can then be used to determine eligibility to a program.
As noted before Bolivia and Bhutan are developing multidimensional measures, but have not worked specifically on the establishment of standards.
IV.6 Aggregation Methodologies
A variety of methods and techniques have been used to compose an overall index for the measurement of multidimensional poverty in each of the case study countries. Different government offices in Mexico carry on parallel measurements of poverty and deprivation, and although these results have been contextualized within the official measurement, there are methodological differences in how overall poverty is measured at different levels. A new index is currently under development in Mexico. In India the overall index is calculated through simple scoring using equal weights. The 13 parameters carry a score from 0-4. The maximum marks that can be given are 52, and a poverty line is set across this aggregate score. As noted earlier, in the Philippines, the CBMS composite index combines the 14 core indicators, indicating the number of households’ unmet needs where a CBMS composite index of 4 indicates that 4 out of the 14 household needs specified by the core indicators are unmet thereby facilitating targeting.
In the UK, the Index is made up of seven distinct dimensions of deprivation called Domain Indices that are combined into an overall indicator. The weights selected for each were based on theoretical considerations and took account of established academic work, the results of research on previous Indices and the consultation process. Meanwhile in South Africa each PIMD score is the combined sum of the weighted, exponentially transformed domain rank of the domain scores therefore, the bigger the PIMD score the more deprived the ward. The score is calculated as a simple rate: the percentage of people experiencing deprivation on one or more indicators in a specific domain. No specific weighting is given to the individual indicators.

32
Bolivia is still in the process of developing an overall index.
IV.7 Uses & results
Mexico, Bolivia, Bhutan are in the process of developing a multidimensional measure in partnership with international research and funding agencies as noted in their case studies above.
South Africa has developed a multidimensional measure at the provincial level called the Provincial Indices of Multiple Deprivation 2001. The Indices were used to develop maps of deprivation for each province at the ward level by using data from the 2001 Census. Results showed that “In each province, all domains correlate fairly highly with the overall PIMD for that province. In all cases, the income deprivation domain has the highest correlation with the PIMD (0.914 to 0.974) and also correlates highly with the Living Environment Deprivation Domain. In nearly all provinces the Employment Deprivation, Education Deprivation and Living Environment Deprivation Domains all have a correlation of over 0.7 with their respective provincial index of multiple deprivation, but the intra-domain correlations are not always high. In most provinces the Health Deprivation Domain has the lowest correlation with its PIMD and all other domains.”21
In India the BPL census is used purely to identify recipients of government services. The data are not otherwise analysed. This seems a waste, given the expense of collecting survey data, and the potential that those data could have to improve poverty reduction efforts (Alkire & Seth 2008).
In the Philippines, the CBMS collects data at the household level on core indicators. The data is collected through a household survey and/or focus group discussions. As noted previously, the system is financed by the state/provincial and village government and the community provides enumerators to collect the data, as well as personnel to process and analyze it. Information is collected from every household and the data is combined at village level. Village level aggregates are then submitted to higher geopolitical levels for consolidation. The processed data is returned to the community for validation and discussion. This stage allows the community to have an input in the local government’s identification of areas of intervention based on the data, the types of intervention as well as the resources allocated. The data is also used in preparing annual development plans and socio-economic profiles at all levels of government as well as identifying eligible beneficiaries for poverty reduction programs.
21 The Provincial Indices of Multiple Deprivation for South Africa 2001 at http://www.statssa.gov.za/census01/html/C2001Deprivation.asp
33
In the UK, the ranking produced by the English Indices of Deprivation 2007 are used to determine the amount of money allocated to local authorities under the Working Neighborhoods Fund worth approximately £0.5 billion per year. They are also used to identify target neighbourhoods for area based interventions e.g. the selection of areas for the New Deal for Communities and Sure Start programmes both took into consideration the indices of deprivation scores. The indices are also used in a number of other major government and non-government funding formulae when funds are allocated based wholly or partly on the level of deprivation in an area.22
IV.8 Public Debate
Public debate has been generally limited in all countries to consultations, and only rarely have these reached beyond groups of specialists in the academic field. In the UK, the development of the indices was a result of extensive public consultations included views of local and central government and voluntary organisations. However technical work was undertaken by academic bodies. Once deprivation scores are in however, the government uses them to identify areas to target specific funding schemes.
In South Africa, there was no direct consultation or input with civil society bodies and discussion was limited to research centres and state stakeholders. In India, the 13 core dimensions were selected by a committee of experts constituted for improving the design and content of the identification of families below the poverty line for India’s Tenth Five Year Plan (2002-07). The expert group also consulted all the State governments/U.T. Administrations as well as the sister Ministries of the Central Government and due credence was given to their views. The survey was finalised and adopted in September, 2006 and formed the basis for benefits under government of India schemes allowing BPL families to be eligible for free social services. The state government is free to adopt any criteria/survey for the state level schemes. However over the last couple of years, public protests have been widespread against the identification process of the BPL list where poor people have angrily protested against being excluded from the list leading to a current review of the BPL criteria.
In Bhutan, pilot surveys have sought to incorporate public views on the parameters for poverty while in Bolivia the concept of "vivir bien" was developed by the government and introduced in the National Development Plan (NDP). Since Bolivia is still developing the survey it is not possible to say the extent to which public debate has been incorporated into the design and implementation of the plan. Philippines presents an interesting case whereby since the local enumerators are data collectors for the survey, the system has the flexibility to incorporate contextually sensitive indicators in the survey. Therefore Philippines has succeeded in decentralizing anti-poverty plans which are typically constructed and delivered at the local level.
22 David McLennan, Deputy Director, Social Disadvantage Research Centre Department of Social Policy and Social Work, University of Oxford

34
Section V. Conclusion
This paper has surveyed country case studies to understand how the current interest in multidimensional poverty measurement is being operationalized across different economic settings. The paper notes that current attempts at multidimensional poverty measurement differ from previous approaches by placing greater emphasis on the contextual meaning of poverty in different countries. The governments in the case studies discussed above have attempted to incorporate a wider understanding into a poverty or well-being measure, using different methods of design and collection. Although most countries are in an early stage of design and implementation, the Philippines case suggests that such an approach can be extremely policy relevant and can feed into active local government interventions. The process by which provinces in the Philippines design and implement poverty measurement provides an organic role for the poor in participating in poverty measurement. The UK also boasts of effective policy targeting as result of multidimensional measurement. Additionally the case of Philippines as well as Bolivia highlights the different roles international stakeholders e.g. funding and research agencies, can place in sharing knowledge and methodologies across contexts. Despite varying levels of development of poverty measurement in the case studies discussed, the drive towards the adoption of multidimensional poverty measurement in such diverse economic contexts lays the path for the international community to play a more effective role in supporting multidimensional approaches to poverty and well-being.

35
BIBLIOGRAPHY
African National Congress (1994) Reconstruction and Development Programme (RDP). A Policy Framework. Johannesberg: Umanynao
Akhmadi, D. Suryadarma, Hastutie and R. Fillaili (2006) “Verifying the Accuracy of the Community Based Monitoring System in Targeting Poor Households Verification Results in Two Sample Villages.” SMERU Research Institute
Alebiosu, O. A (2006) “An investigation of integrated development planning (IDP) as a mechanism for poverty alleviation in Grahamstown in the Makana Municipality, Eastern Cape, South Africa,” Masters thesis. South Africa: Rhodes University
Alderman H., B. Miriam, D. Gabriel, M. Nthabiseng and Ö. Berk (2002) “How Low Can You Go? Combining Census and Survey Data for Poverty Mapping in South Africa.” Journal of African Economies, 11(2), pp. 169–200 Alkire, S (2001) Valuing freedoms: Sen's capability approach and poverty reduction, Oxford: Oxford University Press
Alkire, S. and J. Foster (2008) “Counting and Multidimensional Poverty Measurement.” OPHI Working Paper Series (7), www.ophi.org.uk
Alkire, S. and S. Seth (2008) “Multidimensional Poverty and BPL Measures in India: A Comparison of Methods,” Forthcoming OPHI Working Paper Series (15), www.ophi.org.uk
Alkire, S. M.E. Santos and K. Ura, (2008) OPHI Working Paper on the Methodology of GNHR, Forthcoming November 2008.
Anand, S. and A. Sen (1994) Human Development Index: Methodology and Measurement. New York: Human Development Report Office, UNDP
Anand, S. and A. Sen (1996) The Income Component of the Human Development Index. New York: UNDP
Atkinson A, B. Cantillon, E. Marlier and B. Nolan (2002) Social Indicators: The EU and Social Inclusion. Oxford: Oxford University Press
Booysen, F (2002) ‘An overview and evaluation of composite indices of development,’ Social Indicators Research 59(2), pp. 115–151
Carter, M.R. and J. May (1999) “Poverty, livelihood and class in rural South Africa,” World Development, 27(1), pp. 1 – 20
Chandra, S (2006) “Redefining Poverty Lines and Survey of BPL Families ( Rural Areas)” Proposal Submitted to the Chief Minister, Government of Punjab by the Secretary of Planning, Government of Punjab, India. 28/09/2006
Communities and Neighbourhood Indices of Deprivation 2007. Retrieved December 10 from Communities and Local Government http://www.communities.gov.uk/communities/neighbourhoodrenewal/deprivation/deprivation07/
Coplamar (1983) Macroeconomia de las Necesidades Ercenciales en Mexico: Situarión Actual y Perspectivas a1 Año 2000, Siglo XXI Eds., COPLAMAR, Mexico DF, Mixico, 1983

36
CTMP (2002) (Comité Técnico para la Medición de la Pobreza CTMP) Medición de la pobreza: variantes metodológicas y estimación preliminar. Mexico D.F, Secretaría de Desarrollo Social
Dasgupta, Partha and M. Weale (1992) On measuring the quality of life. World Development 20(1), pp. 119–131
David McLennan, Deputy Director, Social Disadvantage Research Centre
Department of Social Policy and Social Work, University of Oxford “Information on the Index of Multiple Deprivation,” (Personal Communication, 18 November , 2008)
Economic and Social Database Community Based Monitoring System. Retrieved December 10 from PIDS Economic and Social Database http://econdb.pids.gov.ph/index.php?option=com_frontpage&Itemid=1
Foster, J., J. Greer and E. Thorbecke (1984) “A Class of Decomposable Poverty Measures,” Econometrica, 52 (3), pp. 761 – 766
Gough, I. and Thomas, T (1994).”Need Satisfaction and Welfare Outcomes: Theory and Explanations,” Social Policy & Administration, 28(1), pp. 33 – 56
Government of India (2002): Report of the Expert Group on Identification of Households below Poverty Line (BPL Census 2002), New Delhi, submitted to the Ministry of Rural Development
Haq, M (1995) Reflections on human development, Oxford University Press, New York
Haq M. and K Haq (1998) Human Development in South Asia. Oxford University Press
HDR (1990) Human Development Report. UNPD
Hicks, D. A (1997) The Inequality-Adjusted Human Development Index: A Constructive Proposal. World Development. 25 (8), pp. 1283-1298
Hirchowitz, R. et al (2000) “Key Baseline Statistics for Poverty Measurement,” Measuring Poverty in South Africa. Statistics South Africa. Pretoria, pp. 53 - 81
Hirway, I (2003) “Identification of Bpl Households for Poverty Alleviation Programmes,” Economic and Political Weekly,38 (45), 4803-38
INEGI-CEPAL (1993) Magnitud y Evolución de la Pobreza en México 1984-1992 Mexico: Instituto Nacional de Estadística, Geografía e Informática
Jalan, J. and R. Murgai (2007) “An Effective “Targeting Shortcut”? An Assessment of the 2002 Below-Poverty Line Census Method,” Mimeo. New Delhi: World Bank
Klasen, S (2000) “Measuring poverty and deprivation in South Africa,” Review of Income and Wealth, 46 (1), pp. 33-58
Morris, M. D (1979) Measuring the Condition of the World's Poor. Oxford: Pergamon
Mukherjee, N (2005) 'Political Corruption in India’s Below the Poverty Line (BPL) Exercise: Grassroots’ Perspectives on BPL in Perpetuating Poverty and Social Exclusion', (New Delhi, India: Development Tracks in Research, Training & Consultancy)
Noble, M., M. Babita, H. Barnes, C. Dibben, W. Magasela, S. Noble., P. Ntshongwana, Phillips, S. Rama, B. Roberts, G. Wright, and S. Zungu (2006) The Provincial
Indices of Multiple Deprivation for South Africa 2001, University of Oxford, UK

37
Noble M, D. McLennan and K. Wilkinson, et al.(2008) The English Indices of Deprivation 2007 London: Department for Communities and Local Government, HMSO
OECD Global Project on Measuring the Progress of Societies. What Are We Doing. Retrieved December, 10, 2008 from Measuring the Progress of Societies http://www.oecd.org/document/5/0,3343,en_40033426_40037349_40038469_1_1_1_1,00.html
O’ Hare, G. and S. Rivas (2007) “Changing poverty distribution in Bolivia: the role of rural–urban migration and urban services,” GeoJournal, 68(4), pp. 307 – 326
Ravallion, M. (1998) “Poverty Lines in Theory and Practice,” LSMS Working Paper 133. The World Bank
Reyes, C.M (2000) Community Based Measurement and Monitoring of Poverty: The Philippine CBMS Experience. Presentation made at the IFPRI Conference, Beijing 2008
Santos, M.A. and K. Ura (2008) “Multidimensional Poverty in Bhutan: Estimates and Policy Implications,” OPHI Working Paper Series (14), www.ophi.org.uk
Seers, D (1977) “The meaning of development,” International Development Review 11(2), pp. 2-7
Sen, A.K (1980) “Equality of What?” in the Tanner Lectures on Human Values. ed. by S.McMurrin. Salt Lake City: University of Utah Press
Sen, A.K (1987) “The Standard of Living,” in The Standard of Living. ed. by G. Hawthorn. Cambridge: Cambridge University Press. 1-38
Sen, A.K (1992) Inequality Re-examined. Oxford: Clarendon Press
Sen, A.K (1996) Freedom, Capabilities, Public Action: a response, eds. Balestrina, A., Carter, I. pp. 107 – 125
Sen, A. K (1999) Development as freedom.1st edn.; New York: Knopf Press
Stewart, F (2006) The Basic Needs Approach. In D. A. Clark (ed.), The Elgar Companion to Development Studies. Cheltenham: Edward Elgar
Streeten, P (1982 )“Basic needs and the new international economic order,” Mondes en Development 10 (39), pp. 317-331
Streeten, P (1984) “Basic needs: Some unanswered questions,” World Development 12(9), pp. 973-978
Sundaram, K (2003) "On Identification of Households Below Poverty Line in Bpl Census 2002: Some Comments on Proposed Methodology," Economic and Political Weekly, 38(9), pp. 4803-08
Thiele, R (2001) The social impact of structural adjustment in Bolivia. Kiel Working Paper No 1056. Kiel Institute of World Economics, Kiel, Germany.
Thiele R, and D. Piazolo (2002) Constructing a social accounting matrix with a distributional focus - the case of Bolivia. Kiel Institute for World Economics, Working Paper 1094. Kiel
USAID/Armenia (2005) Integrated Rural Development: Lessons Learned. USAID. Retrieved on 15 September 2008 from USAID/Armenia at http://pdf.usaid.gov/pdf_docs/PNADF432.pdf

38
Vazquez-Guzman, D (2008) Measurement of income inequality in Mexico: methodology, assessment and empirical relationship with poverty and human development. P.hd Thesis. University of Stirling: Scottish Graduate Programme in Economics