
MULTICRITERIA DECISION ANALYSIS (MCDA) METHODS IN LIFE ...
22
OPERATIONS RESEARCH AND DECISIONS No. 1 2018 DOI: 10.5277/ord180101 Andrzej MACIOŁ 1 Bogdan RĘBIASZ 1 MULTICRITERIA DECISION ANALYSIS (MCDA) METHODS IN LIFE CYCLE ASSESSMENT (LCA). A COMPARISON OF PRIVATE PASSENGER VEHICLES Analogies between the life cycle assessment (LCA) and multicriteria decision analysis (MCDA) methodologies have been discussed as well as LCA as an MCDA problem for resolving the trade-offs between multiple environmental objectives. The objective of this study is to compare a variety of spe- cialised multicriteria methods and knowledge-based methods used to aggregate the results from LCA. The studies were conducted using examples of LCA on private passenger vehicles. The research used two classical methods for multicriteria decision making (AHP and TOPSIS), the method of conven- tional (crisp) reasoning and Mamdani’s method of fuzzy inference. The results demonstrate that among the methods analysed, only crisp reasoning does not provide satisfactory results. Keywords: environmental indicators, life cycle assessment (LCA), multicriteria decision analysis (MCDA), rule-based MCDA, fuzzy reasoning in MCDA 1. Introduction It is widely recognised that one of the most important factors affecting the quality of the environment is the choice of modes of transport (especially in large urban areas). Many publications concern analyses of the harmful environmental impact of various types of passenger cars [1, 8, 21, 22, 25]. This problem is global and many actions are being undertaken to limit the impact. This is evidenced by the regulations adopted by the EU and actions undertaken by national governments aimed at inducing manufactur- ers and customers to improve environmentally friendly solutions and encouraging con- sumers to choose fuel-efficient vehicles for the benefit of the environment. _________________________ 1 Faculty of Management, AGH University of Science and Technology, ul. Gramatyka 10, 30-067 Krakow, Poland, e-mail addresses: [email protected]; [email protected]
Transcript of MULTICRITERIA DECISION ANALYSIS (MCDA) METHODS IN LIFE ...

O P E R A T I O N S R E S E A R C H A N D D E C I S I O N S No. 1 2018 DOI: 10.5277/ord180101
Andrzej MACIOŁ1 Bogdan RĘBIASZ1
MULTICRITERIA DECISION ANALYSIS (MCDA) METHODS IN LIFE CYCLE ASSESSMENT (LCA).
A COMPARISON OF PRIVATE PASSENGER VEHICLES
Analogies between the life cycle assessment (LCA) and multicriteria decision analysis (MCDA) methodologies have been discussed as well as LCA as an MCDA problem for resolving the trade-offs between multiple environmental objectives. The objective of this study is to compare a variety of spe-cialised multicriteria methods and knowledge-based methods used to aggregate the results from LCA. The studies were conducted using examples of LCA on private passenger vehicles. The research used two classical methods for multicriteria decision making (AHP and TOPSIS), the method of conven-tional (crisp) reasoning and Mamdani’s method of fuzzy inference. The results demonstrate that among the methods analysed, only crisp reasoning does not provide satisfactory results.
Keywords: environmental indicators, life cycle assessment (LCA), multicriteria decision analysis (MCDA), rule-based MCDA, fuzzy reasoning in MCDA
1. Introduction
It is widely recognised that one of the most important factors affecting the quality of the environment is the choice of modes of transport (especially in large urban areas). Many publications concern analyses of the harmful environmental impact of various types of passenger cars [1, 8, 21, 22, 25]. This problem is global and many actions are being undertaken to limit the impact. This is evidenced by the regulations adopted by the EU and actions undertaken by national governments aimed at inducing manufactur-ers and customers to improve environmentally friendly solutions and encouraging con-sumers to choose fuel-efficient vehicles for the benefit of the environment.
_________________________ 1 Faculty of Management, AGH University of Science and Technology, ul. Gramatyka 10, 30-067
Krakow, Poland, e-mail addresses: [email protected]; [email protected]

A. MACIOŁ, B. RĘBIASZ 6
Unfortunately, these regulations are often based only on impact factors associated with vehicle operation (fuel consumption, emission of, e.g., NOx, CO, particulate mat-ter). Such a restriction can cause a very imperfect solution. It is necessary to take into account the impact on the environment of the full life cycle of a vehicle from cradle to grave. Every case of life cycle assessment (LCA) involves a problem of applying often contradictory criteria related to various types of impact factor. Traditional methods of LCA are not capable of implementing such comparisons. This is a problem for mul-ticriteria evaluation.
In the 1990s, an attempt was made to combine elements of LCA and multicriteria decision analysis (MCDA). This research has been continued and presented in many publications [2, 4, 8, 13, 22]. Examples of discussions on the analogies between LCA and MCDA in the automotive sector include studies on various biofuels [24, 31], trans-portation systems [3], vehicle fuels [22, 34, 36, 41, 42] concepts of road maintenance [11] and a comparison of various private vehicles in reference to their environmental impact [8]. All these papers assess the alternatives using MCDA methods. Some of them use weighted sums and additive value functions [3, 11, 42]. Others use the analytic hi-erarchy process [24], PROMETHEE and SMAA-LCIA [32, 34, 36], compromise pro-gramming [41] and ELECTRE TRI [8].
It is difficult to discuss in detail all of these references. Each of them is a separate application of MCDA methods to LCA in different sectors. For example, [13] discusses the problem of selecting the optimal alternative for implementing deinked pulp (DIP) using the LCA and MCDA methods. In [8], a methodology to classify light-duty vehi-cles according to their environmental impact is presented. This classification is based on indicators of life cycle impact and vehicle operation that are aggregated using the ELECTRE TRI method. Another approach is presented in [3]. The authors make a com-parison of various Dutch passenger transportation systems by studying their energy use over the complete life cycle. Interesting approaches to the problem of the choice of the MCDA method used in LCA are presented in [2, 18] and many others. Girbula et al. [17] used a MCDM tool for selecting the materials for the instrument panel used in an electric car. The objective of this study is to develop a rational method of selecting the best material for an application based upon the known parameters of the material and the requirements of the application. Among other things, the environmental impacts of four materials are considered and compared. Shana et al. [37] present an interesting, inte-grated approach of LCA and life cycle costing (LCC) to minimize the environmental impact over the life cycle, as well as identifying the costs associated with the life cycle of vehicles.
Currently, there are many different methods and techniques of MCDA, and each can be specifically applied to resolving issues in LCA. Recent developments in applying MCDA to LCA have highlighted that the use of MCDA contributes to supporting envi-ronmental decisions that are consistent with the values of the decision maker by aggre-

MCDA methods in LCA. A comparison of private passenger vehicles 7
gating complex information and being able to cope with both qualitative and quantita-tive data in a transparent, easily interpretable way [16, 18]. Using MCDA, it is possible to incorporate multiple perspectives (environmental protection, economic, sociological, etc.) into an overall assessment in the final weighting phase [34, 39]. MCDA and LCA complement each other well but there are still relatively few studies combining these methods and comparing their effectiveness. There is also the possibility of using meth-ods that have been developed for solving another class of problems but they can also be an alternative in some cases to MCDA. This multiplicity of available tools paradoxically creates additional problems. It was demonstrated in an earlier study that various MCDA methods may produce different results for the same input data [33]. There are different conditions for the use of various methods such as the set of necessary input data, layout of the input data, computational complexity, and the way that results are interpreted. There is a need for further studies to evaluate different methods of MCDA and develop criteria for selecting an appropriate method in different decision-making situations. De-spite the wide range of research on LCA, researchers have not yet developed a reliable method for aggregating the results from LCA. The key goal of our research is to verify the hypothesis that knowledge-based methods can help to solve problems related to the objective assessment of the impact of various factors on the environment.
The aim of our study was to compare a variety of specialized multicriteria methods and knowledge-based methods used to aggregate the results from LCA. The usability of classical methods of MCDA in LCA have been repeatedly verified and the results obtained are considered to be appropriate, but difficult to interpret. This results in the need to check whether knowledge-based methods enabling the results of LCA to be “explained” give results that are similar to proven classical methods of MCDA. These studies were conducted using LCA on private vehicles as an example. In this research, attention was given to two classical methods of multicriteria decision making (AHP and TOPSIS), the method of conventional (crisp) reasoning and Mamdani’s method of fuzzy inference.
The rest of the paper is organized as follows: In Section 2, the data sources and methods used to aggregate the results of LCA are described. In Section 3 the results of calculations made using various methods are presented. Section 4 compares these re-sults and Section 5 contains some concluding remarks.
2. Data sources and methods
In the research, the authors used the methodology described in the ISO standards and presented inter alia in [14] updated with new versions of these standards, among others, ISO 14044.

A. MACIOŁ, B. RĘBIASZ 8
2.1. LCA data
To evaluate the usefulness of various methods of multicriteria analysis, the data presented in [9] were used, taking into consideration assumptions concerning LCA for light-duty vehicles. LCA was applied to assess the potential environmental impact of six EURO 5 compact passenger vehicles (light-duty vehicles): a gasoline internal com-bustion engine vehicle, a diesel internal combustion engine vehicle, a hybrid electric ve-hicle (HEV), a plug-in hybrid electric vehicle with a battery range of 10-miles (PHEV10), a plug-in hybrid electric vehicle with a battery range of 40-miles (PHEV40), and a bat-tery electric vehicle (BEV). One novelty of this research lies in the fact that it combines the whole life cycle of vehicles and their components (e.g., batteries), the electricity generation system, and the production of fossil fuels (gasoline and diesel), from a cra-dle-to-grave perspective. The inventory data were characterised into the following indi-cators, according to the CML 2001 method of LCA [14, 15]: abiotic depletion (AD), acidification (AC), eutrophication (EUT), global warming (GW), ozone layer depletion (OLD), and photochemical oxidation (PO). Additional indicators addressed vehicle op-eration: fuel consumption (primary energy) (FC) and tailpipe and abrasion emissions (NOx, CO, particulate matter PM), since the use phase was considered important in the comparison of vehicles. Normalization of the data is not required for the MCDA method used in the referenced paper (ELECTRE TRI). Nevertheless, normalization was per-formed as a means to facilitate communication with stakeholders, in particular decision makers. It consisted of representing the impact of these alternatives with respect to the emissions of a reference fleet (2011 Portuguese). Using the ELECTRE TRI method, weighting is not required and was not carried out in the cited research.
Because of the purpose of our research (comparison of various MCDA methods), we concluded that the external normalization adopted in the cited paper is not adequate. Therefore, we adopted an internal normalization of relative contribution [6, 13] that does not share the issues of external normalization (mainly due to difficulties in finding a suitable external reference set). Unfortunately, for many MCDA methods, this raises the possibility of the assessment of an option being dependent on which other alterna-tives are being considered: adding or removing one alternative may change the relative positions of the remaining alternatives [7]. The choice of normalization can have an important impact on the results as shown by [4, 23, 32]. Despite these imperfections, we concluded that, given that in the next stage weighting is carried out, the use of inter-nal normalization is the only appropriate solution.
Internal normalization consists of using the highest and lowest impacts of the alterna-tives being compared as references to transform the original scales into the range [0, 1]. In our case, we used the highest value of each impact as a reference. The next step of data preparation was weighting. As is rightly noted in the report by Huppes and van Oers [15], according to ISO 14040 and 14044, weighting is an optional and controversial element in LCA. Several methods of weighting have been developed over the last years. These

MCDA methods in LCA. A comparison of private passenger vehicles 9
can be classified into three categories: subjective, so called panel methods, where a group of experts provide their weighting factors, “monetization” methods, where the weighting factors are expressed as monetary costs and distance-to-target methods, where the weighting factors are calculated as a function of some target values, often based on political decisions. We used the distance-to-target method. In our opinion, the most mature approach is the concept of weighting adopted in the EDIP methodol-ogy [40]. The target figures used for weighting are based on the political reduction tar-gets for the individual substances contributing to the relevant categories of impact. The weights will be used directly in classical MCDA algorithms and in the case of rule-based methods they will help experts to formulate rules.
The process for applying and using weighting in this project contains the following steps:
1. Definition of actual emissions in the reference year. 2. Definition of target emissions in the reference year. 3. Calculation of weighting ratios. In our research we have tried to determine the weights by taking into account the
fact that the aim of this research is not to support specific decisions, but assess the use-fulness of various MCDA methods. We assume that a sufficiently good approximation of universal weights for the impact factors in the case of LCA for light-duty vehicles are the levels of the environmental impact for the Portugal fleet relative to the levels of impact in Europe. The impact of various types of influence was determined based on various reliable sources [9, 10, 12].
Table 1. Normalized values of indicators and their weights
Indicator Weight[%] Gasoline Diesel HEV PHEV10 PHEV40 BEV
AD, g Sb eq 29.86 1.00 0.89 0.90 0.72 0.84 0.72 AC, g SO2 eq 7.85 0.84 0.78 1.00 0.72 0.95 0.78 EUT, g PO4
3– eq 3.19 0.37 0.40 0.42 0.49 0.82 1.00 GW, g CO2 eq 15.63 1.00 0.89 0.90 0.68 0.79 0.61 OLD, g CFC-11 eq 0.01 0.10 0.09 0.17 0.28 1.00 0.03 PO, g C2H4 eq 2.23 0.95 0.66 1.00 0.81 0.88 0.46 FC, MJprim 1.23 1.00 0.88 0.86 0.46 0.28 0.00 NOx, g 14.76 0.17 1.00 0.17 0.08 0.04 0.00 CO, g 14.46 1.00 0.67 1.00 0.45 0.26 0.00 PM, g 10.79 0.97 1.00 0.97 0.61 0.48 0.32
Such an assumption is questionable, since it can be regarded as a kind of normali-
zation and not weighting. Nevertheless, considering that the previous stage adopted in-ternal normalization and is used in many studies, it is assumed that the weighting coef-ficients should be equal. The ratio between the magnitude of the environmental impact
A. MACIOŁ, B. RĘBIASZ 10
caused by the life cycles and operation of vehicles to their overall impact on the envi-ronment can be considered as an acceptable way to express these weights in an evalua-tion of MCDA. There is no methodical foundation to state that such a formulation of weights affects the outcome of the evaluation of a particular MCDA method. Table 1 presents the normalized results for each alternative according to the respective indicator, together with the weights of indicators.
2.2. Classical methods of MCDA
Using MCDA methods, decision makers can select the best alternatives based on multiple criteria. These criteria are often contradictory. The most important features of MCDA are listed below:
There are a limited number of analysed alternatives. Each alternative is characterized by a finite set of criteria. The preference points are discrete. Each criterion takes into account one aspect of the analysed problem. MCDA meth-
ods allow us to evaluate the weight of each criterion. Using these weights, the decision maker can select the preferred alternative. Considering the above properties of MCDA methods, these methods can be used in LCA to aggregate assessments of various tech-nologies according to multiple criteria into a single synthetic indicator. This enables a clear ranking of these technologies from the point of view of their impact on the envi-ronment. These methods therefore form the basis for the clear and easy interpretation of the results from LCA.
There are several dozen multicriteria decision-making methods described in the litera-ture [5, 26, 27, 35]. The most well-known methods of MCDA are: analytic hierarchy process (AHP), technique for order of preference by similarity to ideal solution (TOPSIS), prefer-ence ranking organization method for enrichment of evaluations (PROMETHEE), elimi-nation et choix traduisant la realité (ELECTRE) and visekriterijumska optimizacija i kom-promisno resenje (VIKOR). The most popular and commonly used are AHP and TOP-SIS [26, 27, 38]. We used these methods. Due to their popularity, we have not given a detailed description of these methods.
2.3. Method of conventional (crisp) reasoning
Using a conventional rule-based reasoning system in MCDA is not a commonly known approach. However, efforts have been undertaken to use this approach, inter alia, in investigations on agricultural sustainability. One example would be the DEXiPM system for assessing the sustainability of agricultural cropping systems, developed to design a hierarchical decision tree [30] and method for the multicriteria comparison of investment projects [33].

MCDA methods in LCA. A comparison of private passenger vehicles 11
The essence of such a rule-based approach is the transformation of data from crisp values, firstly into interval values and next into linguistic values. The next step is the formulation of rules by experts in the form of Horn clauses that enable reliable inference about the value of the conclusions presented in the form of linguistic variables. Due to the complexity of the problem, the rules are divided into a hierarchized set of rules linked by intermediate conclusions [28, 29]. The final conclusions can be formulated as a numerical assessment in the appropriate scale and simply used thereafter to rate the alternatives.
2.4. Mamdani’s method of fuzzy inference
The most commonly used technique for fuzzy inference is Mamdani’s method, which was proposed by Mamdani and Assilian [20]. This model was created for the implementation of control systems simulating human behaviour. Mamdani’s model is a set of rules, each of which defines a so-called fuzzy point. These rules are as follows:
1 2
1 21 1 2 1 1 1
1 21 2 2 2 2 2
1 21 2
R1: If ( is ) and ( is ) and ... and ( is ) then ( )
R2 : If ( is ) and ( is ) and ... and ( is ) then ( )
...
R : If ( is ) and ( is ) and ... and ( is ) then ( )m
mm
mm
mn n m n n
x X x X x X y Y
x X x X x X y Y
n x X x X x X y Y
(1)
where xi – crisp values of the current input, jiX and kY – linguistic values (represented
by fuzzy sets) of the variables xi and y in the respective universes. Inference is performed in the following way: Step 1. Fuzzification. The first step is to take the crisp inputs xi, and determine the
degree to which these inputs belong to each of the appropriate fuzzy sets. Step 2. Evaluation of rules. The fuzzified inputs are then applied to the antecedents
of the fuzzy rules. If a given fuzzy rule has multiple antecedents, the fuzzy operator AND is used to obtain a single number that represents the result of the antecedent eval-uation, which in turn determines the value of the conclusion. This requires a suitable operator of fuzzy implication. The most commonly used is Mamdani’s implication op-erator based on the assumption that the degree of truth of the conclusion cannot be greater than the lowest degree of fulfilment of the antecedents, as shown in the following formula:
1 2( ) min( ( ), ( ), ..., ( )my x x x (2)

A. MACIOŁ, B. RĘBIASZ 12
A common alternative is to use the algebraic product operator, PROD:
1 2( ) ( ) ( ), ..., ( )my x x x (3)
The result of the antecedent evaluation can be applied to the membership function of the consequent. The most common method is to bound the consequent membership function to being not greater than the level of the antecedent truth.
Step 3. Aggregation of the outputs of rules. The membership functions of all the consequents of the rules are combined into a single fuzzy set.
Step 4. Defuzzification. The most popular method for defuzzification is the centroid technique. It finds a point representing the centre of gravity (COG) of the aggregated fuzzy set A.
3. Results
3.1. AHP method
Table 2 presents a pairwise comparison of the criteria. When defining these magni-tudes, the scale presented in Table 3 and weights presented in Table 1 were used.
Table 2. Pairwise comparison of criteria
Indicator AD AC EUT GW OLD PO FC NOx CO PM AD 1.00 7.00 9.00 5.00 9.00 9.00 9.00 5.00 5.00 7.00 AC 0.14 1.00 1.00 0.33 3.00 1.00 3.00 0.33 0.33 1.00 EUT 0.11 1.00 1.00 0.20 1.00 1.00 1.00 0.33 0.33 0.33 GW 0.20 3.00 5.00 1.00 5.00 5.00 5.00 1.00 1.00 1.00 OLD 0.11 0.33 1.00 0.20 1.00 1.00 1.00 0.20 0.20 0.33 PO 0.11 1.00 1.00 0.20 1.00 1.00 1.00 0.20 0.20 0.33 FC 0.11 0.33 1.00 0.20 1.00 1.00 1.00 0.20 0.20 0.33 NOx 0.20 3.00 3.00 1.00 5.00 5.00 5.00 1.00 1.00 1.00 CO 0.20 3.00 3.00 1.00 5.00 5.00 5.00 1.00 1.00 1.00 PM 0.14 1.00 3.00 1.00 3.00 3.00 3.00 1.00 1.00 1.00
Table 3. Verbal scale for expert judgements
Importance Definition Explanation1 equal importance two factors contribute equally to the objective
3 somewhat more important experience and judgment slightly favour one over the other
5 much more important experience and judgment strongly favour one over the other
7 very much more important
experience and judgment strongly favour one over the other; its importance is demonstrated in practice
9 absolutely more important
evidence favouring one over the other is of the highest possible validity
2, 4, 6, 8 intermediate values compromise is needed

MCDA methods in LCA. A comparison of private passenger vehicles 13
Table 4 presents the final priority of each criterion.
Table 4. Final priorities of criteria
Indicator AD AC EUT GW OLD PO FC NOx CO PM Final priority 0.390 0.050 0.033 0.123 0.027 0.030 0.027 0.117 0.117 0.087
Table 5 presents the pairwise comparison matrix for the alternatives analysed ac-
cording to the criterion abiotic depletion. This table arose from the data contained in Table 1 and the use of the scale from Table 3. Similar tables were developed for the remaining criteria.
Table 5. Pairwise comparison of alternatives according to the criterion abiotic depletion
Alternative Gasoline Diesel HEV PHEV10 PHEV40 BEV Gasoline 1.00 0.33 0.33 0.11 0.20 0.11 Diesel 3.00 1.00 1.00 0.20 1.00 0.20 HEV 3.00 1.00 1.00 0.14 1.00 0.14 PHEV10 9.00 5.00 7.00 1.00 5.00 1.00 PHEV40 5.00 1.00 1.00 0.20 1.00 0.20 BEV 9.00 5.00 7.00 1.00 5.00 1.00
The performance of each alternative with respect to each criterion is presented in
Table 6.
Table 6. The performance of each alternative with respect to each criterion
Alternative AD AC EU GW OLD PO FC NOx CO PM Gasoline 0.028 0.149 0.237 0.028 0.195 0.047 0.040 0.196 0.034 0.039 Diesel 0.077 0.225 0.237 0.061 0.195 0.253 0.040 0.022 0.070 0.039 HEV 0.068 0.034 0.237 0.061 0.195 0.054 0.046 0.196 0.034 0.039 PHEV10 0.372 0.324 0.224 0.324 0.156 0.064 0.164 0.196 0.166 0.175 PHEV40 0.083 0.044 0.041 0.132 0.023 0.071 0.218 0.196 0.220 0.225 BEV 0.372 0.225 0.023 0.395 0.235 0.511 0.492 0.196 0.477 0.482
The global priority for each alternative is presented in Table 7.
Table 7. The global priority for each alternative
Alternative BEV PHEV10 PHEV40 Diesel HEV Gasoline Global priority 0.357288 0.274493 0.126740 0.087428 0.084214 0.069837
According to the data in Table 7, BEVs are the best.

A. MACIOŁ, B. RĘBIASZ 14
3.2. TOPSIS
We used the data normalised according to the method discussed in Section 2.1. Therefore, the normalization step was unnecessary and the weighted normalized deci-sion matrix [vij] was calculated using the data from Table 1. The weights of the criteria elaborated in the AHP method presented in Table 4 were used in these calculations. Table 8 presents the weighted normalized decision matrix.
Table 8. Weighted normalized decision matrix
Indicator Gasoline Diesel HEV PHEV10 PHEV40 BEV AD 0.3707 0.3305 0.3350 0.2680 0.3126 0.2680 AC 0.0424 0.0392 0.0503 0.0360 0.0477 0.0392 EUT 0.0184 0.0195 0.0205 0.0239 0.0404 0.0491 GW 0.1235 0.1099 0.1114 0.0843 0.0979 0.0753 OLD 0.0028 0.0025 0.0045 0.0075 0.0271 0.0009 PO 0.0287 0.0199 0.0303 0.0244 0.0267 0.0140 FC 0.0271 0.0239 0.0232 0.0125 0.0075 0.0000 NOx 0.0203 0.1173 0.0203 0.0094 0.0047 0.0000 CO 0.1173 0.0782 0.1173 0.0527 0.0306 0.0000 PM 0.0844 0.0872 0.0844 0.0534 0.0422 0.0281
Table 9 presents the distances of the alternatives from the positive and negative
ideal solutions (PIS and NIS, respectively) and the closeness coefficients. According to the data in the table, BEVs are the best.
Table 9. Distances of the alternatives from the PIS and NIS and closeness coefficients for analysed alternatives
Parameter BEV PHEV10 PHEV40 HEV Gasoline Diesel Distance from PIS 0.03087 0.062669 0.072008 0.155439 0.176665 0.170584 Distance from NIS 0.21378 0.174702 0.163514 0.110373 0.104961 0.071095 Closeness coefficients 0.873819 0.735986 0.694261 0.415229 0.372698 0.294171
3.3. Method of conventional (crisp) reasoning
The core idea of the rule-based reasoning approach is evaluation of the analysed vehicles using if-then rules. In the case of the conventional approach, crisp linguistic variables were used to describe the environmental impact of the analysed vehicles. These variables assume values from the domain {low, medium, high}, according to the assessment of vehicles from the point of view of their impact on the environment. This assessment is described on a scale of 1 to 5 (1 corresponds to a vehicle with the lowest

MCDA methods in LCA. A comparison of private passenger vehicles 15
rating – the highest negative impact on the environment). The antecedents were trans-formed into linguistic variables in such a way that their range of variation [0; 1] was divided into three intervals of the same length [0; 0.3333], (0.3333; 0.6667] and (0.6667; 1]. This transformation is very simple. For example, the numerical assessment of the abiotic depletion caused by a BEV, equal to 0.72, corresponds to the linguistic value high, and the assessment of the effect on global warming of such vehicles is equal to 0.61, which corresponds to the linguistic value medium. Due to the very low level of ozone layer depletion caused by vehicles in the fleet in the global environmental problem, this factor was omitted in further analysis. The transformed data are presented in Table 10. R is the numerical value of the standardised assessment and L the linguistic value.
Table 10. Normalized values of the indicators and their transformed values
Indicator Value Gasoline Diesel HEV PHEV10 PHEV40 BEV
AD R 1.00 0.89 0.90 0.72 0.84 0.72 L high high high high high high
AB R 0.84 0.78 1.00 0.72 0.95 0.78 L high high high high high high
EUT R 0.37 0.40 0.42 0.49 0.82 1.00 L medium medium medium medium high high
GW R 1.00 0.89 0.90 0.68 0.79 0.61 L high high high high high medium
PO R 0.95 0.66 1.00 0.81 0.88 0.46 L high medium high high high medium
FC R 1.00 0.88 0.86 0.46 0.28 0.00 L high high high medium low low
NOx R 0.17 1.00 0.17 0.08 0.04 0.00 L low high low low low low
CO R 1.00 0.67 1.00 0.45 0.26 0.00 L high high high medium low low
PM R 0.97 1.00 0.97 0.61 0.48 0.32 L high high high medium medium low
Unfortunately, building a set of rules that take into account all the possible combi-
nations of the values of the input variables is not possible, due to the phenomenon of the exponential “explosion” of the number of rules (the number of rules grows expo-nentially with the number of variables in the premise). In our case, we have 9 variables in the premise and all of them are based on the same linguistic domain of three values. As a result, the construction of a complete knowledge base would require considering 39 examples, i.e., 19 683, which, for obvious reasons, is not possible. The introduction of intermediate criteria (“artificial” or partial variables) is the only possible way to limit the complexity of such a description and to construct a knowledge-based model to a form manageable by experts. In our view, the rationale for structuring the knowledge

A. MACIOŁ, B. RĘBIASZ 16
base is as follows. First, we independently take into consideration factors related to LCA and factors related to vehicle operation. This will allow us to balance the ratings accord-ing to these two groups of factors to make it possible to take into account objectives and strategies for stakeholder analysis. However, such a division of the set of rules does not solve the problem. In the group of factors related to LCA, we have five variables that provide 243 possible combinations which cannot be fully captured by experts. Since there are no grounds for further decomposition of this subset, it would be logical to categorise indicators from the point of view of the importance of their impact on the level of the relevant phenomena overall. The first subset of factors includes abiotic de-pletion and global warming, whose share in harmful environmental impact in Europe amounts to 29.86% and 15.63%, respectively, and the second subset acidification, eu-trophication and photochemical oxidation with shares of 7.85%, 3.19% and 2.23%, re-spectively. A structured illustration of the knowledge base is presented in Fig. 1. Due to the character of these variables, it is possible to automatically generate combinations of linguistic values in the form of a Cartesian product. Next, crisp values were assigned to the intermediate and final assessments. The knowledge-based model can be presented in the form of five decision tables (Tables 11–15).
Fig. 1. Illustration of the knowledge base
Table 11. Decision table for high weight indicators of LCIA
No. AD GW LCIA high weight1 high high high2 high medium high3 high low high4 medium high medium5 medium medium medium6 medium low medium7 low high medium8 low medium low9 low low low

MCDA methods in LCA. A comparison of private passenger vehicles 17
Table 12. Decision table for low weight indicators of LCIA
No. AD EUT PO LCIA low weights1 high high high high2 high high medium high3 high high low high4 high medium high high5 high medium medium medium··· ··· ··· ··· ···23 low medium medium low24 low medium low low25 low low high low26 low low medium low27 low low low low
Table 13. Decision table for global indicators of LCIA
No. LCIA high weights LCIA low weights LCIA global1 high high high2 high medium high3 high low medium4 medium high medium5 medium medium medium6 medium low medium7 low high medium8 low medium low9 low low low
Table 14. Decision table for assessment of the effect of vehicle operation
No. FC NOx CO PM Vehicle operation1 high high high high high2 high high high medium high3 high high high low high4 high high medium high high5 high high medium medium medium···. ··· ··· ··· ··· ···77 low low medium medium low78 low low medium low low79 low low low high low80 low low low medium low81 low low low low low

A. MACIOŁ, B. RĘBIASZ 18
Table 15. Decision table for the final assessment
No. LCIA global Vehicle operation Final assessment1 high high 12 high medium 23 high low 24 medium high 25 medium medium 26 medium low 37 low high 38 low medium 49 low low 5
The reasoning is realized in five stages (steps). During the first stage, assessment of the
high weight LCA indicators is established as a result of the linguistic values of the effects on abiotic depletion and global warming, as defined by the set of rules given in Table 11. Next, assessment of the low weight LCA indicators is established using the rules presented in Table 12, and the global LCA indicators are assessed using the decision table presented in Table 13. During the fourth stage, vehicle operation is evaluated as the joint effect of fuel consumption, NOx emission, CO emission and the particulate matter indicator (Table 14). Finally, the overall assessment of each vehicle type is established on the grounds of the previously evaluated global LCA indicator and the overall vehicle operation indicator (Table 15). Table 16 presents the intermediate and final results from such reasoning.
Table 16. Intermediate and final results from crisp reasoning
Indicator Gasoline Diesel HEV PHEV10 PHEV40 BEV LCIA high weights high high high high high high LCIA low weights high medium high high high high LCIA global high high high high high high Vehicle operation medium high medium medium low low Final assessment 2 1 2 2 2 2
3.4. Mamdani’s method of fuzzy inference
This method of evaluation does not distinguish between the environmental effects of the options clearly. Diesel vehicles have the worst rating, while all the other types have the same rating. Using Mamdani’s method, we use the same rules as in the case of crisp reasoning. The method requires that all of the input variables are either directly presented in the form of linguistic variables or transformed into this form. In our exam-ple, we have to address crisp values. This is why it is necessary to transform them into the form of linguistic variables. For each of the input variables, the input membership

MCDA methods in LCA. A comparison of private passenger vehicles 19
functions are triangular functions which can be represented as in Fig. 2 or in the follow-ing form: Tlow(0; 0; 0.5), Tmedium(0; 0.5; 1.0), Thigh(0.5; 1.0; 1.0).
Fig. 2. Membership function of an indicator variable
Table 17. Input data for Mamdani’s method of fuzzy inference after fuzzification
Indicator LV Gasoline Diesel HEV PHEV10 PHEV40 BEV
AD low 0.00 0.00 0.00 0.00 0.00 0.00 medium 0.00 0.22 0.19 0.55 0.31 0.55 high 1.00 0.78 0.81 0.45 0.69 0.45
AB low 0.00 0.00 0.00 0.00 0.00 0.00 medium 0.32 0.44 0.00 0.57 0.11 0.44 high 0.68 0.56 1.00 0.43 0.89 0.56
EUT low 0.25 0.20 0.17 0.03 0.00 0.00 medium 0.75 0.80 0.83 0.97 0.36 0.00 high 0.00 0.00 0.00 0.00 0.64 1.00
GW low 0.00 0.00 0.00 0.00 0.00 0.00 medium 0.00 0.22 0.20 0.63 0.41 0.78 high 1.00 0.78 0.80 0.37 0.59 0.22
PO low 0.00 0.00 0.00 0.00 0.00 0.08 medium 0.11 0.69 0.00 0.39 0.24 0.92 high 0.89 0.31 1.00 0.61 0.76 0.00
FC low 0.00 0.00 0.00 0.08 0.45 1.00 medium 0.00 0.24 0.29 0.92 0.55 0.00 high 1.00 0.76 0.71 0.00 0.00 0.00
NOx low 0.65 0.00 0.65 0.84 0.92 1.00 medium 0.35 0.00 0.35 0.16 0.08 0.00 high 0.00 1.00 0.00 0.00 0.00 0.00
CO low 0.00 0.00 0.00 0.10 0.48 1.00 medium 0.00 0.67 0.00 0.90 0.52 0.00 high 1.00 0.33 1.00 0.00 0.00 0.00
PM low 0.00 0.00 0.00 0.00 0.03 0.35 medium 0.06 0.00 0.06 0.77 0.97 0.65 high 0.94 1.00 0.94 0.23 0.00 0.00
A. MACIOŁ, B. RĘBIASZ 20
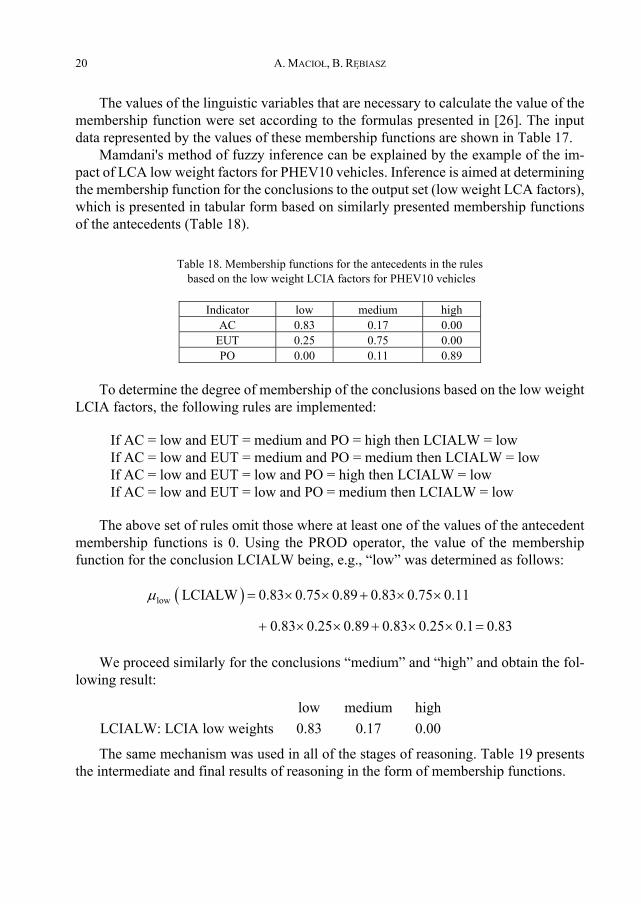
The values of the linguistic variables that are necessary to calculate the value of the membership function were set according to the formulas presented in [26]. The input data represented by the values of these membership functions are shown in Table 17.
Mamdani's method of fuzzy inference can be explained by the example of the im-pact of LCA low weight factors for PHEV10 vehicles. Inference is aimed at determining the membership function for the conclusions to the output set (low weight LCA factors), which is presented in tabular form based on similarly presented membership functions of the antecedents (Table 18).
Table 18. Membership functions for the antecedents in the rules based on the low weight LCIA factors for PHEV10 vehicles
Indicator low medium highAC 0.83 0.17 0.00
EUT 0.25 0.75 0.00PO 0.00 0.11 0.89
To determine the degree of membership of the conclusions based on the low weight
LCIA factors, the following rules are implemented:
If AC = low and EUT = medium and PO = high then LCIALW = low If AC = low and EUT = medium and PO = medium then LCIALW = low If AC = low and EUT = low and PO = high then LCIALW = low If AC = low and EUT = low and PO = medium then LCIALW = low
The above set of rules omit those where at least one of the values of the antecedent membership functions is 0. Using the PROD operator, the value of the membership function for the conclusion LCIALW being, e.g., “low” was determined as follows:
low LCIALW 0.83 0.75 0.89 0.83 0.75 0.11
0.83 0.25 0.89 0.83 0.25 0.1 0.83
We proceed similarly for the conclusions “medium” and “high” and obtain the fol-lowing result:
low medium highLCIALW: LCIA low weights 0.83 0.17 0.00
The same mechanism was used in all of the stages of reasoning. Table 19 presents the intermediate and final results of reasoning in the form of membership functions.

MCDA methods in LCA. A comparison of private passenger vehicles 21
Table 19. Intermediate and final results of reasoning using Mamdani’s method
Indicator Level Gasoline Diesel HEV PHEV10 PHEV40 BEV
LCIA high weightslow 0.00 0.00 0.00 0.00 0.00 0.00 medium 0.00 0.22 0.19 0.55 0.31 0.55 high 1.00 0.78 0.81 0.45 0.69 0.45
LCIA low weights low 0.00 0.00 0.00 0.00 0.00 0.00 medium 0.55 0.86 0.17 0.74 0.13 0.44 high 0.45 0.14 0.83 0.26 0.87 0.56
LCIA global low 0.00 0.00 0.00 0.00 0.00 0.00 medium 0.83 0.22 0.19 0.55 0.31 0.55 high 0.17 0.78 0.81 0.45 0.69 0.45
Vehicle operation low 0.00 0.00 0.00 0.14 0.66 1.00 medium 0.04 0.00 0.65 0.86 0.34 0.00 high 0.96 1.00 0.35 0.00 0.00 0.00
Final assessment
1 0.96 0.78 0.28 0.00 0.00 0.00 2 0.04 0.22 0.72 0.92 0.79 0.45 3 0.00 0.00 0.00 0.08 0.21 0.55 4 0.00 0.00 0.00 0.00 0.00 0.00 5 0.00 0.00 0.00 0.00 0.00 0.00
The final assessment was evaluated as the weighted average of the intermediate
results (Table 20).
Table 20. The final assessment according to Mamdani’s method
Alternative Gasoline Diesel HEV PHEV10 PHEV40 BEV Final assessment 1.04 1.22 1.72 2.08 2.21 2.55
The results of such inference are basically consistent with the results of crisp rea-
soning. However, it ensures a higher diversity in the assessments of the vehicles which were recognized in the previous analysis as being identical in terms of their impact on the environment. Five classes of vehicles: Gasoline, HEV, PHEV10, PEHV40 and BEV, were assessed by crisp reasoning to be at the same level. However, using fuzzy reasoning these assessments clearly differ.
3.5. Sensitivity analysis for Mamdani’s method of fuzzy inference
In the case of rule-based methods of MCDA, we have to address the subjective opinions of experts, expressed in the form of rules and not only weights, to a consider-ably greater extent than in the case of classical methods. An attempt was made to assess the sensitivity of Mamdani's method to the assumptions made by the experts. In the case of crisp reasoning, the results of inference show very little variance, and inevitably this kind of reasoning is much less sensitive to the assumptions of experts.

A. MACIOŁ, B. RĘBIASZ 22
An experiment was conducted to assess how a change in the views of experts affects the ranking of vehicles. It was assumed that in certain circumstances the impact of ve-hicle operation is much more important than the impact of LCA (this may be, for exam-ple, the point of view of managers of large agglomerations). Appropriate adjustments were made to the decision table defining the final assessment of vehicles (Table 21).
Table 21. Comparison of two sets of rules for assessment
No. LCIA global Vehicle operation Final assessment
LCA and operationequally weighted
Operation higher weighted
1 high high 1 12 high medium 2 23 high low 2 34 medium high 2 25 medium medium 2 26 medium low 3 47 low high 3 38 low medium 4 49 low low 5 5
This statement can be interpreted as follows: when vehicles have a high (very neg-
ative) impact based on LCA but a very low impact based on operation, the overall im-pact is assessed according to the first approach as 2 (on a scale of 1–5), i.e., relatively negative. According to the latter approach, where the experts gave operation a higher weight, such vehicles received an improved assessment (3). The situation is similar for case 6 (effects based on LCA are medium, but low based on operation).
A comparison of the effects of these two methods of assessment is presented in Table 22.
Table 22.Comparison of the effects of two methods of assessment
Strategy Gasoline Diesel HEV PHEV10 PHEV40 BEVFirst 1.04 1.22 1.72 2.08 2.21 2.55Second 1.04 1.22 1.72 2.23 2.87 3.55
As one can see, there is no change in the ranking of individual types of vehicles, but there exists a significant increase in the ratings of PHEV10, PHEV40 and, particularly, BEV, which may be of importance when decisions concerning the strategy to be applied in an urban environment are made (the numerical assessment of BEV is almost 40% improved according to the second method of assessment).

MCDA methods in LCA. A comparison of private passenger vehicles 23
4. Assessment and comparison of the results
Due to the different ranges of assessments resulting from the various methods ap-plied, direct comparison of results is not warranted. In view of this, the results obtained according to a given method were scaled so that the greatest value was equal to one. A comparison of the standardised results for the methods used is presented in Table 23.
Table 23. Comparison of the results obtained using various methods
Method Gasoline Diesel HEV PHEV10 PHEV40 BEV
AHP normalized 0.20 0.25 0.24 0.77 0.36 1.00 ranking 6 4 5 2 3 1
TOPSIS normalized 0.43 0.34 0.48 0.84 0.79 1.00 ranking 5 6 4 2 3 1
Classical rule-based normalized 2 1 2 2 2 2 ranking 1 6 1 1 1 1
Mamdani’s I normalized 0.41 0.48 0.67 0.82 0.87 1.00 ranking 6 5 4 3 2 1
Mamdani’s II normalized 0.29 0.34 0.48 0.63 0.81 1.00 ranking 6 5 4 3 2 1
Regardless of the method of evaluating vehicles, BEVs obtained the highest rank-
ing. The type of vehicle that obtained the lowest ranking varied. In some cases, diesel engine vehicles obtained the lowest ranking, and in some cases gasoline engine vehi-cles. Also, the intermediate rankings according to the methods used vary slightly. The classical rule-based approach flattens the results of these assessments so much that they are completely impractical for LCA. Increasing the discriminative power of the overall assessments obtained using this approach is indeed possible, but would be linked with the need to analyse a much greater number of combinations of partial assessments that virtually eliminates the possibility of rational assessment by experts. Despite the similarity of the results obtained using classical methods of MCDA and rule-based methods, it can be seen that the evaluations made according to Mamdani's methods are more in line with common sense judgments. This is because rule-based methods reflect a human-like way of thinking. However, to find out whether this fea-ture favours rule-based methods, further research is needed. One advantage of rule-based methods lies in the fact that the model of the knowledge base and the clear way in which conclusions are reached are easily interpretable to the user, which is difficult to say in the case of classical methods of MCDA.

A. MACIOŁ, B. RĘBIASZ 24
5. Conclusions
The aim of our research was to verify the hypothesis that for the assessment of the environmental impact of different types of vehicles, appropriately good results can be obtained using classical methods of multicriteria decision making (AHP and TOPSIS), the method of conventional (crisp) reasoning and Mamdani’s method of fuzzy infer-ence. Further, the highlight of our research was the confirmation of the hypothesis that rule-based methods, which have been unverified in LCA, give similar results to those obtained by classical methods of MCDA and at the same time are clearly interpretable. The results obtained demonstrate that among the methods analysed, only crisp reasoning does not give satisfactory results. The remaining methods give diversity in the final assessment, but there are no methods to assess the quality of these assessments. The fact that the AHP method, TOPSIS method and Mamdani’s method significantly, and simi-larly, differentiate between the different types of engines, despite their different mech-anisms of reasoning, leads to the adoption of the prudent hypothesis that further work should focus on these three approaches. Fuzzy knowledge-based systems, which consist not only of a knowledge base but also a method of inference by experts, are especially promising. Future work will analyse other methods of fuzzy reasoning, among others the commonly used Takagi–Sugeno and RIMER methods presented in [19]. However, the key problem that requires further research is the question of weighting the indicators of LCA and operation. As mentioned in Section 2.1, the most mature approach is the concept of weighting used in the EDIP methodology. Future work will use this approach to determine weights and rules based on the goals of certain European countries or large cities.
We also anticipate extending the area of our research in the future. We are currently working on the problem of benchmarking environmental sustainability in the case of European metropolises.
Acknowledgments
This work is supported by the AGH University statutory research grant No. 11/11.200.327.
References
[1] BAUER C., HOFER J., ALTHAUS H.-J., DEL DUCE A., SIMONS A., The environmental performance of cur-rent and future passenger vehicles. Life cycle assessment based on a novel scenario analysis framework, Appl. Energy, 2015, 157, 871–883.
[2] BENOIT V., ROUSSEAUX P., Aid for aggregating the impacts in Life Cycle assessment, Int. J. Life Cycle Assess., 2003, 8 (2), 74–82.
[3] BOUWMAN M.E., MOLL H.C., Environmental analyses of land transportation systems in The Nether-lands, Transp. Res. Part D Transp. Environ., 2002, 7 (5), 331–345.

MCDA methods in LCA. A comparison of private passenger vehicles 25
[4] CHEVALIER J., ROUSSEAUX P., Classification in LCA. Building of a coherent family of criteria, Int. J. Life Cycle Assess., 1999, 4 (6), 352–356.
[5] COYLE G., The Analytic Hierarchy Process (AHP). Practical strategy. Structured tools and techniques, open access material, Pearson Education Ltd., Glasgow 2004.
[6] DAHLBO H., KOSKELA S., PIHKOLA H., NORS M., FEDERLEY M., SEPPÄLÄ J., Comparison of different normalised LCIA results and their feasibility in communication, Int. J. Life Cycle Assess., 2013, 18 (4), 850–860.
[7] DIAS L.C., DOMINGUES A.R., On multicriteria sustainability assessment. Spider-gram surface and de-pendence biases, Appl. Energy, 2014, 113, 159–163.
[8] DOMINGUES A.R., MARQUES P., GARCIA R., FREIRE F., DIAS L.C., Applying multicriteria decision anal-ysis to the lifecycle assessment of vehicles, J. Clean. Prod., 2015, 107, 749–759.
[9] EEA, Annual European Union greenhouse gas inventory 1990–2014 and inventory report 2016, EEA Report No. 15/2016.
[10] EEA, European Union emission inventory report 1990–2014 under the UNECE Convention on Long-range Transboundary Air Pollution (LRTAP), EEA Report No. 9/2017.
[11] ELGHALI L., COWELL S.J., BEGG K.G., CLIFT R., Support for sustainable development policy decisions. A case study from highway maintenance, Int. J. Life Cycle Assess., 2006, 11 (1), 29–39.
[12] Fuels Europe, Statistical Report 2016. [13] GAUDREAULT C., SAMSON R., STUART P., Implications of choices and interpretation in LCA for mul-
ticriteria process design. De-inked pulp capacity and cogeneration at a paper mill case study, J. Clean. Prod., 2009, 17 (17), 1535–1546.
[14] GUINÉE J., HEIJUNGS R., HUPPES G., KLEIJN R., DE KONING A., VAN OERS L., WEGENER SLEESWIJK A., SUH S., UDO DE HAES H.A., DE BRUIJN H., VAN DUIN R., HUIJBREGTS M.A.J., GORREE M., Handbook on Life Cycle Assessment. Operational Guide to the ISO Standards, Kluwer Academic Publishers, 2002.
[15] HUPPES G., VAN OERS L., Background review of existing weighting approaches in life cycle impact assessment (LCIA), JRC Scientific and Technical Reports, EUR, 2011.
[16] JESWANI H.K., AZAPAGIC A., SCHEPELMANN P., RITTHOFF M., Options for broadening and deepening the LCA approaches, J. Clean. Prod., 2010, 18 (2), 120–127.
[17] JEYA GIRUBHA R., VINODH S., Application of fuzzy VIKOR and environmental impact analysis for ma-terial selection of an automotive component, Mater. Des., 2012, 37 (Supplement C), 478–486.
[18] KIKER G.A., BRIDGES T.S., VARGHESE A., SEAGER T.P., LINKOV I., Application of multicriteria decision analysis in environmental decision making, Integr. Environ. Assess. Manage., 2005, 1 (2), 95–108.
[19] MACIOL A., REBIASZ B., Advanced Methods in Investment Projects Evaluation, AGH University of Science and Technology Press, Krakow 2016.
[20] MAMDANI E.H., ASSILIAN S., An experiment in linguistic synthesis with a fuzzy logic controller, Int. J. Man. Mach. Stud., 1975, 7, 1–13.
[21] MESSAGIE M., BOUREIMA F.-S., COOSEMANS T., MACHARIS C., VAN MIERLO J., A range-based vehicle life cycle assessment incorporating variability in the environmental assessment of different vehicle technologies and fuels, Energies, 2014, 7 (3), 1467–1482.
[22] MESSAGIE M., MACHARIS C., VAN MIERLO J., Key outcomes from life cycle assessment of vehicles, a state of the art literature review, World Electric Vehicle Symposium and Exhibition (EVS27) 2013, 2013, 1–9.
[23] MYLLYVIITA T., LESKINEN P., SEPPÄLÄ J., Impact of normalisation, elicitation technique and back-ground information on panel weighting results in life cycle assessment, Int. J. Life Cycle Assess., 2014, 19 (2), 377–386.
[24] NARAYANAN D., ZHANG Y., MANNAN M.S., Engineering for sustainable development (ESD) in bio-diesel production, Proc. Safety Environ. Prot., 2007, 85 (5), 349–359.

A. MACIOŁ, B. RĘBIASZ 26
[25] NEMRY F., LEDUC G., MONGELLI I., UIHLEIN A., Environmental Improvement of Passenger Cars (IMPRO-car), JRC Scientific and Technical Reports, Seville 2008.
[26] OLSON D.L., Decision Aids for Selection Problems, Springer, 1996. [27] OLSON D.L., Comparison of weights in TOPSIS models, Math. Comp. Model., 2004, 40 (7–8), 721–727. [28] PARSONS S., Current approaches to handling imperfect information in data and knowledge bases,
Knowl. Data Eng. IEEE Trans., 1996, 8, 353–372. [29] PEARL J., Probabilistic Reasoning in Intelligent Systems. Networks of Plausible Inference, Morgan
Kaufmann Publishers, Inc., San Francisco, CA, USA, 1988. [30] PELZER E., FORTINO G., BOCKSTALLER C., ANGEVIN F., LAMINE C., MOONEN C., VASILEIADIS V., GUÉRIN D.,
GUICHARD L., REAU R., MESSÉAN A., Assessing innovative cropping systems with DEXiPM, a qualitative multicriteria assessment tool derived from DEXi, Ecol. Indic., 2012, 18, 171–182.
[31] PERIMENIS A., WALIMWIPI H., ZINOVIEV S., MÜLLER-LANGER F., MIERTUS S., Development of a deci-sion support tool for the assessment of biofuels, Energy Policy, 2011, 39 (3), 1782–1793.
[32] PRADO-LOPEZ V., SEAGER T.P., CHESTER M., LAURIN L., BERNARDO M., TYLOCK S., Stochastic multi-attribute analysis (SMAA) as an interpretation method for comparative lifecycle assessment (LCA), Int. J. Life Cycle Assess., 2014, 19 (2), 405–416.
[33] RĘBIASZ B., MACIOŁ A., Comparison of classical multicriteria decision making methods with fuzzy rule-based methods on the example of investment projects evaluation, [In:] R. Neves-Silva, L.C. Jain, R.J. Howlett (Eds.), Intelligent Decision Technologies, Proc. 7th KES International Conference on Intelligent Decision Technologies, Springer International Publishing, Cham 2015, 549–561.
[34] ROGERS K., SEAGE T.P., Environmental decision-making using life cycle impact assessment and sto-chastic multiattribute decision analysis. A case study on alternative transportation fuels, Environ. Sci. Technol., 2009, 43 (6), 1718–1723.
[35] SAATY T.L., The Analytic Hierarchy Process. Planning, Priority Setting, Resource Allocation, McGraw- -Hill, New York 1980.
[36] SAFAEI MOHAMADABADI H., TICHKOWSKY G., KUMAR A., Development of a multicriteria assessment model for ranking of renewable and non-renewable transportation fuel vehicles, Energy, 2009, 34 (1), 112–125.
[37] SHAMAA M.S., VINODH S., JAYAKRISHNA K., Integrated life cycle assessment and activity based life cycle costing approach for an automotive product, Sci. Iran. E., 2015, 22 (3), 1179–1188.
[38] SHIH H.-S., SHYUR H.-J., LEE E.S., An extension of TOPSIS for group decision making, Math. Comput. Model., 2007, 45 (7), 801–813.
[39] SOARES S.R., TOFFOLETTO L., DESCHÊNES L., Development of weighting factors in the context of LCIA, J. Clean. Prod., 2006, 14 (6–7), 649–660.
[40] Impact categories, normalisation and weighting in LCA, H.K. Stranddorf, L. Hoffmann, A. Schmidt (Eds.), available from: http://lca-center.dk/wp-content/uploads/2015/08/LCA-technical-report-impact -categories-normalisation-and-weighting-in-LCA.pdf, 2005.
[41] TAN R.R., CULABA A.B., PURVIS M.R.I., POLCAGE 1.0 – a possibilistic lifecycle assessment model for evaluating alternative transportation fuels, Environ. Model. Soft., 2004, 19 (10), 907–918.
[42] ZHOU Z., JIANG H., QIN L., Life cycle sustainability assessment of fuels, Fuel, 2007, 86 (1–2), 256–263.
Received 7 August 2017 Accepted 7 April 2018


