0527-kyotoshi-01Title 0527-kyotoshi-01 Created Date 5/27/2020 9:15:19 AM
MR. BRANDON FRITZ (Orcid ID : 0000-0001-5856-0527)
Article type : Original Research Article
Genetic Selection for Alcohol Preference in Mice Alters
Dorsal Striatum Neurotransmission
Brandon M. Fritz1, Braulio Munoz1, & Brady K. Atwood1,2
1Department of Pharmacology & Toxicology, 2Stark Neurosciences Research Institute,
Indiana University School of Medicine, 320 West 15th St, Indianapolis, IN, USA 46202.
Correspondence:
Brady K. Atwood
Indiana University School of Medicine
NB 400C
320 W 15th St.
Indianapolis, IN, USA 46202
Tel: 317-274-8917
Fax: 317-274-7714
Acc
epte
d A
rtic
le
____________________________________________________
This is the author's manuscript of the article published in final edited form as:
Fritz, B. M., Munoz, B., & Atwood, B. K. (2019). Genetic Selection for Alcohol Preference in Mice Alters Dorsal Striatum Neurotransmission. Alcoholism: Clinical and Experimental Research, 0(ja). https://doi.org/10.1111/acer.14187
This article is protected by copyright. All rights reserved
Email: [email protected]
ABSTRACT
Background: Although it is widely acknowledged that the risk of developing an alcohol use
disorder (AUD) is strongly influenced by genetic factors, very little is known about how this
genetic predisposition may alter neurotransmission in a way that promotes AUD
susceptibility. The dorsal striatum has garnered increased attention as a brain region of
Acc
epte
d A
rtic
le
This article is protected by copyright. All rights reserved
interest in AUD development given its significant roles in goal-directed and habitual
behavior.
Methods: In the present work, dorsal striatal neurotransmission parameters were measured
in preclinical mouse models of high and low AUD risk. We performed brain slice whole-cell
patch clamp electrophysiological recordings from medium spiny neurons (MSNs) in the
dorsomedial (DMS) and dorsolateral (DLS) striatum of naïve adult male and female
selectively-bred high and low alcohol-preferring lines of mice (HAP and LAP).
Results: We found that MSNs of HAP mice were significantly more excitable than those of
LAP mice, specifically in the DLS. Additionally, the frequencies of spontaneous glutamate-
and GABA-mediated currents were both elevated in HAP mice relative to LAP mice in both
dorsal striatal subregions, whereas amplitude differences were more variable between lines
and subregions. AMPAR/NMDAR current ratios were significantly lower in HAP mice in both
DLS and DMS.
Conclusions: Collectively, these results suggest that genetic predisposition for high or low
alcohol consumption produces significantly different basal functional states within both DLS
and DMS which may be important factors in the behavioral phenotypes of HAP and LAP
mice.
Keywords: Alcohol, dorsal striatum, genetics, glutamate, GABA, mice
Acc
epte
d A
rtic
le
This article is protected by copyright. All rights reserved
INTRODUCTION
An individual’s risk for developing an Alcohol Use Disorder (AUD) is heavily
influenced by his or her genetic background. In fact, the relative ‘density,’ or pervasiveness
of AUD diagnosis in an individual’s family is positively related to the likelihood of future
problematic alcohol use (Kendler et al., 2018). This association is especially strong if one or
both parents reach AUD diagnostic criteria. An analysis of a large United States sample
determined that having one parent with AUD produced a 2.5-fold increase in risk for AUD
development, whereas having both parents with AUD resulted in a 4.4-fold increase in risk
(Yoon et al., 2013). This heavy genetic load, along with the inherent complexity of AUD,
suggests that this predisposition likely manifests in neurobiological and neurophysiological
alterations.
The dorsal striatum is a prominent brain region of interest in the etiology of AUD,
composed of ~95% GABAergic medium spiny projection neurons (MSNs) (Tepper and
Bolam, 2004), and is the primary input nucleus of the basal ganglia. The dorsal striatum can
be anatomically divided into medial (DMS) and lateral (DLS) subregions, each receiving
unique excitatory glutamatergic inputs from diverse cortical regions and thalamic nuclei as
well as from basolateral amygdala (Hunnicutt et al., 2016). Both human and animal studies
demonstrate that the DMS and DLS are also functionally heterogeneous, with the DMS
having a prominent role in goal-directed learning whereas the DLS is important in habit
learning (Balleine and O'Doherty, 2010; Tricomi et al., 2009; Yin et al., 2004). Aberrant
function in each of these regions has been hypothesized to have relevance for problematic
drug and alcohol (ethanol) use, with the DMS promoting hyper goal-directed behavior aimed
at substance use/seeking (Cheng et al., 2017; Nam et al., 2013), and the DLS driving the
development of habitual use/seeking (Everitt and Robbins, 2016).
Human imaging studies reveal elevated blood oxygen levels (putative neural activity)
in the dorsal striatum of heavy drinking individuals (including those with AUD) relative to
social drinkers in response to alcohol-related cues (Vollstadt-Klein et al., 2010).
Acc
epte
d A
rtic
le

This article is protected by copyright. All rights reserved
Furthermore, individuals with AUD demonstrate an overreliance on habit learning coupled
with increased activation of the posterior putamen (analogous to the DLS) during an
instrumental learning task (Sjoerds et al., 2013). Preclinical studies also demonstrate that
the DMS regulates goal-directed alcohol seeking whereas the DLS regulates habitual
alcohol seeking (Corbit et al., 2012, 2014). Furthermore, alcohol exposure can differentially
influence synaptic input to and plasticity within both dorsal striatum subregions (Adermark et
al., 2011; Munoz et al., 2018; Wang et al., 2010; Wilcox et al., 2014), thus having the
potential to influence how an individual interacts with alcohol with repeated use.
The above findings inspire an important question: does genetic predisposition for
AUD manifest as aberrant dorsal striatum function in a manner that may increase the risk of
AUD development? Human work has primarily focused on the ventral striatum and altered
function is indeed observed in children of one or more parents with AUD (Bjork et al., 2008;
Heitzeg et al., 2010). However, whether functional differences in the dorsal striatum
subregions exist prior to alcohol exposure in individuals predisposed to AUD development
remains unclear. One challenge of human imaging work is the broad nature of its analysis.
Preclinical techniques employing animal models (e.g. electrophysiology) allow for direct
measurement of neural activity within the brain region(s) of interest and have the power to
address mechanisms of functional differences. To address the question posed above, the
current study comparatively assessed functional differences in DMS and DLS
neurotransmission in mouse models of divergent genetic risk for AUD development.
METHODS
Animals
Naïve adult (postnatal day 60-115) mice from the genetically-selected high and low
alcohol-preferring mouse lines (HAP and LAP) were used. Detailed information regarding
the derivation and drinking behavior of these lines can be found elsewhere (Matson and
Grahame, 2013; Oberlin et al., 2011). Briefly, these lines have been selectively-bred for
many generations from a common outbred stock (HS/Ibg) for high or low alcohol preference
Acc
epte
d A
rtic
le

This article is protected by copyright. All rights reserved
in a 2-bottle choice drinking paradigm. HAP mice demonstrate nearly complete preference
for the alcohol solution over water (~90-95% preference) and reach blood alcohol
concentrations in excess of 80 mg/dl, whereas LAP mice are nearly complete abstainers (<
5% preference). These lines thus model divergent genetic predisposition for excessive
alcohol intake and avoidance. HAP mice also exhibit other AUD-relevant phenotypes relative
to LAP mice such as heightened impulsivity (Oberlin and Grahame, 2009), enhanced alcohol
tolerance capacity (Fritz and Boehm, 2014; Fritz et al., 2013), and a propensity for binge-like
alcohol consumption (Linsenbardt and Boehm, 2015). In selective breeding studies, these
associated phenotypes are referred to as ‘correlated responses’ to selection. For the current
work, mice from replicates 2 and 3 of selection were used (HAP2/HAP3 and LAP2/LAP3). A
‘replicate’ line is one where selective breeding from the outbred stock was repeated to, in
part, ensure that the selection phenotype (alcohol preference) is reliably produced. The
observation of line differences within one or more replicate lines is considered evidence for a
genetically correlated response (Crabbe et al., 1990), with more consistency across
replicates providing increasingly strong evidence. Given that the LAP1 line is extinct,
replicate 1 mice were not used in the current study because no genetic comparison could be
made.
Electrophysiology
Mice were deeply anesthetized via isoflurane and decapitated. Brain tissue was then
rapidly excised and transferred to an ice-cold, oxygenated (95% CO2/5% O2 bubbled) cutting
solution containing (mM): 30 NaCl, 4.5 KCl, 1 MgCl2, 26 NaHCO3, 1.2 NaH2PO4, 10 glucose,
and 194 sucrose. 280 µm coronal brain slices containing the striatum were prepared on a
Leica VT1200S vibratome. Sections were rapidly transferred to 32 °C, oxygenated artificial
cerebrospinal fluid (aCSF) containing (mM): 124 NaCl, 4.5 KCl, 2 CaCl2, 1 MgCl2, 26
NaHCO3, 1.2 NaH2PO4 and 10 glucose.
Whole-cell voltage and current clamp recordings were made using a Multiclamp 700B
amplifier and Digidata 1550B (Molecular Devices, Sunnyvale, CA, USA). For recording,
brain slices were moved to a recording chamber, held at 32 °C, and continuously perfused
Acc
epte
d A
rtic
le

This article is protected by copyright. All rights reserved
with oxygenated aCSF at a rate of ∼1.5 ml/min. Slices were visualized on an Olympus
BX51WI microscope (Olympus Corporation of America). MSNs in the DMS and DLS were
confirmed by their membrane resistance and capacitance. Borosilicate glass recording
pipettes of 2–4 MΩ were filled with specific internal solutions (see below, adjusted to 295–
310 mOsm) for whole-cell recordings. All recordings were filtered at 2.2 kHz and digitized at
10 kHz. Data were acquired using Clampex 10 software (Molecular Devices). Series
resistance was continuously monitored and only cells with a stable access resistance (less
than 25 MΩ and that did not change more than 15%) were included for data analysis.
Excitability
Cells were recorded in current clamp mode, allowing them to sit at their natural
resting membrane potential. Increasing current steps (-200pA to +400pA in 50 pA
increments) were injected for 500ms every 10 s. The following excitability parameters were
measured: resting membrane potential (RMP), input resistance, action potential (AP)
threshold potential, AP peak, AP half-width, and AP frequency. For the AP threshold
potential, AP peak, and AP half-width parameters, data from the first current step that
produced APs were used. A K-gluconate internal solution was used and contained (mM):
4 KCl, 10 HEPES, 4 MgATP, 0.3 NaGTP, 10 phosphocreatine, 126 K-gluconate.
Excitatory transmission
To isolate excitatory transmission, the aCSF contained 50 M picrotoxin. Recordings
were conducted in voltage clamp mode and cells were held at -60mV (unless otherwise
indicated). The internal solution for excitatory recordings contained (mM): 120 CsMeSO3,
5 NaCl, 10 TEA-Cl, 10 HEPES, 5 lidocaine bromide, 1.1 EGTA, 0.3 Na-GTP and 4 Mg-ATP.
After a stabilization period of at least 10 minutes, spontaneous excitatory postsynaptic
currents (sEPSCs) were measured over the course of 5-min gap-free recordings.
Parameters measured included: sEPSC amplitude, frequency, rise-time, and decay
constant.
Acc
epte
d A
rtic
le
This article is protected by copyright. All rights reserved
The ratio of glutamate-driven α-amino-3-hydroxy-5-methyl-4-isoxazolepropionic acid
(AMPA) receptor to N-methyl-D-aspartate (NMDA) receptor current was also assessed in
voltage-clamp mode. A Teflon-coated bipolar stimulating electrode (PlasticsONE, Roanoke,
VA, USA) was placed at the border of the corpus callosum and the DMS or DLS (Figures 1A
and 2A). Neurons were held at a -60mV holding potential and EPSCs were evoked via a
DS3 Isolated Current Stimulator (Digitimer, Ft. Lauderdale, FL, USA) and the intensity was
adjusted until a stable response between −200 and −400 pA was observed. The holding
potential was then changed to -80mV to isolate AMPA currents and 10 EPSCs were evoked
(20 s inter-stimulus interval). The AMPA receptor antagonist NBQX (Tocris Bioscience,
Bristol, UK) was then perfused onto the slice at a concentration of 5 M until AMPA
receptor-mediated currents were no longer evident. The holding potential was then adjusted
to +60mV to isolate NMDA receptor-driven currents and 10 more EPSCs were evoked (20s
inter-stimulus interval). The ratio of mean AMPA receptor current peak was then compared
to the mean NMDA receptor current peak.
Inhibitory Transmission
To isolate inhibitory transmission, the aCSF contained 5 M NBQX and 50 M AP-5
(NMDA receptor antagonist; Tocris Bioscience, Bristol, UK). Inhibitory recordings were
conducted in voltage clamp mode and cells were held at -60 mV. After a stabilization period
of at least 10 minutes, spontaneous inhibitory postsynaptic currents (sIPSCs) were
measured over the course of 3-min gap-free recordings. sIPSC recordings yielded many
more postsynaptic events and were therefore shorter than sEPSC recordings. Parameters
measured included: sIPSC amplitude, frequency, rise-time, and decay constant. The Cs-
based internal solution of inhibitory recordings contained (mM): 120 CsCl2, 10 HEPES,
10 EGTA, 4 MgCl2, 2 MgATP, 0.5 NaGTP, and 5 lidocaine.
Electrophysiology Data Processing and Statistical Analysis
Acc
epte
d A
rtic
le
This article is protected by copyright. All rights reserved
All excitability and AMPA/NMDA ratio data were processed via pClamp 10.6 software.
sEPSC and sIPSC data were processed via MiniAnalysis software (Synaptosoft Inc.).
Statistical analyses were conducted via Statistica 7 software (Statsoft, Tulsa, OK). Statistical
outliers were determined via Grubb’s test. Out of a total of 649 cells, 23 met criteria as
outliers (3.5% of total population) and were removed from their respective analysis. DMS
and DLS data were analyzed separately. Analyses of variance (ANOVAs) were used for all
analyses and included line (HAP/LAP), sex (M/F), and replicate (2/3) as factors. Analyses
were collapsed on sex where it was found to not be a significant factor. The significance
level for all analyses was set at p<0.05 and Tukey–Kramer post hoc statistics were run
where applicable. Any main effects or possible interactions that are not reported did not
reach statistical significance. It is important to bear in mind that main effects of replicate are
both expected and not particularly relevant to our genetic hypothesis. Due to the logistical
limitation of mouse colony size, genetic drift occurs over many generations in selected lines
and some alleles not relevant to the selection phenotype (alcohol preference in this case)
become fixed. As a result, replicates (e.g. replicate 2 vs. replicate 3) may be observed to
differ in a variety of experimental measures. So long as there is no interaction with line, this
effect has no relationship to the selection phenotype. As such, the details of all main effects
of replicate can be found in Table S1 and are not noted in the figures. Finally, as our main
hypotheses were driven by the behavioral genetics of HAP and LAP mice, figures are
presented collapsed on sex to highlight where line differences occurred. Sex effects and
interactions are also detailed in Table S1.
RESULTS
Excitability
Within the DLS (Figure 1A), analysis determined no effect of line on MSN RMP
(p>0.05; Figure 1B). Replicate (F1,66=41.95, p<0.001; Table S1) and sex (F1,66=5.07, p<0.05;
Table S1) were significant factors with female and replicate 3 cells exhibiting more
depolarized RMPs. A significant line × replicate × sex interaction (F1,66=5.1, p<0.05; Table
S1) also indicated that within HAP3 mice, female DLS cells sat at a more depolarized RMP
Acc
epte
d A
rtic
le

This article is protected by copyright. All rights reserved
relative to male cells. HAP MSNs exhibited significantly greater input resistance compared to
LAP cells (F1,66=3.978, p=0.05; Figure 1C), indicating that current was translated into larger
changes in voltage across the membrane. Increasingly positive current steps also revealed
that HAP MSNs fired APs at a significantly lower AP threshold potential compared to LAP
MSNs (F1,66=8.682, p<0.01; Figure 1D). Cells from replicate 2 animals also exhibited a lower
AP threshold potential than those from replicate 3 (F1,66=8.684, p<0.01; Table S1). No line
differences were found for AP half-width or peak amplitude (p’s>0.05, Figures 1E-F),
although APs from replicate 3 cells had a slightly larger peak amplitude (F1,66=5.23, p<0.05;
Table S1). Throughout the positive current steps (+50-400 pA), significantly more frequent
APs were generated in HAP MSNs relative to LAP MSNs (F1,66=16.773, p<0.001; Figure
1G,H).
Within the DMS (recording location depicted in Figure 2A), no clear line differences in
excitability were observed. RMP was similar in both lines (p>0.05; Figure 2B), although a
main effect of replicate indicated that cells from replicate 3 animals sat at a more
depolarized RMP (F1,63=24.72, p<0.001; Table S1). Line and sex were not significant factors
for input resistance (p’s>0.05; Figure 2C), however a significant line × sex × replicate
interaction revealed that within LAP2 cells, those from female mice exhibited greater input
resistance relative to male cells (F1,63=7.626, p<0.01; Table S1). No line or sex differences
were found in AP threshold (p’s>0.05; Figure 2D), however replicate 2 cells exhibited a
significantly lower AP threshold than those from replicate 3 (F1,63=5.446, p<0.05; Table S1).
No main effects of line or sex were found for AP half-width or peak amplitude (p’s>0.05;
Figures 2E-F), although replicate 3 cells demonstrated a wider AP half-width than replicate 2
cells (F1,63=8.665, p<0.01; Table S1). In addition, a complex line × sex × replicate interaction
revealed that within replicate 3 male cells, the AP half-width in LAP cells was significantly
wider than in HAP cells (F1,63=6.981, p<0.05; Table S1). Analysis of AP frequency yielded no
main effects of line, sex, or replicate (p’s>0.05; Figures 2G-H). A significant line × sex ×
replicate interaction, however, found that within HAP3 cells, those from female mice fired
significantly more frequent APs in response to current injection compared to those from male
mice (F1,63=8.362, p<0.01; Table S1).
Acc
epte
d A
rtic
le

This article is protected by copyright. All rights reserved
Excitatory transmission
Spontaneous glutamate-driven currents were measured to evaluate excitatory input to
MSNs. Within DLS, a line × replicate interaction for sEPSC frequency identified significantly
higher frequencies in HAP2 MSNs compared to LAP2 MSNs (F1,75=6.572, p<0.05; Figure
3A). Neither line nor sex were significant factors for sEPSC amplitude, rise time, or decay
(p‘s>0.05; Figures 3B,C,D), although replicate 2 cells were found to have a significantly
slower rise time compared to those from replicate 3 (F1,75=4.22, p<0.05; Table S1).
sEPSC frequency within DMS was significantly greater in HAP cells compared to LAP
cells (F1,69=12.306, p<0.001; Figure 3F). A significant line × replicate interaction indicated
that this difference was particularly large between HAP2 and LAP2 MSNs (F1,69=7.048;
p<0.01; Table S1). A line difference was also found for sEPSC amplitude with significantly
lower amplitudes in HAP compared to LAP cells (F1,69=7.242, p<0.01; Figure 3G). Analysis
of rise time yielded a significant line × replicate interaction with HAP3 cells having a
significantly shorter rise time than LAP3 cells (F1,69=5.938, p<0.05; Figure 3H). No main
effects or interactions reached statistical significance for decay (p>0.05; Figure 3I).
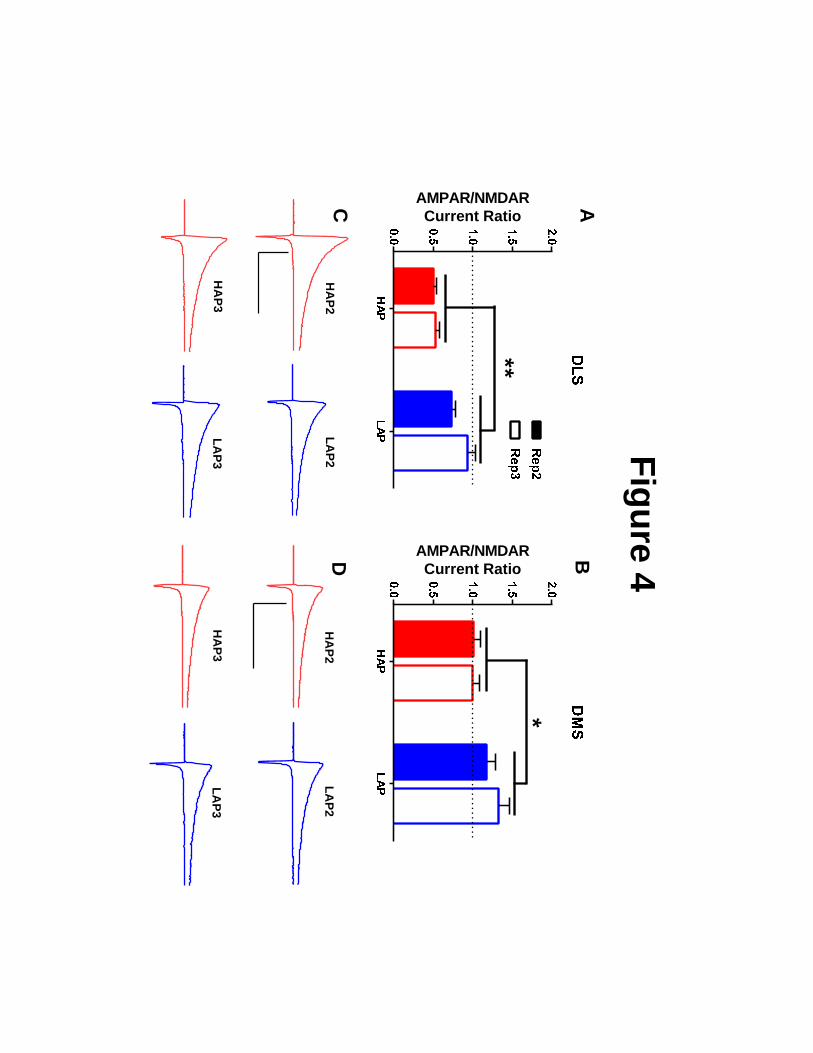
AMPA/NMDA ratios measured in the DLS (F1,64=11.719, p<0.001; Figure 4A,C) and
DMS (F1,65=4.748; p<0.05; Figure 4B,D) of HAP mice were significantly lower than those
observed in LAP mice. In addition, a significant line × sex interaction for DMS data indicated
that this difference was particularly strong in male animals (F1,65=5.027, p<0.05; Table S1).
Inhibitory Transmission
Within the DLS, HAP MSNs received more frequent inhibitory input compared to LAP
MSNs (F1,78=5.125, p<0.05; Figure 5A). sIPSC frequency was also significantly greater in
replicate 2 cells relative to replicate 3 (F1,78=13.897; p<0.001; Table S1). The amplitude of
sIPSCs in HAP cells was significantly larger than that seen in LAP MSNs (F1,78=5.413,
p<0.05; Figure 5B). Analyses of sIPSC rise time and decay yielded no main effect of line
(p’s>0.05; Figure 5C,D). Significant replicate × sex interactions for rise time and decay
indicated significantly slower rise times for cells from replicate 2 male mice compared to
Acc
epte
d A
rtic
le

This article is protected by copyright. All rights reserved
those from replicate 2 females (F1,78=10.253, p<0.01; Table S1) and significantly shorter
decay times for replicate 2 female cells compared to replicate 3 female cells (F1,78=4.529,
p<0.05; Table S1).
Within the DMS, a trend towards greater sIPSC frequency within HAP versus LAP
was observed (F1,84=3.555, p=0.06; Figure 5F). Analyses of postsynaptic measure of
amplitude, rise time, and decay (Figure 5G,H,I), however, yielded no significant main effects
or interactions (p’s>0.05).
DISCUSSION
The above experiments demonstrated that genetic predisposition for high or low
alcohol consumption produced subregion-specific differences in dorsal striatal
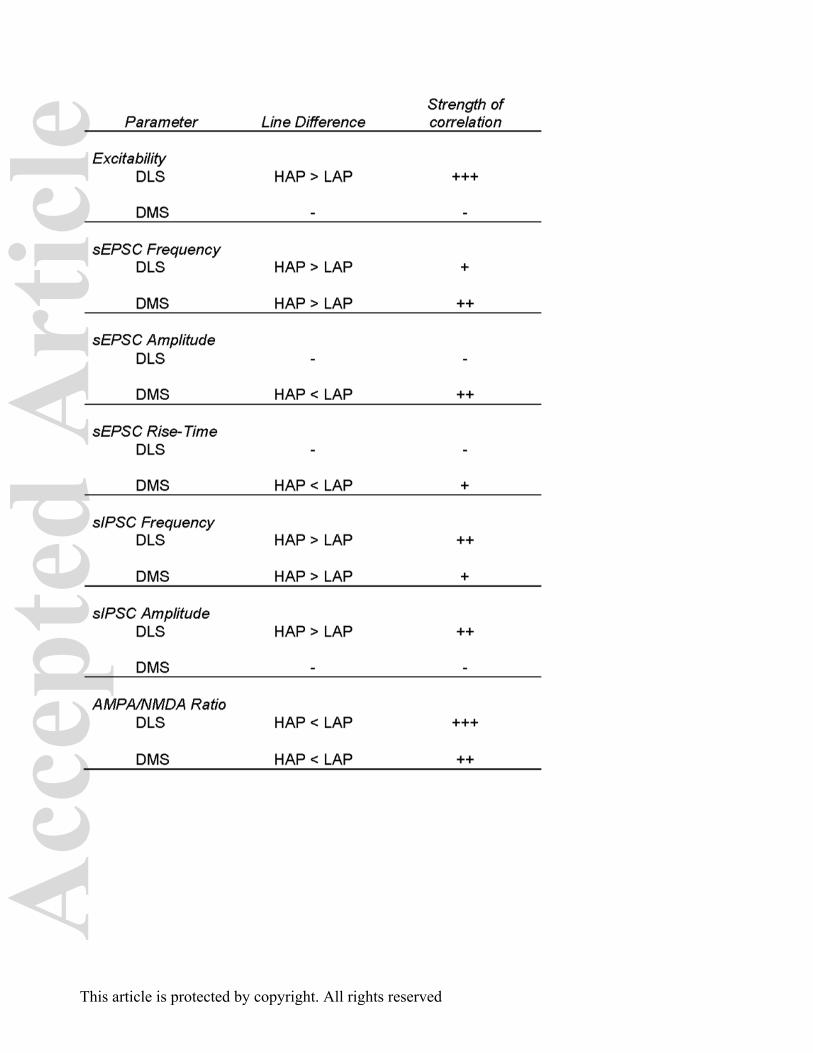
neurotransmission (summary of electrophysiology results in Table 1). Specifically within the
DLS, HAP MSNs were more excitable than LAP MSNs. Glutamate release was also
elevated in HAP DLS and DMS, however this was accompanied by a complementary
increase in GABA transmission. Additionally, lower observed AMPA/NMDA ratios in both
subregions of HAP mice, another facet of glutamate transmission, suggests line differences
in post-synaptic glutamate receptor characteristics. Collectively, these data indicate that the
basal functional state of HAP DLS and DMS are substantially and significantly different from
LAP DLS and DMS.
Assessment of the intrinsic physiological properties of neurons provides information
about their excitability, or the likelihood of AP firing. These intrinsic properties are influenced
by a variety of factors including conductance through various ion channels and/or the activity
of ion pumps (Llinás, 1988). Genetic line effects on these intrinsic parameters may reflect
differences in the quantity, subtype, localization, or post-translational functional modifications
of ion channels or other proteins (Curran and Mohler, 2015). Protracted alcohol exposure
increases neuronal excitability in numerous brain regions, including the striatum (Marty and
Spigelman, 2012). Within the DLS, primary genetic line differences were found for input
resistance, and AP threshold potential (Figure 1). These cells also fired more frequent APs
in response to current injection. Strikingly, no line differences were observed within the
Acc
epte
d A
rtic
le

This article is protected by copyright. All rights reserved
DMS, thus indicating a subregion-specific effect of genetic background. Some possible
mechanisms for this functional difference are that HAP MSNs may have lower conductance
though particular K+ channels and/or increased conductance through voltage-gated Na+
channels at lower membrane potentials (Johnston et al., 2010; Kruger and Isom, 2016).
Ultimately, this experiment determined that HAP MSNs within the DLS fired more APs in
response to escalating current injection. This increased intrinsic excitability likely translates
to larger DLS output compared to the output of LAP DLS, although this will require deeper
exploration in the future. Prior studies have shown that the DLS governs habitual alcohol
seeking (Corbit et al., 2012; 2014) Therefore, increased excitability may be a predisposing
phenotype influencing excessive alcohol consumption in HAP mice.
As the primary excitatory neurotransmitter in the central nervous system, alterations
in glutamate transmission can have wide-reaching effects on the activity of neurons and
neural circuits. Elevated glutamate transmission is also a hallmark of AUD in humans
(Quednow and Herdener, 2016). Prior work in non-human primates demonstrated that
chronic alcohol exposure (up to 30 months) increased glutamate transmission within the
putamen, a region analogous to the rodent DLS (Cuzon Carlson et al., 2011). Lesser alcohol
intake (6 weeks) in a mouse model of binge-like drinking, however, observed no change in
glutamate transmission in either the DMS or DLS of inbred C57BL/6J mice (Wilcox et al.,
2014). Data from other alcohol-preferring selectively-bred rodent lines suggests that
glutamate transmission is an important factor in their high-drinking phenotype. Although not
directly assessed within the dorsal striatum subregions, 8 weeks of alcohol consumption
increased extracellular glutamate levels in mesolimbic regions of alcohol-preferring P rats by
as much as 100% (Ding et al., 2013). Additionally, pharmacological manipulation of various
metabotropic glutamate receptors significantly influences alcohol seeking and relapse
behavior in P rats (Besheer et al., 2010; Czachowski et al., 2012; Rodd et al., 2006). The
current study demonstrated an increase in sEPSC frequency in HAP compared to LAP cells
in both DLS and DMS (Figure 3). sEPSC event frequency is an index of neurotransmitter
release from presynaptic terminals. Therefore, excitatory upstream cortical, thalamic, or
amygdalar projections to dorsal striatum in HAP mice may be more excitable or have more
Acc
epte
d A
rtic
le
This article is protected by copyright. All rights reserved
efficient vesicle release mechanisms than LAP mice. It is possible that more frequent
spontaneous glutamate release could explain the greater excitability observed in HAP DLS
MSNs, however the coinciding greater frequency of GABA-mediated sIPSCs in DLS (Figure
5) suggests that excitation/inhibition balance mechanisms may be in effect (discussed
further below). Additionally, the postsynaptic parameters of sEPSC amplitude and rise time
were both found to be decreased in HAP DMS (Figure 3). Reduced amplitude may indicate
reduced AMPA receptor surface expression. However, faster ion channel kinetics, as
determined by a shorter sEPSC rise time, may reflect functional compensation. Our data are
consistent with the above previous observations of elevated glutamate transmission in
animal models of chronic alcohol consumption. It is important to bear in mind, however, that
the mice used in the current study were alcohol-naïve. As such, our experiments probed the
effect of genetic background, not direct alcohol exposure. Nevertheless, a family history of
high alcohol intake produced significantly higher basal glutamate transmission in both the
DLS and DMS relative to a history of alcohol avoidance.
An assessment of the ratio of postsynaptic AMPA to NMDA receptor-driven current
can reveal other important functional differences in excitatory transmission. An increase in
the AMPA/NMDA current ratio can be produced by repeated drug exposure in certain brain
regions (Thomas et al., 2008) and is often interpreted as increased excitatory transmission,
likely reflecting higher numbers of functional, membrane-bound AMPA receptors. However,
an increase in NMDA receptor function would decrease this ratio, even though it too, reflects
an increase in excitatory transmission. Indeed, repeated alcohol exposure is known to
upregulate particular NMDA receptor subunits in brain (Chen et al., 2018; Nagy, 2004). This
adaptation may be tied to the hyperexcitability observed in the CNS during alcohol
withdrawal, an effect which may drive relapse behavior (Krystal et al., 2003). Repeated
alcohol exposure increases NMDA receptor function in the DMS of rats (Wang et al., 2010).
A variety of NMDA receptor antagonists also reduced alcohol consumption of selectively-
bred alcohol preferring rats (Malpass et al., 2010; McMillen et al., 2004). Interestingly, the
current study found substantially lower AMPA/NMDA ratios in both the DLS and DMS of
HAP mice compared to LAP mice (Figure 4). Considering no line difference was observed
Acc
epte
d A
rtic
le

This article is protected by copyright. All rights reserved
for sEPSC amplitude in the DLS, the lower ratio in this region might reflect of an increase in
NMDA receptor function rather than a decrease in AMPA receptor function or number.
Within the DMS, however, a slightly reduced sEPSC amplitude in HAP mice suggests lower
numbers of AMPA receptors could explain the smaller ratio in this region. Future work will
more deeply probe the molecular dynamics that underlie the differing AMPA to NMDA
current ratios between these selected lines.
Repeated alcohol exposure has also been shown to alter dorsal striatal GABA
transmission. Rodents and non-human primates exhibit a reduction in miniature IPSC
frequency and amplitude following long periods of repeated alcohol consumption, thus
indicating both pre- and postsynaptic changes (Wilcox et al., 2014; Cuzon Carlson et al.,
2011; 2018). Chronic alcohol exposure significantly reduces GABAA receptor numbers and
alters subunit expression (Kumar et al., 2009), an effect that is also seen specifically in
selectively-bred alcohol-preferring rats (McClintick et al., 2015). This reduction in GABA
transmission could translate to a disinhibition of MSNs, thus increasing the likelihood of MSN
output. However, in the current study, HAP mice were observed to have more frequent
presynaptic GABA input relative to LAP mice in both DLS and DMS (Figure 4). Additionally,
the postsynaptic parameter of amplitude was larger in HAP DLS. As previously mentioned,
this was also met with significantly more frequent glutamate transmission in HAP dorsal
striatum. This could be reflective of excitation/inhibition balance, wherein
increases/decreases in excitatory transmission are met with compensatory inhibition to
achieve a state of balance. In disease states such as addiction, this balance can be
disrupted and particular neurocircuits can be pathologically over- or underactive (Yizhar et
al., 2011). Within striatal circuitry, it is important to distinguish between the ‘direct’ and
‘indirect’ pathways that either promote or inhibit behavioral action patterns, respectively.
Indeed, previous work has demonstrated that excessive alcohol intake in mice resulted in
increased glutamatergic input onto direct pathways MSNs as well as increased GABA input
onto indirect pathway MSNs (Cheng et al., 2017), thus resulting in much higher ratio of direct
pathway output compared to indirect pathway output. This pathway imbalance may reflect
an overall reduced ability to inhibit highly active alcohol-seeking behavior. In the absence of
Acc
epte
d A
rtic
le
This article is protected by copyright. All rights reserved
alcohol exposure in the current study, no clear evidence of excitation/inhibition imbalance
was observed in either line. However, given the previous findings mentioned above,
distinguishing GABA and glutamate transmission onto pathway-specific MSNs will be an
important future step towards clarifying how net MSN input/output is affected by genetic
selection for alcohol preference. It will also be important to evaluate how alcohol
consumption in HAP mice influences these parameters in the future.
In conclusion, the current study demonstrated that family histories of high or low
alcohol consumption can significantly affect basal neurotransmission within the dorsal
striatum. These different functional states may interact with alcohol exposure in a way that
promotes/inhibits further alcohol consumption. It is important to note that the origin of the
selected lines was from a bidirectional selection and thus genetic and physiological
differences could alternatively underlie a predisposition for alcohol avoidance in LAP mice
rather than an increased predisposition for alcohol preference in HAP mice. Unfortunately,
the genetically heterogeneous HS/Ibg stock, the one from which HAP and LAP mice were
originally selected, that would serve as a wildtype control line no longer exists. Nevertheless,
there are clear functional differences produced by this genetic divergence that indicate that
dorsal striatal neurotransmission is indeed related to relative AUD risk. The strongest
evidence for genetic correlation (Table 1) points to increased excitability of DLS MSNs in
individuals with a positive family history of excessive alcohol intake relative to those with a
family history of low alcohol intake. This provides an attractive hypothesis that elevated
excitability/activity of DLS MSNs may be a predisposing phenotype for future problematic
alcohol seeking and/or consumption. Future work will evaluate how these basal
electrophysiological measures in the HAP and LAP selected lines are altered by alcohol
exposure. In addition, examination of line differences in dorsal striatal synaptic plasticity may
offer valuable insight concerning their capacity for behavioral flexibility (Gremel and Costa,
2013), a phenomenon which is associated with addictive potential. Furthermore, in the future
it will be important to define the molecular mechanisms underlying these neurophysiological
differences we measured here. Once these are determined, we may begin to elucidate the
complex relationship between differential gene expression, neuronal function, and the
Acc
epte
d A
rtic
le

This article is protected by copyright. All rights reserved
endophenotypes of these selected mouse lines that may offer novel insights into the
development of alcohol abuse in those with a genetic predisposition for AUDs.
AUTHOR CONTRIBUTIONS
BMF and BKA were responsible for study concept and design. BMF and BM collected
electrophysiology data. BMF conducted statistical analysis for electrophysiology data. BMF
drafted the manuscript. BM and BKA provided critical revision of the manuscript for
intellectual content. All authors critically reviewed content and approved the final version of
the manuscript for publication. The authors have no conflicts of interest to declare.
ACKNOWLEDGMENTS
We wish to thank Dr. Nick Grahame for supplying HAP and LAP mice. This work was
supported by NIAAA grants T32 AA07462 (BMF), F32 AA026488 (BMF), R00 AA023507
(BKA), R01 AA027214 (BKA), and P60 AA007611 (Indiana Alcohol Research Center).
Acc
epte
d A
rtic
le

This article is protected by copyright. All rights reserved
REFERENCES
Adermark, L., Jonsson, S., Ericson, M., and Söderpalm, B. (2011) Intermittent ethanol
consumption depresses endocannabinoid-signaling in the dorsolateral striatum of rat.
Neuropharmacology 61:1160-1165.
Balleine, B.W., and O'Doherty, J.P. (2010) Human and rodent homologies in action control:
corticostriatal determinants of goal-directed and habitual action.
Neuropsychopharmacology 35:48-69.
Besheer, J., Grondin, J.J.M., Cannady, R., Sharko, A.C., Faccidomo, S., and Hodge, C.W.
(2010) Metabotropic glutamate receptor 5 activity in the nucleus accumbens is
required for the maintenance of ethanol self-administration in a rat genetic model of
high alcohol intake. Biological Psychiatry 67:812-822.
Bjork, J.M., Knutson, B., and Hommer, D.W. (2008) Incentive-elicited striatal activation in
adolescent children of alcoholics. Addiction (Abingdon, England) 103:1308-1319.
Chen, J., Ma, Y., Fan, R., Yang, Z., and Li, M.D. (2018) Implication of genes for the N-
methyl-d-aspartate (NMDA) receptor in substance addictions. Molecular neurobiology
55:7567-7578.
Cheng, Y., Huang, C.C.Y., Ma, T., Wei, X., Wang, X., Lu, J., and Wang, J. (2017) Distinct
synaptic strengthening of the striatal direct and indirect pathways drives alcohol
consumption. Biol Psychiatry 81:918-929.
Corbit, L.H., Nie, H., and Janak, P.H. (2012) Habitual alcohol seeking: time course and the
contribution of subregions of the dorsal striatum. Biological psychiatry 72:389-395.
Corbit, L.H., Nie, H., and Janak, P.H. (2014) Habitual responding for alcohol depends upon
both AMPA and D2 receptor signaling in the dorsolateral striatum. Frontiers in
behavioral neuroscience 8:301-301.
Crabbe, J.C., Phillips, T.J., Kosobud, A., and Belknap, J.K. (1990) Estimation of genetic
correlation: interpretation of experiments using selectively bred and inbred animals.
Alcoholism, clinical and experimental research 14:141-151.
Acc
epte
d A
rtic
le
This article is protected by copyright. All rights reserved
Curran, J., and Mohler, P. (2015) Alternative paradigms for ion channelopathies: Disorders
of ion channel membrane trafficking and posttranslational modification. Annual
Review of Physiology 77:505-524.
Cuzon Carlson, V.C., Grant, K.A., and Lovinger, D.M. (2018) Synaptic adaptations to chronic
ethanol intake in male rhesus monkey dorsal striatum depend on age of drinking
onset. Neuropharmacology 131:128-142.
Cuzon Carlson, V.C., Seabold, G.K., Helms, C.M., Garg, N., Odagiri, M., Rau, A.R.,
Daunais, J., Alvarez, V.A., Lovinger, D.M., and Grant, K.A. (2011) Synaptic and
morphological neuroadaptations in the putamen associated with long-term, relapsing
alcohol drinking in primates. Neuropsychopharmacology 36:2513.
Czachowski, C.L., DeLory, M.J., and Pope, J.D. (2012) Behavioral and neurotransmitter
specific roles for the ventral tegmental area in reinforcer-seeking and intake.
Alcoholism: Clinical and Experimental Research 36:1659-1668.
Ding, Z.-M., Rodd, Z.A., Engleman, E.A., Bailey, J.A., Lahiri, D.K., and McBride, W.J. (2013)
Alcohol drinking and deprivation alter basal extracellular glutamate concentrations
and clearance in the mesolimbic system of alcohol-preferring (P) rats. Addiction
Biology 18:297-306.
Everitt, B.J., and Robbins, T.W. (2016) Drug addiction: Updating actions to habits to
compulsions ten years on. Annu Rev Psychol 67:23-50.
Fritz, B.M., and Boehm, S.L., 2nd (2014) The effect of prior alcohol consumption on the
ataxic response to alcohol in high-alcohol preferring mice. Alcohol 48:765-772.
Fritz, B.M., Grahame, N.J., and Boehm, S.L., 2nd (2013) Selection for high alcohol
preference drinking in mice results in heightened sensitivity and rapid development of
acute functional tolerance to alcohol's ataxic effects. Genes, brain, and behavior
12:78-86.
Gremel, C.M., and Costa, R.M. (2013) Orbitofrontal and striatal circuits dynamically encode
the shift between goal-directed and habitual actions. Nature communications 4:2264.
Acc
epte
d A
rtic
le

This article is protected by copyright. All rights reserved
Heitzeg, M.M., Nigg, J.T., Yau, W.Y., Zucker, R.A., and Zubieta, J.K. (2010) Striatal
dysfunction marks preexisting risk and medial prefrontal dysfunction is related to
problem drinking in children of alcoholics. Biol Psychiatry 68:287-295.
Hunnicutt, B.J., Jongbloets, B.C., Birdsong, W.T., Gertz, K.J., Zhong, H., and Mao, T. (2016)
A comprehensive excitatory input map of the striatum reveals novel functional
organization. Elife 5:e19103.
Johnston, J., Forsythe, I.D., and Kopp‐Scheinpflug, C. (2010) SYMPOSIUM REVIEW: Going
native: voltage‐gated potassium channels controlling neuronal excitability. The
Journal of physiology 588:3187-3200.
Kendler, K.S., Ohlsson, H., Bacanu, S., Sundquist, J., and Sundquist, K. (2018) The risk for
drug abuse, alcohol use disorder, and psychosocial dysfunction in offspring from
high-density pedigrees: its moderation by personal, family, and community factors.
Molecular psychiatry.
Kruger, L.C., and Isom, L.L. (2016) Voltage-gated Na+ channels: Not just for conduction.
Cold Spring Harbor perspectives in biology 8:a029264.
Krystal, J.H., Petrakis, I.L., Mason, G., Trevisan, L., and D'Souza, D.C. (2003) N-methyl-D-
aspartate glutamate receptors and alcoholism: reward, dependence, treatment, and
vulnerability. Pharmacology & therapeutics 99:79-94.
Kumar, S., Porcu, P., Werner, D.F., Matthews, D.B., Diaz-Granados, J.L., Helfand, R.S., and
Morrow, A.L. (2009) The role of GABA A receptors in the acute and chronic effects of
ethanol: a decade of progress. Psychopharmacology 205:529-564.
Linsenbardt, D.N., and Boehm, S.L., 2nd (2015) Relative fluid novelty differentially alters the
time course of limited-access ethanol and water intake in selectively bred high-
alcohol-preferring mice. Alcoholism, clinical and experimental research 39:621-630.
Llinás, R.R. (1988) The intrinsic electrophysiological properties of mammalian neurons:
insights into central nervous system function. Science 242:1654-1664.
Malpass, G.E., Williams, H.L., and McMillen, B.A. (2010) Effects of the non‐competitive
NMDA receptor antagonist memantine on the volitional consumption of ethanol by
alcohol‐preferring rats. Basic & clinical pharmacology & toxicology 106:435-444.
Acc
epte
d A
rtic
le
This article is protected by copyright. All rights reserved
Marty, V.N., and Spigelman, I. (2012) Effects of alcohol on the membrane excitability and
synaptic transmission of medium spiny neurons in the nucleus accumbens. Alcohol
46:317-327.
Matson, L.M., and Grahame, N.J. (2013) Pharmacologically relevant intake during chronic,
free-choice drinking rhythms in selectively bred high alcohol-preferring mice. Addict
Biol 18:921-929.
McClintick, J.N., McBride, W.J., Bell, R.L., Ding, Z.-M., Liu, Y., Xuei, X., and Edenberg, H.J.
(2015) Gene expression changes in serotonin, GABA-A receptors, neuropeptides and
ion channels in the dorsal raphe nucleus of adolescent alcohol-preferring (P) rats
following binge-like alcohol drinking. Pharmacology Biochemistry and Behavior
129:87-96.
McMillen, B.A., Joyner, P.W., Parmar, C.A., Tyer, W.E., and Williams, H.L. (2004) Effects of
NMDA glutamate receptor antagonist drugs on the volitional consumption of ethanol
by a genetic drinking rat. Brain research bulletin 64:279-284.
Munoz, B., Fritz, B.M., Yin, F., and Atwood, B.K. (2018) Alcohol exposure disrupts mu opioid
receptor-mediated long-term depression at insular cortex inputs to dorsolateral
striatum. Nat Commun 9:1318.
Nagy, J. (2004) The NR2B subtype of NMDA receptor: a potential target for the treatment of
alcohol dependence. Current Drug Targets-CNS & Neurological Disorders 3:169-179.
Nam, H.W., Hinton, D.J., Kang, N.Y., Kim, T., Lee, M.R., Oliveros, A., Adams, C., Ruby,
C.L., and Choi, D.S. (2013) Adenosine transporter ENT1 regulates the acquisition of
goal-directed behavior and ethanol drinking through A2A receptor in the dorsomedial
striatum. The Journal of neuroscience : the official journal of the Society for
Neuroscience 33:4329-4338.
Oberlin, B., Best, C., Matson, L., Henderson, A., and Grahame, N. (2011) Derivation and
characterization of replicate high- and low-alcohol preferring lines of mice and a high-
drinking crossed HAP line. Behavior genetics 41:288-302.
Acc
epte
d A
rtic
le

This article is protected by copyright. All rights reserved
Oberlin, B.G., and Grahame, N.J. (2009) High-alcohol preferring mice are more impulsive
than low-alcohol preferring mice as measured in the delay discounting task.
Alcoholism, clinical and experimental research 33:1294-1303.
Quednow, B.B., and Herdener, M. (2016) Human pharmacology for addiction medicine:
From evidence to clinical recommendations. In: Progress in Brain Research. H.
Ekhtiari, and M. Paulus (eds). Elsevier, pp. 227-250.
Rodd, Z.A., McKinzie, D.L., Bell, R.L., McQueen, V.K., Murphy, J.M., Schoepp, D.D., and
McBride, W.J. (2006) The metabotropic glutamate 2/3 receptor agonist LY404039
reduces alcohol-seeking but not alcohol self-administration in alcohol-preferring (P)
rats. Behavioural Brain Research 171:207-215.
Sah, P., Hestrin, S., and Nicoll, R. (1989) Tonic activation of NMDA receptors by ambient
glutamate enhances excitability of neurons. Science 246:815-818.
Sjoerds, Z., de Wit, S., van den Brink, W., Robbins, T.W., Beekman, A.T., Penninx, B.W.,
and Veltman, D.J. (2013) Behavioral and neuroimaging evidence for overreliance on
habit learning in alcohol-dependent patients. Translational psychiatry 3:e337.
Soriano, F.X., Papadia, S., Hofmann, F., Hardingham, N.R., Bading, H., and Hardingham,
G.E. (2006) Preconditioning doses of NMDA promote neuroprotection by enhancing
neuronal excitability. Journal of Neuroscience 26:4509-4518.
Tepper, J.M., and Bolam, J.P. (2004) Functional diversity and specificity of neostriatal
interneurons. Current opinion in neurobiology 14:685-692.
Thomas, M.J., Kalivas, P., and Shaham, Y. (2008) Neuroplasticity in the mesolimbic
dopamine system and cocaine addiction. British journal of pharmacology 154:327-
342.
Tricomi, E., Balleine, B.W., and O'Doherty, J.P. (2009) A specific role for posterior
dorsolateral striatum in human habit learning. The European journal of neuroscience
29:2225-2232.
Vollstadt-Klein, S., Wichert, S., Rabinstein, J., Buhler, M., Klein, O., Ende, G., Hermann, D.,
and Mann, K. (2010) Initial, habitual and compulsive alcohol use is characterized by a
Acc
epte
d A
rtic
le

This article is protected by copyright. All rights reserved
shift of cue processing from ventral to dorsal striatum. Addiction (Abingdon, England)
105:1741-1749.
Wang, J., Lanfranco, M.F., Gibb, S.L., Yowell, Q.V., Carnicella, S., and Ron, D. (2010) Long-
lasting adaptations of the NR2B-containing NMDA receptors in the dorsomedial
striatum play a crucial role in alcohol consumption and relapse. The Journal of
Neuroscience 30:10187-10198.
Wilcox, M.V., Carlson, V.C.C., Sherazee, N., Sprow, G.M., Bock, R., Thiele, T.E., Lovinger,
D.M., and Alvarez, V.A. (2014) Repeated binge-like ethanol drinking alters ethanol
drinking patterns and depresses striatal GABAergic transmission.
Neuropsychopharmacology 39:579-594.
Yin, H.H., Knowlton, B.J., and Balleine, B.W. (2004) Lesions of dorsolateral striatum
preserve outcome expectancy but disrupt habit formation in instrumental learning.
The European journal of neuroscience 19:181-189.
Yizhar, O., Fenno, L.E., Prigge, M., Schneider, F., Davidson, T.J., O’shea, D.J., Sohal, V.S.,
Goshen, I., Finkelstein, J., and Paz, J.T. (2011) Neocortical excitation/inhibition
balance in information processing and social dysfunction. Nature 477:171.
Yoon, G., Westermeyer, J., Kuskowski, M.A., and Nesheim, L. (2013) Impact of the number
of parents with alcohol use disorder on alcohol use disorder in offspring: a population-
based study. The Journal of clinical psychiatry 74:795-801.
Acc
epte
d A
rtic
le

This article is protected by copyright. All rights reserved
Figure 1. Dorsolateral striatal medium spiny neurons in HAP mice are hyperexcitable
relative to LAP mice. A) Schematic of recording location for DLS MSNs. Measures of: B)
resting membrane potential, C) input resistance, D) action potential threshold, E) action
potential half-width, F) action potential peak amplitude, and G,H) frequency of action
potentials with I) representative action potential traces from HAP (red) and LAP (blue)
neurons stimulated with -100-200 pA of currents steps, separated by replicate. Scale bars=
200 ms, 50 mV. Data represent mean ± SEM. *p<0.05, **p<0.01 for main effect of line.
Statistical analyses of sex, replicate, and interactions may be found in the main body of the
text. n=7-14 cells per line/replicate/sex combination from 3-4 animals per each combination.
Figure 2. Dorsomedial striatal medium spiny neuron excitability does not differ
between HAP and LAP mice. A) Schematic of recording location for DMS MSNs. B)
Resting membrane potential, C) input resistance, D) action potential threshold, E) action
potential half-width, F) action potential peak amplitude, and G-H) frequency of action
potentials. I) Representative action potential traces from HAP (red) and LAP (blue) neurons
stimulated with -100-200 pA of currents steps. Scale bars=200 ms, 50 mV. Data represent
mean ± SEM. Statistical analyses of sex, replicate, and interactions may be found in the
main body of the text. n=7-13 cells per line/replicate/sex combination from 3-4 animals per
each combination.
Figure 3. Dorsal striatal basal glutamate transmission differs between HAP and LAP
mice. Measures of spontaneous excitatory postsynaptic current (sEPSC): A,F) frequency,
B,G) amplitude, C,H) rise time, and D,I) decay constant. E,J) Representative sEPSC traces
from HAP (red) and LAP (blue) MSNs. Scale bars=500 ms, 10 pA. Bar graphs represent
mean ± SEM. **p<0.01 for main effect of line; $p<0.05 and $$p<0.01 for line × replicate
interaction. Statistical analyses of sex, replicate, and other interactions may be found in the
main body of the text. n=10-14 cells per line/replicate/sex combination from 3-5 animals per
each combination.
Acc
epte
d A
rtic
le
This article is protected by copyright. All rights reserved
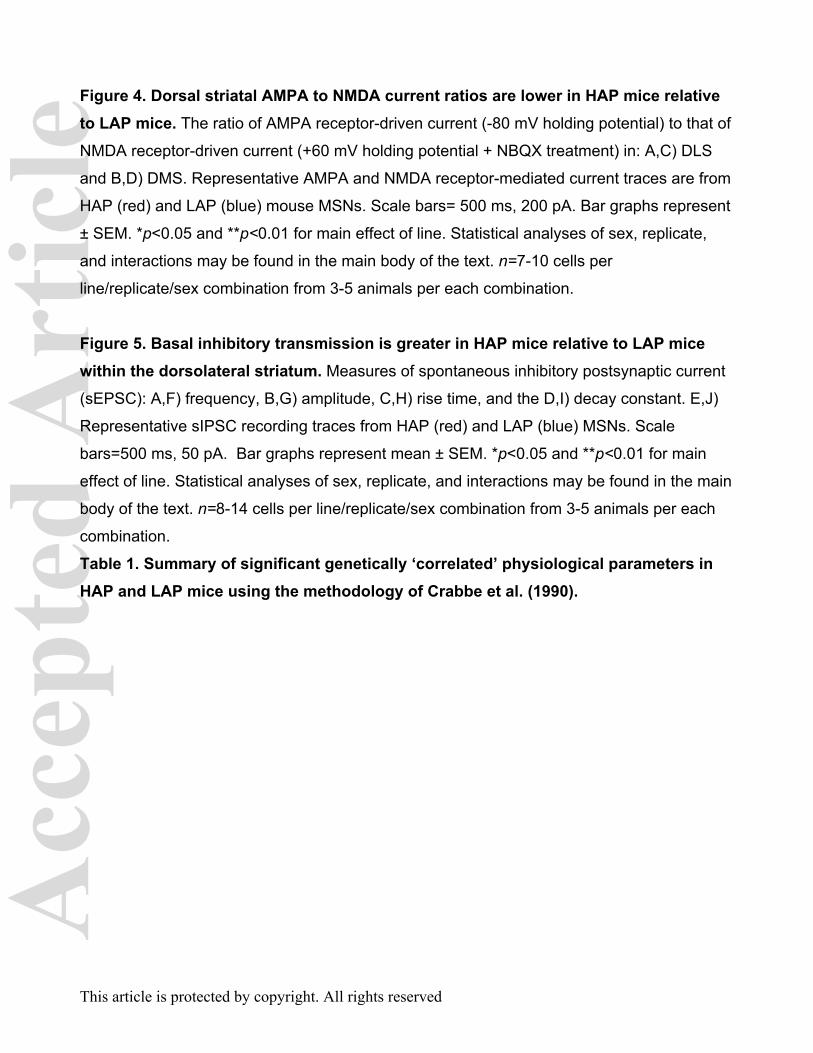
Figure 4. Dorsal striatal AMPA to NMDA current ratios are lower in HAP mice relative
to LAP mice. The ratio of AMPA receptor-driven current (-80 mV holding potential) to that of
NMDA receptor-driven current (+60 mV holding potential + NBQX treatment) in: A,C) DLS
and B,D) DMS. Representative AMPA and NMDA receptor-mediated current traces are from
HAP (red) and LAP (blue) mouse MSNs. Scale bars= 500 ms, 200 pA. Bar graphs represent
± SEM. *p<0.05 and **p<0.01 for main effect of line. Statistical analyses of sex, replicate,
and interactions may be found in the main body of the text. n=7-10 cells per
line/replicate/sex combination from 3-5 animals per each combination.
Figure 5. Basal inhibitory transmission is greater in HAP mice relative to LAP mice
within the dorsolateral striatum. Measures of spontaneous inhibitory postsynaptic current
(sEPSC): A,F) frequency, B,G) amplitude, C,H) rise time, and the D,I) decay constant. E,J)
Representative sIPSC recording traces from HAP (red) and LAP (blue) MSNs. Scale
bars=500 ms, 50 pA. Bar graphs represent mean ± SEM. *p<0.05 and **p<0.01 for main
effect of line. Statistical analyses of sex, replicate, and interactions may be found in the main
body of the text. n=8-14 cells per line/replicate/sex combination from 3-5 animals per each
combination.
Table 1. Summary of significant genetically ‘correlated’ physiological parameters in
HAP and LAP mice using the methodology of Crabbe et al. (1990).
Acc
epte
d A
rtic
le
This article is protected by copyright. All rights reserved
Acc
epte
d A
rtic
le

Figure 1DLSA B C
D E F
G
2 0 0 m s
50
mV
HAP2 LAP2
HAP3 LAP3
IHAP LAP
-60
-40
-20
0
AP Threshold
AP
Th
resh
old
Po
ten
tial
(m
V)
**
H
HAP LAP-100
-80
-60
RMP
Res
tin
g M
emb
ran
eP
ote
nti
al (
mV
)
Rep 2
Rep3
HAP LAP0
20
40
60
80
100
Input Resistance
Inp
ut
Res
ista
nce
(M) *
HAP LAP0.0
0.5
1.0
1.5
AP Half-Width
Hal
f-W
idth
(s)
HAP LAP0
20
40
60
80
100
AP Peak Amplitude
Pea
k A
mpl
itud
e (m
V)
-150 -50 50 150 250 3500
10
20
30
40
50
Replicate 2
Current Step (pA)
Fre
qu
ency
(H
z)
HAP2
LAP2
*
-150 -50 50 150 250 3500
10
20
30
40
50
Replicate 3
Current Step (pA)
Fre
qu
ency
(H
z)
HAP3
LAP3
**
acer_14187_f1.pdf
Thisarticleisprotectedbycopyright.Allrightsreserved
Acc
epte
d A
rtic
le

Figure 2
2 0 0 m s
50
mV
HAP2 LAP2
HAP3 LAP3
I
DMSA B C
D E F
G HHAP LAP
-60
-40
-20
0
AP ThresholdA
P T
hre
sho
ld P
ote
nti
al (
mV
)
HAP LAP-100
-80
-60
RMP
Res
tin
g M
emb
ran
eP
ote
nti
al (
mV
)
Rep3
Rep2
HAP LAP0.0
0.5
1.0
1.5
AP Half-Width
Hal
f-W
idth
(µs)
HAP LAP0
20
40
60
80
100
Input Resistance
Inp
ut
Res
ista
nce
(MΩ)
HAP LAP0
20
40
60
80
100
AP Peak Amplitude
Pea
k A
mpl
itud
e (m
V)
-150 -50 50 150 250 3500
20
40
60
Replicate 2
Current Step (pA)
Fre
qu
ency
(H
z)
HAP2
LAP2
-150 -50 50 150 250 3500
20
40
60
Replicate 3
Current Step (pA)
Fre
qu
ency
(H
z)
HAP3
LAP3
acer_14187_f2.pdf
Thisarticleisprotectedbycopyright.Allrightsreserved
Acc
epte
d A
rtic
le

Figure 3A B C
F
D
G H I
HAP3 LAP3
HAP3 LAP3LAP2
HAP2 LAP2
HAP2J
J
HAP LAP0
2
4
6
8
10
DLS Frequency
sEP
SC
Fre
qu
ency
(H
z)
$
Rep2
Rep3
HAP LAP0
2
4
6
8
10
DMS Frequency
sEP
SC
Fre
qu
ency
(H
z)
$$**
HAP LAP0
5
10
15
20
DLS Amplitude
sEP
SC
Am
plit
ud
e (p
A)
HAP LAP0
5
10
15
20
DMS Amplitude
sEP
SC
Am
plit
ud
e (p
A) **
HAP LAP0.0
0.5
1.0
1.5
DLS Rise Time
sEP
SC
Ris
e T
ime
(ms)
HAP LAP0.0
0.5
1.0
1.5
DMS Rise Time
sEP
SC
Ris
e T
ime
(ms) $
sEP
SC
Dec
ay C
on
stan
t (m
s)sE
PS
C D
ecay
Co
nst
ant
(ms)
E
acer_14187_f3.pdf
Thisarticleisprotectedbycopyright.Allrightsreserved
Acc
epte
d A
rtic
le
Fig
ure 4
AB
HA
P2
HA
P3
LA
P3
LA
P2
HA
P2
HA
P3
LA
P3
LA
P2
CD
AMPAR/NMDARCurrent Ratio
AMPAR/NMDARCurrent Ratio

Figure 5A B C
E
D
HAP2 HAP3 LAP3LAP2
HAP2 HAP3 LAP3LAP2J
HAP LAP0
5
10
15
DLS Frequency
sIP
SC
Fre
qu
ency
(H
z) Rep2
Rep3**
HAP LAP0
5
10
15
DMS Frequency
sIP
SC
Fre
qu
ency
(H
z)
p = 0.06
HAP LAP0
10
20
30
40
DLS Amplitude
sIP
SC
Am
plit
ud
e (p
A) *
HAP LAP0
10
20
30
40
DMS Amplitude
sIP
SC
Am
plit
ud
e (p
A)
HAP LAP0.0
0.5
1.0
1.5
2.0
DLS Rise Time
sIP
SC
Ris
e T
ime
(ms)
HAP LAP0.0
0.5
1.0
1.5
2.0
DMS Rise Time
sIP
SC
Ris
e T
ime
(ms)
HAP LAP0
10
20
30
40
DLS Decay Constant
sIP
SC
Dec
ay C
on
stan
t (m
s)
HAP LAP0
10
20
30
40
DMS Decay Constant
sIP
SC
Dec
ay C
on
stan
t (m
s)
F G H I
acer_14187_f5.pdf
Thisarticleisprotectedbycopyright.Allrightsreserved
Acc
epte
d A
rtic
le