08 -0527 - leg.mn.gov
32
This document is made available electronically by the Minnesota Legislative Reference Library as part of an ongoing digital archiving project. http://www.leg.state.mn.us/lrl/lrl.asp ,- , ,-- - 08 - 0527
Transcript of 08 -0527 - leg.mn.gov

This document is made available electronically by the Minnesota Legislative Reference Library as part of an ongoing digital archiving project. http://www.leg.state.mn.us/lrl/lrl.asp
,- ,,--
-08 - 0527

Acknowledgements
I wish to thank the following individuals for their contributions to this report. Without theirassistance, this report could not have been completed.
e Jim Solstad and Jason Boyle for the many hours they spent reviewing the New London Dam Breachmodels
e Nick Kraska and Jason Boyle for the many hours they spent reviewing and correcting the text in thisdocument.
e Jim Zicopula, "Z", for the final design and layout of this report.
Dana Dostert P.E., P.G.
DNR Waters500 Lafayette RoadSt. Paul, MN 55155-4032(651) 259-5700
Web Address: mndnr.gov/waters
© 2008 State of Minnesota, Department of Natural Resources
April 2008
Impacts of aNe london Dam FailureExecutive Summary
Failure of the New London Dam poses significant risk to anyone accidently driving into thebreach area.
The overtopping of the roadway over the New London Dam poses significant risk to any vehicledriving on that roadway as the vehicle could be easily pushed off the roadway into deep and fastflowing water downstream of the dam.
Several properties in the city of New London downstream of the Dam will be flooded by majorflood events. A dam breach during those flood events will increase the depth of water in those properties. However, it appears that none of those properties are residential.
The spillway of the replacement dam should have the same capacity as the existing dam.Decreasing the capacity of the spillway will create additional high water problems on LakeMonongalia, while increasing the capacity of the spillway will create additional highwater problemsdownstream of the dam and on Nest Lake.
The water surface elevation for the 1% Flood Event (lOO-Year, 24-Hour Storm) was computedto be 1205.3 feet (NGVD-I929), with a flow of approximately 630 cfs. However, the peak flow mayvary from 550 to 675 cfs while the peak water surface elevation may vary from 1204.5 to 1205.7 feet,depending on how the upper gate of the New London Dam is operated.
6. The New London Dam has the capacity to pass the 1% Flood Event (IOO-Year, 24-Hour Storm)using only the upper gate.
7. The Middle Fork Crow River would begin overtopping the roadway at the New London Dam atelevation 1206.7. With both gates fully open, the discharge at this elevation would be approximately1650 cfs, or 11.3 Probable Maximum Flood.
8. At the New London Dam, the water surface elevation for the Probable Maximum Flood (PMF) wascomputed to be 1210.30 feet with a flow of approximately 5050 cfs, assuming normal operation ofboth gates. The PMF exceeded the capacity of the New London Dam, and with all gates fully open,would overtop the roadway by 3.6 feet at the lowest point on the roadway, ifthere were no areas ofbreakout flows.

April 2008
During the Probable Maximum Flood scenario, high water levels would cause water problems atseveral lakeside residences. At two locations, sandbagging would be required to protect property andprevent breakout flows from the reservoir.
During modeled high flow events, Lake Monongalia would not respond as a large reservoir,responding instead as a group of smaller pools connected primarily in series.
. During modeled dam breaches, the floodwave from Lake Monongalia would consist predominantly of water from the lower two pools (26.4 acres). Therefore, the initial dam breach floodwavewould contain a relatively small volume of water.
After dam breach, the water surface elevation of the various pools comprising Lake Monongalia willstabilize at new levels varying from approximately two feet below normal on the upstream most pool, toapproximately eight feet below normal at the New London Dam.
April 2008
When water overtops the roadway, there is a potential for a loss-of-life to any individual driving onthe roadway over the New London dam by being pushed off the road and into deeper waters. Seriousconsideration should be given to eliminating or reducing this risk with the replacement dam.
There is a potential for a loss-of-life due to a failure of the New London Dam to an individualdriving on the roadway over the dam during failure, or driving into the breach area after the dam hascollapsed. To reduce that risk, the roadway over the dam should be highly illuminated.
The location of the New London Fire Department should be reevaluated as the building andequipment may be unavailable for use during a major flood (greater than a 1% Flood Event [IOO-Year,24-Hour Storm]) and during a dam breach. The potential for a loss of life increases if an emergencyresponse is delayed.
.. There is a hydraulic constriction in the stream channel just downstream of the Fire Department. Reducing this constriction by channel modification and lowering the overbanks would increase conveyanceand reduce water levels between the New London Dam and the Fire Department during flood events.
o The current New London Dam is classified as a "High Hazard Dam". The replacement dam shouldbe designed, if possible, to meet the lower classification of "Significant Hazard".
o Any proposed replacement dam should have a discharge capacity similar to the existing New LondonDam. The replacement dam should also have a low-flow notch to maintain minimal flows in thechannel downstream of the dam.
o With the redesign of the New London Dam, careful consideration of the impacts of the new dam onNest Lake need to be evaluated. The new operation plan for the New London Dam must consider themanual operation of the Nest Lake Dam.
The staff gage on the New London Dam does not accurately record the water surface elevation ofhigh water events as the water surface elevation at the gage is impacted by the operation of the gates.This staff gage should be relocated away from the dam so as to not be impacted by the operation ofthe dam.
o The Emergency Action Plan (EAP) should be evaluated to verify it is current.
ImpJ(lS of J New london OJm Failure
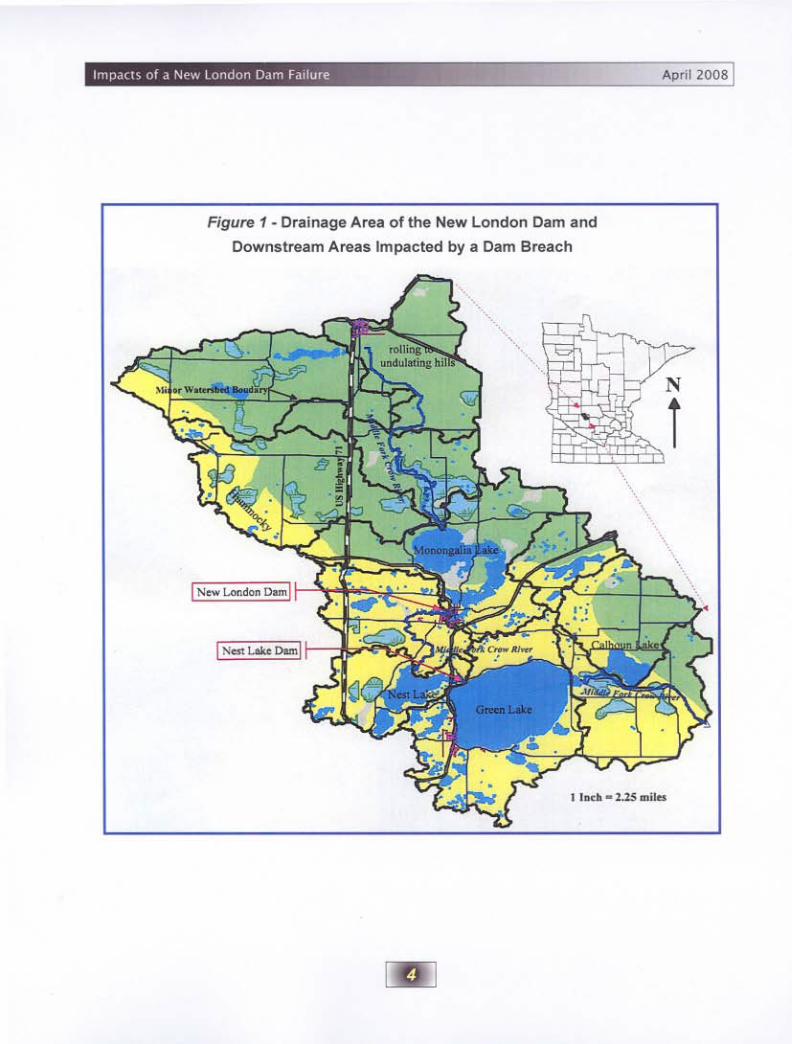
Figure 1 - Drainage Area of the New London Dam and
Downstream Areas Impacted by a Dam Breach
April 2008
lloodl_2.ll ...a..

April 2008 , Impacts of ,I New london Dam Fallu,e
Introduction
The New London Dam is a Iligh-Ilazard L
Dam located on the Middle Fork Crow River. inthe city of New London. Minnesota. The currentdam. constructed in 1958. no longer functions as
'A high-ha=d d~m is defined by Minnesota Rules(Minl\CSO\a Rules 61 15.03-\()) as a dam that" illli.cl)r('Sult in the loss4-life if the dam should fail.
designed due to problems "ilh the gate stems. Inaddition. seepage is an ongoing source of cOncern.Due to the age and condition of the dam, adeci_sion has been made by the owner, Ihe MinneSOlaDcpanmcnt ofNalUral Resourees. to rehabilitatethe dam.
The purpose of this repon is twofold.First. in order to design a new dam. it is necessaryto study the hydrology so Ihat the replacement
Figure 2 -lake Monongalia
April 2008
dam has an appropriate capacity. Therefore, theProbable Maximum Flood (PMF) was computedfor the Middle Fork Crow River atthe NewLondon Dam to assist in properly sizing the replacement dam. Second, due to the dam's classification as high hazard, several dam breachanalyses were performed to determine the impactson the city of New London and downstream areasif the New London Dam should fail.
The New London Dam is located on theMiddle Fork Crow River in the town of NewLondon, Kandiyohi County, Minnesota. TheNew London Dam forms an open water impoundment of approximately 2500 acres, or approximately 3.9 square miles. This impoundment wasrecently renamed Lake Monongalia (prior toDecember 2006, Lake Monongalia was referredto as Mud Lake). Including adjacent wetlands,this impoundment increases in size to approximately 3800 acres, or almost 6 square miles. Atnormal pool, Lake Monongalia has an avetagedepth of 3.5 feet and a maximum depth of approximately 17 feet. At the New London Dam, thelake is approximately 8 feet deep. Figure 1is amap of the project area showing the six watersheds that contribute water to Lake Monongaliaand the New London Dam, and five watershedsdownstream of the New London Dam. A map ofLake Monongalia and the surrounding area isshown in Figure 2.
The Middle Fork Crow River begins nearthe town of Belgrade in Stearns County and flowsapproximately 12 miles to the inlet of LakeMonongalia, and an additional 6.5 miles throuGhb
Lake Monongalia tothe New London Dam.Approximately 5.4 miles downstream of the NewLondon Dam, the Middle Fork Crow River flowsinto Nest Lake. The Nest Lake Dam (Old MillDam), at the outflow ofNest Lake, is approximately 7.7 miles downstream of the New LondonDam. The inlet to Green Lake is approximately200 feet downstream of the Nest Lake Dam.
The drainage area of the Middle ForkCrow River at the New London Dam is approximately 98 square miles. Most of the drainaGeb
area is within Kandiyohi County, but a smallportion of the upper reaches of the watershedextends into both Stearns and Pope Counties.Upstream of the New London Dam, six minorwatersheds supply water to the Middle ForkCrow River. Four of these watersheds supplywater to the river upstream of Lake Monongaliawhile the remaining two watersheds supply waterdirectly to Lake Monongalia.
Topography of the project area is predominantly rolling and undulating hills resulting fromthe movement of the Des Moines Ice Lobe duringthe late Wisconsinan Glaciation (14,000 B.P.).Sediments north of Lake Monongalia are classified as predominantly glacial outwash, whilesediments south of the lake are classified asSupraglacial Drift Complex. Soils are predominantly "B" type prairie soils that have a higher thanaverage infiltration rate, and may be wet soils inparts of the project area. Localized peat depositsare common in the project area, especially northof Lake Monongalia.
The 1856 Public Land Survey of KandiyohiCounty shows no water impoundment of theMiddle Fork Crow River in the vicinity of thetown of New London. Approximately 2 milesnorth of the currenttown of New London, MudLake was shown on that survey to be a small lakeof approximately 250 acres, and is shown inFigure 2 as Ancestral Mud Lake. The area fromAncestral Mud Lake to the town of New Londonconsisted of the Middle Fork Crow River flowinGb
through a series of wetlands. With the building ofthe New London Dam, those wetlands flooded,forming the 2500 acre impoundment now referredto as Lake Monongalia
The first New London Dam was constructedin 1861 for a mill to grind flour. That dam promptlyfailed. Reconstruction of the replacement dam

April 2008
began in 1862 and was completed in 1865. Thesecond dam was built of granite block and mortarand had two operable gates. In 1897, a decisionwas made to remove the dam and restore the riverto natural conditions, but that removal was stoppedby legal action. By the mid-1920's the gates hadbecome inoperable. Around 1938, ownership of thedam was transferred to the State of Minnesota inconjunction with the construction ofa u.S. Fish andWildlife Service fish hatchery downstream of thedam. In 1942, the inoperable gates were replacedby a stoplog structure to allow some manipulationof water levels. In 1958, the stoplog structure wasremoved from the dam and replaced by the existing system of two lift gates stacked vertically.Problems developed with the gate lift mechanismsalmost immediately. Numerous repairs and modifications have been performed over t he ensuingyears.
The New London Dam consists of anearthen embankment with a concrete spillway.The concrete portion of the dam is approximately12 feet wide by 10 feet tall and contains the gatestructure and the two steel gates. Each steel gateis approximately 12 feet wide by 4 feet high andis stacked vertically. See Figure 3a. Above thetwo gates is a opening approximately 12 feet wideby 2.5 feet high to allow additional outflow fromthe dam. The roadway is above this opening.
In addition to the main dam structure, thereis an I8-inch outlet culvert approximately 200 feetwest of the main dam. This structure diverts waterto the fish hatchery, primarily in the spring, to fillfish-rearing ponds.
Figure 3 - New London Dam Lift-Gate Configurations
~GaICH.njSingSt(,lllS~ Catc Raising Stt'IlIS
~ ~

April 2008
The Operation, Inspection and MaintenancePlan calls for the New London Dam to be checkedat least twice a week during the open water season.Upon arrival, the dam tender determines the watersurface elevation from the lake gage on the sideof the dam. If the water surface elevation exceedsthe desired elevation of l203.5 2 feet (NGYD,1929), the Operation, Inspection and MaintenancePlan calls for the dam tender to lower the uppergate, thereby increasing the outflow from the damThe Operation, Inspection and Maintenance Plancalls for a maximum gate adjustment of I inchper hour to minimize downstream impacts.Therefore, during periods of rapidly rising water,it may be necessary to make hourly adjustmentsof the gate(s) over several hours to stop the risingwater surface elevation.
During low-flow conditions, both gateswill likely be closed. As flows increase, the uppergate will be lowered as needed to maintain areservoir elevation of 1203.5 feet. See Figure 3b.If conditions warrant, the upper gate may belowered to the bottom of the sill, which lowersthe runout to an elevation of 1199.5 (Figure 3c).
If the upper gate is completely loweredand the water level in the reservoir continues torise above elevation 1205.23 feet, the Operation,Inspection and Maintenance Plan calls for bothgates to be raised until water levels stop rising orthe gates are lifted completely out of the water(see Figure 3d). Currently, there is concern thatthe gate stems have deteriorated from age andwear, and that if the lower gate is raised, it maynot be possible to lower this gate back into place.Therefore, only the upper gate is currently beingused for water-level control. However, at veryhigh water levels, attempts would be made toraise the lower gate. If the lower gate could not
2 All elevations in this report are assumed to be in the NationalGeodetic Vertical Datum (NGVD) datum plane of 1929.
3 The water surface elevation gage for Lake Momongalia is located on the New London Dam. It has been observed that duringhigh water events. the water surface elevations recorded on the lakegage are lower than the actual water surface elevation of Pool Adue to the drawdown effects of the spillway and the size of the gateopenings.
be lowered back into place after a high-flowevent, the upper gate could be lowered to thebottom of the sill to reduce outflows from LakeMonongalia. With both gates fully lifted, thespillway has an outflow capacity of approximately1260 cubic feet per second (cfs), or 1/4 ProbableMaximum Flood. When flows exceed 1260 cfs,the excess water will cause the water surfaceelevation of Pool A will rise above the elevationof the gate structure. Water levels will continueto rise above the gate structure until inf10ws decrease. If the water surface elevation of Pool Arises above 1206.7, water will overtop the embankment rendering the road impassible.
The Probable Maximum Precipitation(PMP) was computed for the project area usingprocedures described in Design ofSmall Dams(1977). From that manual, the 48-hour PMP wascomputed to be 28.0 inches. The 28.0 inches ofprecipitation was then distributed over 48 hoursusing procedures described in that manual.
For the 1% Flood Event, a precipitationvalue of 5.8 inches was obtained from the NationalWeather Service's Technical Paper 40 (1961).As this 5.8 inches is representative of a 10-squaremile storm, the depth of precipitation was reduced6.8% to 5.4 inches for a 98-square mile stormusing procedures described in the HydrologyGuide for Minnesota (1981). This 5.4 inches ofprecipitation was then distributed over 24 hoursfollowing the distribution of a Soil ConservationService 4 Type II storm.
A precipitation runoff model of the projectarea was then created using the U.S. Army Corpsof Engineers program HEC-HMS (HydrologicEngineering Center - Hydrologic ModelingSystem). The purpose of the HMS model is todetermine the volume of water running off theland from the respective storms and the shape ofthe runoff hydrographs for each of the minorwatersheds.
4 The Soil Conservation Service has been renamed the NaturalResources Conservation Service (NRCS).

April 2008
Two HMS models were created to computestormwater runoff in the project area and theassociated minor watersheds. The first HMSmodel was used to compute the Probable Maximum Flood while the second HMS model wasused to compute the runoff from the 1% FloodEvent (l 00-Year, 24-Hour Storm): Both modelswere set to begin computation at a simulationtime of July 1 with precipitation beginning onJuly 2. Starting the models 24 hours before theprecipitation events allowed the models to stabilize in the established baseflow conditions.
At some locations, the six minor watersheds in the project area were further subdividedinto subwatersheds. Minor watersheds or subwatersheds that contained large lakes, such asMonongalia, Nest or Green, were further reducedinto smaller watersheds so that direct precipitationon these large lakes could be computed with nolosses. Watersheds were further analyzed to determine the contributing and noncontributing drainage area. The drainage areas of the watersheds inthe two models are slightly different becauseseveral areas that were determined to be noncontributing during the 1% Flood Event were assumooto contribute water to the Middle Fork Crow RiverdurinG the Probable Maximum Flood./:>
The Initial and Constant Loss method wasused in HEC-HMS to determine the volume ofwater infiltrating the soil and the volume of waterrunning off the land. Normally, the initial infiltration is assumed to be 10% to 20% of the total precipitation. For the 1OO-Year, 24-Hour Precipitation Event, the initial loss was set at 15% of5.4 inches, or 0.81 inches. For the PMP, theinitial loss was set at 10%, or 2.8 inches. Usingthe lower value of 10% for the PMP computed agreater runoff than using an average value of15%. The lower value was used to compute amaximum expected runoff for the Probable Maximum Flood.
The constant loss is determined by the soiltype. In the project area, soils are predominantly"B"type prairie soils, which have an infiltration
5The I% Flood Event is computed from the IOO-Year, 24-HourPrecipitation Event. and will often be referred to as simply theI% Flood Event. No other time duration was used 111 thIS reportfor the I% Flood Event.
rate of 0.15 to 0.30 inches per hour. For the100-Year, 24-Hour Precipitation Event, an averagevalue of 0.225 inches per hour was used for theconstant infiltration rate. For the PMP, the lowervalue of 0.15 inches per hour was chosen tocompute the highest likely runoff from the land.The time of concentration was computed for eachminor watershed. The time of concentration fromthe furthest most upstream point in the projectarea to the New London Dam was computed to beapproximately 52 hours.
Information that was not incorporated intothe HMS models included baseflow values,evaporation and transpiration losses, the influenceof groundwater, vegetation and other parameters.
After runoff hydrographs were computedfor each of the minor watersheds, subwatersheds,and lakes in the project area, the resulting hydrographs were imported into the U.S. Army Corpsof Engineers River Analysis Program HEC-RAS(Hydraulic Engineering Center - River AnalysisSystem) to perform hydraulic routing of the waterthrouGh the Middle Fork Crow River in the proj-/:>
ect area.
Three HEC-RAS models of the project areawere created to model the Probable MaximumFlood, the 1% Flood Event and the Sunny DayDam Breach scenarios. The HEC-RAS modelsare of the Middle Fork Crow River from itssource near Belgrade and extending approximately 34 miles downstream through LakeMonongalia, Nest Lake and Green Lake, to apoint approximately 3 miles downstream of theoutlet of Green Lake. Cross sections of the riverwere interpolated from United States GeologicalSurvey (USGS) 7.5-minute quadrangle topographic maps and entered into the model. Actualcross sections and bridge information wereobtained from bridge plans supplied by the Minnesota Department of Transportation, KandiyohiCounty and Stearns County.
April 2008
The many tributary streams and ditchesthat merge into the Middle Fork Crow River andLake Monongalia were represented by lateralhydrographs. Many of the larger wetland complexes in the project area were incorporated intothe model as storage areas. These areas storewater during high flow events and release waterback into the river as the river stage falls. Storagearea was determined by digitizing the estimatedarea and depths from quadrangle topographicmaps. The storage areas were connected to theMiddle Fork Crow River using lateral weirs. Thesize and shape of the lateral weirs were interpolated from the quadrangle topographic maps.
The gates in the New London Dam aremanually operated. To simulate the manualoperation of the gates during the I% Flood Even~
the upper gate was lowered (opened) at a rate of0.085 feet (1.02 inch) per hour during rising lakelevels. During the Probable Maximum Flood,the upper gate was rapidly lowered to the fullyopen position while the lower gate remainedclosed until the water surface elevation exceeded1205.20. As the water surface elevation exceeded1205.20, both gates were raised out of the waterand water passed freely though the dam. It wasassumed that during the Probable MaximumFlood, it is more important to reduce water levelsthan to follow the Operation, Inspection andMaintenance Plan. During the Sunny Day scenario, no gate adjustments are made.
In addition, the type of gates available inHEC-RAS does not include lift gates like those
at the New London Dam. The lower lift gate atthe New London Dam behaves like a sluice gatewhile the upper gate, when lowered, operates in amanner opposite a sluice gate. As a rating curveexists for the upper gate based on field measurements, the weir coefficient of the upper gate wasadjusted so that discharges from the dam whenthe upper gate is lowered matched the dischargeson the measured rating curve.
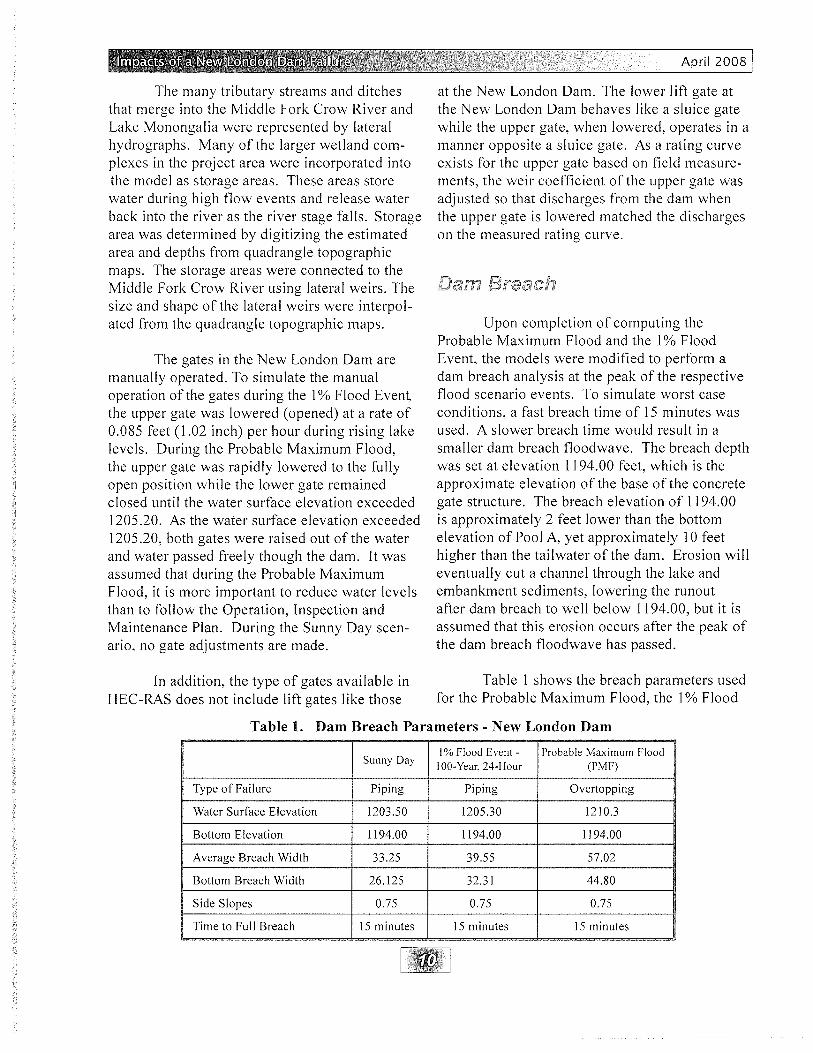
Upon completion of computing theProbable Maximum Flood and the I% FloodEvent, the models were modified to perform adam breach analysis at the peak of the respectiveflood scenario events. To simulate worst caseconditions, a fast breach time of 15 minutes wasused. A slower breach time would result in asmaller dam breach floodwave. The breach depthwas set at elevation 1194.00 feet, which is theapproximate elevation of the base of the concretegate structure. The breach elevation of 1194.00is approximately 2 feet lower than the bottomelevation of Pool A, yet approximately 10 feethigher than the tailwater of the dam. Erosion willeventually cut a channel through the lake andembankment sediments, lowering the runoutafter dam breach to well below 1194.00, but it isassumed that this erosion occurs after the peak ofthe dam breach floodwave has passed.
Table 1 shows the breach parameters usedfor the Probable Maximum Flood, the 1% Flood
Table 1. Dam Breach Parameters - New London Dam
Sunny Day1% Flood Event - Probable Maximum Flood
100-Year. 24-Hour (PMF)
Type of Failure Piping Piping Overtopping
Water Surface Elevation 1203.50 1205.30 1210.3
Bottom Elevation 1194.00 1194.00 1194.00
Average Breach Width 33.25 39.55 57.02
Bottom Breach Width 26.125 32.31 44.80
Side Slopes 0.75 0.75 0.75
Time to Full Breach 15 minutes 15 minutes 15 minutes

April 2008
EH:nt. and the Sunny Day Dam Breach. ThcWalef" SI.Irfacc clcvation listed is 11K: maximumWalef" SI.Irfacc dcnlion of the rescn oir prior 10
dam breach. An a\crage breach .... idth of 3.5limn lhe: breach heighl waslklermincd b} sublracling 11114.00 from the puk watcr SUrflCCclculion.
Research on dam breachl'S has shownthat thc sidcslopcs of a breached dam vary fromnear vcrtical (90 degrees) for highly compacteddams constructed with cohesivc soils. to approximately 45 degrees (I foot hori7.ontal to I fOQtvenical) for poorly compacted dams. dams containing large amount of clay. and dams constructed of noncohesive soils. For the New London[)am. it is assumed thallhe cmbankmem is ",ellcompacted. cohc:si\c. and lacks a large volumo: ofcby. 1lIosc assumptions dictatc nc:ar \crticalsideslopl'S for the modds. Ilowcvcr. shallowef"si<kslopcs of 0.75 foot horiwnl.llio I fOOl \crocalwere chosen to re~nt .... OI'SI tISI: CtlrIdilions.
Two diffcrmll)'pl'S ofdam failum .... en:modeled. The Sunny Day scCTlllrio and the 1%Flood EHnl .... en: modc:led 1$ piping failures.Piping failures occur .... hen watef" flows through\oids in Ihccmbankmml. c\cntually leading 10 thecotlapscofthecmbankmmt. Forlhc I"robabkMaximum Floal. an o\'cnopping failure ....-asmodeled. An ovcrtopping failll~ is a result of.....atcr flo.....ing ovcr thc lOp of the dam andcrodingor scouring the do"'nslream facc nfthe dam. Forthe Ne ..... London Dam. the a"crtopping failureduring the Probable Maximum Flood is assumedto occur ..... hcn Ihe water surface in the reservoirreachcs maximum clcvation. Thc dam ",ill nOIbe ovcnoppro during thc Sunny Day or 1"-. FloodE\·ml.
Figure 4 sIIo""s the: compuled watcr surfaceclc\·lItions of Lake Monongalia at the New LondonDam for the Probable Maximum Flood. the: I".Flood E\cm and the Sunn)' Da) s«nario5.
Figure 4. Lake .....IOI~~Wlter SurlKto E......tioMlit thot~ L.oncIorl oaM(PooI Al
1211
,,,.,~
,~
,"'f,~
,=I ,~, ,=•I ,=,
'"'•I ,~............
.. 0...
- _._--- ,....·...--1--.--""'_co,- ..._-
_.~
-w
"- -.--''Y ..... IQ,_ POO! '" Hi
---
- ---- ,,,, ft:-\:*_.._-~----- -"--_..--_.._- .~
-......_-
• ., , , , , , , ,1/1100 '121I3O ,'""'" ,....., ,,..,. ,...... mil» ,.- , 11100<10 111""'" 111_111_ 111..., 111 ....
..... ·11 ...
April 2008
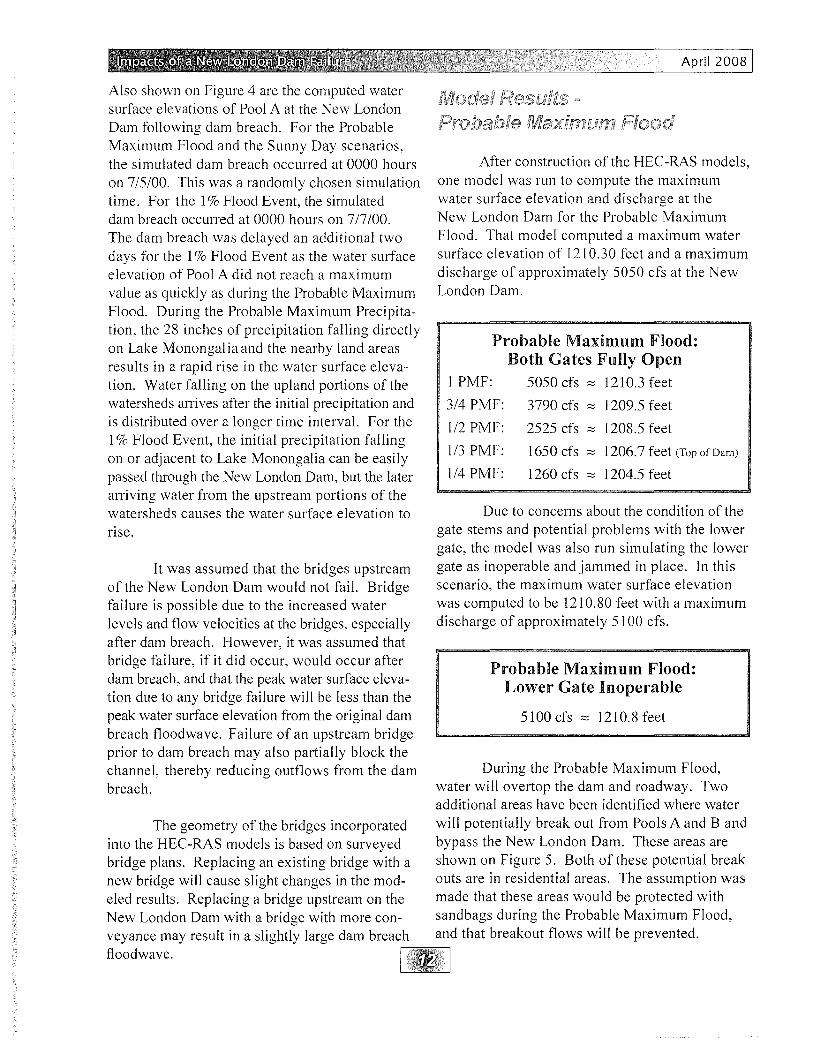
Probable Maximum Flood:Both Gates Fully Open
5050cfs:::::; 1210.3feet
3790 cfs :::::; 1209.5 feet
2525 cfs :::::; 1208.5 feet
1650 cfs :::::; 1206.7 feet (Top of Dam)
1260 cfs :::::; 1204.5 feet
1 PMF:
3/4 PMF:
1/2 PMF:
1/3 PMF:
1/4 PMF:
Probable Maximum Flood:Lower Gate Inoperable
5100 cfs :::::; 1210.8 feet
After construction of the HEC-RAS models,one model was run to compute the maximumwater surface elevation and discharge at theNew London Dam for the Probable MaximumFlood. That model computed a maximum watersurface elevation of 1210.30 feet and a maximumdischarge of approximately 5050 cfs at the NewLondon Dam.
Due to concerns about the condition of thegate stems and potential problems with the lowergate, the model was also run simulating the lowergate as inoperable and jammed in place. In thisscenario, the maximum water surface elevationwas computed to be 1210.80 feet with a maximumdischarge of approximately 5100 cfs.
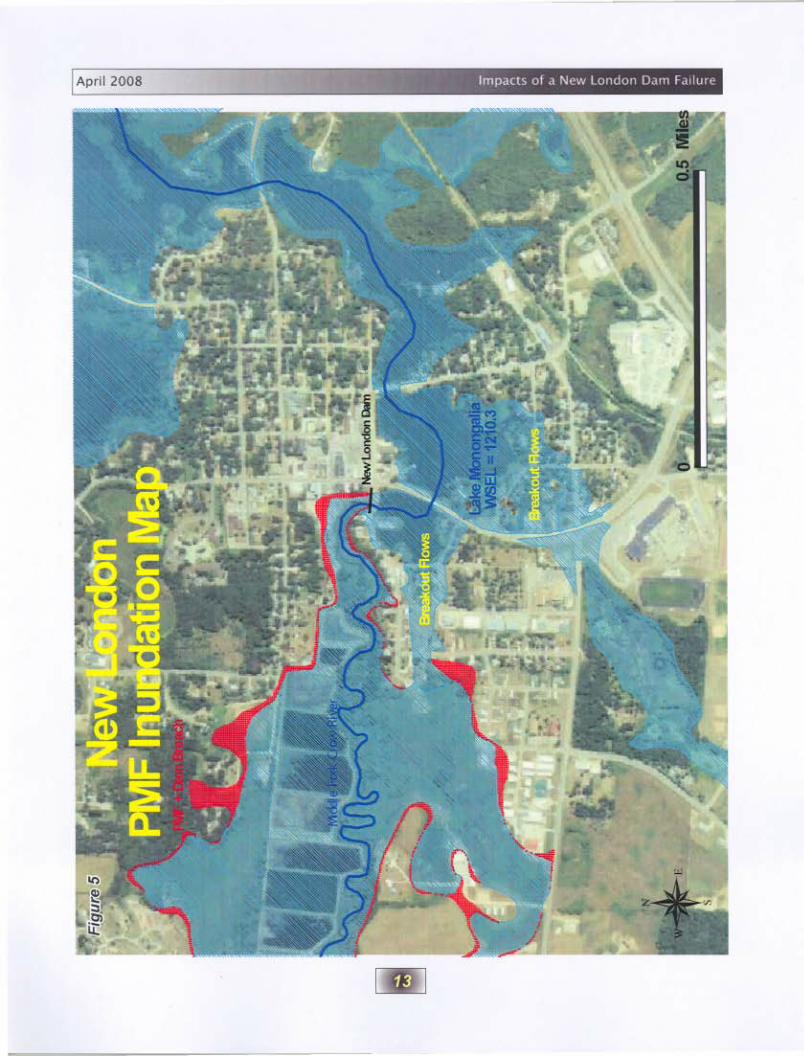
During the Probable Maximum Flood,water will overtop the dam and roadway. Twoadditional areas have been identified where waterwill potentially break out from Pools A and Bandbypass the New London Dam. These areas areshown on Figure 5. Both of these potential breakouts are in residential areas. The assumption wasmade that these areas would be protected withsandbags during the Probable Maximum Flood,and that breakout flows will be prevented.
Also shown on Figure 4 are the computed watersurface elevations of Pool A at the New LondonDam following dam breach. For the ProbableMaximum Flood and the Sunny Day scenarios,the simulated dam breach occurred at 0000 hourson 7/5/00. This was a randomly chosen simulationtime. For the 1% Flood Event, the simulateddam breach occurred at 0000 hours on 7/7/00.The dam breach was delayed an additional twodays for the 1% Flood Event as the water surfaceelevation of Pool A did not reach a maximumvalue as quickly as during the Probable MaximumFlood. During the Probable Maximum Precipitation, the 28 inches of precipitation falling directlyon Lake Monongal ia and the nearby land areasresults in a rapid rise in the water surface elevation. Water falling on the upland portions of thewatersheds arrives after the initial precipitation andis distributed over a longer time interval. For the1% Flood Event, the initial precipitation fallingon or adjacent to Lake Monongalia can be easilypassed through the New London Dam, but the laterarriving water from the upstream portions of thewatersheds causes the water surface elevation torIse.
It was assumed that the bridges upstreamof the New London Dam would not fail. Bridgefailure is possible due to the increased waterlevels and flow velocities at the bridges, especiallyafter dam breach. However, it was assumed thatbridge failure, if it did occur, would occur afterdam breach, and that the peak water surface elevation due to any bridge failure will be less than thepeak water surface elevation from the original dambreach floodwave. Failure of an upstream bridgeprior to dam breach may also partially block thechannel, thereby reducing outflows from the dambreach.
The geometry of the bridges incorporatedinto the HEC-RAS models is based on surveyedbridge plans. Replacing an existing bridge with anew bridge will cause slight changes in the modeled results. Replacing a bridge upstream on theNew London Dam with a bridge with more conveyance may result in a slightly large dam breachf1oodwave.
April 2008 • Impact~ of a New london D"m F~i1u,e
April 2008
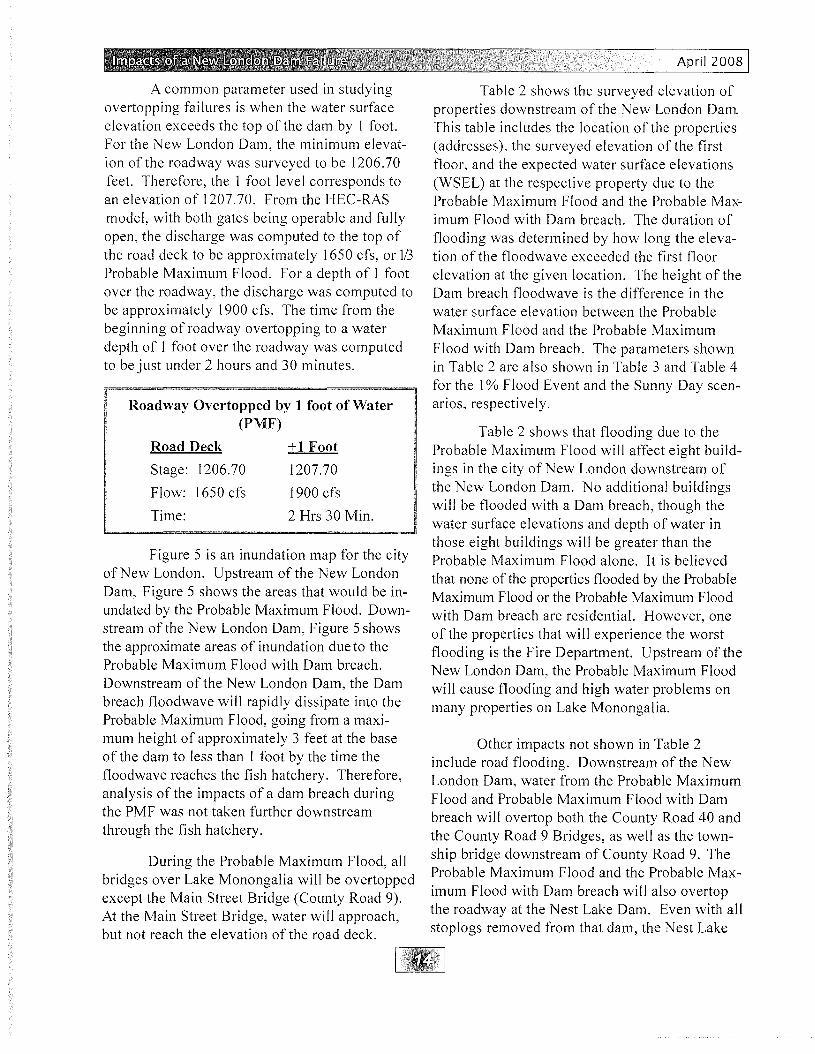
Roadway Overtopped by 1 foot of Water(PMF)
A common parameter used in studyingovertopping failures is when the water surfaceelevation exceeds the top of the dam by I foot.For the New London Dam, the minimum elevation of the roadway was surveyed to be 1206.70feet. Therefore, the I foot level corresponds toan elevation of 1207.70. From the HEC-RASmodel, with both gates being operable and fullyopen, the discharge was computed to the top ofthe road deck to be approximately 1650 cfs, or 113Probable Maximum Flood. For a depth of I footover the roadway, the discharge was computed tobe approximately 1900 cfs. The time from thebeginning of roadway overtopping to a waterdepth of I foot over the roadway was computedto be just under 2 hours and 30 minutes.
Figure 5 is an inundation map for the cityof New London. Upstream of the New LondonDam, Figure 5 shows the areas that would be inundated by the Probable Maximum Flood. Downstream of the New London Dam, Figure 5 showsthe approximate areas of inundation due to theProbable Maximum Flood with Dam breach.Downstream of the New London Dam, the Dambreach floodwave will rapidly dissipate into theProbable Maximum Flood, going from a maximum height of approximately 3 feet at the baseof the dam to less than 1 foot by the time thefloodwave reaches the fish hatchery. Therefore,analysis of the impacts of a dam breach duringthe PMF was not taken further downstreamthrough the fish hatchery.
During the Probable Maximum Flood, allbridges over Lake Monongalia will be overtoppedexcept the Main Street Bridge (County Road 9).At the Main Street Bridge, water will approach,but not reach the elevation of the road deck.
Road Deck
Stage: 1206.70
Flow: 1650 cfs
Time:
+1 Foot
1207.70
1900 cfs
2 HI'S 30 Min.
Table 2 shows the surveyed elevation ofproperties downstream of the New London DamThis table includes the location of the properties(addresses), the surveyed elevation of the firstfloor, and the expected water surface elevations(WSEL) at the respective property due to theProbable Maximum Flood and the Probable Maximum Flood with Dam breach. The duration offlooding was determined by how long the elevation of the floodwave exceeded the first floorelevation at the given location. The height of theDam breach flood wave is the difference in thewater surface elevation between the ProbableMaximum Flood and the Probable MaximumFlood with Dam breach. The parameters shownin Table 2 are also shown in Table 3 and Table 4for the 1% Flood Event and the Sunny Day scenarios, respectively.
Table 2 shows that flooding due to theProbable Maximum Flood will affect eight buildings in the city of New London downstream ofthe New London Dam. No additional buildingswill be flooded with a Dam breach, though thewater surface elevations and depth of water inthose eight buildings will be greater than theProbable Maximum Flood alone. It is believedthat none ofthe properties flooded by the ProbableMaximum Flood or the Probable Maximum Floodwith Dam breach are residential. However, oneof the properties that will experience the worstflooding is the Fire Department. Upstream of theNew London Dam, the Probable Maximum Floodwill cause flooding and high water problems onmany properties on Lake Monongalia.
Other impacts not shown in Table 2include road flooding. Downstream of the NewLondon Dam, water from the Probable MaximumFlood and Probable Maximum Flood with Dambreach will overtop both the County Road 40 andthe County Road 9 Bridges, as well as the township bridge downstream of County Road 9. TheProbable Maximum Flood and the Probable Maximum Flood with Dam breach will also overtopthe roadway at the Nest Lake Dam. Even with allstop logs removed from that dam, the Nest Lake

April 2008
Table 2. Probable Maximum Flood and Probable Maximum Floodwith Dam Breach
Inundation Depths in Downstream Properties
Probable Probable Maximum FloodMaximum Flood with Dam Breach
Address 1st Floor WSEL Depth Duration WSEL Depth Duration Height of DBElev. (ft.) (ft.) HR:MN (ft.) (ft.) HR:MN Floodwave (ft.)
Garage at Alley 1195.81 1196.33 0.52 56:11 1199.17 3.36 59:36 +2.8414 Main St
Building Basement 1195.35 1196.17 0.82 70:25 1198.99 3.64 n.51 +2.8224 Main St
Pottery Shop
17 Central Ave 1193.06 1195.97 2.91 8+ Days 1198.70 5.64 9+ Days +2.73Garage 1190.75 1195.97 5.22 8+ Days 1198.70 7.95 9+ Days +2.73
Fire Department 1191.31 1195.32 4.01 8+ Days 1197.79 6.48 9+ Days +2.47
Telecom Building 1194.01 1194.13 0.12 32:02 1195.39 1.38 37.58 +1.2624 Central Ave
Banner Oak 1193.30 1194.05 0.75 81: 14 1195.18 1.88 82.09 +1.1398 Central Ave
Construction Co 1192.64 1194.02 1.38 118:04 1195.11 2.47 119:06 +1.09102 Central Ave
Residence 1200.69 1193.90 --- --- 1194.77 --- --- +0.87108 Central Ave
Residence 1197.63 1193.84 --- --- 1194.61 --- --- +0.77112 Central Ave
Residence 1199.01 1193.75 --- --- 1194.36 --- --- +0.61118 Central Ave
Dam has insufficient capacity to pass the Probable Maximum Flood. Considering the poor condition of the tailrace below the Nest Lake Damspillway, the overtopping of the Nest Lake Dammay lead to failure of that spillway and ultimatelythe Nest Lake Dam.
Probable Maximum Flood and the ProbableMaximum Flood with Dam breach will also overtopthe roadway at the Nest Lake Dam. Even withall stoplogs removed from that dam, the Nest LakeDam has insufficient capacity to pass the ProbableMaximum Flood. Considering the poor condition
of the tailrace below the Nest Lake Dam spillway,the overtopping of the Nest Lake Dam may leadto failure of that spillway and ultimately the NestLake Dam.
The tabular data shown in Table 2 is showngraphically in Figure 6c. Figure 6 shows a profileof the Middle Fork Crow River extending fromapproximately 200 feet upstream of the NewLondon Dam, to the approximately 2000 feetdownstream of the dam, which is near the corporatelimit of the city. Figure 6 includes the computedwater surface elevations for the various flood

April 2008
Figure 6
Water Surface Elevations of the Middle Fork Crow River from New London Damdownstream 2000 feet for the three scenarios
2000
'"Ut:'""'0
"iii
'"t:r::
18001600
Sunny Day1210,
-i
1206 ~!--__-"" New London Dam
~ 1202 ~u. 1-1198 ~I
i 11941Q) -
iii 1190--jJ
118611182 -L.:'-------'--,-'----'------!"'''-'-----T--'-'!--'-------'--,.=---------,'-------'--+cLLrl.LLy.u.J!--'-------'--T--'-'!--LL¥-'---'lI'-------'--¥--'--"'-rl'-------'---(--L4.L.c.c-T-'-'-----L,J=¥-'-----o
-200 0 200 400 600 800 1000 1200 1400
1210,
1206 -=i-i="-__,___,_--,
!'2021~ 1198lo -~ 1194-.::1~> Q)
iii 1190 l1186 =1
1% Flood Event
1% Flood Event
200018001600140012001000800600400200o1182 -I!---,-,w---,--__,_--r---,----,--"-..L..,-J..J-\-U-'---,--,---r-'-'--r-'-!-----,--L-'----r---r--'----'--L---,--'T---r---,
-200
Probable MaximumFlood
Probable Maximum Flood
20001800200 400 600 800 1000 1200 1400 1600
Distance Downstream from the New London Dam (feet)
o1182 -i1=-,-,w---.-...-.....,----,---,--"-..L..,--LJL.l,.-l-'-l-,--,--,.LL...-.-L!-----,--L"--r--r'---r-__,_-'T---r--o
-200

April 2008
scenarios, the computed water surface elevationsdue to a dam breach, the approximate location ofproperties downstream of the dam, and elevationof the first floor of those properties.
Figure 7 shows the profile of the MiddleFork Crow River from just upstream of LakeMonongalia, through the lake to just downstreamof the New London Dam. Included in Figure 7 arethe calculated water surface elevations for theProbable Maximum Flood, the I% Flood Event,and the Sunny Day scenarios. One of the surprising results observed in the Probable MaximumFlood model was the variation in water surfaceelevations in the different segments or pools thatconstitute Lake Monongalia. Note the bridges andthe changes in water surface elevations associatedwith the different pools between the bridges.Normally, on a lake with a river flowing through
it, there is a very slight decrease in the watersurface elevation from where the river enters thelake to where the river exits the lake. During dryor low-flow conditions, the lake is essentially flat.This is also true of Lake Monongalia. However,during the Probable Maximum Flood, the modelindicates that the difference in the water surfaceelevation from the upstream end of the lake to thedam would be more than 4 feet. This effect canalso be seen during the 1% Flood Event, thoughin that scenario, the change in the water surfaceelevation would be less than I foot. It was foundduring modeling that, in most cases, the watersurface elevation in each of the pools that constitute the lake would be controlled by thehydraulics of the nearest downstream bridge.The only exception was the Main Street Bridge(old U.S. Highway 71 bridge), which has sufficient capacity so that hydraulic control in Pool Bis provided by the New London Dam.
Figure 7. Computed Lake Monongalia Water Surface ElevationsProbable Maximum Flood, 1% Flood Event and Sunny Day
1220Lake Monongalia
1<-1::---------"------------i"
Kc- ---'P---'OO:.:..:'D'---- -"'#-H Po_ol_F__-l'>1 Upstream \Vcthmds
1215
1210
1205
NcwLo
1200
1195
17 19 20 " 22 23 24 25

April 2008
A similar effect can also be seen on NestLake where a stepped water surface elevation canbe seen at several bridge crossings during theProbable Maximum Flood. As the Middle ForkCrow River flows through Nest Lake, the lakeconstricts as the river approaches a bicycle trailbridge (former railroad bridge), the MinnesotaHighway 23 bridge, and then the Nest Lake Dam.During the Probable Maximum Flood, the modelindicates that the water surface elevation wherethe Middle Fork Crow River enters Nest Lake isapproximately 1-3/4 feet higher than at the NestLake Dam. For the 1% Flood Event, the difference in water surface elevation is approximately1 inch. All Nest Lake water surface elevationsused in this report are at the Nest Lake Dam.
A second HEC-RAS model was createdusing output from the HMS model for the 1%Flood Event. In this scenario, gates were adjusted in accordance with the procedures describedin the Operation, Inspection and MaintenancePlan. That plan calls for the gates to be openedin increments of one inch per hour as the watersurface elevation of the reservoir rises from1203.50 feet. For the 1% Flood Event, this adjustment rate of one inch per hour resulted inthree adjustments in the first nine hours, andthen hourly adjustments for 41 consecutive hoursto move the upper gate to the fully open position.This gate operation resulted in a computed discharge of approximately 630 cfs and a computed
water surface elevation of 1205.30 feet. In thisscenario, the lower gate was not opened eventhough the Operation, Inspection and MaintenancePlan calls for the opening of the lower gate oncethe water surface elevation exceeds 1205.20 feet.The Operation, Inspection and Maintenance Planfor the New London Dam (Ayres, 1990) lists thewater surface elevation of the 1% Flood Eventas 1205.2 feet, with a discharge of 550 cfs.
As the New London Dam has manuallyoperable gates, computing an exact water surfaceelevation and discharge for the 1% Flood Eventis difficult as it is possible to exchange dischargefor water surface elevation. Therefore, the modelwas run several times with different gate settings.For example, recognizing that a 100-Year,24-Hour Precipitation Event is occurring, the damtender could preemptively move the upper gate tothe fully open position. This preemptive actionwould reduce the discharge of the 1% Flood Eventto 550 cfs with a maximum water surface elevation of 1204.50. Conversely, a delayed response,such as allowing the reservoir to rise to an elevation of 1204.00 before making a gate adjustment, would allow the water surface elevation ofthe reservoir to rise to approximately 1205.7 feet,with a discharge of approximately 675 cfs.
A maximum water surface elevation of1204.75 was recorded at the New London Dam onSeptember 18, 1991. Surveyed elevations greaterthan 1204.75 have been recorded at other locations on Lake Monongalia on several occasions,including a maximum value of 1205.42 on September 20, 1991.
1% Flood Event at the New London Dam
630 cfs ~ 1205.3 feet
550 cfs ~ 1204.5 feet
675 cfs ~ 1205.7 feet
Normal Gate Operations
Preemptive Gate Operations
Delayed Gate Operations

April 2008
Table 3 shows the computed water surfaceelevation at 11 buildings downstream of the NewLondon Dam for the 1% Flood Event and the 1%Flood Event with Dam breach. From the calculated water surface elevation and property elevation,the expected depth and duration of flooding wascomputed as a result of the Dam breach floodwave. The height of the Dam breach floodwave,which is the difference in water surface elevationbetween the 1% Flood Event and the 1% FloodEvent with Dam breach, is also shown. The datashown in Table 3 is also shown graphically inFigure6b.
Table 3 shows that only one building, thePottery Shop garage, would be slightly impactedby the 1% Flood Event. However, with Dambreach, flooding would be expected in three properties, with a duration of flooding of less than 90minutes for two of the properties and approximately three days for the third property. The reasonfor the three days of flooding at the Pottery Shopgarage is that the 1% Flood Event exceeds theelevation of the garage for almost 2 days, andwhen combined with the water from the dambreach, the elevation of the garage floor is exceededfor a third day. For the other two properties, the
Table 3. 1% Flood Event and 1% Flood Event with Dam BreachInundation Depths in Downstream Properties
1% Flood Event 1% Flood Event with DamBreach
Address 1st Floor WSEL Depth WSEL Depth Duration Height of DBElev. (ft.) (ft.) (ft.) (ft.) HR:MN Floodwave (ft.)
Garage at Alley 1195.81 1190.90 --- 1194.57 --- .._- 3.6714 Main St
Building Basement 1195.35 1190.84 --- 194.41 ..._- 3.5724 Main St
Pottery Shop
17 Central Ave 1193.06 1190.78 --- 1194.24 1.18 0:30 3.46Garage 1190.75 1190.78 0.03 1194.24 3.49 3+ Days 3.46
Fire Department 1191.31 1190.50 --- 1193.60 2.29 1:21 3.10 II
Telecom Building 1194.01 1188.42 --- ......- 2.70 I24 Central Ave I
Banner Oak 1193.30 1188.28 --- 2.70 I98 Central Ave
Construction Co 1192.64 1188.09 --- 1190.83 --- 2.701102 Central Ave
Residence 1200.69 1187.94 --- 1190.57 --- --- 2.63108 Central Ave
Residence 1197.63 1187.88 --- 1190.45 --- --- 2.57112 Central Ave
Residence 1199.01 1187.74 --- 1190.22 --- --- 2.48118 Central Ave

April 2008
Pottery Shop and the Fire Department, the floodwave would quickly pass through the area, resulting in the water surface elevation dropping belowthe floor elevation in 30 minutes and 81 minutes,
respectively. The County Road 9 bridge southwest of New London would be the only bridgeovertopped by the combined 1% Flood Event andthe dam breach floodwave.
Table 4. Sunny Day and Sunny Day with Dam BreachInundation Depths in Downstream Properties
Sunny Day Sunny Day with IDam Breach I
Address 1st Floor WSEL Depth WSEL Depth Duration Height of DBIElev. (ft.) (ft.) (ft.) (ft.) HR:MN Floodwave (ft.) I
Garage at Alley 1195.8l 1185.59 --- 1192.45 --- --- 6.86 I14 Main St I
I
Building Basement 1195.35 1185.58 --- 1192.28 --- --- I 6.7024 Main St IPottery Shop
17 Central Ave 1193.06 1185.57 --- 1192.13 --- --- 6.56Garage 1190.75 1185.57 --- 1192.13 1.38 1:00 6.56
Fire Department 1191.31 1185.50 --- 1191.58 0.27 0:13 6.08
Telecom Building 1194.01 1184.68 --- 1189.95 --- --- 5.2724 Central Ave
Banner Oak 1193.30 1184.54 --- 1189.83 --- --- 5.2998 Central Ave
I
Construction Co 1192.64 1184.27 --- 1189.59 --- --- 5.32102 Central Ave
Residence 1200.69 1184.25 --- 1189.57 --- --- I 5.32108 Central Ave I
Residence 1197.63 1184.17 --- 1189.25 --- --- I 5.08
I112 Central Ave iI
Residence 1199.01 1184.17 --- 1189.09 --- --- I 4.92I118 Central Ave I
April 2008 ~ Impact' of a New London Dam ,a,lure
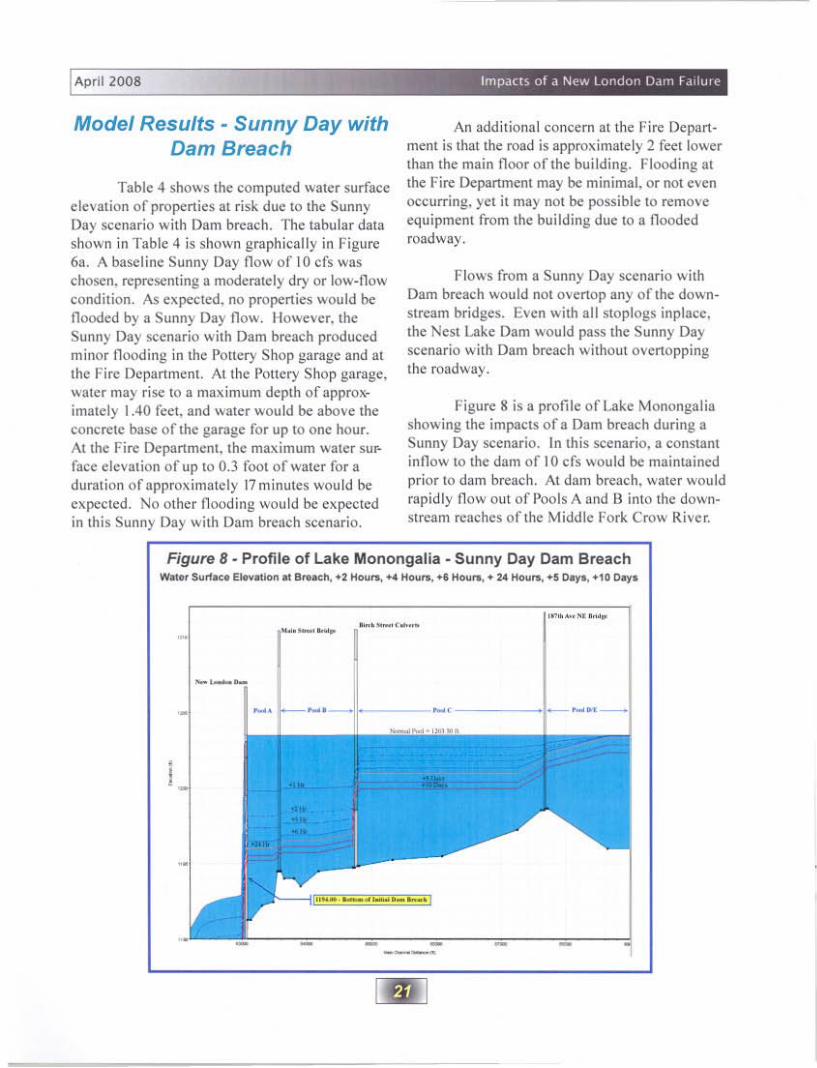
Model Results - Sunny Day withDam Breach
Table 4 shows the computed ,",'ater surfaceelevation of properties at risk due 10 thc SunnyDay s<.:enario with Dam breach. The tabular datashown in Table 4 is shown graphically in Figure6a. A baseline Sunny Day llow of 10 cfs waschos<.:n. representing a moderately dry or low-flow'ondition. As ~xp<Xt~d. no propertie5 would beflooded by a Sunny Day flow. Howe'er. theSunny Day seenario with Dam brea~h produ,edminor llooding in the POllery Shop garag' and alIh<l Fire D~partm~m. AI Ih~ I'OIl~ry Shop garag~.
wal~r may rise 10 a maximum d~pth of approximately 1.40 feet. and ,",ater would be abo~e the,on,ret~ base of the garage for up to one hour.At the Fire Department. the maximum water surface e1~valion of up to 0.3 fOQI of waler for aduration of approximately 17 minutes would beexpected. No other nooding would be expe,;tedin this Sunny Day ,",'ith Dam breach scenario.
An additional conc~rn at th~ l:ir~ D~part
ment is that th~ road is approximately 2 feet lowerthan the main llOQr of the building. Flooding atthe Fire Department may be minimal. or not evenoc~urring. yel it may not be possible to removeequipmem from the building due 10 a lloodedroadway,
Flo,",s from a Sunny Day seenario ,",llhDam brcaeh would not overtop any of the downstream bridges. E,en with all stoplogs inplace.the Nest Lake Dam would pass the Sunny Dayse~nario '"' ith Dam breach wilhout overtoppingIhc roadway.
Figure 8 is a profile of Lake Monongaliashowing the impacts of a Dam breach during aSunny Day s<.:enario. In this s<.:enario. a constantinllow to the dam of 10 cfs "ould be maintainedprior 10 dam breach. At dam breach. water wouldrapidly now out of POQls A and B into the downstream reaches of the Middle Fork Crow River.
Figure 8· Profile of lake Monongalia - Sunny Day Dam Breach_ S.<loc:o E......."'" .. -":0, .2 _, ~ _to... H......, • :u _to..~ Do,•• "0 o.y.
--- -~.,,-
--- _.
i
••
I,..... -......~-.. ........I
- -
April 2008
One hour after Dam breach, water levels in PoolsA and B would drop approximately 3.5 feet.Two hours after Dam breach, the water levels inPools A and B would drop approximately five feet.In Pool C, the water level would fall approximately 1.5 feet two hours after Dam breach. In theremaining upstream pools, the drop in water surface elevations would be small and gradual.Figure 8 also shows the computed water surfaceelevation 3 hours, 6 hours, 24 hours, 5 days and10 days after dam breach.
Assuming no changes in inflow, waterlevels in Lake Monongalia would drop quickly inthe first 24 hours after dam breach. However,24 hours after dam breach, the water surfaceelevation in the various pools of the lake wouldfall at a much slower rate. After dam breach, outflow from the New London Dam would now be afunction of the breach geometry and the watersurface elevation in Pools A and B. After theinitial dam breach and loss of water in Pools Aand B, outflow from the New London Dam wouldstabilize at approximately 225 cfs and then slowlydecrease as the water surface elevations in theupstream pools drops. This assume that noemergency action has been taken to temporarilyrepair or reduce outflows from the dam.
For the 1% Flood Event and the ProbableMaximum Flood, the water surface elevation ofLake Monongalia would be higher than in theSunny Day scenario due to increased flow in theMiddle Fork Crow River. However, after dambreach, a stepped pattern similar to that shown inFigure 8 for the Sunny Day will occur, though thewater surface elevations will be higher than theSunny Day scenario.
With hundreds of residential propertieslocated downstream of the New London Dam onNest Lake and Green Lake, it is also important todetermine if there are any impacts of a dambreach on these two lakes. Flood events greaterthan the lOa-Year Flood Event will cause damageto some residential properties on both lakes. Aflood event approaching the Probable MaximumFlood, will cause damage to many residentialproperties. However, the models indicate that theimpacts of a New London Dam breach on NestLake and Green Lake during one of these floodevents would be relatively minor, as the volumeof water from the respective flood events issignificantly greater than the volume of waterfrom the dam breach.
Figure 9 shows the computed water surface elevations on Nest Lake for the ProbableMaximum Flood, the 1% Flood Event and theSunny Day scenarios with and without dambreach. For the Probable Maximum Flood, thepeak water surface elevation on Nest Lake is aresult of the combination of direct precipitationon the lake, runoff from the local watersheds, andinflow from Lake Monongalia. The peak watersurface elevation occurs approximately 16 hoursafter the beginning of precipitation and then dropsrapidly as direct precipitation on the lake ceasesand runoff from the local watershed diminishes.
A second peak water surface elevationoccurs 3 days later on July 5 and is a result of thepeak water surface elevation on Lake Monongaliaand a maximum discharge from the New LondonDam. Approximately 2-1/2 hours after dambreach, water levels on Nest Lake start to risewith the arrival of the leading edge of the dambreach floodwave. However, the increase inwater surface elevation on Nest Lake due to dambreach was computed to be slightly less than twoinches as the dam breach floodwave is attenuatedby the channel between the New London Dam and

Apri' 2008
1173
1112
1171
I 1170
! ,,~
••1 ,,~
••! 11$7•
,,~
1I$~
,,~
"":_ Impa<l~ of a NE.'W London Dam ~a,lure
Figure 9 - Nest Lake Water Surface Elevationat the Nest Lake Dam..,
....._...._.-.", ... - ."'_•.-,....V_.'__l
PMF. DB SQ-_o-.
V<la._ ......
11lo' DB, flud ern'
-------~~,-/'
1% fl.od Cr••'
.'" FE' 08 lIP:: ...w11!M.llll1lo fE /I. fl.od Creo'
" • ""-_...__....-- _.._-""~--..._-- -'''-- ..._ e-w_ ...,...,
7/1100 712100 713101l 714/00 71s.oD 71l51OO 7f71OO 71810O 71\1IOO 7I1MXl7/111OO7I12.ol)(l7I1:W07114/007I1MlO---Nest Lake, and further reduced as the inf10wingwater spreads out into Nest Lake. NOle that thewater surfacc clevation for both peaks ovcrtopsthc roadway at thc Nest Lake Dam. It wasassumed thaI during the Probablc MaximumFlood, all stoplogs in the Nest Lake Dam areeither rapidly removed or fail due to high waterpressures. If the stoplogs could not be removed,the water surface elevation On Nest Lake wouldbe noticeably higher.
The 10/. Flood Evcnt was modeled in twodifferent configurations for the Nest Lake Dam.The first condition assumcs aggressi,'c operationof the Nest Lake Dam to maintain a watcr surfaccelcvation of 1165,4 fect. Thc s~ond configuration assumcs that thc stoplogs could not beremoved from the dam and that the dam is essentiallya fixed crest dam.
With the removal of the stoplogs at theNest Lakc Dam, thc 1% Flood Event results in apeak water surfllcc clcvation of approximatcly1166.55 fect, or approximately 1.20 feet aboveoormallake level. Similar to the Probable Ma.\imum Rood sccnario, the initial peak in watersurface elc"ation results from II combination ofdircct prccipitation on the lakc, runoff from thelocal watersheds and inflow from LakeMonongalia via the Middle Fork Crow River.With ,he stoplogs ",moved from ,he Nest LakeDam. thc wa,er surfacc elcvation on thc lakc fallsrapidly. As water I,,'cls approach normal pool.stoplogs are added to the dam to Stop the fall inthe watcr surface elcvation. Atthc same timc,inflows start increasing from Lakc Monongalia asthat lakc is approaching the second peak in watersurface elevations. Stoplogs are again removedfrom the Nest Lake Dam to bring the water surface elevation of Nest Lake back to 1165.40 fcet.
April 2008
Approximately four hours after dam breach(0410 hours 7/7/00 simulation time), the watersurface elevations of Nest Lake will begin risingwith the arrival of the dam breach floodwave.The dam breach floodwave will result in a peakwater surface elevation of approximately 1166.50feet, slightly lower than the elevation of the firstpeak, but approximately 0.5 foot higher than thewater surface elevation without dam breach. Withthe arrival of the dam breach floodwave and risingwater surface elevations, stop logs are again removed from the dam to bring the water surfaceelevation back to 1165.40 feet. As the breachfloodwave moves through Nest Lake, the watersurface elevation of Nest Lake will drop to alower level than if the dam breach had not occured. This drop in water surface elevation is a resultof the reduced discharges from the failed NewLondon Dam.
An additional simulation for the I% FloodEvent on Nest Lake was run based on the assumption that the Nest Lake Dam stop logs could notbe removed. In this simulation, the water surfaceelevation of Nest Lake increased approximately2-112 feet as a result of direct precipitation on thelake, runoff from the local watersheds, and inflowfrom Lake Monongalia. Adding dam breach tothis scenario resulted in an additional increase inthe water surface elevation of approximately 0.80feet to I 166.88 feet. This water surface elevationis approximately two inches higher than the lowest point on the roadway over the Nest Lake dam,resulting in some flow on the roadway.
The Nest Lake Dam has sufficient capacitythat aggressive operation of the dam during the1% Flood Event will result in relatively minorchanges in water surface elevation, while a lackof operation can result in significant changes inwater surface elevation. As the Nest Lake Dam isa manually operated dam, the actual water surface elevation for the I% Flood Event would likelyfall between these two operational extremes.
Note on Figure 9 that the starting watersurface elevation on Nest Lake is near the normalwater surface elevation of 1165.40 feet. Startingat a different water surface elevation or changingthe time of the stoplog adjustments would resultin minor changes in the lake level hydrograph.
The Sunny Day Scenario is also shown ofFigure 9. In this scenario, a constant flow of 10cfs maintains the elevation of I 165.24 feet, orapproximately two inches lower than normal.With dam breach, it is assumed that minor adjustments to the stop logs could be made to maintainthe lake level. If no changes are made in the NestLake Dam, the water surface elevation wouldincrease 1.01 feet to a maximum water surfaceelevation of 1166.25 feet.
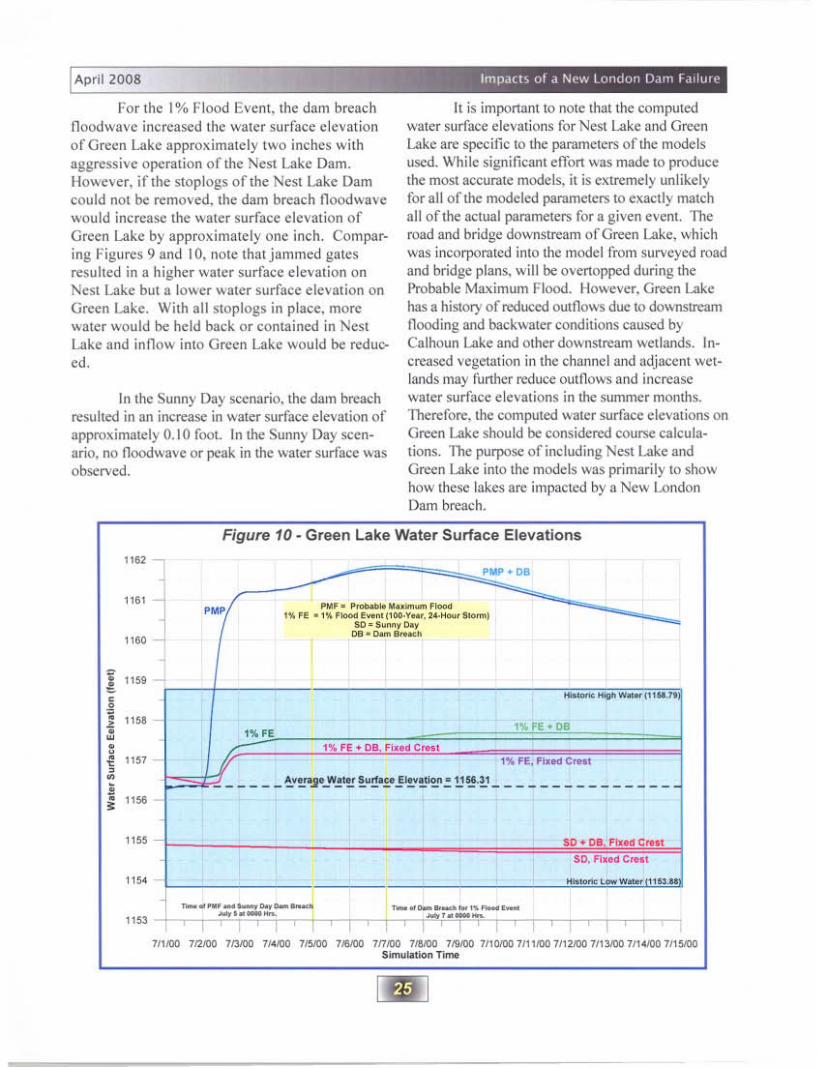
Figure 10 shows the computed water surface elevations on Green Lake for the variousscenarios. For the Probable Maximum Flood andthe 1% Flood Events, it was assumed that thewater surface elevation of Green Lake was nearthe historical average of 1156.31 feet. However,in the Sunny Day scenario, a constant inflow of10 cfs resulted in a significantly lower startingwater surface elevation as this ten cfs is significantly lower than the normal outflow from GreenLake. Also note that in the Sunny Day scenario,the water surface elevation of Green Lake slowlydeclines as the outflow exceeds ten cfs.
For the Probable Maximum Flood, thepeak water surface elevation occurred approximately six days after the start of precipitation.The maximum computed water surface elevationfor the Probable Maximum Flood was computedto be 1161.78 feet while the maximum water surface elevation of the Probable Maximum Floodwith dam breach was computed to be 1161.85 feet.The increased water surface elevation on GreenLake due to a failure of the New London Damduring the Probable Maximum Flood is approximately one inch.
April 200S • Impacts 01 a New London Dam F~,lure
For the 1% Flood Event. the dam breachfloodwave increased the watcr surface clevationof Green Lake approximately two inches ,,'ithaggressi,'e operation of the Nest Lake Dam.Ho"'cver. if the stoplogs ofthc Nest Lake Damcould not be removed. the dam breach floodwave"ould increase the water surface elevation ofGreen Lake by approximately one inch. Comparing Figures 9 and 10. nOll.' thaljatnmed gatesresuhed in a higher water surface elevation onNesl Lake bUI a lo"'er ,,'ater surface elevation onGrecn Lake. With all stoplogs in place. morewater would be held back Or contained in NestLake and inflow into Green Lake would be reduc
0'.In the Sunny Day scenario. the dam breach
resuhed in an increase in water surface elevation ofapproximately 0.10 foot. In the Sunny Day SCenario. no floodwave or peak in the water surface wasobsen'ed.
It is imponant 10 note that the computedwalCr surface elevations for Nest Lake and Gn,enLake are spe.;ific to the parameters of the modelsused. While significant elTon was made 10 producethe most accurate models. it is extremely unlikelyfor all ofthc modeled parameters to exoctly matchall of the octual parameters for a given C\'ent. 1heroad and bridge dO"llstream ofGreen Lake, whichwas incorporaled into the model from sun'eyed roadand bridge plans. will be ovenopped during theProbable Maximum Flood. However. Green Lakehas a histoey of reduced out11ows due 10 do\>.ltStreamflooding and backwater conditions caused byCalhoun L.ake and other downstream wetlands. Increased vegetation in the channel and adjacent wellands may funher n:duce out11ows and increasewater surface elevations in the summer months.Therefore. the computed water surface elevalions onGreen Lake should be considered course calculations. llle purpose ofir>l'luding Nesl Lake andGreen Lake into Ihe models was primarily 10 showhow these lakes are impacted by a Ne'" LondonDam breach.
Figure 10· Green Lake Water Surface Elevations
••a2PIlIP. De
118.PMP/
....._...._,....to; ' •• ,,, ......_I' ...y_.,..__,
Ill· ..........'". "".__.=! ".1
__"'_(11",
""! 1%FE,.,. FE • De
• '''" H '1>8 ''''od C...,,, 11S1 V' .% ,(. , ..... e...(,• ______ ~'!!o;r_W.!,!!!."!!.~.!-'!."!.~.= ~II;!.!.,_______________,; ""
1155 I-ll • 1>8. , ..... C...,
SO. FI.... C...,
"" -..--".._.._--...-- ,_ ..__..........--,,"
_..._-I '1
-, .._-, , i , i [ I ' , , i , , , , i111.0:)(1 ,~ ,~ ,- ,- ,- m~ ,- 1$Xl 1I1(l,<)O 111 •..00 ",me 1It;l.<Xl1i100<)(l1ilSoOXl
SlmlIloUon T_
Im]

April 2008
The impacts of a failure of the New London Dam are highly variable. A Sunny Day failure,or a failure during periods of low flow, will have relatively minor, if any, impacts downstream of thedam, including Nest and Green Lakes. Upstream of the dam, the failure of the dam will result inlower water surface elevations on Lake Monongalia with a potential loss or reduction in recreationalopportunities such as fishing or boating, until the dam is repaired.
A failure of the New London Dam during a major flood event is unlikely to cause flooding inany residential properties in the city of New London. However, several commercial properties downstream of the dam are at risk. A dam breach during a major flood event would increase the damage toany property being flooded, and may cause minor flooding at properties that are not being flooded.The duration that a property is experiencing flooding will be relatively short due to a dam breach asthe dam breach floodwave will rapidly flow downstream and dissipate. However, some of the lowestproperties will experience flooding of an extended duration caused by the respective flood event.
The potential exists for the loss-of-life if the New London Dam should fail. Possible causes ofa loss-of-life include driving over the dam during failure, or being washed off the dam during an overtopping event. A potential also exists for a loss-of-life downstream of the dam. However, with noresidential properties impacted by a dam breach, the potential for a loss-of-life is not probable.
The models indicate that there is a hydraulic constriction in the river channel just downstreamof the Fire Department. Increasing the conveyance of the river at this location by modifying the streamchannel and lowering the overbank would result in a lower water surface elevation at the Fire Department and other nearby properties.

April 2008
Design of Small Dams (1977) United States Government Printing Office
Hydrology Guide for Minnesota (1981) U.S. Department ofAgriculture
Safety of Dams: Flood and Earthquake Criteria (1985) National Academy Press
Technical Paper 40, National Weather Service
Figure 1 - Drainage Area of the New London Dam
Figure 2 - Map of Lake Monongalia
Figure 3 - New London Dam Lift-Gate Configuration
Figure 4 - Lake Monongalia Water Surface Elevations
Figure 5 - Inundation Map for the City of New London for the Probable Maximum Flood
Figure 6 - Profile of Water Surface Elevations downstream of the New London Dam for thethree scenarios
Figure 7 - Profile of Lake Monongalia during the Probable Maximum Flood, 1% Flood Event andthe Sunny Day Scenario
Figure 8 - Sunny Day Profile of Lake Monongalia Showing Water Surface Elevationsafter Dam Breach
Figure 9 - Computed Water Surface Elevations on Nest Lake for the Various Scenarios
Figure 10 - Computed Water Surface Elevations on Green Lake for the Various Scenarios
Figure II - Profile of Water Surface Elevations Downstream of the New London Dam for the1/3 Probable Maximum Flood
April 2008
As this report approached completion, a request was received to perform the dam breach analysiswhen the water surface elevation of Lake Monongalia reached the top of the dam. Due to time constraints, it was decided to add this analysis as an appendix rather than inserting it into the existingdocument.
The top of the New London dam is the roadway over the embankment and concrete gate structure. The lowest point on the embankment is at elevation 1206.70 feet. With the water sUiface elevationat the top of the dam/roadway (1206.70 feet), and both gates fully open, the discharge was computed tobe approximately 1650 cfs, which is approximately 1/3 Probable Maximum Flood.
For the 1/3 Probable Maximum Flood, the height of the dam breach was determined to be 11.7feet, extending from the base of the concrete gate structure at the approximate elevation of 1194.00 feet,to the top of the dam at elevation 1206.70. The average breach width was computed to be 40.95 feet,which is 3.5 time the height of the breach. However, in this scenario, breach times of I-minute,15-minutes and 30-minutes was used to compute the water surface elevations so as to allow a comparison of the computed water surface elevations for the different breach times.
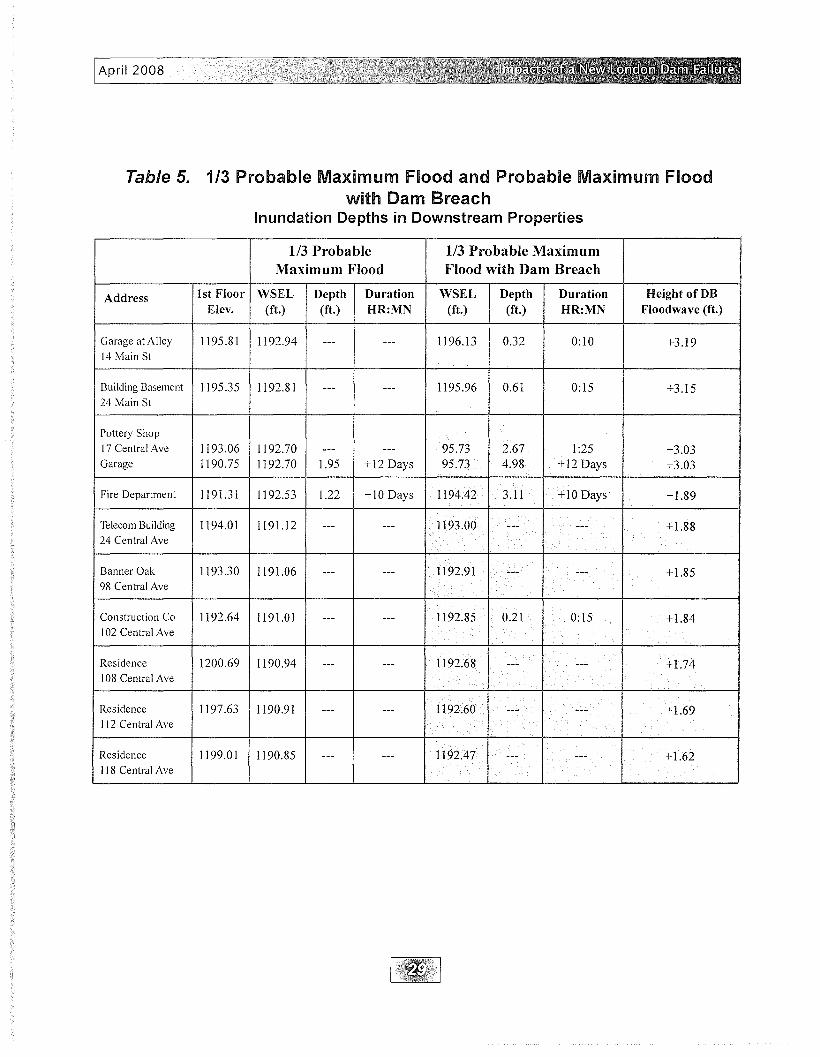
Table 5 shows the computed water surface elevations for the 1/3 Probable Maximum Flood andthe 1/3 Probable Maximum Flood with Dam Breach. Only two properties, the Pottery Shop garage andthe Fire Department will experience minor flooding due to the 1/3 Probable Maximum Flood. WithDam breach, minor flooding can be expected in the Pottery Shop, the Pottery Shop garage, the FireDepartment and at the construction company. After dam breach, the dam breach floodwave will quicklypass through the area downstream of the dam. However, flooding in several properties will continue foran extended period of time due to the low elevation of those properties and the large volume of waterassociated with the 1/3 PMF.
Figure 11 shows computed water surface elevations of the Middle Fork Crow River extendingfrom approximately 200 feet upstream of the New London Dam to approximately 2000 feet downstream. The downstream limit of the profile is near the west corporate limit of the city of New London.The computed water surface elevations include the 1/3 Probable Maximum Flood, and the 1/3 ProbableMaximum Flood with dam breach. The 1st floor elevation of several properties and the approximatedownstream distance from the dam are also shown on Figure 11. An important feature to note on Figure11 (and Figure 6) is the rapid change in water surface elevation between 700 and 1000 feet downstreamof the dam. This indicates that there is a constriction or hydraulic control in the channel at this location.This is also near the point where the Middle Fork Crow River makes a 90 degree turn to the west. Reducing the size of this constriction, including lowering the overbanks, would be an inexpensive methodto reduce water levels in the vicinity of the Pottery shop and Fire Department during high stage events.
The three breach times did not result in significantly different water surface elevations. The difference in water surface elevation from a I-minute breach time to a 30-minute breach time was approximately 0.50 feet at the dam and approximately 0.1 feet 2000 feet downstream of the dam. The watersurface elevations for the three breach times is shown on Figure 11. A breach time of several hourswould result in water surface elevations only slightly greater than that of the 1/3 Probable MaximumFlood.
April 2008
Table 5. 1/3 Probable Maximum Flood and Probable Maximum Floodwith Dam Breach
Inundation Depths in Downstream Properties
1/3 Probable 1/3 Probable MaximumMaximum Flood Flood with Dam Breach
Address 1st Floor WSEL Depth Duration WSEL Depth Duration Height of DBElev. (ft.) (ft.) HR:MN (ft.) (ft.) HR:MN Floodwave (ft.)
Garage at Alley 1195.81 1192.94 --- --- 1196.13 0.32 0:10 +3.1914 Main St
Building Basement 1195.35 1192.81 --- --- 1195.96 0.61 0:15 +3.1524 Main St
Pottery Shop
17 Central Ave 1193.06 1192.70 --- --- 95.73 2.67 1:25 +3.03Garage 1190.75 1192.70 1.95 +12 Days 95.73 4.98 +12 Days +3.03
Fire Department 1191.31 1192.53 1.22 +10 Days 1194.42 3.11 +10 Days +1.89
Telecom Building 1194.01 1191.12 --- --- +1.8824 Central Ave
Banner Oak 1193.30 1191.06 --- --- 1192.91 --- --- +1.8598 Central Ave
Construction Co 1192.64 1191.01 --- --- 1192.85 0.21 0:15 +1.84102 Central Ave
Residence 1200.69 1190.94 --- --- 192.68 --- +1.74108 Central Ave
Residence 1197.63 1190.91 --- --- 1192.60 +1.69112 Central Ave
Residence 1199.01 1190.85 --- --- 1192.47 --- +1.62118 Central Ave

Figure 11 - One-Third Probable Maximum Flood (1650 cfs)with Dam Breach Flood Wave
April 2008
New London Dam
200 400 600 800 1000 1200 1400 1600Distance Downstream from the New London Dam (feet)
1207
1206
1205
1204
1203
1202
1201
.-=- 1200CllCllu.
1199s::0
:;:; 1198CI:l>Cll
1197ijj
1196
1195
1194
1193
1192
1191
1190
-200 0
'""":::cUJ
'"""'""tl'iii
'"<>::
'"""'""tl'iii&!
Cl>U
"Cl>"tl'iiiCl>
<>::
1800 2000


![Y] -rn lro 020:r54 JUL - leg.mn.gov](https://static.fdocuments.net/doc/165x107/625077c51dbca8451a56b3a3/y-rn-lro-020r54-jul-legmngov.jpg)