Mpbep 2010 02 prsnttn someeconomicsofarmillariaindouglasfirinbcwagner
52
1 Plant Health Risk Assessment
-
Upload
fri-research -
Category
Documents
-
view
213 -
download
0
description
https://foothillsri.ca/sites/default/files/null/MPBEP_2010_02_Prsnttn_SomeEconomicsofArmillariainDouglasFirinBCWagner.pdf
Transcript of Mpbep 2010 02 prsnttn someeconomicsofarmillariaindouglasfirinbcwagner
1
Plant Health Risk Assessment

2
Risk
• Two components– incidence or likelihood (probability of an event
e.g. introduction) – Impact of event (consequences)

3
Economic
Environmental/ biological
Social
Two examples:
1) Risk of introduced pest –CFIA (Doreen Watler)
2) Risk of disease for endemic species (Armillaria example-Mike Cruickshank-disease risk Bill Wagner- economic risk)

4
PRA PROCESS• “Pest Risk Analysis”
• International Aspects to PRA-• FAO-IPPC; ISPMs (#2, #11,#21); definitions (e.g., “QP”)
– https://www.ippc.int/IPP/En/default.jsp• GATT; NAFTA – endorse similar principles and promote following
international PRA guidelines • Provide some scientific basis
Impact
Likelihood
Hazard Identification
Risk Assessment
Monitor Results
Implement Option
Choose Option
Develop/Analyse Options
Risk Management
Notify
Negotiate
Consult
Risk Communication
3 stages

5
Likelihood of introduction
–– Prevalence in Area of OriginPrevalence in Area of Origin
–– Potential ManPotential Man--Made PathwaysMade Pathways
–– Likelihood of Pest Being Associated with Likelihood of Pest Being Associated with Pathway at OriginPathway at Origin
–– Survival in TransitSurvival in Transit
–– Ease of DetectionEase of Detection
6
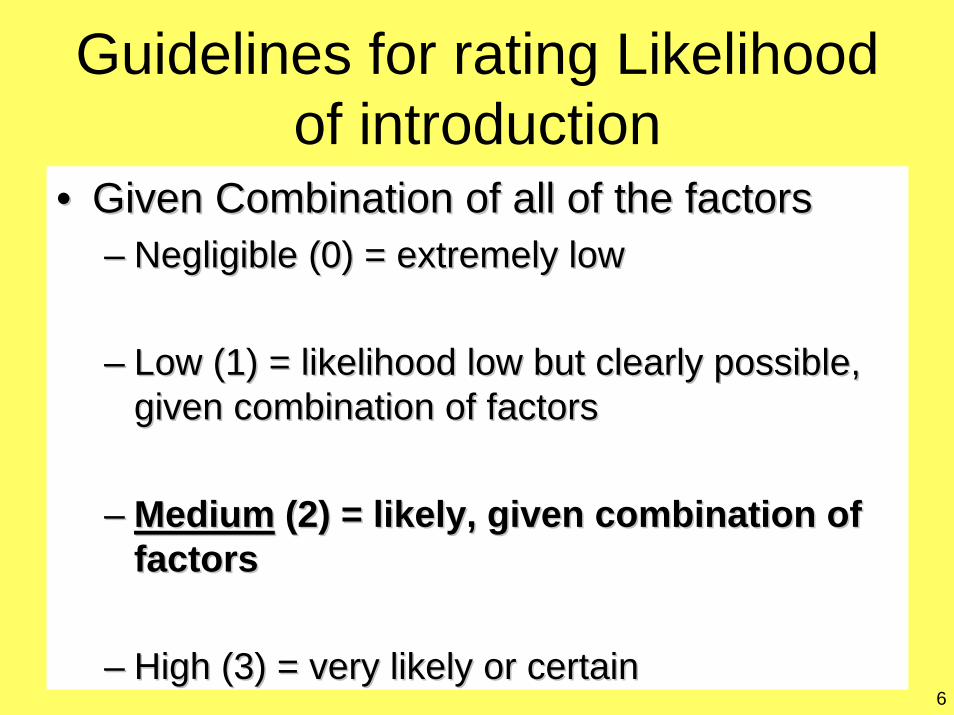
Guidelines for rating Likelihood of introduction
•• Given Combination of all of the factorsGiven Combination of all of the factors–– Negligible (0) = extremely lowNegligible (0) = extremely low
–– Low (1) = likelihood low but clearly possible, Low (1) = likelihood low but clearly possible, given combination of factorsgiven combination of factors
–– MediumMedium (2) = likely, given combination of (2) = likely, given combination of factorsfactors
–– High (3) = very likely or certainHigh (3) = very likely or certain
7
Consequences of introduction(Impact)
• Establishment potential
• Natural spread potential
• Potential economic impact
• Potential environmental importance

8
Guidelines for Rating Potential Environmental Impact
•• Negligible (0) = no potential to degrade environment or Negligible (0) = no potential to degrade environment or alter ecosystem e.g. Cherry rasp virusalter ecosystem e.g. Cherry rasp virus
•• Low (1) = limited potential impact on environment, slight Low (1) = limited potential impact on environment, slight impact on host, some aesthetic or recreational effects impact on host, some aesthetic or recreational effects e.g. winter mothe.g. winter moth
•• Medium (2) = moderate impact, obvious change in Medium (2) = moderate impact, obvious change in ecological balance e.g. oak wiltecological balance e.g. oak wilt
•• High (3) = major damage to environment, significant High (3) = major damage to environment, significant losses to ecosystems e.g. Chestnut blight, nun mothlosses to ecosystems e.g. Chestnut blight, nun moth

9
CUMULATIVE SCORES
Establishment Potential + Natural SpreadPotential + Economic Impact +
Environmental Impact
RATING FORCONSEQUENCES OF
INTRODUCTION
NUMERICALSCORE FORCONSEQUENCES OF
INTRODUCTION
0 - 2 NEGLIGIBLE 0
3 - 6 LOW 1
7 - 10 MEDIUM 2
11 - 12 HIGH 3
Guidelines for Rating Consequences of introduction

10
Guidelines for Overall Risk Rating
•• Multiply together the scores for likelihood of introduction Multiply together the scores for likelihood of introduction and the overall rating for consequences of introductionand the overall rating for consequences of introduction
•• Overall risk rating is assigned as followed:Overall risk rating is assigned as followed:–– Negligible = 0Negligible = 0–– Low = 1Low = 1--33–– Medium = 4Medium = 4--66–– High = 9High = 9
Uncertainty: conflicting, incorrect or missing information- difficult to assess some components under new conditions
11
A forestry example of endemic disease– Armillaria ostoyae
• Sampled directly with an ecosystem for incidence and severity- not done with categorical scale
• Economic analysis based on biological risk- Bill Wagner

12
Risk assessment
Risk-biological,economic
Incidence(probability)
Impacts(consequences)
damage function
Crop quality and quantity
Host resistanceStump removal
Risk mitigation
Note: Needs to be done in space and time

13
What we know before starting risk assessment • Poor data at tree level, no data at stand or landscape level-
difficult to determine over time.
• Infects most trees, many shrubs and herbs
• This disease is widely distributed in Canada and worldwide
• One risk component (incidence) is high (good data in BC and Ontario both show near 100% infection by age 100) therefore worth looking at impacts
• We looked at best and worst stands to get the range of impacts not average (average too expensive)
• Took existing data and built Armillaria OAFs for TIPSY, then built TASS/ROTSIM simulator and compared.
14
Armillaria Biology summary• Fungus- basidiomycetes• Over 30 species worldwide • Armillaria ostoyae – Canada and northern
hemisphere• Spreads slowly between roots underground-
rarely by spores• Infection not easily seen above ground• Infects all tree species• Colonizes stumps quickly- builds up inoculum• Stumps the principle problem especially in
partial cuts (see Canadian Silviculture Magazine Vol. 5 no.1 1997).

15
Distribution mappingArmillaria ostoyae in Canada –(circumpolar) but 30 species cover globe
Host range- all trees, some herbs and shrubs (eats stumps)

16
Disease related to lumber quality
Healthy Diseased Log None Knots Shake Split Wane Warp Healthy
total None Knots Shake Split Wane Warp Diseased total
1 7 3 3 1 14 1 2 1 1 5 10 2 1 6 1 1 2 11 2 3 4 9 3 6 1 3 10 2 1 1 2 6 4 3 1 2 6 2 2 4 5 1 1 1 3 2 1 3 6 1 1 1 3 1 1
Total 8 19 6 1 3 10 47 7 9 1 1 1 14 33 Proportion 0.17 0.40 0.13 0.02 0.06 0.21 1 0.21 0.27 0.03 0.03 0.03 0.42 1
Diseased trees have:More warpFewer boards in trees of similar size

17
200
250
300
350
400
450
500
0 5 10 15 20 25 30 35
Tree age (yrs)
Fibe
r coa
rsen
ess
infectedhealthy
Disease risk on fiber properties
Disease probably increases fiber coarseness and variability
Disease does reduce cell division and possibly increases lignin and extractives

18
• Damage functions (tree level)– Annual increment reduction=f (years since first
infection)– Mortality=f (percent girdled root collar)=>75%
girdling= deadIncidence (tree level)– Incidence = number of infected plants/total
number of plants– Mortality and growth loss related to incidence of
infection to determine risk
Damage functions and incidence used in disease simulator

19
RiskRisk (stand level) =f [(mortality + growth loss + quality loss) x
(incidence x time)]
Damage function and incidence are measured at the tree level
Two damage functions together with incidence give stand level risk at a given time

20
10 plantations
1000 trees/site
21
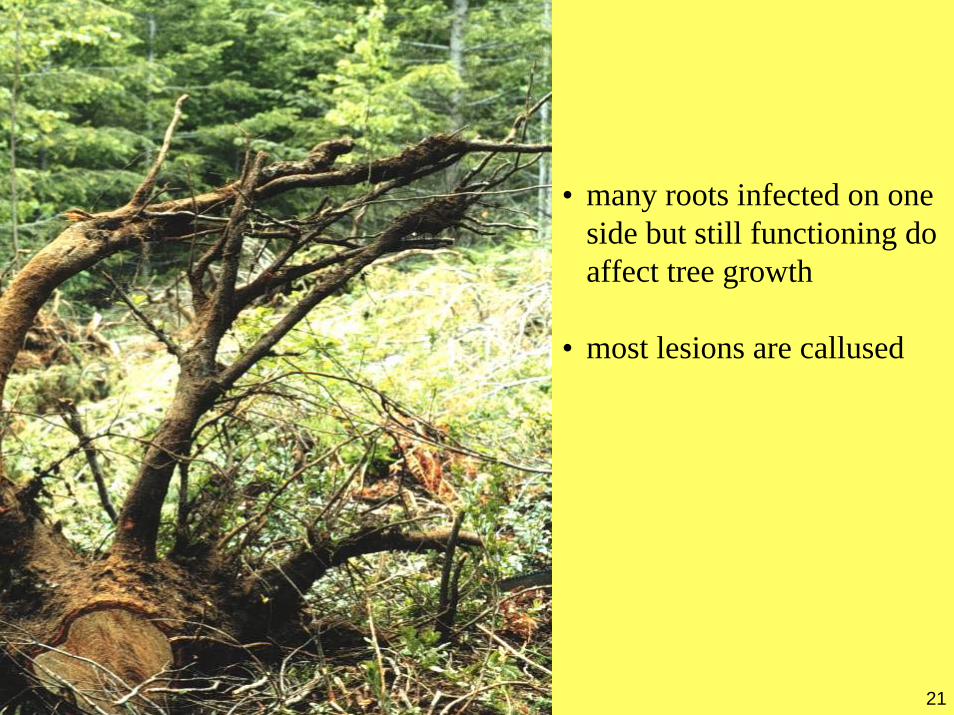
• many roots infected on one side but still functioning do affect tree growth
• most lesions are callused

22
Risk of non-lethal yield reduction-growth reduction
Disease interferes with genetic potential of stands
55 years naturally regenerated site
Planted stands
Reduction mainly related to number of infected trees

23
Number of diseased trees at age 20
24
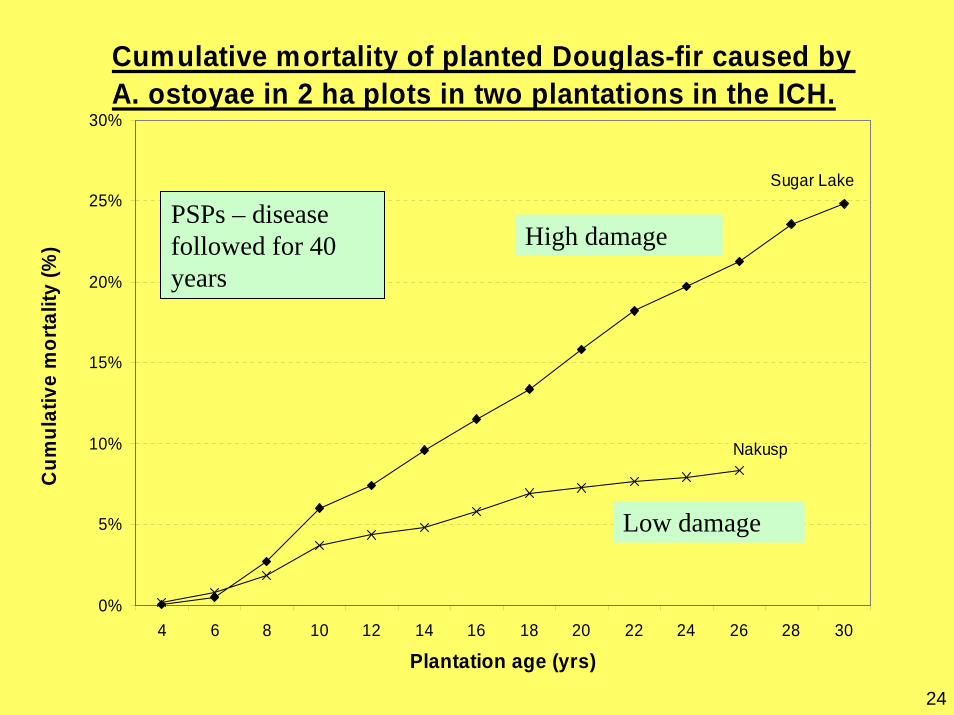
Cumulative mortality of planted Douglas-fir caused by A. ostoyae in 2 ha plots in two plantations in the ICH.
0%
5%
10%
15%
20%
25%
30%
4 6 8 10 12 14 16 18 20 22 24 26 28 30
Plantation age (yrs)
Cum
ulat
ive
mor
talit
y (%
)
Sugar Lake
Nakusp
PSPs – disease followed for 40 years
High damage
Low damage

25
Disease modeling - risk
• Partnered with BC ministry of forests research branch- for stem growth and yield –TASS/ROTSIM and TIPSY (Goudie, Mitchell, Cameron)
• Updated an existing CFS Phellinus root disease model (ROTSIM) to handle Armillaria- empirical data from large scale sampling - Ramsoft systems (MacDonald)

26
ROTSIM (CFS, roots)TASS (MoFR, stems)
Stems/volume over time
BUCK – bucking simulator (private)
Logs, grades, value over time
SAWSIM (private)
Sawmill simulator
Lumber sizes, grades, value
Disease risk on existing value chain
Sylver suite of models

27
Incidence of infection, cumluative mortality and periodic mortality 1600 st/ha medium inoculum
0.00
10.00
20.00
30.00
40.00
50.00
60.00
70.00
80.00
90.00
100.00
0 25 50 75 100 125 150age
perc
ent
incidence cum. mortalityperiodic mort
Armillaria on Douglas-fir in the ICH ecosystem
Site index 25
Damage function relates incidence to impacts (radial and height reduction plus mortality)
TASS/ROTSIM

28
Armillaria on Douglas-fir at 1600 st/ ha SI=25
0
200
400
600
800
1000
1200
5 15 25 35 45 55 65 75 85 95
105 115 125 135 145
Stand age (yrs)
Mer
chan
tabl
e vo
lum
e (m
3 /ha)
high inoculumno diseaselow inoculummedium inoculum
Model integrates incidence and impacts for D.F. plantations in ICH.
Risk @ 100years = at least 242 m3/ha but as high as 490 m3/ha
TASS/ROTSIM output
uncertainty
Risk increases with timeUncertainty increases then decreases with time
29
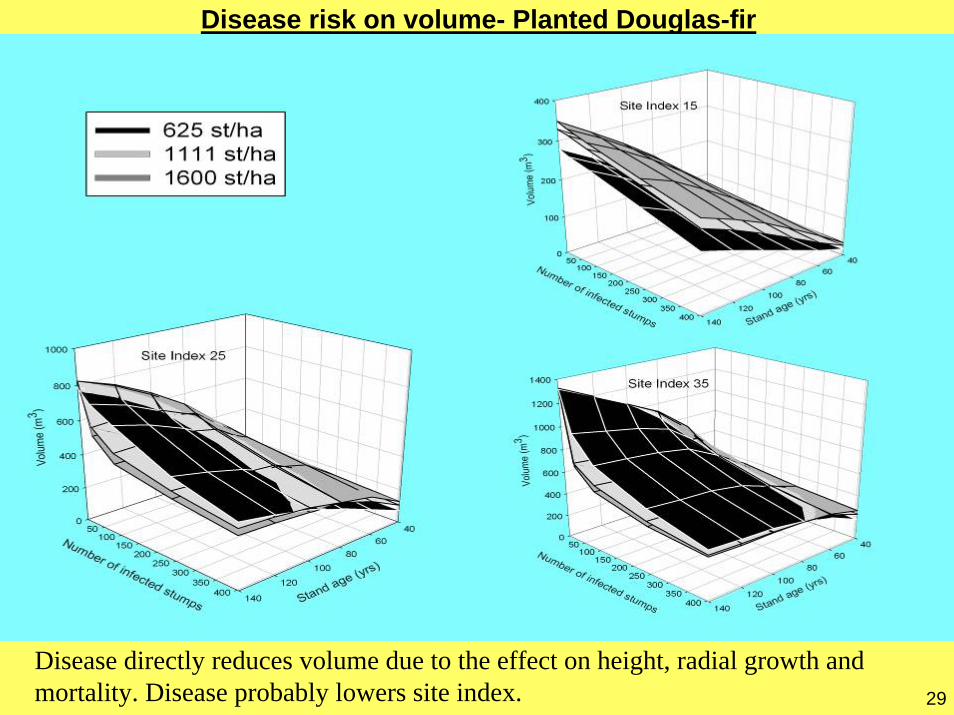
Disease risk on volume- Planted Douglas-fir
Disease directly reduces volume due to the effect on height, radial growth and mortality. Disease probably lowers site index.

30
Disease effect on lumber

31
500,000
550,000
600,000
650,000
700,000
750,000
0 50 100 150 200 250 300
Years from now
Annu
al H
arve
st (m
3 )
BaseLowDMedDHighD
• Impact for med severity = 7.5%
• Impacts would increase as more stands converted to Douglas-fir
Armillaria impacts on TSR for Arrow TSA-TISPYOnly for Douglas-fir plantations not natural stands- also seven other species are also impacted but not quantified.
(Ref=2003)

32
Risk Mitigation
• Host resistance Partnership with province of BC- Barry Jaquish - Kalamalka
• Sanitation- stump removal- long term trials - 45 years old

33
Implications
• Disease interferes with reaching site potential- can have a lasting effect on site productivity– Mostly ignored because it acts slowly
• Climate change- warmer/drier climate = more disease plus disease worst when wetter climates become drier.
• forest management, forest economics, timber supply
• We can alter disease impacts by reducing or coping with disease
• We can balance forest activities with ecosystem productivity andstand stability
• Main problem stumps especially partial cuts, climate change (increasing frequency of dry periods)

34
Some Economics of Some Economics of ArmillariaArmillaria in in Douglas Fir in BCDouglas Fir in BC–– Using Science to Using Science to
Reduce RiskReduce Risk
William L. Wagner, PhD, RPFFebruary 24, 2010

35
Economic Assessment of Armillaria in Douglas Fir
An excellent way to examine environmental and economic unknowns is under the concepts
of uncertainty and risk.
The two are closely associated with one another, but are not identical. Uncertainty
may involve things that are completely unknown, whereas risks are often understood
via calculable probabilities.

36
Economic Risk – no shortage of definitions
Society For Risk Analysis (sra.org):
Estimation of risk is usually based on the expected value of the conditional probability of the event occurring times the consequence of the event given that it has occurred.
Duerr et al (1979) – the terms risk and uncertainty are used interchangeably.Kangas & Kangas (2004) – under risk and uncertainty, the state of nature is not known with certainty.Leuschner (1984) – Risk exists if a probability distribution can be attached to different states of nature.Price (1989) – knowledge of the probability of each state of nature.Worrell (1959) – is the outcome whose probability of occurrence can be established in a quantitative manner.

37
Uncertainty and Risk in Valuing Uncertainty and Risk in Valuing Douglas Fir Plantations in the Interior Douglas Fir Plantations in the Interior
Cedar Hemlock ZoneCedar Hemlock Zone
Forestry is dynamic and inherently uncertain:
Numerous potential futures – environmental uncertainty!
Innovation alters the possible products
Markets are difficult, if not impossible, to predict
Hoogstra and Schanz (2008) researching professionals, found that there is not a high level of perception of uncertainty in forestry. Indeed, the future is the most certain time period to many forest decision-makers.

38
Uncertainty and Risk - continued
Price (1989) suggested that the range of uncontrollable and unpredictable factors
operating over the long-term forest rotation periods may be so horrifying that foresters
ignore these uncertainties altogether.
Hoogstra, M.A. and Schanz, H. 2008. “How (Un)Certain is the Future in Forestry?” For. Sc.54(3) 316-327
Price,. 1989. Theory and application of forest economics. Blackwell, Oxford, UK 402p

39
Uncertainty and Risk - continued
Guess where that tactic leads?

40
Uncertainty and Risk - continued
Mike and other researchers here at PFC along with support from the Ministry of Forests have started to put numbers together to develop a
model for Armillaria in the Interior Cedar Hemlock Zone. With these numbers, Mike and MoF are developing strategies to deal with the
disease – stumping and species mixes.
Other Alternatives (not studied):
Fallow - 15 -20 years
Pure Hardwood Rotation – 20 year birch rotation
41
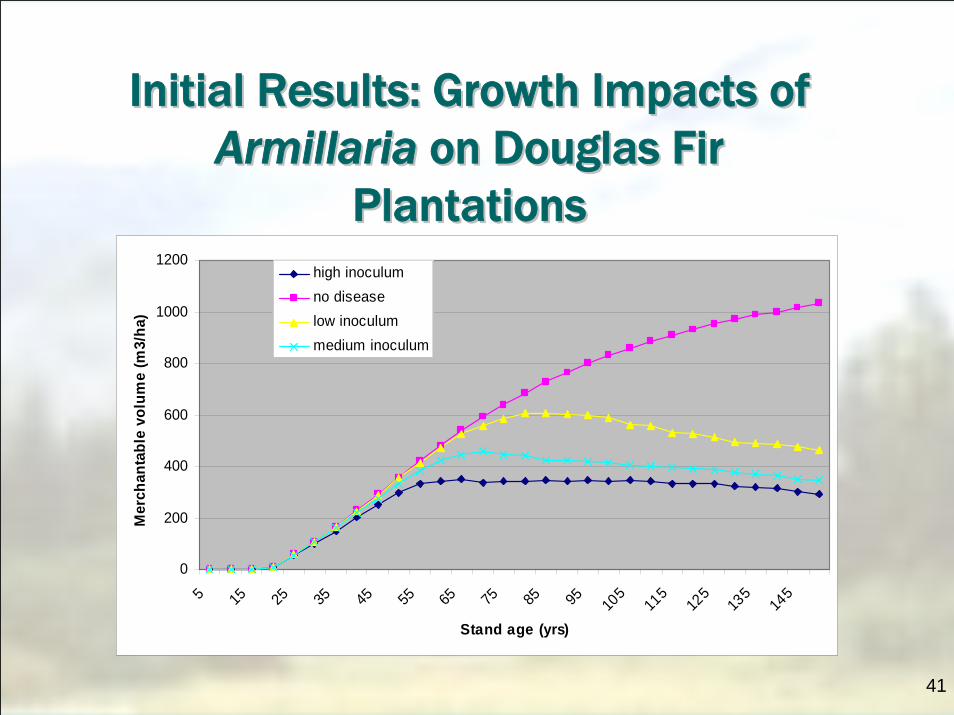
Initial Results: Growth Impacts of Initial Results: Growth Impacts of ArmillariaArmillaria on Douglas Fir on Douglas Fir
PlantationsPlantations
0
200
400
600
800
1000
1200
5 15 25 35 45 55 65 75 85 95 105
115
125
135
145
Stand age (yrs)
Mer
chan
tabl
e vo
lum
e (m
3/ha
)
high inoculumno diseaselow inoculummedium inoculum

42
Armillaria Impacts on Douglas Fir Plantations - assumptions
• Although we now know that the disease impacts wood quality, potential products distribution and value, we assume there is no impact.
• All Douglas Fir plantations are infected with Armillariain the ICH.
• Disease does not affect logging costs through smaller piece size and lower volumes per hectare.
• All disease impacts are in the medium range. High and low impacts are considered as medium in impact.
• All Planted DF are assumed to be using a site index of 25 m at 50 years
• Stumping causes no site quality affect.

43
Economic Impacts of Armillaria on Douglas Fir Plantations
Douglas fir is a very susceptible species and the most valuable.
Huge investment in plantations.
High incidence of infection - disease increases with age and size of tree in the stand.

44
Initial Valuation of Douglas Fir Plantations in the Interior Cedar
Hemlock ZoneSome Numbers - 3% discount rate
Total DF Plantations in ICH: 98361 ha
Average Stocking: 1600 stems/Ha
Average rotation: 100 years
Average Establishment cost: $1,356/Ha
2007 value of Planting cost (3%): $196,711,400
Average 2007 value of Douglas Fir: $74.01/m3
Volume loss at 100 years: High 59%; Medium 50%; Low 29%
45
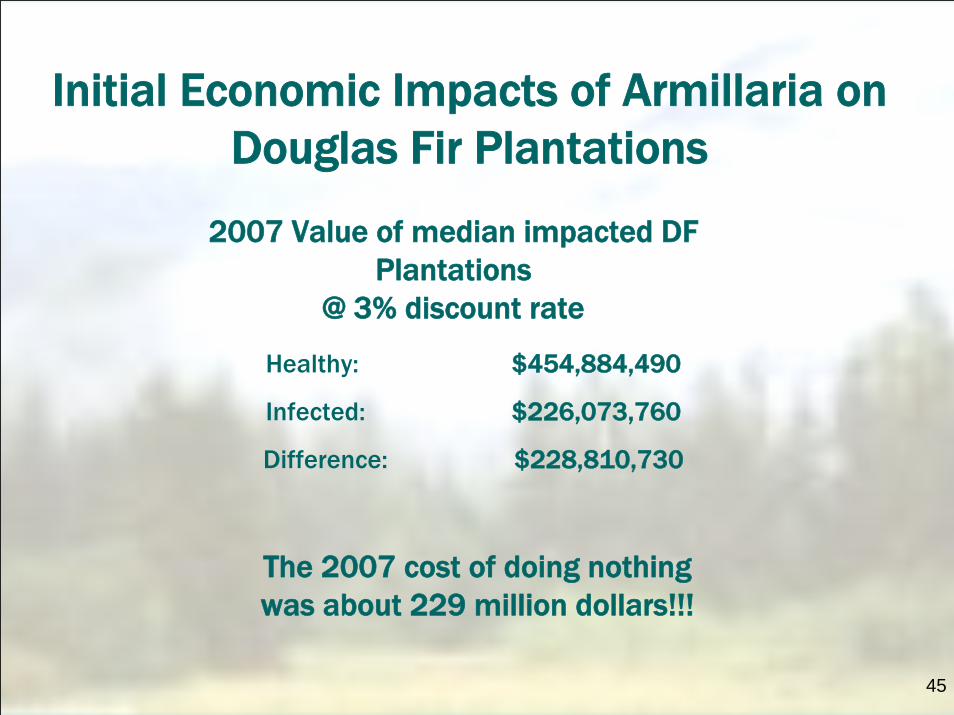
Initial Economic Impacts of Armillaria on Douglas Fir Plantations
2007 Value of median impacted DF Plantations
@ 3% discount rate
Healthy: $454,884,490
Infected: $226,073,760
Difference: $228,810,730
The 2007 cost of doing nothing was about 229 million dollars!!!

46
Economic Threshold of Treatment - Stumping
Economic threshold is the population density at which management intervention should be taken to prevent the disease from reaching the economic injury level.
The economic injury level is the break-even point of population density and the cost to control the disease are equal to the amount of damage it inflicts (actual or potential).
47
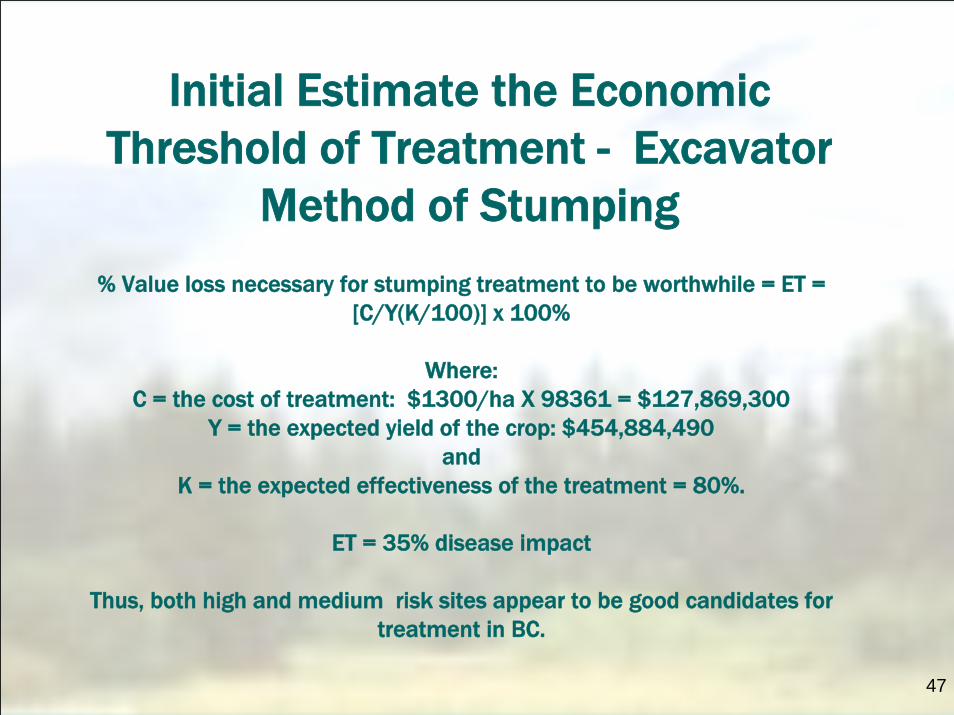
Initial Estimate the Economic Threshold of Treatment - Excavator
Method of Stumping
% Value loss necessary for stumping treatment to be worthwhile = ET = [C/Y(K/100)] x 100%
Where: C = the cost of treatment: $1300/ha X 98361 = $127,869,300
Y = the expected yield of the crop: $454,884,490and
K = the expected effectiveness of the treatment = 80%.
ET = 35% disease impact
Thus, both high and medium risk sites appear to be good candidates for treatment in BC.

48
Types of Stumping
Pop-up – modified feller buncher- 1 entry
Push-over-1 entry
Excavator- 2 entries, most expensive

49
Some Notes on Discounting –Discount Rate (i)
The higher the risk the higher the discount rate.
Risk analysis based on science show:
•Root disease increases risk
•Root disease increases the discount rate
•Risk can reduced by minimizing disease

50
Some Notes on Discounting -Interest Rate (i)

51
New Research Results: Expected Cost of the Disease on Log Production
Impact at age 60

52
Economic Impacts of Armillaria on Douglas Fir Plantations
Conclusions•Armillaria is a serious problem in SE BC but Canada as a whole
•Costs progress through time
•It is economic to manage the disease (stumping) Other treatment options have lower or no cost.
•The next step in research: wood characteristics and value.