
Moving Your Community from Surviving to Thriving Barry Bluestone Director, The Dukakis Center...
41
Moving Your Community from Surviving to Thriving Barry Bluestone Director, The Dukakis Center Northeastern University National League of Cities Leadership Training Institute February 6, 2011 Savannah, GA
-
Upload
jack-davidson -
Category
Documents
-
view
214 -
download
0
Transcript of Moving Your Community from Surviving to Thriving Barry Bluestone Director, The Dukakis Center...

Moving Your Community from Surviving to Thriving
Barry BluestoneDirector, The Dukakis Center
Northeastern University
National League of CitiesLeadership Training Institute
February 6, 2011Savannah, GA
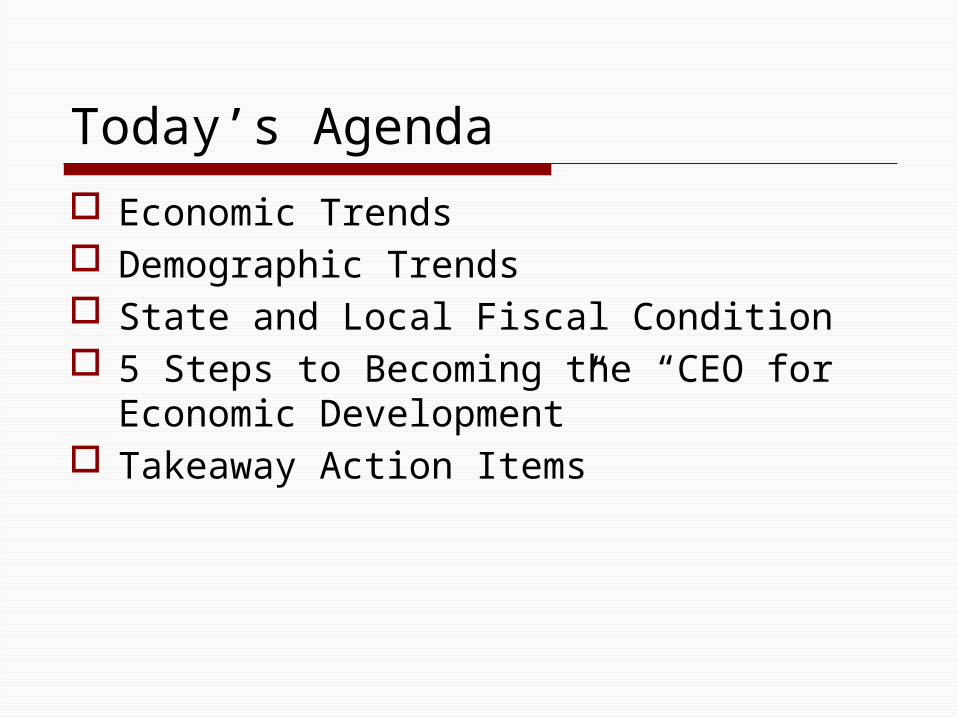
Today’s Agenda
Economic Trends Demographic Trends State and Local Fiscal Condition 5 Steps to Becoming the “CEO for
Economic Development” Takeaway Action Items

NATIONAL ECONOMIC CONDITIONS
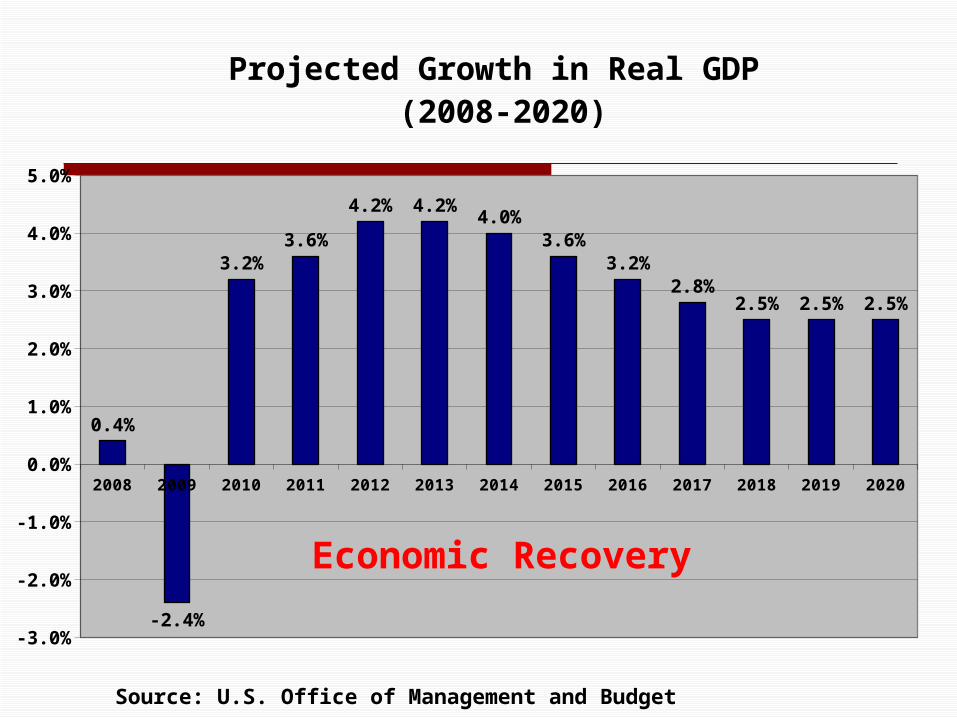
2008 2009 2010 2011 2012 2013 2014 2015 2016 2017 2018 2019 2020
-3.0%
-2.0%
-1.0%
0.0%
1.0%
2.0%
3.0%
4.0%
5.0%
0.4%
-2.4%
3.2%3.6%
4.2% 4.2%4.0%
3.6%3.2%
2.8%2.5% 2.5% 2.5%
Projected Growth in Real GDP (2008-2020)
Source: U.S. Office of Management and Budget
Economic Recovery
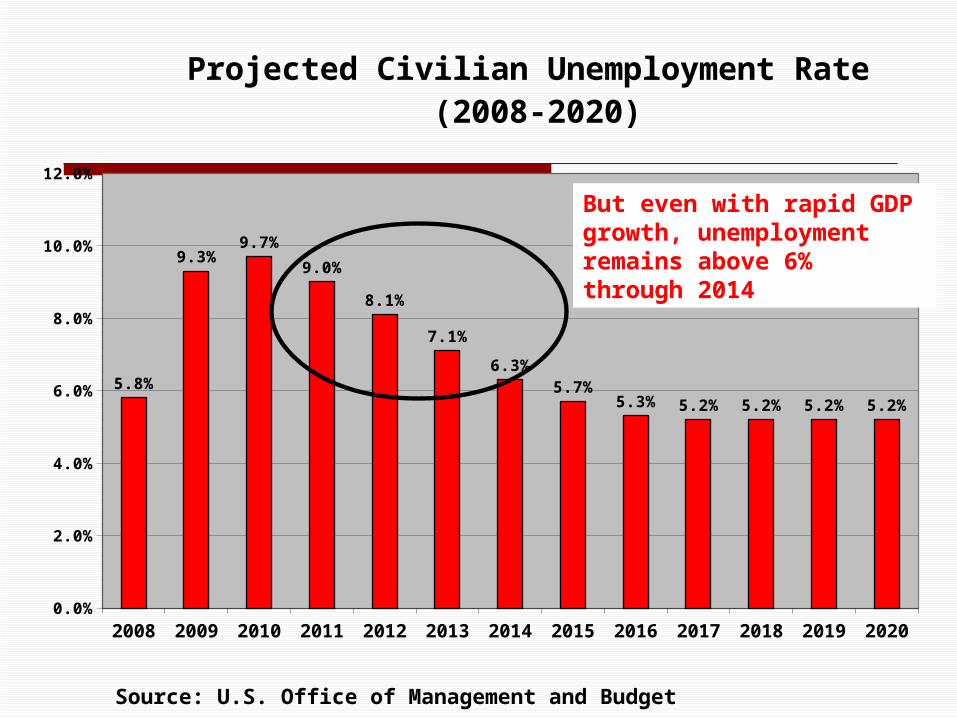
2008 2009 2010 2011 2012 2013 2014 2015 2016 2017 2018 2019 20200.0%
2.0%
4.0%
6.0%
8.0%
10.0%
12.0%
5.8%
9.3%9.7%
9.0%
8.1%
7.1%
6.3%5.7%
5.3% 5.2% 5.2% 5.2% 5.2%
Projected Civilian Unemployment Rate (2008-2020)
Source: U.S. Office of Management and Budget
But even with rapid GDP growth, unemployment remains above 6% through 2014
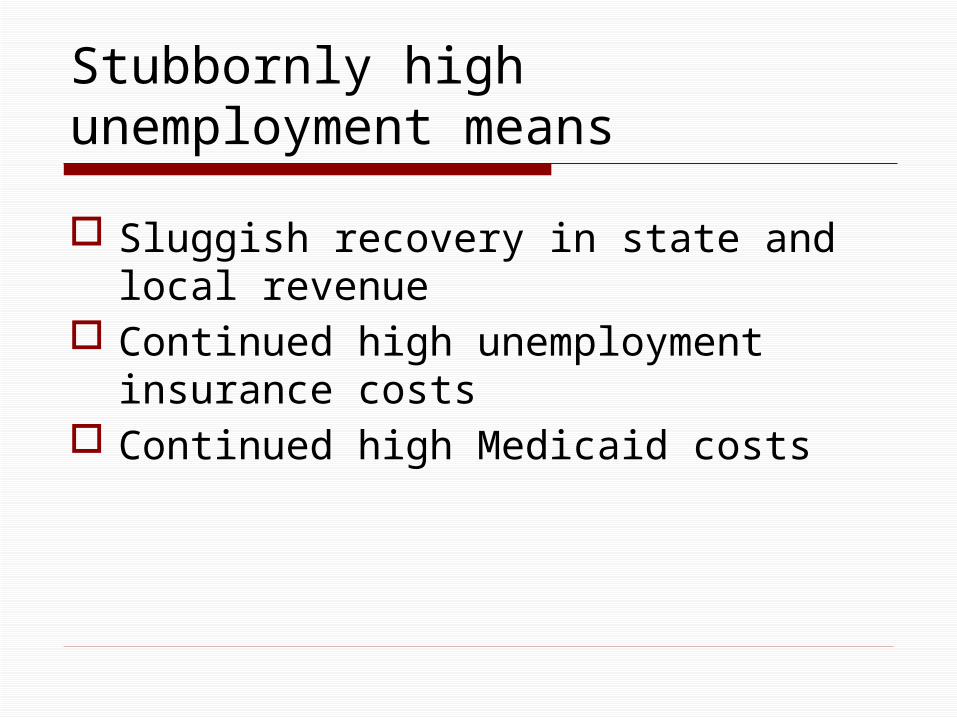
Stubbornly high unemployment means
Sluggish recovery in state and local revenue
Continued high unemployment insurance costs
Continued high Medicaid costs

DEMOGRAPHIC TRENDS
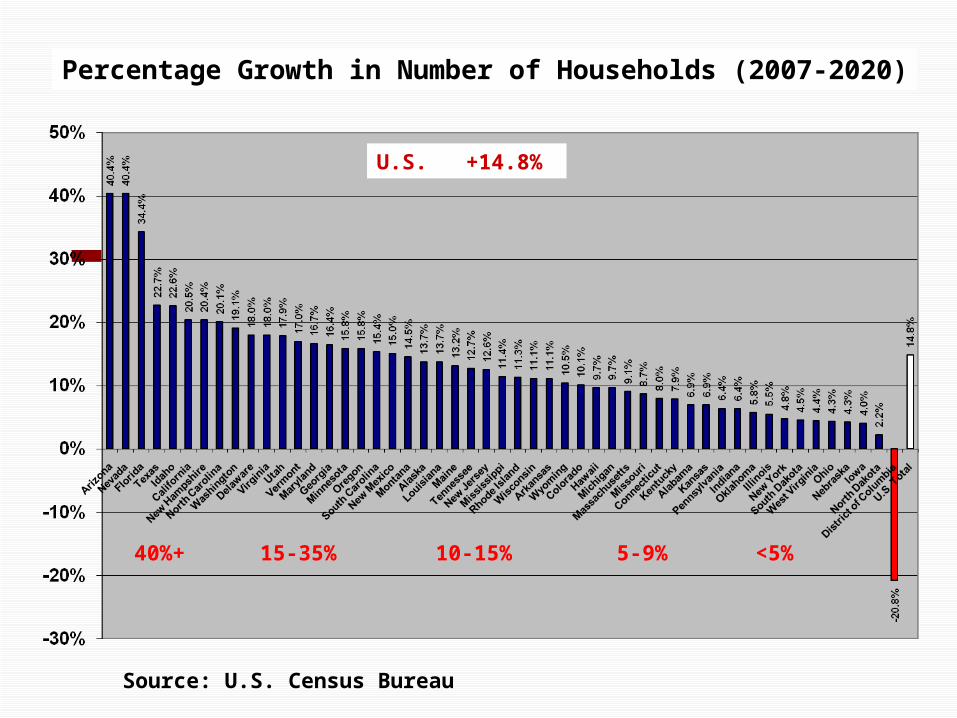
U.S. +14.8%
Source: U.S. Census Bureau
Percentage Growth in Number of Households (2007-2020)
40%+ 15-35% 10-15% 5-9% <5%
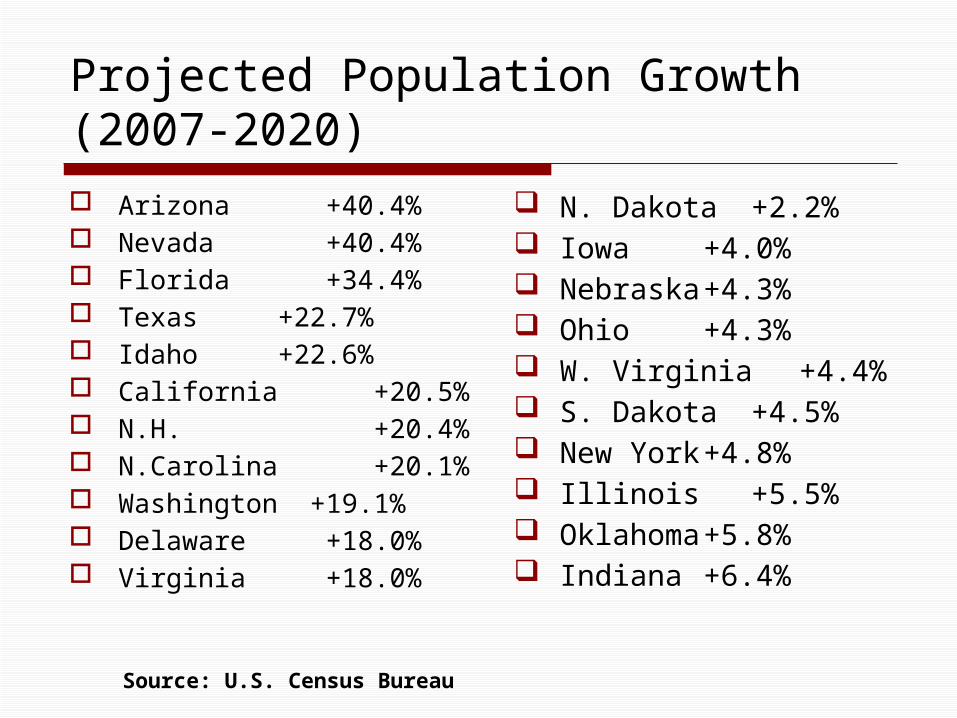
Projected Population Growth (2007-2020) Arizona +40.4% Nevada +40.4% Florida +34.4% Texas +22.7% Idaho +22.6% California +20.5% N.H. +20.4% N.Carolina +20.1% Washington +19.1% Delaware +18.0% Virginia +18.0%
N. Dakota +2.2% Iowa +4.0% Nebraska +4.3% Ohio +4.3% W. Virginia +4.4% S. Dakota +4.5% New York +4.8% Illinois +5.5% Oklahoma +5.8% Indiana +6.4%
Source: U.S. Census Bureau

Source: U.S. Census Bureau

-800,000
4,300,000
-900,000 -1,700,000
8,500,000
9,600,000
2,700,000
-4
-2
0
2
4
6
8
10
12
18-24 25-34 35-44 45-54 55-64 65-74 75+
Change in Adult U.S. Population by Age Cohort 2008-2018 (in millions)
Age 18-54: + 900,000Age 55+: + 20,800,000
Source: U.S. Census Bureau
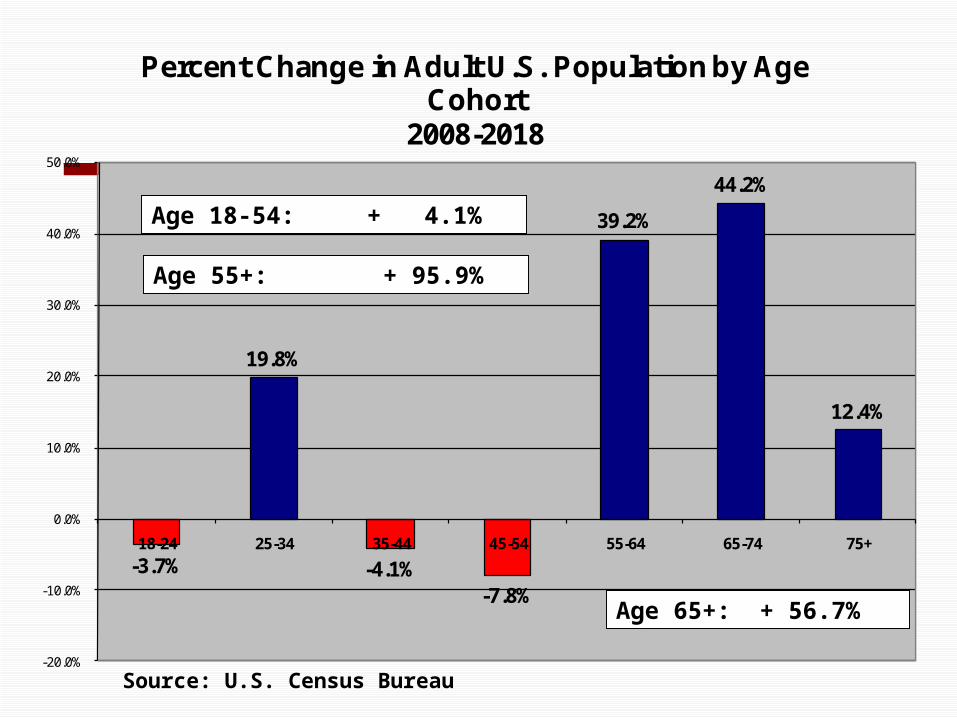
-3.7%
19.8%
-4.1%-7.8%
39.2%
44.2%
12.4%
-20.0%
-10.0%
0.0%
10.0%
20.0%
30.0%
40.0%
50.0%
18-24 25-34 35-44 45-54 55-64 65-74 75+
Percent Change in Adult U.S. Population by Age Cohort
2008-2018
Age 18-54: + 4.1%
Source: U.S. Census Bureau
Age 65+: + 56.7%
Age 55+: + 95.9%
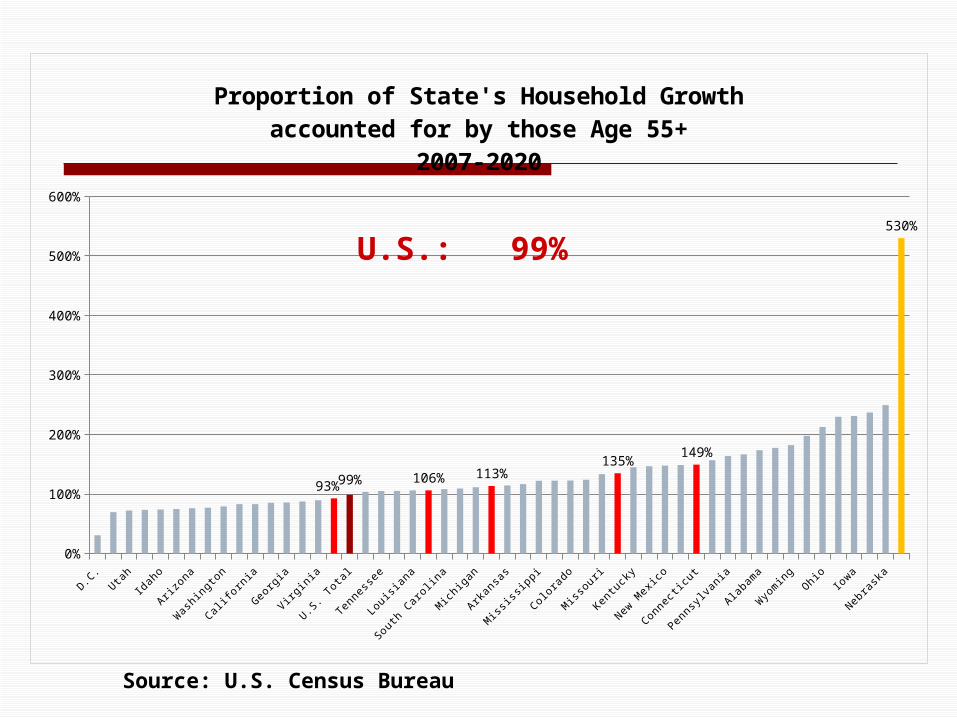
D.C.
Utah
Idah
o
Arizon
a
Was
hing
ton
Califo
rnia
Geo
rgia
Virgin
ia
U.S. T
otal
Tenn
esse
e
Loui
sian
a
Sout
h Car
olin
a
Michi
gan
Arkan
sas
Mississ
ippi
Color
ado
Misso
uri
Kent
ucky
New M
exico
Conne
cticut
Penn
sylv
ania
Alaba
ma
Wyo
min
gOhi
oIo
wa
Nebra
ska
0%
100%
200%
300%
400%
500%
600%
93%99% 106% 113%135%
149%
530%
Proportion of State's Household Growthaccounted for by those Age 55+
2007-2020
U.S.: 99%
Source: U.S. Census Bureau
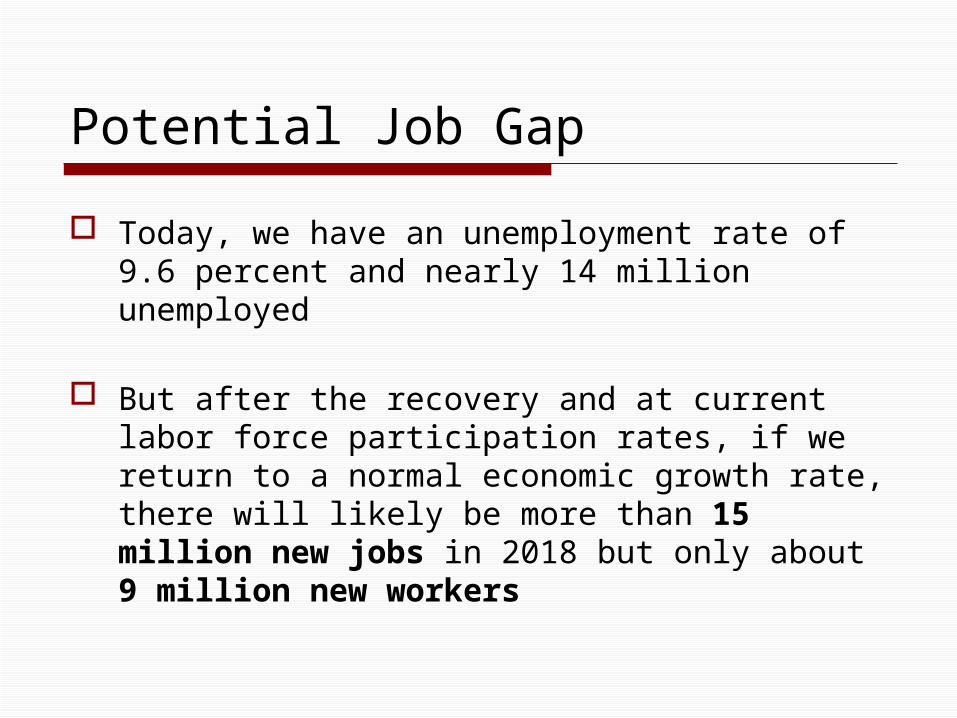
Potential Job Gap
Today, we have an unemployment rate of 9.6 percent and nearly 14 million unemployed
But after the recovery and at current labor force participation rates, if we return to a normal economic growth rate, there will likely be more than 15 million new jobs in 2018 but only about 9 million new workers

Public Finance Crisis
With only 900,000 additional adults between the ages of 18 and 54
Who will fill the jobs in our cities?
Who will be around to pay the taxes we need to provide services?
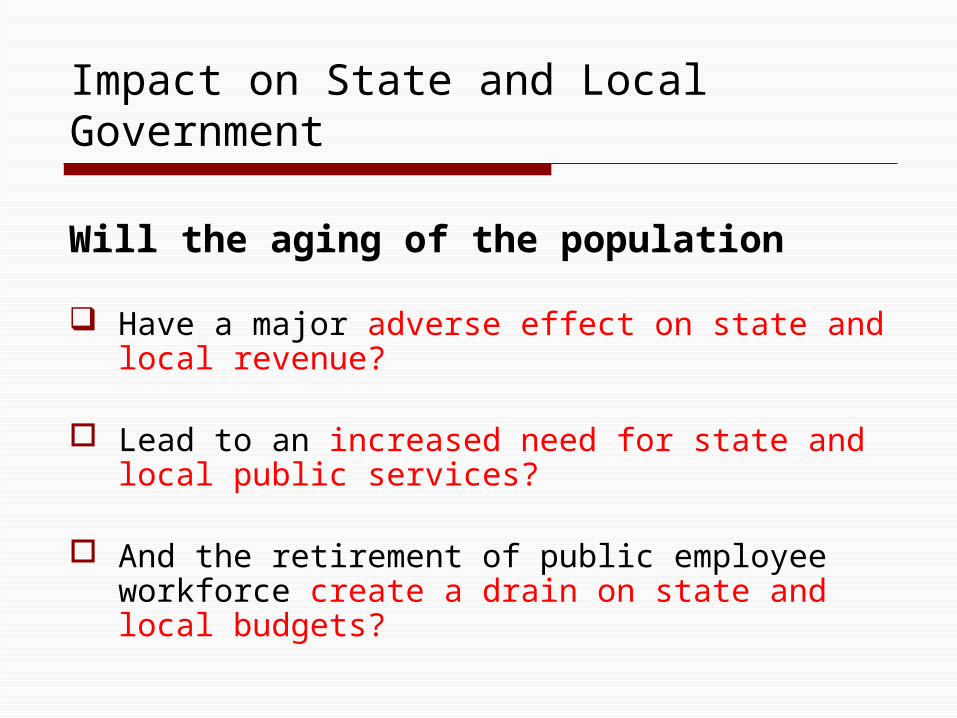
Impact on State and Local Government
Will the aging of the population
Have a major adverse effect on state and local revenue?
Lead to an increased need for state and local public services?
And the retirement of public employee workforce create a drain on state and local budgets?
FISCAL CONDITION OF STATE BUDGETS

FY2009 FY2010 FY2011 FY2012
-$160
-$140
-$120
-$100
-$80
-$60
-$40
-$20
$0
-$79
-$123
-$101
-$134
State Budget Shortfalls after Use of Federal Recovery Funds (FY2009-FY2012)
Source: Center on Budget and Policy Priorities, December 2010

Projected State Budget Gaps: FY2012 Illinois 50.9% New Jersey 37.4% Nevada
37.1% South Carolina
26.6% Minnesota
24.5% Texas 22.3% California
22.2% Louisiana
22.0% Connecticut 20.8% North Carolina
20.0% Washington 18.5%
Only three states are projected to have no budget gap North Dakota Alaska Arkansas
Source: Center on Budget and Policy Priorities, December 2010
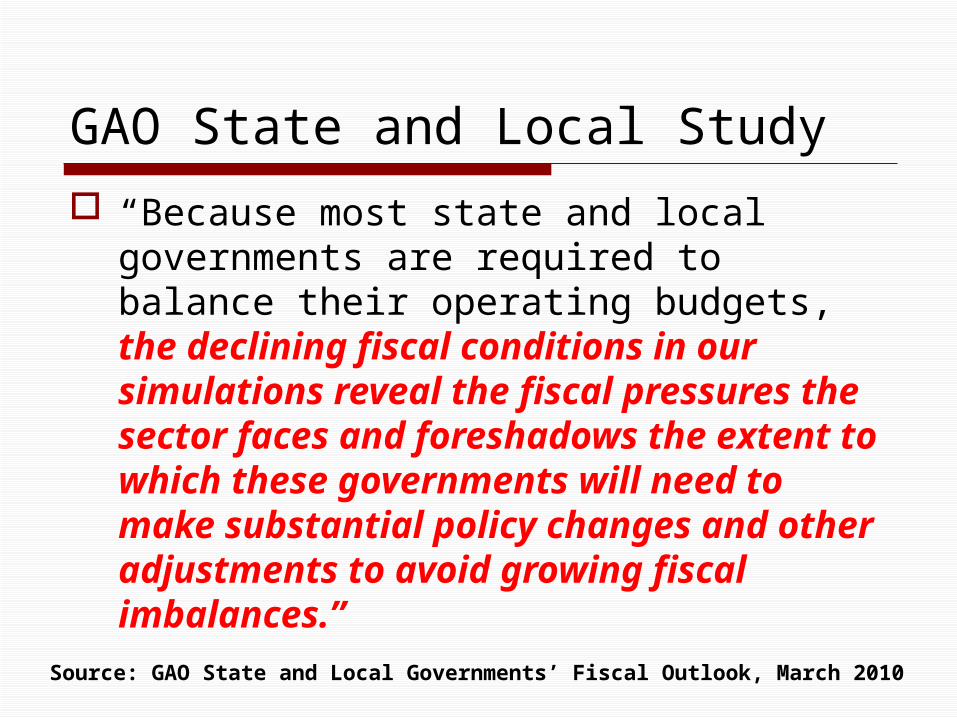
GAO State and Local Study
“Because most state and local governments are required to balance their operating budgets, the declining fiscal conditions in our simulations reveal the fiscal pressures the sector faces and foreshadows the extent to which these governments will need to make substantial policy changes and other adjustments to avoid growing fiscal imbalances.”
Source: GAO State and Local Governments’ Fiscal Outlook, March 2010

State and Local Operating Balance as % of GDP
From 2000-2008, State & Local budgetsin Operating Balance
From 2010 through 2060, State & Local budgetsare increasing out of balance
Source: GAO State and Local Governments’ Fiscal Outlook, March 2010
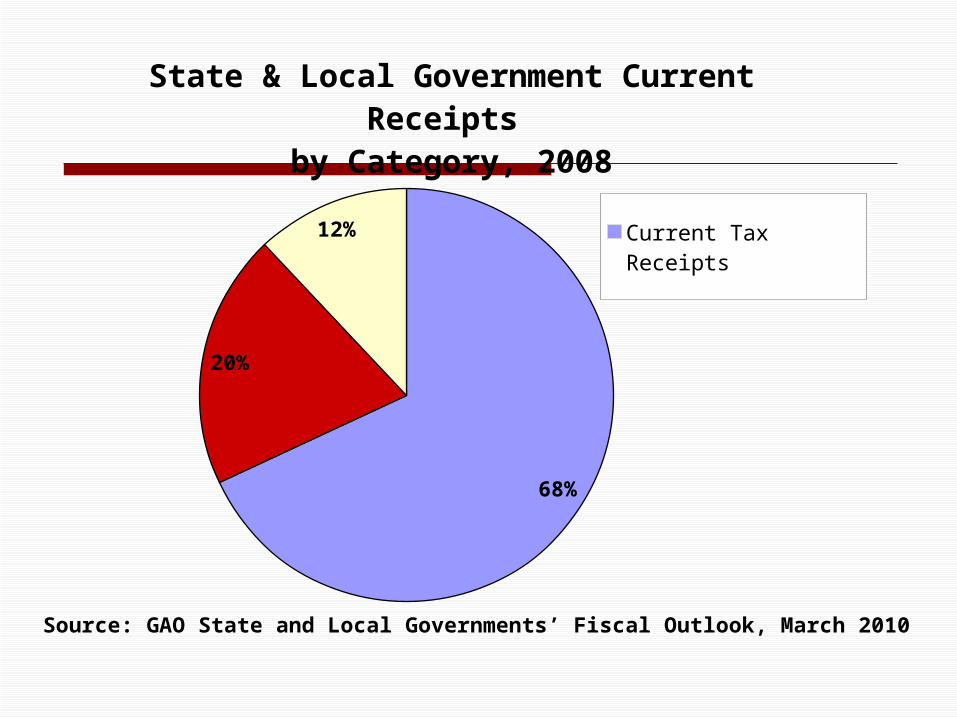
68%
20%
12%
State & Local Government Current Receipts by Category, 2008
Current Tax Receipts
Federal Grants-in-Aid
Other Receipts
Source: GAO State and Local Governments’ Fiscal Outlook, March 2010
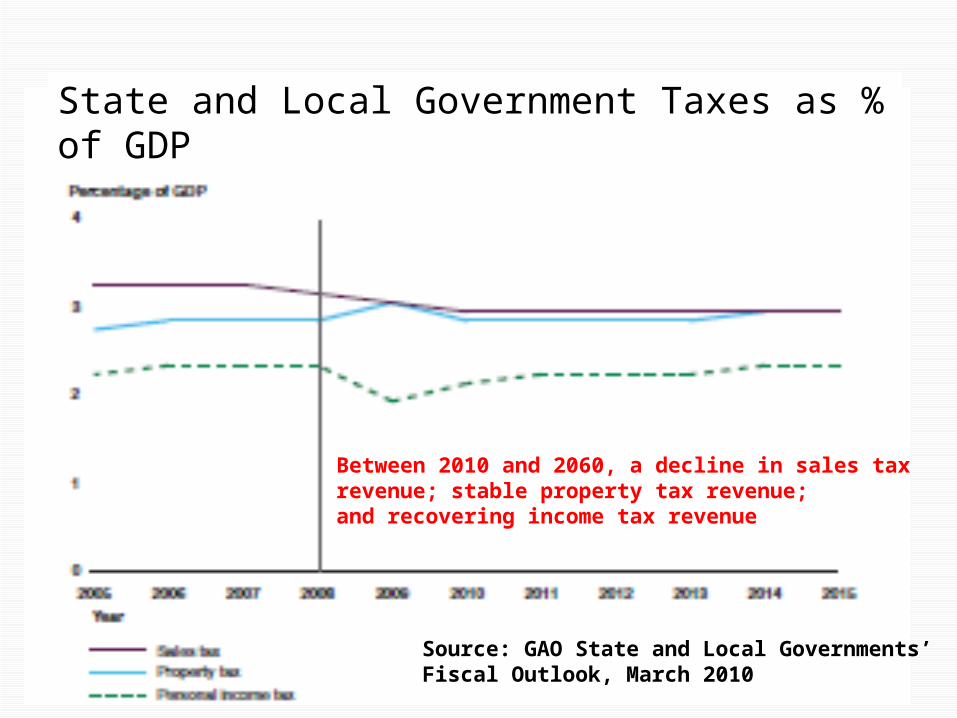
State and Local Government Taxes as % of GDP
Between 2010 and 2060, a decline in sales tax revenue; stable property tax revenue; and recovering income tax revenue
Source: GAO State and Local Governments’ Fiscal Outlook, March 2010

Federal Grants to State and Local Government as % of GDP
Between 2010 and 2060, Medicaid grantsroughly constant, but other grants declinesharply
Source: GAO State and Local Governments’ Fiscal Outlook, March 2010

Health and Non-Health Expenditures of State and Local Governments as % of GDP
Non-health spending will be Forced to drop substantially
As health care spending increases sharply
Source: GAO State and Local Governments’ Fiscal Outlook, March 2010
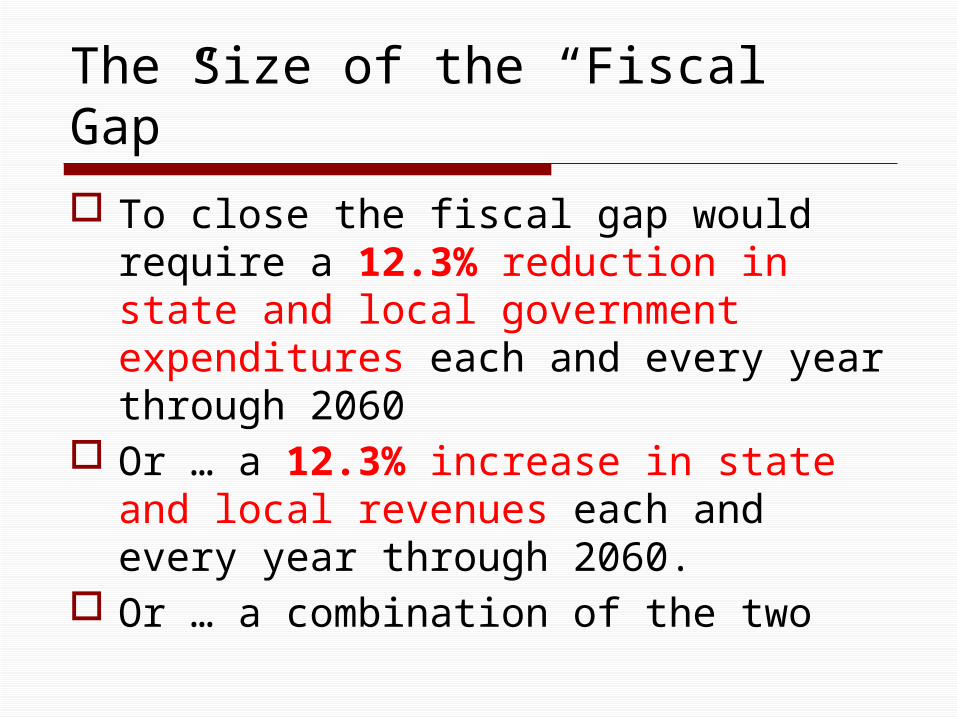
The Size of the “Fiscal Gap”
To close the fiscal gap would require a 12.3% reduction in state and local government expenditures each and every year through 2060
Or … a 12.3% increase in state and local revenues each and every year through 2060.
Or … a combination of the two
ECONOMIC DEVELOPMENT TO CLOSE THE FISCAL GAP
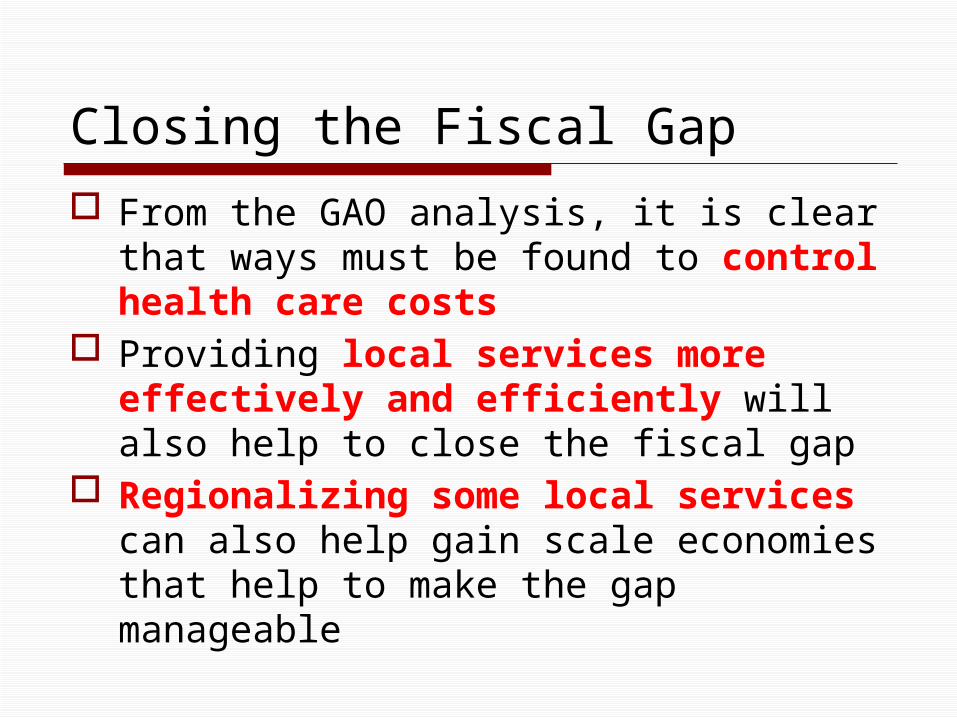
Closing the Fiscal Gap
From the GAO analysis, it is clear that ways must be found to control health care costs
Providing local services more effectively and efficiently will also help to close the fiscal gap
Regionalizing some local services can also help gain scale economies that help to make the gap manageable

But the Real Answer to Fiscal Health is …
Boosting local economic development
Attracting business investment and jobs
Generating additional tax revenue from new and expanded business for vital public services
How to Boost Economic Development in Your City or Town

5 Steps to becoming the “CEO for Economic Development”
1. Become SWOT aware2. Capitalize on strengths; mitigate
weaknesses3. Identify appropriate industry sectors4. Know the language and requirements
of businesses5. Build a business friendly environment

Become SWOT Aware
Objectively explore internal strengths and weaknesses
Inventory physical assets, local businesses, and knowledge/skills base
Understand the role of each municipal department in economic development
Engage business leaders, real estate experts, and other stakeholders
Prioritize economic development objectives; build consensus
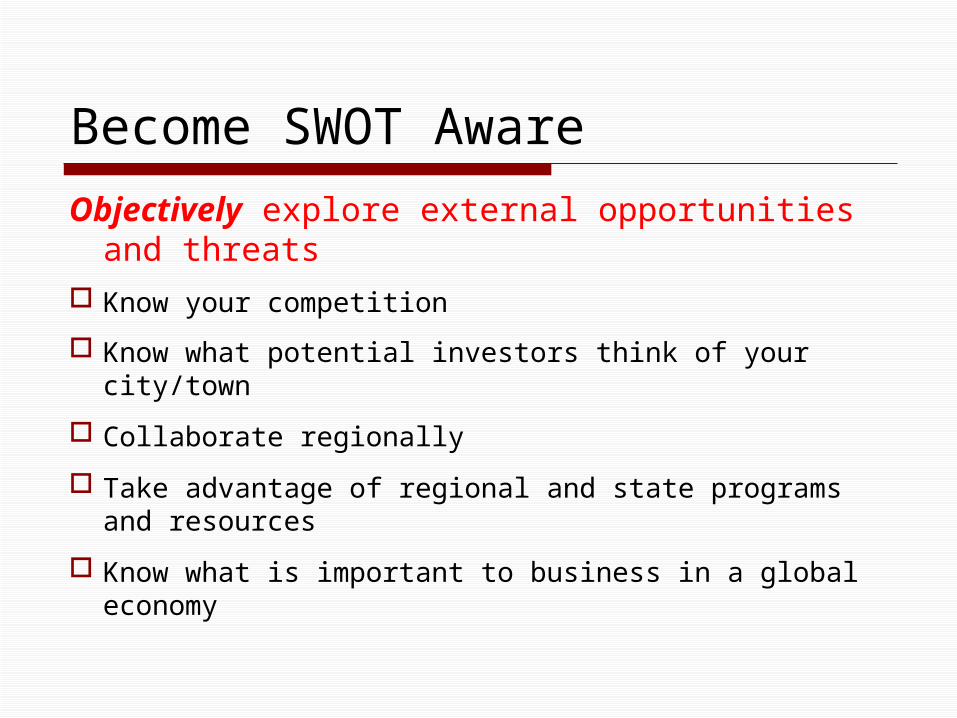
Become SWOT Aware
Objectively explore external opportunities and threats
Know your competition
Know what potential investors think of your city/town
Collaborate regionally
Take advantage of regional and state programs and resources
Know what is important to business in a global economy

Capitalize on Strengths and Understand Weaknesses
Build upon Strengths What do existing businesses need in order to
grow? Use that knowledge to define initial economic
development strategies Build critical mass and/or attract supporting
businesses Highlight strengths/assets of your municipality in
marketing Plan strategically based on strengths—envision 10
projects into the future
Capitalize on Strengths and Understand Weaknesses
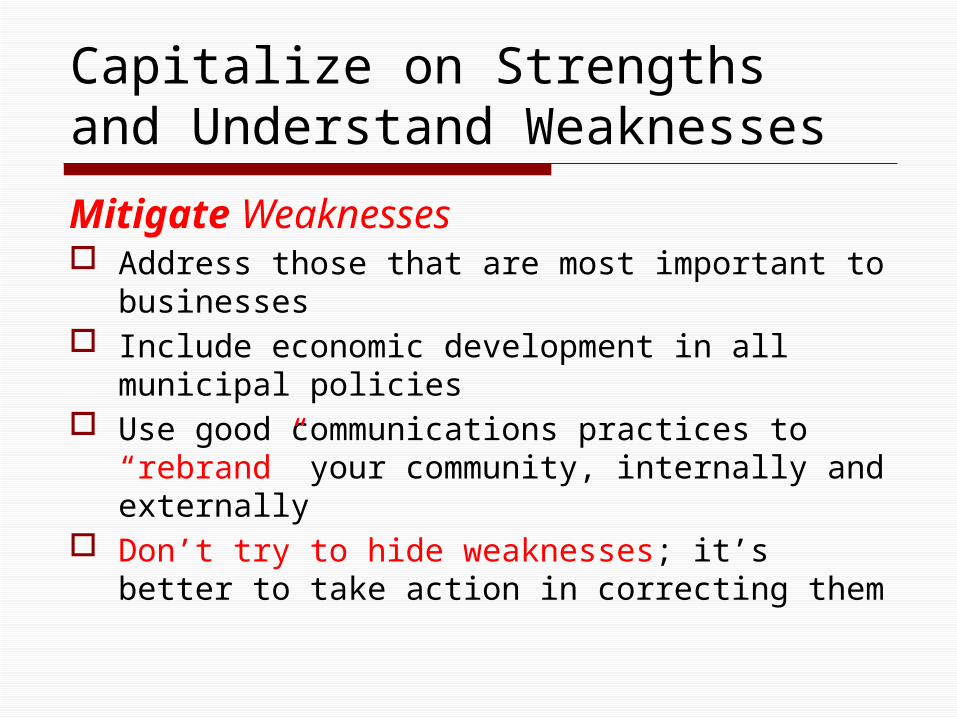
Mitigate Weaknesses Address those that are most important to
businesses Include economic development in all municipal
policies Use good communications practices to
“rebrand” your community, internally and externally
Don’t try to hide weaknesses; it’s better to take action in correcting them
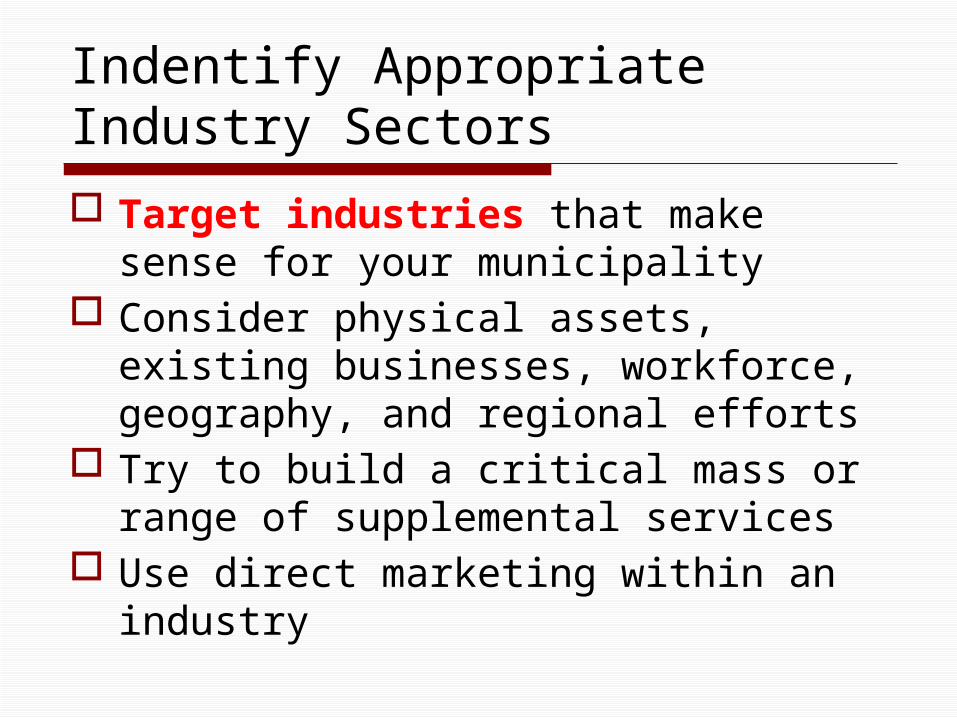
Indentify Appropriate Industry Sectors
Target industries that make sense for your municipality
Consider physical assets, existing businesses, workforce, geography, and regional efforts
Try to build a critical mass or range of supplemental services
Use direct marketing within an industry

Know the Language and Requirements of Businesses Speak their language and know the jargon
Appreciate “time to market” and other global economic realities
Learn “Deal Makers/Breakers”: parking, cost of rent, skilled labor force, access to markets, and timely permitting
Rely on “Deal Closers” sparingly: tax incentives
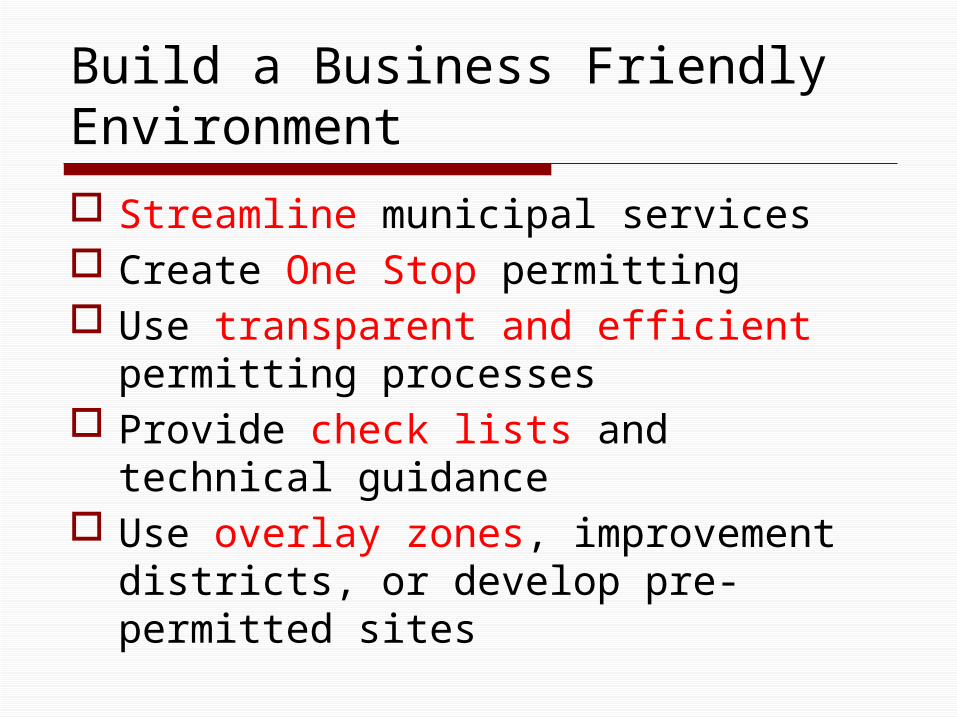
Build a Business Friendly Environment
Streamline municipal services Create One Stop permitting Use transparent and efficient
permitting processes Provide check lists and technical
guidance Use overlay zones, improvement
districts, or develop pre-permitted sites

Finally … as CEO for Economic Development build a Business Friendly Environment
Coordinate local and regional strategies for long run success
Build support within the community and among stakeholders to convey a consistent message
Takeaway Action Items
What immediate steps can you take as the “CEO of Economic Development?”
Write down several action items to take home.