MOU Annual Report 2015 3 FA sent _report_2015.pdf · ANNUAL REPORT 2015 ABUJA MoU ... detained for...
38
ANNUAL REPORT 2015 UJ o AB A M U MEMORANDUM OF UNDERSTANDING ON PORT STATE CONTROL FOR WEST AND CENTRAL AFRICAN REGION
Transcript of MOU Annual Report 2015 3 FA sent _report_2015.pdf · ANNUAL REPORT 2015 ABUJA MoU ... detained for...
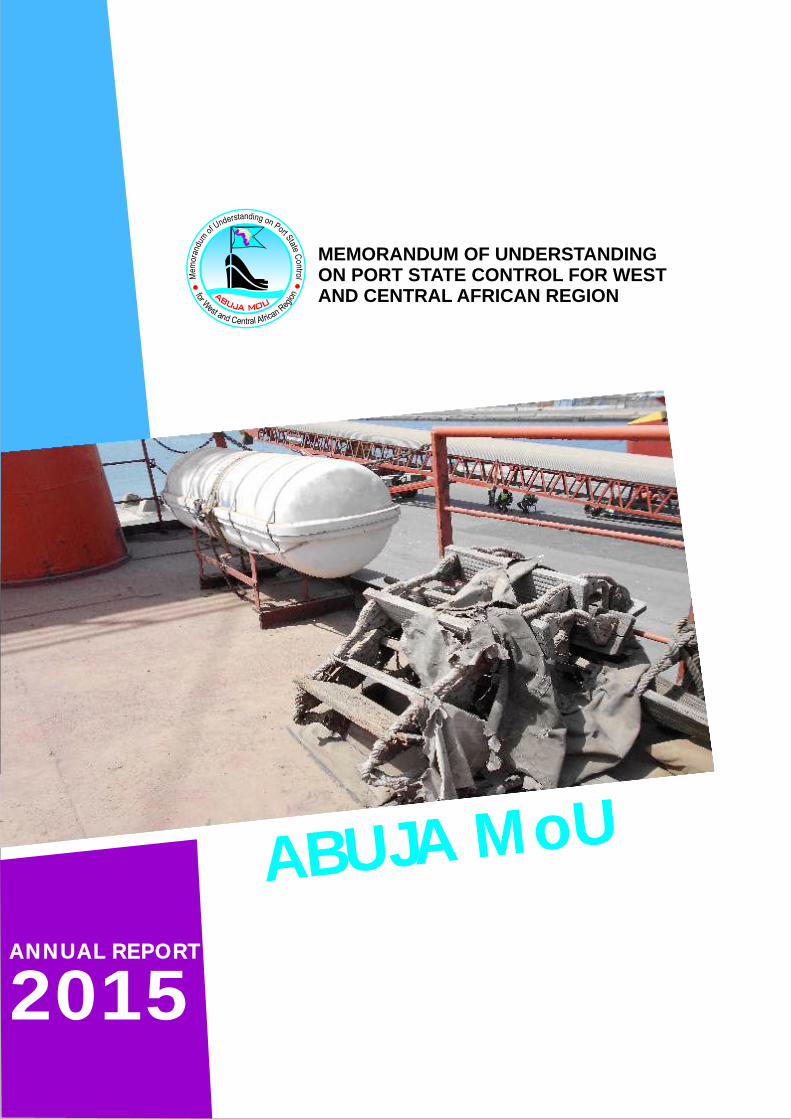
ANNUAL REPORT
2015
UJ oAB A M U
MEMORANDUM OF UNDERSTANDING ON PORT STATE CONTROL FOR WEST AND CENTRAL AFRICAN REGION

Cape Verde
GuineaBissau
Countries in the Region who are not full members: Liberia, Equatorial Guinea,
Cameroon, Congo DRC, Mauritania, Namibia

TABLE OF CONTENTS
STATEMENT OF THE
PORT STATE CONTROL INSPECTION STATISTICS 2015
SECRETARY GENERAL
MARITIME ADMINISTRATION OF BENIN REPUBLIC - PROFILE
STRUCTURE OF ABUJA MoU
2 0 1 5 A B U J A M o U A N N U A L R E P O R T
3

STATEMENT OF THE SECRETARY GENERAL
MFON EKONG USORO (Mrs)Secretary General
2 0 1 5 A B U J A M o U A N N U A L R E P O R T
4
n 2010, member States of Abuja MoU at the 2nd
Ministerial Conference and 7th PSC Committee
Meeting developed a Plan of Action to revitalize Ia moribund MoU. The Secretariat under a new
leadership had a clear mandate to (i) take all the
necessary measures to implement the Abuja MoU
Plan of Action, reform the Secretariat, implement the
7th PSC Committee Meeting Guidelines for
Revitalization of Abuja MoU; and (ii) grow
membership of the MoU etc. With the astute
leadership of the Chairman of Abuja MoU, the
Honourable Minister of Transportation in Charge of
Marine Merchande of the Republic of Congo, and
active participation of member Administrations we
were able to fulfil our mandates within four years.
Membership of the MoU has grown to sixteen (16)
full and active member States. Regular port State
control inspections and reporting are carried out by
14 member Administrations. Abuja MoU has become
a performing MoU notwithstanding challenges of
financial support from some member States.
The performance of member States of Abuja MoU for
the year under review shows greater understanding
and commitment to improve the level of safety in
shipping navigation, marine environment and safety
of shipboard officers and crew. In the year under
review, more maritime Administrations commenced
the New Inspection Regime approved by the AMoU
PSCC. Abuja MoU Information System (AMIS),
hosted by the Russian Federation PSC/FSC
Information Centre in Moscow was successfully
upgraded to aid implementation of the New
Inspection Regime through the automated targeting
system.
In 2013, we introduced the profiling of performing
Administrations in our Annual Report. This year, the
Maritime Administration of the Republic of Benin is
profiled in this Report. Benin along with the
Democratic Republic of Congo, Gabon, and Liberia
were able to achieve the inspection of 15% of
ship calls in their respective ports. It recorded
actual numerical increase of 39% in the number
of PSC inspections over its 2014 record. Benin
Maritime Administration hosted and benefited
from the Secretariat's national training
programme for PSCOs on the PSCOs Manual and
AMIS.
Given the degree of harmonization of procedures
and coordination of port State control activities in
the Region, member Administrations of the MoU
should be able to participate in the Concentrated
Inspection Campaign which has proved to be an
effective tool for elimination of safe havens for
substandard ships in other regional MoUs. It is
expected that 2016 will witness the first CIC in
our region as we join other regional MoUs in the
MFON EKONG USORO (Mrs) Secretary General
ABUJA MOU
Typewritten text
Campaign.

2 0 1 5 A B U J A M o U A N N U A L R E P O R T
5
Ghana PSCO Checking Ships Certificates & Documents
his report presents the result of port State
control inspections conducted by 14
member States in Abuja MoU region Tnamely: Benin, Republic of Congo, Democratic
Republic of Congo, Cote d'Ivoire, Equatorial
Guinea, Gabon,
The Gambia,
Ghana, Guinea,
Liberia, Nigeria,
Senegal, South
A f r i c a a n d
Togo. The PSC
i n s p e c t i o n
statistical data
in this Report
were generated
automatically
f r o m t h e
c e n t r a l
database of
A b u j a M o U
I n f o r m a t i o n
system (AMIS).
In the year under consideration, 2,348 ships
were inspected by fourteen (14) member States
in spite of the challenges faced in the region as a
result of Ebola epidemic. Nine (9) vessels were
detained for PSC detainable deficiencies during
the year, giving a 35.71% decrease in the
number of detention below 2014 figures of
fourteen (14) detentions. The detention
percentage per inspection of 0.38% in 2015
gives a 0.1% decrease below that of 2014 which
was 0.48%. The spread of one deficiency for
every 4.5 inspections is a slight decrease from
4.8 in 2014. The region recorded a 19.5%
decrease in inspection efforts from 2,916 in 2014
where 14 Administrations submitted reports to
2,348 inspections in 2015 with same number of
PORT STATE CONTROL INSPECTION STATISTICS 2015
Administrations reporting.
In 2015, a total of 528 deficiencies were recorded and
total number of inspections with deficiencies was
143, both a
decrease from
609 and 179
respectively but
t h e
p e r c e n t a g e
n u m b e r o f
deficiencies per
i n s p e c t i o n
remained same
as in 2014. In
2015, the most
d e f i c i e n c i e s
were recorded
on ship/crew
certificates and
d o c u m e n t s
which stood at
58 (11%) out of 528, safety of navigation with 38
(7.2%), fire safety measures 35 (6.6%), radio
communications 26 (4.9%), followed by life-saving
appliances 20 (3.8%). It is worth noting that 1 out of
9 deficiencies recorded were due to false or incorrect
ship certificates and documents. Of particular
interest is that safety of navigation which constitutes
7% of all deficiencies recorded remains the highest
deficiency closely followed by fire safety measures
under SOLAS Convention.
In 2015, twenty-one different ship types were
inspected. Bulk Carrier came top with 31% of ship
types inspected, General Cargo/multipurpose with
17%, Oil Tanker 15%, while Container ship was 14%.
In total, 328 inspections were conducted on the

2 0 1 5 A B U J A M o U A N N U A L R E P O R T
6
PSC Inspection on Deck of a Tanker
aforementioned ships and represent the top four
most inspected ship types.
One hundred and forty three (143) of the
inspect ions conducted generated 528
deficiencies. The deficiencies comprises of:
Ship's/Crew certificates and documents – 11%;
SOLAS Convention – 34%; MARPOL Convention –
4.3%; STCW Convention – 2.7%; Load Line
Convention – 3%; ILO – 6.4%. Of all the relevant
instruments covered within the Abuja MoU PSC
regime, SOLAS still ranks the highest with 34% of
all deficiencies recorded. The number of
detentions decreased to 9 from 14 in 2014. 56%
of the detentions recorded were for Bulk Carriers,
Refrigerated cargo 33.3%, and General
cargo/multipurpose 11%.
In total, the performance percentage inspection
by member States for the year 2015 is 4.6% which
is still far below the target of 15% for the Region
and less than the previous year of 6.0%. Four
States - Benin, Dem. Republic of Congo, Gabon,
and Liberia were able to achieve the inspection of
15% of ship calls in their respective ports in 2015
compared to three in 2014 showing a steady
progress in member States achieving the targeted
inspection rate. Of the six States (Benin, Cote
d'Ivoire, Guinea, Senegal, South Africa and Togo)
that recorded actual numerical increase in PSC
inspection in 2015, giving a 50% increase over
2014, Benin stood out in spite of reduced ship call
from 2,012 to 1,401(30% reduction) with
inspections increased by 39% from 218 to 303.
2015 marked the year when more than fifty
percent of maritime administrations (8) that carry
out PSC inspection and reporting uploaded the
reports directly to the Abuja MoU database. The
remaining six continue to email scanned copies of
completed PSI forms or courier same to the
Secretariat for uploading by the IT staff. Benin,
Cote d'Ivoire, Gambia, Ghana, Guinea, Liberia,
Nigeria and Senegal upload directly into the
database. The Secretariat continues to urge other
member Administrations to make effective use of
the AMIS.
Hopefully, the eight-day regional PSCOs training
scheduled for the first quarter of 2016 will
reenergize the good and steady progress in
performance recorded from 2010.

he Republic of Benin has an area of ??114,763
km², located in West Africa, the Gulf of Guinea.
It lies on the Atlantic Ocean with a coast line of T125 km, and situated east of Togo and west of Nigeria.
The Beninese coastline is almost linear and is dissected
into two which are: the mouth of Roy and the mouth of
the canal of Cotonou.
Benin Republic does not have any ship under her flag.
A vessel under the flag of Benin was in service in the
1980s but has since been sold.
A significant artisanal fleet of 5000, located in a zone
reserved for artisanal fishing demonstrates the
dynamism of the commercial activity.
The economic capital of Benin, Cotonou, is located on
the coastal strip between Lake Nokoué and the Atlantic
Ocean.The port of Cotonou, the only commercial port
of Benin, recorded 2,033 ship calls in 2014, a traffic
increase of 31.31% from the previous year. It serves
land linked countries such as Niger and Burkina Faso. It
is the first transit port of the Republic of Niger. The
ports of Lagos (Nigeria) and Lomé (Togo) are 115 km
and 135 km from Cotonou respectively. The types of
ships which call at the port of Cotonou are mainly
container ships (50% of ships), ro-ro ships (23%),
tankers (11%) and various cargoes (6%).
Most of these vessels conduct regular liner call with
Europe or America. The lack of space at the port often
requires the vessels to wait at anchor.
The Directorate of the Merchant Marine (DMM) is in
charge of all the responsibilities relating to the safety
certification of the vessels, granting of patents, port
State control, and the organization of the expected
services of a Coastal State. The DMM was established
by Decree No. 172/PR/MTPTPT/ of 18 June 1968. It is
organized for this purpose into 4 services by Order No.
067/ MEMIP/DC/SGM/DMM/SA of 09 December 2015.
Due to insufficient budget and several retirements, its
staff has been decimated in quantity and quality to the
extent that it is unable to easily cope with its missions
as described by the same Decree. The most acute
shortage is lack of qualified inspectors in accordance
ACTIVE PORT TRADE
ORGANISATION AND ADMINISTRATION
MARITIME ADMINISTRATION OF BENIN REPUBLIC –PROFILE
with the IMO requirements. However, for the port
State control, they are helped in their duties by
professionals, in a framework of partnership.
Benin has ratified the basic conventions of the
IMO: SOLAS and Load Line (LL66), but not the
1988 Protocol, COLREG, MARPOL, STCW, and
Tonnage 69. Benin Republic is also one of the
countries which have ratified the MLC, 2006
Convention before its entry into force.
In order to mitigate the challenges faced by Port
State Control Off icers, the fol lowing
requirements are inevitable:
A team of 4 qualified inspectors would be
required to cover adequately the needs of the
country. The goal of having this team is to
improve and sustain the work of the existing
inspectors.
Under the flag State which includes, three tugs,
fifty yachts most of which are jet skis, and
canoes, in the medium term is the subject of
proper safety inspections.
The presence of Nigerian fishing vessels licensed
in Benin does not give enough exposure for the
professional development of the port State
control officers.
RATIFICATION OF CONVENTIONS
CHALLENGES
PSCOs in front of their office
2 0 1 5 A B U J A M o U A N N U A L R E P O R T
7

2 0 1 5 A B U J A M o U A N N U A L R E P O R T
8
TABLE 1: Inspection Data by Authority
TABLEAU 1: Données d’Inspection par Autorités
Authority No. of Inspections
No. of Detailed Inspections
No. of Inspections with Deficiencies
No. of Deficiencies
Percentage of Inspections with Deficiencies
No. of Detentions
Detention Percentage
Benin 303
Republic of Congo 181
Congo DRC 226
Cote d'Ivoire 152 5 14 3.29
Gabon 246 2 9 0.81
Gambia 15 1 4 6.67
Ghana 81 7 11 8.64
Equatorial Guinea 9
Guinea 84
Liberia 78
Nigeria 316 60 214 18.99
Senegal 210 3 20 71 9.52 3 1.43
South Africa 274 6 48 205 17.52 6 2.19
Togo 173
TOTAL 2348 9 143 528 6.09 9 0.38
PSCOs Inspection on Deck of Ship
2 0 1 5 A B U J A M o U A N N U A L R E P O R T
9
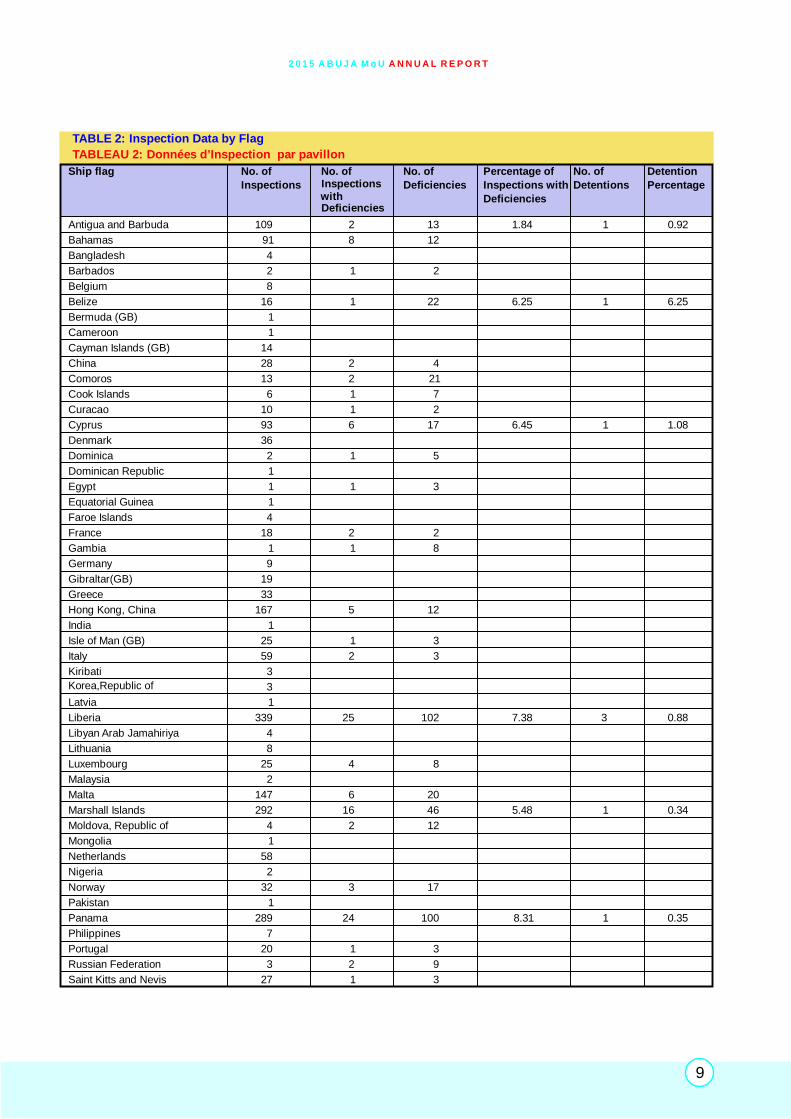
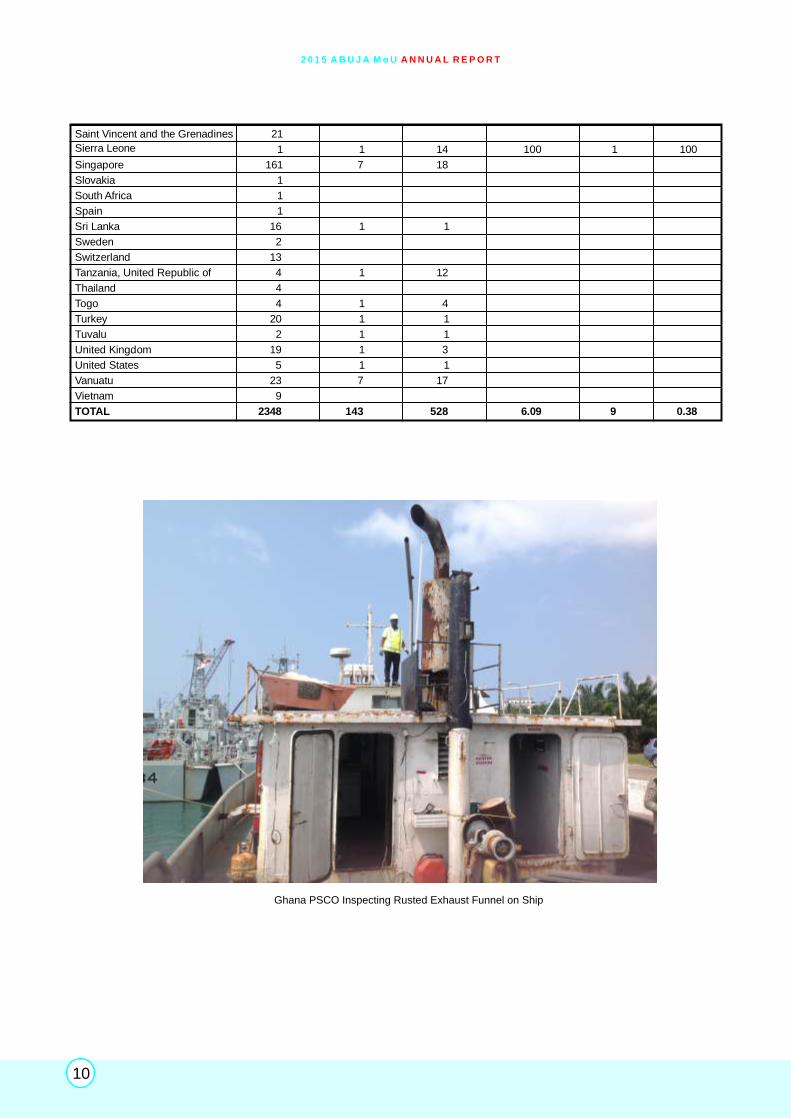
TABLE 2: Inspection Data by Flag
TABLEAU 2: Données d’Inspection par pavillon
Ship flag No. of
Inspections
No. of Inspections with Deficiencies
No. of
Deficiencies
Percentage of
Inspections with
Deficiencies
No. of
Detentions
Detention
Percentage
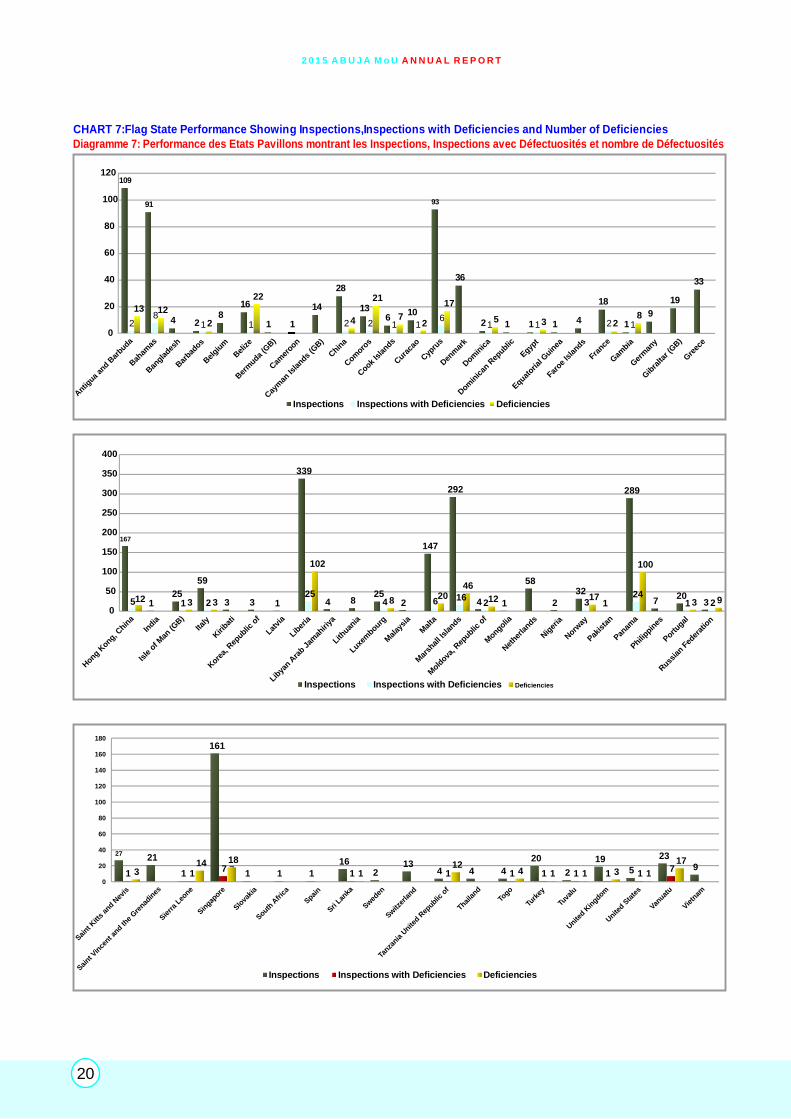
Antigua and Barbuda 109 2 13 1.84 1 0.92
Bahamas 91 8 12
Bangladesh 4
Barbados 2 1 2
Belgium 8
Belize 16 1 22 6.25 1 6.25
Bermuda (GB) 1
Cameroon 1
Cayman Islands (GB) 14
China 28 2 4
Comoros 13 2 21
Cook Islands 6 1 7
Curacao 10 1 2
Cyprus 93 6 17 6.45 1 1.08
Denmark 36
Dominica 2 1 5
Dominican Republic 1
Egypt 1 1 3
Equatorial Guinea 1
Faroe Islands 4
France 18 2 2
Gambia 1 1 8
Germany 9
Gibraltar(GB) 19
Greece 33
Hong Kong, China 167 5 12
India 1
Isle of Man (GB) 25 1 3
Italy 59 2 3
Kiribati 3
Korea,Republic of 3
Latvia 1
Liberia 339 25 102 7.38 3 0.88
Libyan Arab Jamahiriya 4
Lithuania 8
Luxembourg 25 4 8
Malaysia 2
Malta 147 6 20
Marshall Islands 292 16 46 5.48 1 0.34
Moldova, Republic of 4 2 12
Mongolia 1
Netherlands 58
Nigeria 2
Norway 32 3 17
Pakistan 1
Panama 289 24 100 8.31 1 0.35
Philippines 7
Portugal 20 1 3
Russian Federation 3 2 9
Saint Kitts and Nevis 27 1 3
2 0 1 5 A B U J A M o U A N N U A L R E P O R T
10
Saint Vincent and the Grenadines 21
Sierra Leone 1 1 14 100 1 100
Singapore 161 7 18
Slovakia 1
South Africa 1
Spain 1
Sri Lanka 16 1 1
Sweden 2
Switzerland 13
Tanzania, United Republic of 4 1 12
Thailand 4
Togo 4 1 4
Turkey 20 1 1
Tuvalu 2 1 1
United Kingdom 19 1 3
United States 5 1 1
Vanuatu 23 7 17
Vietnam 9
TOTAL 2348 143 528 6.09 9 0.38
Ghana PSCO Inspecting Rusted Exhaust Funnel on Ship

2 0 1 5 A B U J A M o U A N N U A L R E P O R T
11
Ghana PSCO Inspecting Valves on Tanker Deck
TABLE 3: Inspection Data by Ship TypeTABLEAU 3: Données d’Inspection par Type de Navire
Ship Type No. of
Inspections
No. of
Inspections
with
Deficiencies
No. of
Deficiencies
Percentage of
Inspections
with
Deficiencies
No. of
Detentions
Detention
Percentage
Bulk carrier 732 42 158 5.74 5 0.68
Combination carrier 1
Container 328 7 20
Chemical tanker 81 7 28
Fish factory 1
Gas carrier 12
G.cargo/multipurpose 397 22 78 5.54 1 0.25
Heavy Load 2
High speed pass.craft 3
MODU and FPSO 2
Offshore supply 85 16 39
Oil tanker 346 16 67
NLS tanker 2
Passenger Ship 12 3 6
Refrigerated cargo 158 20 94 12.66 3 1.9
Ro-Ro cargo 91 1 3
Special purpose ship 7
Tugboat 17
Vehicle carrier 33 2 16
Woodchip carrier 1
Other special Activities 37 7 19
TOTAL 2348 143 528 6.09 9 0.38

2 0 1 5 A B U J A M o U A N N U A L R E P O R T
12
TABLE 4: Inspection Data per Category of Deficiency
TABLEAU 4: Données d’ Inspection par Catégorie de Défectuosités
Number of Deficiency Percentage of Total Deficiencies
44 8.33
Structural Conditions 8 1.52
SOLAS Emergency Systems 15 2.84
Radio Communications 26 4.92
Fire safety 35 6.63
Alarms 4 0.76
Cargo Operation
including equipment
1 0.19
Safety of Navigation 38 7.2
Life saving appliances 20 3.79
Propulsion and auxiliary
machinery
16 3.03
Dangerous goods 3 0.57
ISM 8 1.52
ISPS 3 0.57
Annex I 16 3.03
Annex IV 1 0.19
Annex V 4 0.76
Annex VI 2 0.38
STCW Certificate and
Documentation - Crew
Certificates
14 2.65
Load Lines Water/Weather tight
conditions
16 3.03
ILO Living and Working
Conditions
34 6.44
220 41.67
Category of Deficiency
Ship’s certificates and documents
MARPOLS
Other
Abuja MoU attends EU-ACP Programme Support to the Maritime Transport Sector in Africa in Brussels

2 0 1 5 A B U J A M o U A N N U A L R E P O R T
13
Table 5: Inspection Data by Classification Society
Tableau 5: Donnees d’Inspection par Société de Classification
Classsification Class Code No. of
Inspections
No. of
Inspections with
Deficiencies
No. of
Deficiencies
No. of
Detentions
Detention
Percentage
American Bureau of Shipping ABS 306 26 81 1 0.33
Bureau Securitas BS 1
Bureau Veritas BV 373 24 69 1 0.27
China Classification Society CCS 101 6 25
Det Norske Veritas DNV 167 13 43
DNV GL AS 132 3 9Fidevavis S.A 1 1 2Germanischer Lloyd GL 292 10 32
International Naval Surveys Bureau INSB 16 3 32 1 6.25
Korea Clasification Society KCS 1 1 1Korean Register of
Shipping KRS 45 2 16
Lloyd's Register LR 294 15 48 1 0.34
Nippon Kaiji Kyokai NKK 438 19 80 4 0.91
Panama Maritime Documentation Services PMDS 1
Phoenix Register of Shipping PRS 3 2 12
Polski Rejestr Statkow (Polish Register of Shipping) PRS 2 1 3
Registro Italiano Navale RINA 101 5 8
Registro Internacional Naval, S.A 8 1 5
Russian Maritime Register of Shipping RMRS 35 7 24
Rinave Portuguesa 1
Shipping Register of Ukraine SRU 1
Sing-Lloyd 1 1 14 1 100
Vietnam Register of Shipping VRS 4
Maritime Lloyd Ltd, Georgia 3
No class 1
Other 20 3 24
TOTAL 2348 143 528 9 0.38
2 0 1 5 A B U J A M o U A N N U A L R E P O R T
14
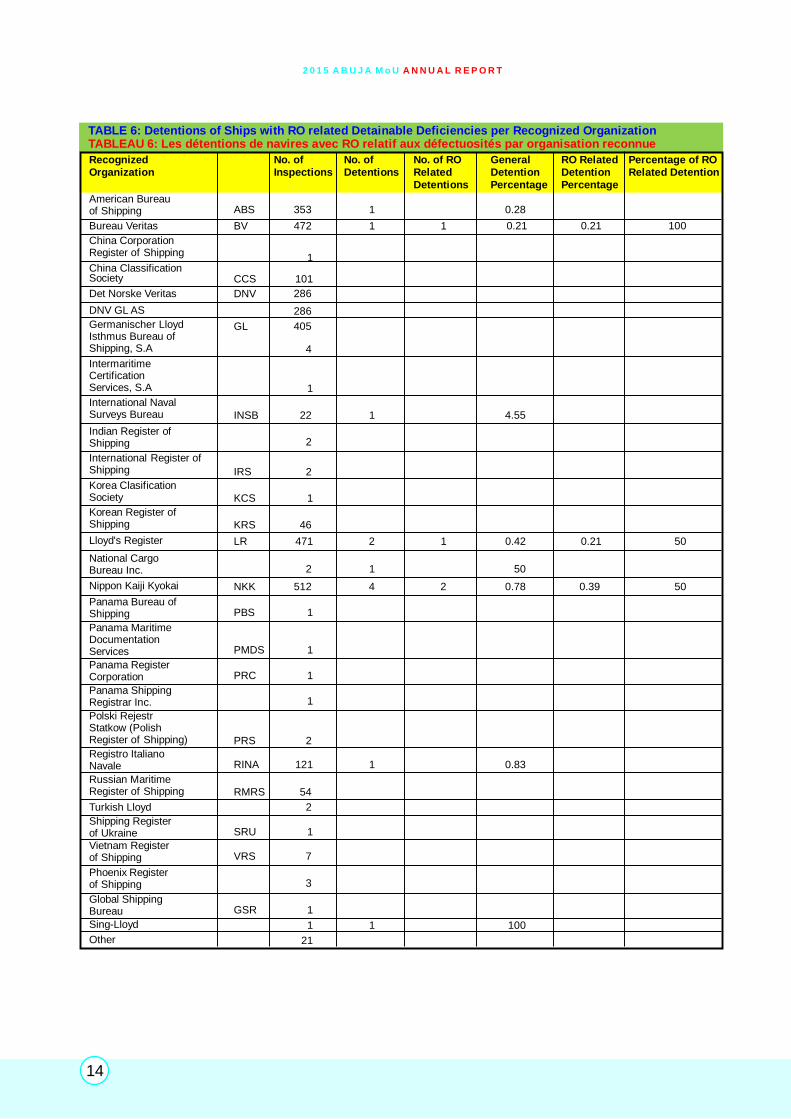
TABLE 6: Detentions of Ships with RO related Detainable Deficiencies per Recognized OrganizationTABLEAU 6: Les détentions de navires avec RO relatif aux défectuosités par organisation reconnue
Recognized Organization
No. of Inspections
No. of Detentions
No. of RO Related Detentions
General Detention Percentage
RO Related Detention Percentage
Percentage of RO Related Detention
American Bureau of Shipping ABS 353 1 0.28
Bureau Veritas BV 472 1 1 0.21 0.21 100
China Corporation Register of Shipping 1China Classification Society CCS 101
Det Norske Veritas DNV 286
DNV GL AS 286Germanischer Lloyd GL 405Isthmus Bureau of Shipping, S.A 4
Intermaritime Certification Services, S.A 1
International Naval Surveys Bureau INSB 22 1 4.55
Indian Register of Shipping 2
International Register of Shipping IRS 2
Korea Clasification Society KCS 1
Korean Register of Shipping KRS 46
Lloyd's Register LR 471 2 1 0.42 0.21 50
National Cargo Bureau Inc. 2 1 50
Nippon Kaiji Kyokai NKK 512 4 2 0.78 0.39 50
Panama Bureau of Shipping PBS 1
Panama Maritime Documentation Services PMDS 1
Panama Register Corporation PRC 1
Panama Shipping Registrar Inc. 1
Polski Rejestr Statkow (Polish Register of Shipping) PRS 2Registro Italiano Navale RINA 121 1 0.83
Russian Maritime Register of Shipping RMRS 54
Turkish Lloyd 2
Shipping Register of Ukraine SRU 1
Vietnam Register of Shipping VRS 7
Phoenix Register of Shipping 3
Global Shipping Bureau GSR 1
Sing-Lloyd 1 1 100
Other 21

2 0 1 5 A B U J A M o U A N N U A L R E P O R T
15
Table 7 - Breakdown of Inspections 2012 - 2015
Tableau 7 - Répartition des Inspections 2012 - 2015
Year 2012 2013 2014 2015
Number of inspections without deficiencies
1966 3039 2737 2205
No. of inspections with deficiencies
108 173 179 143
No. of inspections with deficiencies but without detentions
100 161 165 134
No. of inspections with detentions
8 12 14 9
Number of inspections 2074 3211 2916 2348
Gambia PSCO in Engine Room Gambia PSCO Checking Documents in the Bridge
Gambia PSCO Checking Chart on the Bridge Ghana PSCO Inspecting Fire Water Hose Box
2 0 1 5 A B U J A M o U A N N U A L R E P O R T
16
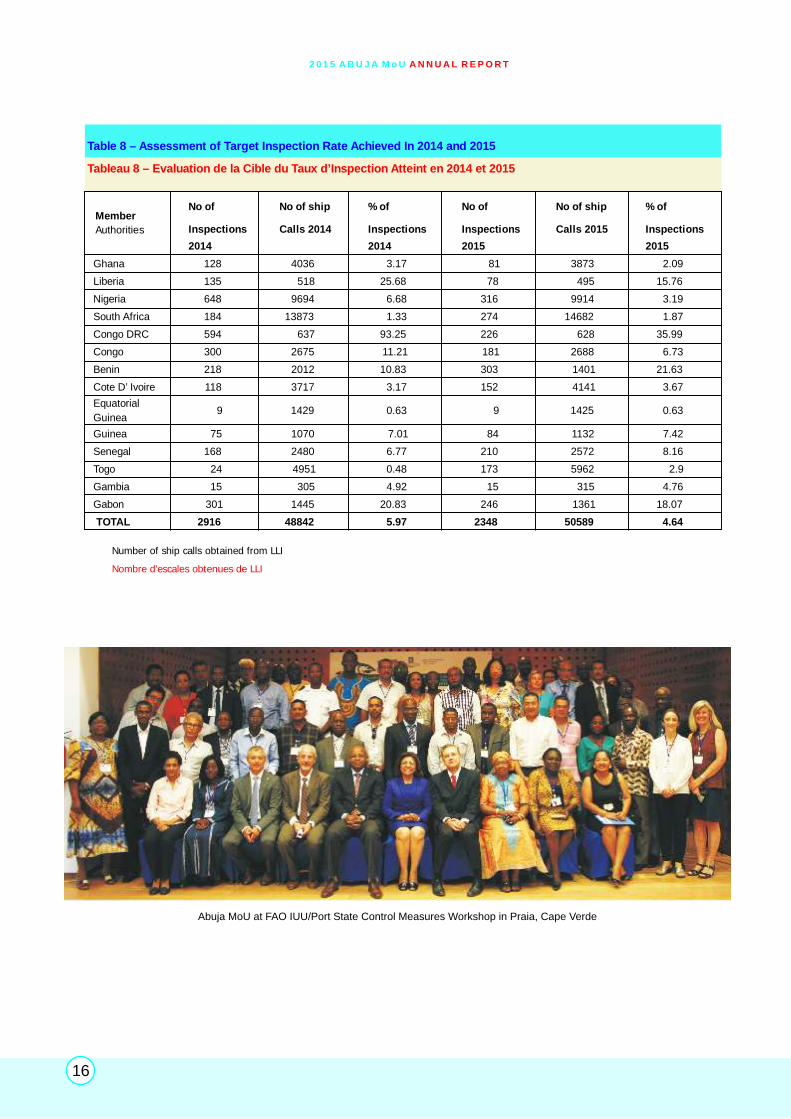
Table 8 – Assessment of Target Inspection Rate Achieved In 2014 and 2015
Tableau 8 – Evaluation de la Cible du Taux d’Inspection Atteint en 2014 et 2015
No of No of ship % of No of No of ship % of
Inspections Calls 2014 Inspections Inspections Calls 2015 Inspections
2014 2014 2015 2015
Ghana 128 4036 3.17 81 3873 2.09
Liberia 135 518 25.68 78 495 15.76
Nigeria 648 9694 6.68 316 9914 3.19
South Africa 184 13873 1.33 274 14682 1.87
Congo DRC 594 637 93.25 226 628 35.99
Congo 300 2675 11.21 181 2688 6.73
Benin 218 2012 10.83 303 1401 21.63
Cote D’ Ivoire 118 3717 3.17 152 4141 3.67
Equatorial
Guinea9 1429 0.63 9 1425 0.63
Guinea 75 1070 7.01 84 1132 7.42
Senegal 168 2480 6.77 210 2572 8.16
Togo 24 4951 0.48 173 5962 2.9
Gambia 15 305 4.92 15 315 4.76
Gabon 301 1445 20.83 246 1361 18.07
TOTAL 2916 48842 5.97 2348 50589 4.64
Member
Authorities
Number of ship calls obtained from LLI
Nombre d’escales obtenues de LLI
Abuja MoU at FAO IUU/Port State Control Measures Workshop in Praia, Cape Verde

2 0 1 5 A B U J A M o U A N N U A L R E P O R T
17
Congo DRC, 226
Benin, 303Republic of
Congo, 181
Cote
d'Ivoire, 152
Gabon, 246
Gambia, 15Ghana, 81Equatorial Guinea, 9
Guinea, 84
Liberia, 78
Nigeria, 316
Senegal, 210
South Africa, 274
Togo, 173
CHART 1: Ratio of Total Inspections
Diagramme 1: Ratio d’Inspections Total
CHART 2: Ratio of Inspections with Deficiencies
Diagramme 2: Ratio d’ Inspections avec Défectuosités
Cote d'Ivoire, 5
Gabon, 2
Gambia, 1
Ghana, 7
Nigeria, 60
Senegal, 20
South Africa, 48

2 0 1 5 A B U J A M o U A N N U A L R E P O R T
18
CHART 3: Total Inspections, Deficiencies and Detentions
Diagramme3: Inspections totales, Défectuosités et Immobilisation
2348
9
528
9
0
500
1000
1500
2000
2500
Inspections Deficiencies Detentions
Inspections Deficiencies Detentions
CHART 4:Total Inspections and number of Inspections with deficiencies
Diagramme 4: Nombre des Inspections et Nombre d’Inspections avec Défectuosités
2348
143
0
500
1000
1500
2000
2500
Inspections Inspections with Deficiencies
Inspections Inspections with Deficiencies

2 0 1 5 A B U J A M o U A N N U A L R E P O R T
19
Togo
Rep
ublic o
f Congo
Congo D
RC
Ben
in
Cote
d’Iv
oire
Gam
bia
Gab
on
Ghan
a
Seneg
al
Equatoria
l Guin
ea
Guin
ea
Liber
ia
Nig
eria
South A
fric
a
Togo
Rep
ublic o
f Congo
Congo D
RC
Ben
in
Cote
d’Iv
oire
Gam
bia
Gab
on
Ghan
a
Seneg
al
Equatoria
l Guin
ea
Guin
ea
Liber
ia
Nig
eria
South A
fric
a
CHART5: Number of Inspections with Detention Percentage
Diagramme 5: Nombre d’ Inspections avec Pourcentage d’Immobilisation
81
9
84 78
316
210
274
173
Inspections Detentions%
0
50
100
150
200
250
300
350
303
181
226
152
246
15 0% 0%1.43% 2.19%0%0%0%0%0%0%0%0%0%0%
0%
1%
1%
2%
2%
3%
0% 0% 0% 0% 0% 0% 0% 0% 0% 0% 0%
1.43%
2.19%
Detention%
CHART 6:Percentage of Detentions(Detentions as percentage of Total Inspections)
Diagramme 6: Pourcentage et d’Immobilisation (Immobilisations en pourcentage du nombre total d’inspections)
0%
2 0 1 5 A B U J A M o U A N N U A L R E P O R T
20
Saint K
itts
and N
evis
Saint V
ince
nt and th
e Gre
nadin
es
Sierra
Leone
Singap
ore
Slova
kia
South A
fric
a
Spain
Sri Lan
ka
Swed
en
Switz
erla
nd
Tanza
nia U
nited R
epublic
of
Thaila
nd
Togo
Turk
ey
Tuva
lu
Unite
d Kin
gdom
Unite
d Sta
tes
Vanuat
u
Vietn
am
Hong K
ong, Chin
a
India
Isle
of M
an (G
B)
Italy
Kiri
bati
Kore
a, R
epublic
of
Liber
ia
Latvi
a
Libya
n Ara
b Jam
ahiri
ya
Lithuan
ia
Luxem
bourg
Mal
aysi
a
Mal
ta
Mar
shal
l Isl
ands
Mold
ova, R
epublic
of
Mongolia
Net
herla
nds
Nig
eria
Norw
ay
Pakis
tan
Panam
a
Philippin
es
Portugal
Russ
ian F
eder
atio
n
Antig
ua an
d Bar
buda
Bah
amas
Ban
glades
h
Bar
bados
Bel
gium
Bel
ize
Ber
muda
(GB)
Cay
man
Isla
nds (G
B)
Cam
eroon
Chin
a
Com
oros
Cook
Isla
nds
Cura
cao
Cyp
rus
Den
mar
k
Dom
inic
a
Dom
inic
an R
epublic
Egypt
Equatoria
l Guin
ea
Faroe
Isla
nds
France
Gam
bia
Ger
man
y
Gib
ralta
r (GB)
Gre
ece
CHART 7:Flag State Performance Showing Inspections,Inspections with Deficiencies and Number of DeficienciesDiagramme 7: Performance des Etats Pavillons montrant les Inspections, Inspections avec Défectuosités et nombre de Défectuosités
109
91
93
4 28
16
1 1
14
28
136
10
36
2 1 1 1 4
18
19
19
33
28
1 1 2 2 1 16
1 1 2 1
13 12
2
22
4
21
72
17
5 3 28
0
20
40
60
80
100
120
Inspections Inspections with Deficiencies Deficiencies
167
5
1
25
59
3
3
1
339
4
8
25
2
147
292
4
1
58
2
32
1
289
7
20
3
1
2
25
4
6
16
2
3
24
1
2
12
3
3
102
8
20
46
12
17
100
3
9
0
50
100
150
200
250
300
350
400
Inspections Inspections with Deficiencies Deficiencies
7
27
21
1
161
1
1
1
16
2
13
4
4
4
20
2
19
5
23
9
1
1
7
1
1
1
1
1
1
1
7
3
14
18
1
12
4
1
1
3
1
17
0
20
40
60
80
100
120
140
160
180
Inspections Inspections with Deficiencies Deficiencies

2 0 1 5 A B U J A M o U A N N U A L R E P O R T
21
Liber
ia
Panam
a
Mar
chal
l Islan
ds
Baham
as
Luxe
mbou
rg
Singap
ore
Vanuat
u
Cypru
s
Mal
ta
Hon
g Kon
g, Chin
a
Nor
way
Antigua
and B
arbuda
China
Ital
y
Comor
os
Fran
ce
Mol
dova,
Rep
ublic o
f
Russ
ian F
eder
atio
n
Barbad
os
Belize
Cook
Isla
nds
Curaca
o
Dom
inica
Egyp
t
Gam
bia
Isle
of M
an (GB)
Saint
Kitts an
d Nev
is
Portu
gal
Sierr
a Le
one
Sri L
anka
Tanza
nia, U
nited R
epublic
of
Turk
ey
Togo
Tuva
lu
Unite
d Kin
gdom
Unite
d Sta
tes
CHART 9:Ratio of Inspections with Deficiencies by Ship Type
Diagramme 9: Ratio des Inspections avec Défectuosités par type de Navire
Bulk carrier, 42
Combination carrier, 0
Container, 7Chemical tanker, 7
Fish factory, 0
Gas carrier, 0
G.cargo/multipurpose, 22
Heavy Load, 0
High speed pass.craft, 0
MODU and FPSO, 0Offshore supply, 16
Oil tanker, 16
NLS tanker, 0
Passenger Ship, 3
Refrigerated cargo, 20
Ro-Ro cargo, 1
Special purpose ship, 0 Tugboat, 0
Vehicle carrier, 2 Woodchip carrier, 0
Other special Activities, 7
CHART 8: Inspections with Deficiencies by Flag
Diagramme 8: Inspections avec Défectuosités par Pavillon
1 1 1 1 1 1 1 1 1 1 1 1 1 1 1 1 1
25
24
16
8
7 7
6 6
5
4
3
2 2 2 2 2 2 2
10
5
10
15
20
25
30
Inspections with Deficiencies

2 0 1 5 A B U J A M o U A N N U A L R E P O R T
22
CHART 10: Number of individual Ships with Deficiencies Detected by Vessel TypeDiagramme 10: Nombre de Navires Individuels avec Défectuosités Détectées par type de navire
Oil
tanke
r
Bulk
car
rier
Com
binat
ion c
arrie
r
Conta
iner
Chem
ical
tanke
r
Fish fa
ctory
Gas
car
rier
G. c
argo/m
ultipurp
ose
Hea
vy L
oad
Hig
h spee
d pas
s.cr
aft
MODU a
nd FPSO
Offs
hore s
upply
Passe
nger S
hip
NLS ta
nker
Ref
riger
ated
car
go
Ro-R
o car
go
Specia
l purp
ose s
hip
Tugboat
Vehic
le c
arrie
r
Woodch
ip c
arrie
r
Oth
er s
pecia
l Act
iviti
es
158
0
2028
0 0
78
0
20
40
60
80
100
120
140
160
180
0
0
0
39
67
0
6
94
3
0
0
16
0
19
Deficiencies
South A
fric
a
Nig
eria
Seneg
al
Cote
d’Iv
oire
Ghan
a
Gab
on
Rep
ublic o
f Congo
Ben
in
Congo D
RC
Equatoria
l Guin
ea
Liber
ia
Guin
ea
Togo
CHART 11: Number of Deficiencies per InspectionDiagramme 11: Nombre de Défectuosités par Inspection
0 0 0 0 0 0 0
0.75
0.68
0.34
0.27
0.14
0.09
0.04
0
0.1
0.2
0.3
0.4
0.5
0.6
0.7
0.8
Deficiencies Per Inspections
Gam
bia

2 0 1 5 A B U J A M o U A N N U A L R E P O R T
23
Bulk
car
rier
Com
binat
ion c
arrie
r
Conta
iner
Chem
ical
tanke
r
Fish fa
ctory
Gas
car
rier
Oil
tanke
r
G. c
argo/m
ultipurp
ose
Hea
vy L
oad
Hig
h spee
d pas
s.cr
aft
MODU a
nd FPSO
Offs
hore s
upply
Passe
nger S
hip
NLS ta
nker
Ref
riger
ated
car
go
Ro-R
o car
go
Specia
l purp
ose s
hip
Tugboat
Vehic
le c
arrie
r
Woodch
ip c
arrie
r
Oth
er s
pecia
l Act
iviti
es
CHART 12:Performance by Ship Type Showing Inspections,Inspections with Deficiencies and Number of DeficienciesDiagramme 12: Performance par Type de Navire montrant les inspections, Inspections avec Défectuosités et Nombre de Défectuosités
0
100
200
300
400
500
600
700
800
Inspections Inspections with deficiencies Deficiencies
91
7 1733
137
201 2 7
94
3 16 192 3 2
85
346
2 12
158
16 16 339
67
6
732
1
328
81
1 12
397
427 7
22
158
20 28
78
CHART 13:Performance by Ship Type Showing Inspections with Deficiencies and Number of DeficienciesDiagramme 13: Performance par Navire montrant Inspections avec Defectuosités et Nombre de Défectuosités
0
20
40
60
80
100
120
140
160
180
Inspections with deficiencies Deficiencies
16 16
3
20
1 27
39
67
6
94
3
16 19
42
7 7
22
158
2028
78

2 0 1 5 A B U J A M o U A N N U A L R E P O R T
24
CHART 14: Inspections with Deficiencies and Total Inspections by Classification Society
Diagramme14: Inspections avec Défectuosités et Inspection Totale par Société de Classification
Am
eric
an B
ureau
of S
hippin
g
Bure
au S
ecurit
as
Det
Nors
ke V
erita
s
Bure
au V
erita
s
Chin
a Cla
ssifi
catio
n Soci
ety
NDV G
L AS
Fidev
avis
S.A
Ger
man
isch
er L
loyd
Inte
rnat
ional
Nav
al S
urvey
s Bure
au
Kore
an R
egis
ter o
f Ship
ping
Kore
a Cla
ssifi
catio
n Soci
ety
Lloyd
’s R
egis
ter
Nip
pon Kai
ji Kyo
kai
Panam
a M
ariti
me
Docu
men
tatio
n Ser
vice
s
Phoenix
Reg
iste
r of S
hippin
g
Polski
Rej
estr S
tatk
ow (P
olish R
egis
ter o
f...
Reg
istro It
alia
no Nav
ale
Reg
istro In
tern
acio
nal N
aval
, S.A
Shippin
g Reg
iste
r of U
krai
ne
Russ
ian M
ariti
me
Reg
iste
r of S
hippin
g
Rin
ave
Portugues
a
Sing-L
loyd
Vietn
am R
egis
ter o
f Ship
ping
Mar
itim
e Llo
yd L
td, G
eorg
ia
No c
lass
Oth
er
306
1
45
294
438
1 3 2
101
835
1 1 1 4 3 1201 2 15 19 2 1 5 1 7 1 31
373
101
167
132
1
292
1626 24
6 13 3 1 10 30
50
100
150
200
250
300
350
400
450
500
Inspections Inspections with deficiencies
CHART 15: Ratio of Inspections with Deficiencies by Classification SocietyDiagramme 15: Ratio des Inspections avec Défectuosités par Classe
American Bureau of Shipping, 26
Bureau Securitas, 0
Bureau Veritas, 24
China Classification Society, 6
Det Norske Veritas, 13
DNV GL AS, 3
Fidevavis S.A, 1
Germanischer Lloyd, 10
International Naval Surveys Bureau, 3
Korea Clasification Society, 1
Korean Register of Shipping, 2
Lloyd's Register, 15
Nippon Kaiji Kyokai, 19
Panama Maritime Documentation Services, 0
Phoenix Register of Shipping, 2
Polski Rejestr Statkow (Polish Register of Shipping), 1
Registro Italiano Navale, 5
Registro Internacional Naval, S.A, 1
Russian Maritime Register of Shipping, 7
Rinave Portuguesa, 0
Shipping Register of Ukraine, 0
Sing-Lloyd, 1
Vietnam Register of Shipping, 0
Maritime Lloyd Ltd, Georgia, 0
No class, 0Other, 3

2 0 1 5 A B U J A M o U A N N U A L R E P O R T
25
CHART16:Detentions and Inspections with Deficiencies by Classification Society
Diagramme 16: Immobilisation et Inspection avec Défectuosités par Société de Classification
Vietnam Register of Shipping
Sing-Lloyd
Shipping Register of Ukraine
Russian Maritime Register of Shipping
Rinave Portuguesa
Registro Italiano Navale
Registro Internacional Naval, S.A
Polski Rejestr Statkow (Polish Register of Shipping)
Phoenix Register of Shipping
Panama Maritime Documentation Services
Other
No class
Nippon Kaiji Kyokai
Maritime Lloyd Ltd, Georgia
Lloyd's Register
Korean Register of Shipping
Korea Clasification Society
International Naval Surveys Bureau
Germanischer Lloyd
Fidevavis S.A
DNV GL AS
Det Norske Veritas
China Classification Society
Bureau Veritas
Bureau Securitas
American Bureau of Shipping
Inspections with Deficiencies Detentions
1
4
1
1
1
1
1
7
5
1
1
2
3
19
15
2
1
3
10
1
3
13
6
24
26

2 0 1 5 A B U J A M o U A N N U A L R E P O R T
26
CHART 17: RO Related Detention Percentage
Diagramme 17: RO Relative au Pourcentage d'immobilisation
Bureau Veritas, 0.21% Lloyd's Register,
0.21%
Nippon Kaiji Kyokai, 0.39%
C H A R T 1 8 : I n s p e c t i o n s C o m p a r e d t o C o m m i t m e n t s i n 2 0 1 5D I A G R A M M E 1 8 : I n s p e c t i o n s C o m p a r é e s a u x E n g a g e m e n t s 2 0 1 5
Benin Congo Congo DRC Cote D’ Ivoire
EquatorialGuinea
Gabon Gambia Ghana Guinea Liberia Nigeria Senegal South Africa Togo
Inspections 303 181 226 152 9 246 15 81 84 78 316 210 274 173
Commitments 210.15 403.2 94.2 621.15 213.75 204.15 47.25 580.95 169.8 74.25 1487.1 385.8 2202.3 894.3
0
500
1000
1500
2000
2500

2 0 1 5 A B U J A M o U A N N U A L R E P O R T
27
Benin, 12.9
Congo, 7.71
Congo DRC, 9.63
Cote D’ Ivoire, 6.47
Equatorial Guinea, 0.38
Gabon, 10.48
Gambia, 0.64Ghana, 3.49
Guinea, 3.58
Liberia, 3.32
Nigeria, 13.46
Senegal, 8.94
South Africa, 11.67
Togo, 7.37
CHART 19: Inspection Efforts of Member States as Percentage of MoU Total
DIAGRAMME 19: Efforts d’Inspection des Etats membres au Pourcentage Total du MoU
Benin PSCOs Checking Expiry Date on Fire Extinguisher.

2 0 1 5 A B U J A M o U A N N U A L R E P O R T
28
STRUCTURE OF ABUJA MoU
MaritimeAdministrations
ObserversIMO, ILO,
MoUsIntersessional Management
Working GroupISMWG
Owners, Operators, FlagStates, Classification
Societies, Ros
Ship InspectionDepts of Amou
Members States
MinisterialConference
Bureau
Abuja MoUInformation
System
Abuja MoUSecretariat
Technical WorkingGroups
Abuja MoU Port StateControl Committee
2 0 1 5 A B U J A M o U A N N U A L R E P O R T
29
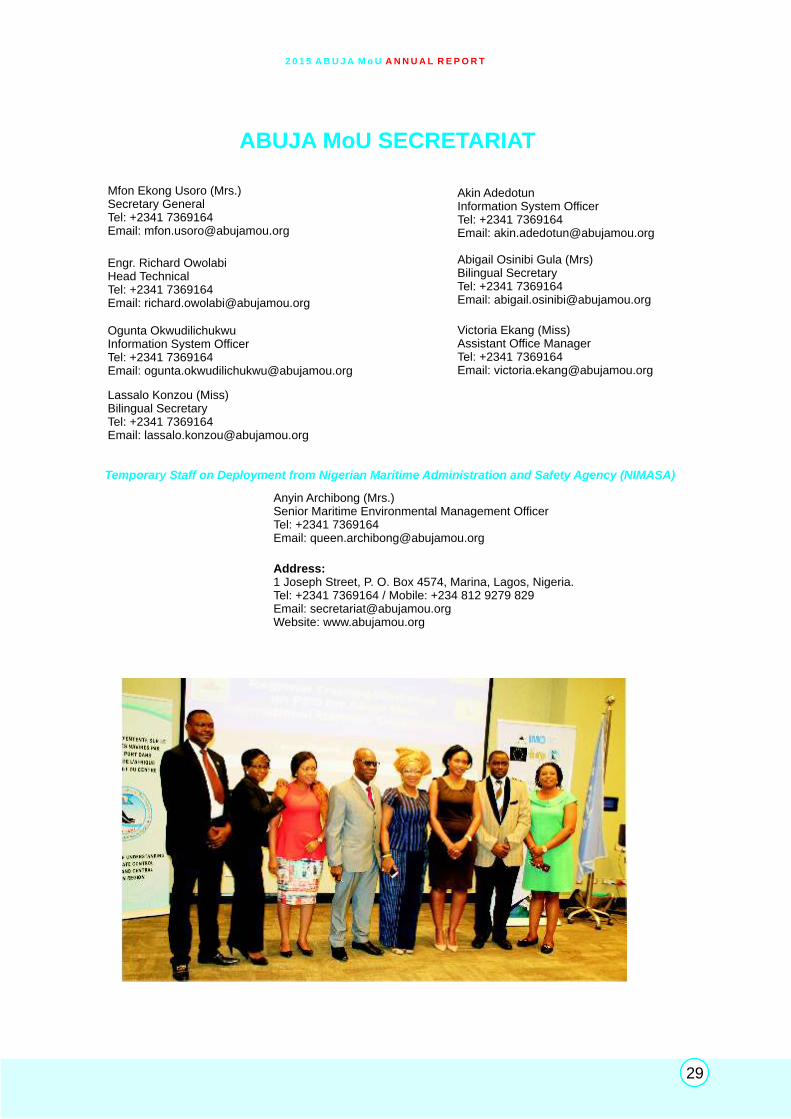
ABUJA MoU SECRETARIAT
Mfon Ekong Usoro (Mrs.)Secretary GeneralTel: +2341 7369164Email: [email protected]
Ogunta OkwudilichukwuInformation System OfficerTel: +2341 7369164Email: [email protected]
Address:1 Joseph Street, P. O. Box 4574, Marina, Lagos, Nigeria.Tel: +2341 7369164 / Mobile: +234 812 9279 829Email: [email protected]: www.abujamou.org
Temporary Staff on Deployment from Nigerian Maritime Administration and Safety Agency (NIMASA)
Engr. Richard OwolabiHead TechnicalTel: +2341 7369164Email: [email protected]
Akin AdedotunInformation System OfficerTel: +2341 7369164Email: [email protected]
Abigail Osinibi Gula (Mrs)Bilingual SecretaryTel: +2341 7369164Email: [email protected]
Victoria Ekang (Miss)Assistant Office ManagerTel: +2341 7369164Email: [email protected]
Lassalo Konzou (Miss)Bilingual SecretaryTel: +2341 7369164Email: [email protected]
Anyin Archibong (Mrs.)Senior Maritime Environmental Management OfficerTel: +2341 7369164Email: [email protected]

ANNUEL RAPPORT
2015
UJ oAB A M U
MEMORANDUM D’ENTENTE SUR LECONTROLE DES NAVIRES PAR L’ETATDE PORT POUR LA REGION DEL’AFRIQUE DE L’OUEST ET DU CENTRE

Cape Verde
GuineaBissau
Countries in the Region who are not full members: Liberia, Equatorial Guinea,
Cameroon, Congo DRC, Mauritania, Namibia

TABLE SES MATIÈRES
MOT DE LA SECRETAIRE GENERALE
STATISTIQUES DES VISITES D’INSPECTION DU CONTROLE DES
NAVIRES PAR L’ETAT DU PORT DE L’ANNEEE 2015
ADMINISTRATION MARITIME DU BENIN PROFIL DU PAYS
3
2 0 1 5 A B U J A M o U A N N U E L R A P P O R T

ALLOCUTIONS DE LA SECRÉTAIRE GÉNÉRALE
2 0 1 5 A B U J A M o U A N N U E L R A P P O R T
4
n 2010, les États membres présents à la ème ème2 Conférence Ministérielle et á la 7
Réunion du Comite du CNEP ont élaborés Eun Plan d'Action pour revitaliser un MoU
aboulique. Le Secrétariat sous la conduite d'un
nouveaux dirigeant s'était fixé les tâches
spécifiques : (i) prendre toutes les mesures
nécessaires pour implémenter le Plan d'Action du
MoU d'Abuja, reformer le Secrétariat, mettre en ème
œuvre les lignes directrices de la 7 réunion du
Comité pour revitaliser le MoU d'Abuja ; (ii) et
faire accroitre l'adhésion des Etats membres au
MoU etc. Sous la direction avisée du Président du
MoU d'Abuja, S.E.M le Ministre Délégué chargé
de la Marine Marchande du Congo, et la
participation active des administrations des Etats
membres, nous étions en mesure de réaliser nos
activités en quatre ans. Le nombre des États
membres a augmenté de 16 (seize) membres a
part entière et actifs. Les inspections régulières
de contrôle des navires et les rapports sont
éffectués par 14 administrations membres. Le
MoU d'Abuja est devenu un MoU performant en
dépit du manque de support financier de certains
États membres.
La performance des États membres du MoU
d'Abuja pour l'année sous revue montre une
grande compréhension et notre engagement à
améliorer le niveau de sécurité dans la navigation
maritime, l'environnement marin et la sécurité
des officiers à bord des navires et l'équipage.
Dans l 'année en exerc ice, p lus ieurs
administration ont entamés le nouveau régime
d'inspection par le OCNEP du MoU d'Abuja. Le
Système d'Information du MoU d'Abuja (AMIS)
accueilli par le Centre d'Information CNEP/FSC de
la Fédération Russe à Moscou, a été amélioré
avec succès pour faciliter la mise en œuvre du
nouveau régime d'inspection à travers le système
de ciblage automatisé.
En 2013, nous avons introduit le profil des
Secrétaire GénéraleMFON EKONG USORO (Mrs)
administrations performantes dans notre rapport
annuel. Cette année, le profil de l'Administration
Maritime de la République du Benin est inséré dans ce
rapport annuel. Le Benin, la République Démocratique
du Congo, le Gabon, et le Liberia ont pu atteindre un
pourcentage de 15% des inspections des navires en
escales dans leurs Ports respectifs.
Il a été enregistré un accroissement réel de 39% en
nombre d'inspections comparativement au bilan de
2014. L'Administration Maritime du Benin a bénéficiée
du programme de Formation Nationale des OCNEPs
sur le Manuel des inspecteurs et AMIS.
Étant donné le degré d'harmonisation des activités du
contrôle des navires dans la région, les
administrations des Etats membres devraient
participer aux Campagnes d'Inspections Renforcées,
qui a prouvé être un instrument effectif pour
l'éradication des navires sous-normes dans d'autres
MOU régionaux. Alors que nous nous joignons aux
autres MoUs dans cette campagne, l'année 2016
verra la première CIC dans notre région.
MFON EKONG USORO (Mme)
Secrétaire Générale

Les OCNEPs du Ghana Inspectant les Certificats et Documents des Navires
Ce rapport présente le résultat des visites d'inspections de Contrôle des Navires par l'Etat du Port éffectuées par 14 Etats membres dans la région du MoU d'Abuja à savoir : le Bénin; la République du Congo, la République Démocratique du Congo, la Côte d'Ivoire, la Guinée équatoriale, le Gabon, la Gambie, le Ghana, la Guinée, le Libéria, le Nigéria, le Sénégal, l'Afrique du Sud et le Togo. Les r é s u l t a t s d e s s t a t i s t i q u e s d'inspections (CNEP) de ce rapport ont été entièrement générés à partir de la base de données du Centre d u S y s t è m e d'Information du MoU d'Abuja (AMIS). Au cours de l'année en exercice, 2.348 navires ont été visités par quatorze (14) E t a t s m e m b r e s malgré les défis rencontrés dans la région à la suite de l'épidémie de fièvre du Virus Ébola. Au cours de l'année, Neuf (9) navires ont été consignés pour défectuosités donnant ainsi un taux en baisse de 35,71% de détention par rapport à celui de 2014 qui était de quatorze (14%). Le pourcentage de détention par inspection de 0, 38% en 2015 montre une baisse de 0,1%, ce qui est inferieur á celui de 2014 qui était de 0,48%. Sur 4,5 inspections, il n'ya qu'une défectuosité ; une petite réduction par rapport en 2014 qui était de 4,8. La région a enregistrée une baisse de 19,5% des inspections de 2.916 en 2014 d'où 14 administrations ont soumis des rapports, á 2.348 inspections en 2015 avec le même nombre d'Administration.
LES STATISTIQUES DES VISITES D'INSPECTIONS DU CONTROLE DES NAVIRES PAR L'ETAT DU PORT DE L'ANNEE 2015
2 0 1 5 A B U J A M o U A N N U E L R A P P O R T
En 2015, un total de 528 déficiences a été enregistré et le nombre total d'inspections présentant des défectuosités était de 143, une réduction respectivement de 609 à 179 mais le pourcentage du nombre des déficiences par inspection est resté identique à celui de 2014. Il a été enregistré en 2015, une importante défectuosité sur les documents et les certificats d'équipages/navires qui s'élevait 58
(11%) des 5 2 8 , l a Sécurité de l a Navigation de 38 (7,2 % ) , 3 5 (6,6%) pour les mesures d e l u t t e c o n t r e Incendie, 26 (4,9 %) au niveau des Equipements R a d i o suivie par l e s équipement
s de sauvetage de 20 (3,8%). Il convient de noter qu'une sur neuf défectuosités enregistrée était due aux faux documents et Certificats des navires. La sécurité de navigation qui constitue 7% de l'ensemble des défectuosités enregistrées est la grande défectuosité enregistrée sous la Convention SOLAS, suivie directement par les mesures de lutte contre incendie.
Vingt-un (21) différents types de navires ont été inspectés en 2015. Les vraquiers viennent en première position avec 31% de différents navires i n s p e c t é s , e n s u i t e l e s n a v i r e s conventionnels/polyvalent avec 17%, les pétroliers 15% tandis que les porte-conteneurs sont de 14%. Au total 328 inspections ont été réalisées sur les quatre dit navires et représentent les quatre premiers types de navires les plus inspectés. .
5

Cent quarante - trois (143) inspections effectuées ont générées 528 défectuosités. Ces déficiences comprennent: certificats de navires/d'équipage -11%, la convention de SOLAS -34%, la Convention MARPOL – 4,5%, la Convention STCW - 2,7 %; la Convention Internationale sur les lignes de charge - 3 %; l'OIT - 6,4 %. De tous les instruments pertinents couverts par les CNEP du MoU d'Abuja, SOLAS se classe toujours en tête avec 34% de toutes les défectuosités enregistrées. Le nombre de d'immobilisation a diminué de 9 contre 14 en 2014. 56% des immobilisations ont été enregistrées du côté des Vraquiers, les Cargos Réfrigérés 33.3% et les Cargos Polyvalents/fret General 11%.
Au total, le pourcentage de rendement des inspections par les Etats membres au cours de l'année 2015 est de 4,6%, ce qui est très inferieur à l'objectif fixé qui est de 15% pour la région et plus moins que l'année précédente de 6,0%. Seul quatre Etats membres dont le Benin, la République Démocratique du Congo, le Gabon et le Liberia ont été en mesure de réaliser les inspections de 15% des escales des navires dans leurs ports respectifs en 2015 comparativement à trois pays en 2014 ; montrant ainsi un léger progrès des Etats membres à atteindre le taux d'inspection ciblé. Des six Etats membres (le Benin, la Côte d'Ivoire, la Guinée, le Sénégal, l'Afrique du Sud et le Togo) qui ont enregistrés
une augmentation numérique en inspections de CNEP en 2015, donnant ainsi une augmentation de 50% par rapport a 2014, seul le Benin s'est démarqué en dépit de la baisse des escales des navires de 2.012 a 1.401 (30% de réduction), les inspections ont augmentées de 39%, de 218 á 303.
2015 est une année au cours de laquelle plus de cinquante pour cent (50%) des Administrations Maritimes (8) qui ont effectuées des Inspections de CNEP et ont envoyées les résultats des contrôles directement dans la base de donnée du MoU d'Abuja. Les six autres restantes continuent de scanner et les envoient par email, ou font des photocopies qu'ils envoient au Secrétariat par courrier afin que le personnel les saisissent dans la base de donnée. Les Etats membres qui font entrer les rapports d'inspections directement sont : le Benin, la Cote d'Ivoire, la Gambie, le Liberia, le Nigeria et le Sénégal. Le Secrétariat encourage les autres Administrations des Etats membres à faire autant. J'ai espoir que les huit jours de formation régionale des OCNEP tenues au cours du premier trimestre 2016, vont ranimer le progrès contant des performances observées depuis 2010.
6
Inspection de CNEP sur le pont d’un Navire-citerne
2 0 1 5 A B U J A M o U A N N U E L R A P P O R T

2 0 1 5 A B U J A M o U A N N U E L R A P P O R T
7
a République du Bénin a une superficie de
114.763 km² et est située en Afrique de Ll'Ouest, dans le Golfe de Guinée. Elle s'ouvre
sur l'Océan Atlantique par un littoral de 125 km
délimitée à l'ouest par sa frontière avec le Togo, à
l'est par sa frontière avec le Nigéria. Le littoral
béninois est plus ou moins linéaire et interrompu en
deux endroits à savoir: la bouche du Roy et
l'embouchure du chenal de Cotonou.
Le Bénin ne dispose d'aucune flotte de navires de
commerce. Un seul navire sous pavillon béninois
était en service dans les années 1980 mais a été
vendu.
Une flottille de pêche artisanale importante dans la
bande des 5 milles, zone réservée à la pêche
artisanale y démontre le dynamisme de l'activité
commerciale.
La capitale économique du Bénin, Cotonou, est
située sur le cordon littoral entre le Lac Nokoué et
l'Océan Atlantique.
Le port de Cotonou, seul port de commerce du
Bénin, a enregistré 2033 escales de navires en 2014,
un trafic en progression de 31,31% par rapport à
l'année précédente. Il dessert des pays sans littoral,
UN PORT DE COMMERCE TRES ACTIF
ADMINISTRATION MARITIME DU BENIN PROFIL DU PAYS
tels que le Niger et le Burkina Faso. Il est le
premier port de transit de la République du
Niger. Les ports de Lagos (NIGERIA) et de
Lomé (TOGO) sont respectivement à 115 km
et 135 km. Les types de navires reçus au port
de Cotonou sont principalement des porte-
conteneurs (50% des navires), des navires
rouliers (23%), les tankers (11%) et les
cargos de divers (6%).
Une part importante de ces navires effectue
des lignes régulières avec l'Europe ou
l'Amérique.
Le manque de place à quai oblige souvent les
navires à devoir attendre au mouillage.
La Direction de la Marine Marchande (DMM)
est chargée de l'ensemble des attributions
habituelles relatives à la certification de
sécurité des navires, de la délivrance des
brevets, du contrôle des navires par l'Etat du
port, de l'organisation des services attendus
de l'Etat côtier. La DMM est créée par décret
n° 172/PR/MTPTPT/ du 18 juin 1968. Elle est
organisée à cet effet en 4 services par
l ' a r r ê t é a c t u a l i s é n °
067/MEMIP/DC/SGM/DMM/SA du 09
décembre 2015. Ses effectifs ayant été
décimés en quantité par les restrictions
budgétaires et en qualité par plusieurs
départs à la retraite, elle n'est pas
aujourd'hui en mesure de faire face
facilement à ses missions décrites par le
même arrêté.
La pénurie la plus criante est le manque
d'inspecteurs qualifiés selon les exigences de
l'OMI.
Toutefois, pour le contrôle des navires par
l'Etat du port ils se font appuyés au besoin de
professionnels avertis, dans un cadre de
partenariat.
ORGANISATION ET MOYENS DE
L'ADMINISTRATION
OCNEPs du Benin Devant la Facade du Bureau

8
RATIFICATION DES
CONVENTIONS
DEFIS
Le Bénin a ratifié toutes les conventions de base de l'OMI: SOLAS et LL66, sans toutefois avoir ratifié leur protocole de 1988; COLREG, MARPOL, STCW, Tonnage 69. Il est de plus l'un des pays qui ont ratifié la convention MLC 2006 avant même son entrée en vigueur.
Afin d'éradiquer les défis rencontrés par les Officiers en charge de Contrôle des Navires par l'Etat du Port, les exigences suivantes s'avèrent inévitables.
Une équipe de 4 inspecteurs qualifiés couvrirait convenablement les besoins du pays. L'objectif
de constituer cette équipe, en mettant à niveau les inspecteurs existants, et de la pérenniser, doit être considéré comme un objectif majeur.Les visites effectuées au titre de l'Etat du pavillon dont les trois remorqueurs, une cinquantaine de navires de plaisance dont la plupart sont des jet-skis, les pirogues qui ne seront pas à moyen terme l'objet de visites de sécurité proprement dites.
Les contrôles effectués sur quelques navires de pêche nigérians licenciés au Bénin ne sont pas de nature à nourrir l'expérience requise pour obtenir le professionnalisme qu'on attend des contrôleurs de l'Etat du port.
2 0 1 5 A B U J A M o U A N N U E L R A P P O R T
OCNEPs du Benin v rifiant la date d’expiration de l’extincteuré

PO
UR
LE
SATIS
TQ
T L
E T
AB
AU
X,
ST
IU
ES
E
S
LE
RE
ER
E-V
S A
UX P
AG
E 8
27
F
ZO
U
S A
LA
VER
ION
AN
GLA
IS
DE
S
E