Motilal Oswal Financial Services - AceAnalyser Call/132892_20170131.pdf31 Dec 2016 Welcome to the Q3...
21
31 Dec 2016 Motilal Oswal Financial Services ConCall Summary & Earnings Release Quarter ended Dec 2016 31 Jan 2017 Motilal Oswal Financial Services Limited (MOFSL) posted consolidated revenues of Rs 4.6b for Q3FY17, up 54% YoY. PAT was Rs 0.9b for Q3FY17, up 78% YoY. Broking- related revenue was Rs 1.6b in Q3FY17, up 18% YoY. Asset management revenue was Rs 945m in Q3FY17, up 56% YoY. Housing finance-related revenue was Rs 1.5b in Q3FY17, up 143% YoY. Investment banking income was up 306% YoY in Q3FY17 to Rs 148m. Fund-based revenue was Rs 354m in Q3FY17, up 2% YoY. For a deeper insight into the company's performance and the management's expectations, we present extracts from the post-results conference call. We have edited and rearranged the transcript for greater lucidity. We have also included exhibits from the company's presentation on its performance for the quarter ended Dec 2016. This presentation is available at www.motilaloswalgroup.com Corporate Participants Mr Motilal Oswal Chairman Mr Raamdeo Agrawal Joint Managing Director Mr Navin Agarwal Managing Director Mr Sameer Kamath Chief Financial Officer This document includes forward looking statements, including discussions about the management's plans and objectives and about expected changes in revenues and financial conditions. Forward-looking statements about the financial condition, results of operations, plans and business are subject to various risks and uncertainties that could cause actual results to differ materially from those set forth in this document. You should not construe any of these statements as assurances of financial performance or as promises of particular courses of action.
Transcript of Motilal Oswal Financial Services - AceAnalyser Call/132892_20170131.pdf31 Dec 2016 Welcome to the Q3...

31 Dec 2016
Motilal Oswal
Financial Services
ConCall Summary & Earnings Release
Quarter ended Dec 2016 31 Jan 2017
Motilal Oswal Financial Services Limited (MOFSL) posted consolidated revenues of Rs
4.6b for Q3FY17, up 54% YoY. PAT was Rs 0.9b for Q3FY17, up 78% YoY. Broking-
related revenue was Rs 1.6b in Q3FY17, up 18% YoY. Asset management revenue was
Rs 945m in Q3FY17, up 56% YoY. Housing finance-related revenue was Rs 1.5b in
Q3FY17, up 143% YoY. Investment banking income was up 306% YoY in Q3FY17 to
Rs 148m. Fund-based revenue was Rs 354m in Q3FY17, up 2% YoY.
For a deeper insight into the company's performance and the management's expectations,
we present extracts from the post-results conference call. We have edited and rearranged
the transcript for greater lucidity. We have also included exhibits from the company's
presentation on its performance for the quarter ended Dec 2016. This presentation is
available at www.motilaloswalgroup.com
Corporate Participants
Mr Motilal Oswal
Chairman
Mr Raamdeo Agrawal
Joint Managing Director
Mr Navin Agarwal
Managing Director
Mr Sameer Kamath
Chief Financial Officer
This document includes forward looking statements, including discussions about the management's plans and objectives and about expected changes
in revenues and financial conditions. Forward-looking statements about the financial condition, results of operations, plans and business are subject to
various risks and uncertainties that could cause actual results to differ materially from those set forth in this document. You should not construe any
of these statements as assurances of financial performance or as promises of particular courses of action.

31 Dec 2016
Welcome to the Q3 FY17 earnings conference call of Motilal Oswal Financial
Services Limited. We have with us Mr. Motilal Oswal, Chairman, Mr Raamdeo
Agrawal, Joint Managing Director, Mr Navin Agarwal, Managing Director, and Mr.
Sameer Kamath, Chief Financial Officer. For the duration of this presentation, all
participants’ lines will be in the listen-only mode. I will be standing by for the Q&A
session. I would now like to invite Mr. Navin Agarwal to make his opening remarks.
Thank you and over to you sir….
MOFSL CONSOLIDATED FINANCIALS (Rs Mn)
Q3
FY17
Q3
FY16
CHG.
YoY
Q3
FY17
Q2
FY17
CHG.
QoQ
9M
FY17
9M
FY16
CHG.
YoY FY16
Total Revenues 4,555 2,959 54% 4,555 4,608 -1% 12,813 7,769 65% 10,937
EBITDA 2,617 1,301 101% 2,617 2,259 16% 6,732 3,040 121% 4,463
Exceptional items 0 0 nm 0 429 nm 540 0 nm 0
PBT 1,228 715 72% 1,228 1,486 -17% 3,777 1,700 122% 2,376
PAT 891 501 78% 891 1,016 -12% 2,698 1,219 121% 1,691
EPS - Basic 6.2 3.5 6.2 7.1 18.8 8.6 11.9
EPS - Diluted 6.1 3.5 6.1 7.0 18.6 8.4 11.7
Shares O/S (mn) - FV 144 142 144 143 144 142 142
REVENUE COMPOSITION (Rs Mn)
Q3
FY17
Q3
FY16
CHG.
YoY
Q3
FY17
Q2
FY17
CHG.
QoQ
9M
FY17
9M
FY16
CHG.
YoY FY16
Brokerage & operating
income 1,571 1,328 18% 1,571 1,858 -15% 4,860 3,825 27% 5,091
Investment banking fees 148 36 306% 148 202 -27% 432 158 173% 242
Asset management fees 945 607 56% 945 854 11% 2,451 1,589 54% 2,235
Fund based income 354 348 2% 354 194 82% 1,007 877 15% 1,127
Housing finance related 1,525 627 143% 1,525 1,482 3% 4,010 1,287 212% 2,195
Other income 12 12 5% 12 18 -32% 53 32 66% 47
Total Revenues 4,555 2,959 54% 4,555 4,608 -1% 12,813 7,769 65% 10,937
Opening remarks
Good afternoon. It is my pleasure to welcome all of you to the Motilal Oswal
Financial Services earnings call for the 3rd quarter of FY17. All in all, our strategy
of revenue diversification continued to bear fruit through this quarter, with the
revenue model further balancing towards the Housing finance & Asset Management
segments. During this call, I will share the performance of each one of these value-
drivers in this quarter.
During 3QFY17, our consolidated revenues were Rs 4.6b, up 54% YoY. This was
Rs 12.8b in 9MFY17, up 65% YoY
Revenue growth in 3QFY17 was led by Housing finance, up 143% YoY & Asset
Management, up 56% YoY, followed by Capital Markets (broking, investment
banking & wealth, up 26% YoY. Our revenue pie is becoming more balanced with
the asset businesses getting critical mass, housing finance business scaling up as per
plan, and broking continuing to maintain market share. Asset sales continue at a
good pace, both for the distribution and the asset management businesses. In terms

31 Dec 2016
of the mix, Housing finance comprised ~33% of consolidated revenue in 3QFY17 vs
~21% in 3QFY16 while asset management was ~21% in 3QFY17, same as 3QFY16.
Capital market businesses comprised ~38% in 3QFY17 vs ~46% in 3QFY16.
Consolidated PAT was Rs 0.9b in 3QFY17, up 78% YoY. It was Rs 2.7b in
9MFY17, up 121% YoY
Profits from all segments grew strongly in 3QFY17. The stability offered by
Housing finance & Asset Management segments is complemented with upside
offered by Capital Markets. Housing finance was up 82% YoY, Asset & Wealth
management was up 43% YoY & Capital market businesses (broking & investment
banking) were up 264% YoY. While some impact of operating leverage is becoming
visible as margins expanded (20% in 3QFY17 vs 17% in 3QFY16), ample scope still
exists in our asset management and capital markets businesses.
In the PAT mix, contribution of Capital Markets businesses (Broking and Investment
Banking) was ~33% in 3QFY17 vs ~16% in 3QFY16. Asset & Wealth Management
was ~18% of profits in 3QFY17 vs ~22% in 3QFY16. Housing Finance was ~19%
in 3QFY17, same as in ~3QFY16. Fund based business was ~30% in 3QFY17 vs
~43% in 3QFY16
Consolidated net worth was Rs 17b & gross borrowing was Rs 46b, as of Dec 2016.
The strong liquidity in the Group’s balance sheet (~Rs 8.2b) allows us to fund
investments into Aspire Home Finance
Annualized ROE for YTD FY17 is 23% on reported PAT vs 12% in FY16, in line
with our strategy to generate 20%+ sustainable ROE. However, this does not include
the MTM unrealized gains on investments in our Motilal Oswal mutual fund
products (Rs 1.9b, as of Dec 2016)
The Board declared an interim dividend of Rs 2.5 per equity share (Face value of Rs
1 per equity share)
1. Starting with the Capital Market businesses
Broking & related revenues (broking & wealth management) were Rs 1.6b in
3QFY17, up 18% YoY. This quarter saw a moderation in market cash volumes and
further shift in market volumes towards F&O. As a result our blended equity market
share dipped to 1.9% in 3QFY17 from 2.3% in 3QFY16. However, our market share
in the high-yield cash segment remains strong, both on a YoY & QoQ basis. Our
blended yield in Q3FY17 was 3.1 bps vs 3.8 bps in Q3FY16
In Retail Broking & Distribution, with our new technology platforms evincing
deeper client interest, our online business continued to grow. Online business formed
44% of retail volumes in 3QFY17 vs 31% in 3QFY16. Mobile app continued to
grow within the online volumes, from 10% in 3QFY16 to 19% in 3QFY17. Our
monthly addition of retail clients grew at a brisk 52% YoY. The slight slowdown in
cash volumes in December looks temporary as January has seen a comeback. Our
asset sales continued unabated, and our financial products AUM were up 73% YoY.
Our MF SIP distribution picked up significantly. The growth potential in this space
still remains immense
In Institutional Broking, our new thematic research products are evincing increased
client interest. The share of blocks continues to hold steady in our volumes

31 Dec 2016
Investment Banking fees were Rs 148m in 3QFY17, up 306% YoY. Our IB
business continued its momentum it has built over the past few quarters. It concluded
some ECM transactions and filed DRHP for 4 companies with SEBI. It also
announced a large cross-border M&A transaction. These transactions are part of our
pipeline with revenues expected in the coming quarters
Capital markets businesses contributed ~38% of consolidated revenues in 3QFY17
vs ~46% in 3QFY16. The contribution of capital markets in the PAT mix was ~33%
in 3QFY17, from ~62% way back in FY15
2. Asset and Wealth management businesses have seen strong business traction. Total
AUM/AUA across mutual funds, PMS, AIF & PE were Rs 186b, up 49% YoY.
Wealth Management AUM was Rs 91b, up 49% YoY.
In Asset Management, our net inflows increased this quarter as we deepened our
distributor relationships and the shift in savings pool towards financial savings
continued, and in fact received a boost due to demonetization. Our net inflows this
quarter were Rs 15 billion vs Rs 11 billion each in 2QFY17 and 3QFY16. Our
QGLP philosophy continues to deliver on performance. Our rank in Equity AUM
improved to 10, from 12 a year ago. We spent an incremental Rs 78 million in
advertising/marketing this YTD on a YoY basis and this should help boost brand-
recall in the long term. Our market share in Equity MF Avg AUM was ~1.2% this
YTD while our market share in Equity MF Net Sales was much higher at ~3.1%. As
this business grows further, we believe the AUM market share should converge
towards that of net sales. Our flagship MF product, F-35, will finish 3-year
performance track record in April 2017, which will likely enhance participation from
distribution channels. The continued shift towards financial savings products and our
expansion into the offshore market, which accounts for two-thirds of institutionally
managed equity assets, should fuel further growth for us
Private Equity manages Rs 31b across 2 growth capital & 3 real estate funds. The
PE business has demonstrated high profitability & the RE business has shown
significant scalability. The 1st growth fund has seen 6 full-exits & 2 partial exits in 2
companies, translating into ~201% capital returned. It is in advanced stages for 1
exit in coming months, which may allow it to return an additional ~14% capital. It is
likely to deliver a gross multiple of ~3.5X. The 2nd growth fund has committed
~89.5%. The 1st real estate fund has seen full/partial exits from 6 projects,
translating into ~88% capital returned. The 2nd real estate fund is fully deployed in
11 investments. It has secured 2 full exits and returned ~ 27% money to investors.
The 3rd real estate fund has raised commitments of ~Rs 8.8 billion so far, of which
~50% is committed in 7 investments
Asset Management fee (asset management & private equity together) were Rs 945m
in 3QFY17, up 56% YoY
It contributed ~21% of consolidated revenues during 3QFY17, same as in 3QFY16
In Wealth Management, November was one of our best months. Any delay in
clients’ investment decisions seen in December appears transitory & we expect the
flows to normalize from the next quarter. The traction in sales people and
improvement in RM productivity helped boost AUM. November was one of our best
months. Since the inclination to invest in financial assets remains high in India, we

31 Dec 2016
believe the flows should be brisk in the coming quarters. We continue to enjoy a
respectable yield of ~1% due to the higher share of equity & alternative products in
our AUM. This business offers enormous scope for scalability as it builds synergies
with the Group’s other businesses to deepen its reach
Contribution of Asset & Wealth Management in the Profit mix was ~18% in
3QFY17, up from ~14% back in FY15.
3. Aspire Home Finance
Aspire continues to build traction in network, assets & liabilities, while maintaining
risk & operational parameters
Housing finance related income was Rs 1.5b in 3QFY17, up 143% YoY
On the assets side, the loan book across ~36,000 families was Rs 33 billion, up
136% YoY. During the quarter, we consciously calibrated our disbursals, preferring
to wait-and-watch the market impact of demonetisation.
Our average yield has held at ~13.4% since the last 4 successive quarters
In terms of our network, our branch count doubled YoY to 84 across the existing 4
states.
On the liabilities side, ~53% borrowings were from NCD, ~31% from term loans &
~16% from CP. We had credit lines from 29 banks & 2 NBFCs vs 19 a year ago.
The average cost of borrowing raised cumulatively has been ~9.6%, while it was
~9.1% on the borrowings raised in this YTD. Our D/E ratio was 5.8x. Our ratings of
Crisil A+/Stable & ICRA AA- (Stable) augur well for future fund-raise
Cumulative capital infusion from sponsor is Rs 5 billion and net worth is Rs 6 billion
in Dec 2016. The strong liquidity in the Group’s balance sheet (~Rs 8.2b) allows us
to fund investments into Aspire, and our strategy to deploy free cash flows into
funding Aspire will continue in foreseeable future
We have invested significantly into Digitization initiatives to build long-term
operational and process improvements. We expect a large part of the total
transactions to be covered by our digital initiatives by March 2017.
The annualized ROA for 9MFY17 was ~2.6%, while ROE was ~15% and NIM was
~4.15%. Asset quality remains under control, with the GNPL at 0.6% as of Dec 2016
vs 0.3% in Sep 2016 and this number is without using the NHB relaxation in NPL
recognition norms
Housing Finance contributed ~33% of consolidated revenues in 3QFY17, as
compared to ~21% in 3QFY16. The contribution of Housing Finance in the profit
mix was ~19% in 3QFY17, up from ~2% back in FY15
4. Fund based activities focuses on enhancing Return on Equity
Fund Based Income was Rs 354m in 3QFY17, up 2% YoY.
Our investments in our mutual fund products stood at Rs 6.3b (at cost). The
unrealized gain on these was Rs 1.9b. The same is not reflected in our P/L. The post-
tax XIRR of these investments (since inception) is ~19% & is significantly higher
than the 7-9% post tax returns earned prior to the shift in capital allocation two years
back. This validates the demonstrated long term performance track record of our

31 Dec 2016
time-tested QGLP investment philosophy
Our investments in our alternative investment products are Rs 2.5b.
Both these commitments have helped “seed” these new businesses by investing in
highly scalable opportunities & also represent highly liquid “resources” available to
use for future investments, if required
The NBFC loan book was Rs 2.3b as of Dec 2016, which is now run as a spread
business
5. In line with our goal to achieve 20%+ ROE, consolidated ROE for the Group for
9MFY17 was 23% annualized (without unrealized gains on mutual funds of Rs 1.9
billion). Within this, Housing Finance was 15% annualized, Asset and Wealth
Management business was 200% annualized, Capital Markets was 52% annualized
and Fund based business was 6% annualized (without unrealized gains on mutual
funds).
Outlook
To sum up, our strategy to transform the business model is showing definite results,
with our revenue and profit model steadily becoming more balanced between Asset
management, Housing Finance and Capital Markets. We have created sufficient high
yield liquidity on our balance sheet which optimizes Group RoE and also helps fund
incremental infusions into our Housing Finance business. We have invested into
critical resources and have built strong competitive positioning in each of our
businesses. The opportunity size in most of our businesses remains huge. As we
penetrate deeper in each of these businesses, we are well placed to benefit from the
growth potential they offer. We are now open for Q&A!

31 Dec 2016
1. Capital Market Businesses
Retail Broking & Distribution, Institutional Broking
KEY FINANCIALS: MOSL (Rs Mn)
Q3
FY17
Q3
FY16
CHG.
YoY
Q3
FY17
Q2
FY17
CHG.
QoQ
9M
FY17
9M
FY16
CHG.
YoY FY16
Total Revenues 1,834 1,392 32% 1,834 1,877 -2% 5,216 4,107 27% 5,496
EBITDA 747 377 98% 747 571 31% 1,815 1,121 62% 1,485
PBT 520 170 207% 520 349 49% 1,185 647 83% 794
PAT 429 122 253% 429 235 83% 904 474 91% 605
Mutual funds are seeing large inflows, especially at the retail level. As a distributor
of financial products, how large is the fee income stream for you? Is there any
estimate available for the size of this market? How concentrated is it in terms of
the Top-5 cities?
It is a big opportunity that we are pursuing. We have two businesses which are aligned
to this opportunity. One is the wealth business, which has RMs giving advice to
accumulate distribution assets. The second is our large retail franchise spread across
2,500 outlets across India. These largely catered to broking earlier. But as we have been
saying in our earlier calls, we've been making a conscious shift to maximize the
throughput from these outlets by cross-selling financial products. We're seeing good
traction there. On a year-on-year basis, our financial product distribution AUM has gone
up 73% year-on-year. While it is still a small contributor right now, it's rising every
quarter as we go on. The wealth AUM is also up 50% year-on-year.
There are no public estimates available on the indicative size of the market. Our sense is
that distribution of equity mutual funds would be about 60% to 70% of the total retail
broking pool. That has been linearly growing over the last five to 10 years. In 2005, that
mutual fund revenue pool was about 25% of the retail broking revenue pool; while it
has increased to about 60 to 70% now. So that is how large the opportunity is today.
How much is your equity broking income? If the income booked on mutual funds
is subtracted from the reported numbers, is the rest pure equity broking income?
How much was the actual income in the cash equity broking?
Broking segment reported numbers covers two, three items. One is the broking
commission earned on the volumes. Then there is incidental interest income. Then there
is distribution income, etc. These are all related to capital markets activity other than the
treasury book. That is what you'll get when you deduct that income on mutual funds.
Most of it would be equity broking, almost about 80 to 90% of it.
We do not share the segmental breakup separately between cash and F&O, because we
look at it as one. But our market share in cash is much higher than that in F&O.
What is the tax on the profit on sale of mutual fund investments of Rs 215 million?

31 Dec 2016
There is no tax on this, because it is all long-term.
Investment Banking
KEY FINANCIALS: INVESTMENT BANKING (Rs Mn)
Q3
FY17
Q3
FY16
CHG.
YoY
Q3
FY17
Q2
FY17
CHG.
QoQ
9M
FY17
9M
FY16
CHG.
YoY FY16
Total Revenues 151 38 300% 151 202 -25% 444 164 171% 249
EBITDA 131 (16) nm 131 82 60% 252 9 2576% 32
PBT 130 (20) nm 130 81 61% 247 (1) nm 19
PAT 87 (14) nm 87 51 71% 170 (1) nm 8
How has the IB performance been? Are any more steps being taken to increase it?
We have seen very strong traction in the IB business in terms of revenues. There was a
large M&A cross-border transaction recently. That should flow through in revenues.
The pipeline of the investment banking business has been strong. It all depends on
market conditions, in terms of how the execution and the closures come through. We are
hopeful that the coming quarter should be strong as well.
2. Asset & Wealth Management Businesses
Asset Management
KEY FINANCIALS: ASSET MANAGEMENT (Rs Mn)
Q3
FY17
Q3
FY16
CHG.
YoY
Q3
FY17
Q2
FY17
CHG.
QoQ
9M
FY17
9M
FY16
CHG.
YoY FY16
AUM (Bn) 155 101 53% 155 150 3% 155 101 53% 105
Net Inflows (Bn) 15 11 37% 15 11 35% 34 44 -22% 52
Total Revenues 876 511 72% 876 748 17% 2,208 1,298 70% 1,852
EBITDA 222 116 92% 222 140 59% 493 255 93% 364
PBT 220 113 95% 220 138 60% 489 246 98% 354
PAT 145 75 94% 145 92 58% 321 194 65% 264
What is the breakup of the AUM between PMS and mutual fund for this quarter,
as compared to last quarter Q2 and last year’s Q3?
Out of the Rs 155 billion AMC AUM, about Rs 80 billion is PMS AUM, another about
Rs 71 billion is the mutual fund AUM and about Rs 4 billion is the AIF AUM. In
September, these were Rs 78 billion in PMS and Rs 70 billion in mutual funds. The
AUM has been flattish on a sequential basis because of the market correction this
quarter. Back in December of last year, our PMS AUM was Rs 53 billion and mutual
fund AUM was Rs 48 billion.
Are we seeing potential beyond the larger cities, like beyond the top metros?

31 Dec 2016
There is huge potential beyond the metro cities. Our distribution franchise is not just in
the top cities, but also outside. We are seeing traction from metros and also across the
other smaller cities as well.
The last few years have seen tepid earning cycle for the markets. In this phase, the
company’s mutual funds and PMS have done very well in the last three years, and
have outperformed the market. If broader earnings don't catch up, will there be
any change in strategy, like on entry exit load etc, that may affect performance?
The alpha generation across these products has ranged more like 10%, during this
period when the earnings growth has been muted. So aside from market returns, the
return in both the PMS as well as the mutual fund products have been very strong. We
have always believed in no-exit loads and we continue to operate that way. Our flow
share is nearly 3% vs our AUM share of just about 1%. The strong performance, the
expanding distribution network and the natural flow towards financial savings, should
augur well as far as the growth of this business is concerned
Where do you see the AMC AUM one year from now?
AUM is a function of both net inflows and market movement. It is difficult to forecast
how the market movement will be. But as far as the inflows are concerned, it was Rs 15
billion in the current quarter. The strong performance of the products, the increasing
distribution reach, the completion of three years track-record of some of the products,
should together help in only augmenting that inflow in coming periods. That should
serve as a template if you want to extrapolate that number for the next year. Another
input is that our inflow share is over 3%, while our AUM share is about 1.2%. So if we
maintain our share in inflows that should itself take up our share in AUM and improve
our ranks, which is already improved by two points from 12 to 10 in the last 12 months.
Will the closure of the NTDOP scheme affect inflows?
No, we don't think so. The capacity of all our products is significant. It is only because
we are confident that the inflows can continue to be strong, we chosen to close this.
Private Equity
KEY FINANCIALS: PRIVATE EQUITY* (Rs Mn)
Q3
FY17
Q3
FY16
CHG.
YoY
Q3
FY17
Q2
FY17
CHG.
QoQ
9M
FY17
9M
FY16
CHG.
YoY FY16
Total Revenues 100 102 -3% 100 129 -23% 316 314 1% 466
EBITDA 40 46 -13% 40 29 38% 98 117 -16% 152
Exceptional Item 0 0 nm 0 400 -100% 503 0 nm 0
PBT 35 44 -20% 35 427 -92% 594 109 445% 143
PAT 22 36 -38% 22 329 -93% 473 86 452% 104
Exceptional Item includes revenue from share in profit on sale of investments (carry share) made in the 1st PE growth fund
When is the PE fund being liquidated upon?

31 Dec 2016
The India Business Excellence Fund will have its last year in FY18, and we'll have to
exit all its investments during the course of this period. We already have filed DRHP for
some of the companies including GR Infra, Dixon, etc. We have already had 2x capital
returned in this fund, and our estimate is that we will have a 3.5x capital return. So this
balance 1.5x capital return will happen in FY18.
Wealth Management
KEY FINANCIALS: PRIVATE WEALTH MANAGEMENT (Rs Mn)
Q3
FY17
Q3
FY16
CHG.
YoY
Q3
FY17
Q2
FY17
CHG.
QoQ
9M
FY17
9M
FY16
CHG.
YoY FY16
AUM (Bn) 91 61 49% 91 86 7% 91 61 49% 64
Net Inflows (Bn) 4 4 8% 4 5 -9% 14 11 27% 15
Total Revenues 150 108 39% 150 174 -14% 478 300 59% 444
EBITDA 49 33 48% 49 52 -6% 137 92 50% 139
PBT 48 22 119% 48 46 5% 122 71 73% 109
PAT 31 14 120% 31 31 -1% 81 46 78% 71
How many RMs do you have in wealth management?
We have close to 80 RMs right now, covering around Rs 90 billion of AUM.
The yield on the AUM is working out to an annualized number of around 65 basis
points. Is this pure agency income or is there any capital income in this?
You can't take the closing AUM. If you annualize it by the quarterly average AUM, it is
closer to 90 bps to 1%. This is all pure agency income. We don't run an NBFC book.
3. Housing Finance Business
Aspire Home Finance
KEY FINANCIALS: ASPIRE HOME FINANCE (Rs Mn)
Q3
FY17
Q3
FY16
CHG.
YoY
Q3
FY17
Q2
FY17
CHG.
QoQ
9M
FY17
9M
FY16
CHG.
YoY FY16
Sanctions (Bn) 6 6 -2% 6 8 -29% 20 14 40% 24
Disbursements (Bn) 4 4 -20% 4 7 -47% 15 11 38% 18
Loan Book (Bn) 33 14 136% 33 31 8% 33 14 136% 21
Gross NPL% 0.6% 0.2% 0.6% 0.3% 0.6% 0.2% 0.2%
Net Interest Income (NII) 302 138 119% 302 322 -6% 842 272 209% 476
Other Income 162 172 -6% 162 279 -42% 617 384 61% 644
Total Income 464 311 49% 464 601 -23% 1,458 656 122% 1,120
Operating Profit (Pre-Prov.) 299 182 64% 299 375 -20% 899 390 130% 688
PBT 269 163 65% 269 345 -22% 821 345 138% 613
PAT 174 94 85% 174 227 -23% 535 223 140% 400

31 Dec 2016
What is the outlook on Aspire post demonetization? The pace of sanctions has
come off meaningfully, by around 49% QoQ. Is this is just a temporary blip in
disbursements? What is the near-term outlook for this business?
Post demonetization, we had consciously slowed our disbursement for this business as
we wanted to wait and watch how the whole impact played out. So it is by choice that
we decided to disburse lower. Also, in the segment that we cater to, which is
significantly unbanked in Tier 2/3 cities, the impact of demonetization was higher. So
the focus of the team was on collections side, besides a wait and watch approach. The
disbursement run rate in January should be above the full-year average, and way above
the third quarter average. We are already seeing things easing on the ground, and that is
reflected in our inwards as well as sanctions. There is also some pent-up impact of the
last quarter that will overflow into this quarter. So from our point of view, there was a
material divergence from the business plan by choice in the third quarter, and we will be
again tracking the business plan from this quarter onwards. We think the fourth quarter
should mark a high in our disbursement, as compared to the preceding quarters. The
disbursement number was about Rs 6.7 billion in the second quarter and about Rs 4.8
billion in the first quarter. We should do better than these numbers.
The Other Income of Aspire is down QoQ. Is this because disbursement is down?
That's correct. Other Income for us comprises of processing fees, treasury income and
also insurance premium. So the extent of disbursement impacts the processing fee.
Have the collections improved in January?
Our focus had been first on collections and then on disbursements. Yes, we are now
seeing collections getting restored to normal, and that is precisely the reason why our
disbursements are also getting back to normal. That was our necessary precondition to
going back to our original business plan for disbursements.
What was the collection efficiency during these months of demonetization?
The collection efficiency for Form-16 salaried customers is as good as 99% plus. For
our specific segments, the collection efficiency is typically between 85% and 90%. Due
to the efforts put in by the team, we maintained that collection efficiency even through
demonetization. That gives us the confidence to reinstate our run rate of disbursements
back to our business plan.

31 Dec 2016
What are the practices followed in risk management and collection management?
As far as the risk management is concerned, the efficiency of collections is the primary
metric. That is what has allowed us to go back to our business plan now, as far as
disbursements are concerned. But risk management works at multiple levels. We do not
do any builder loans, or construction finance, or LAP. We are doing only small-ticket
retail housing loans. Bulk of these loans is originated by us and not through DSAs. Even
within retail loans, we are sticking to our average ticket size of Rs 1 million through the
last three years. Its only one loan per person, and predominantly their first loan. The
LTV, FOIR and IIRs are all under the same range. These are all, in our view, forms of
risk mitigants. We have a Chief Risk Officer who uses data analytics for early warning
signals. So there is a lot of emphasis on risk management.
What is the Gross and Net NPA? How does it compare to previous quarter?
Gross NPA was 0.6% and Net NPA was 0.45% as of December. These were 0.3% and
0.24% back in September.
Given this slowdown in November-December and the subsequent uptick from
January, would you expect some improvement in GNPL numbers?
Typically in the industry, the March quarter numbers is always expected to be better
than the December quarter. Aside from demonetization, the December quarter also sees
the impact of the festival season, etc, which causes a slight decay in the segment that we
operate in. We continue to watch closely how the quarter goes through. In the normal
course, had there been no demonetization, we would have been quite confident that the
March numbers would be better than the December numbers.
Is there any guidance for NPL towards the end of the year? Would it go back to
last year's number or would it just take a slightly longer period to get there?
As the book seasons, we should be in the range of 0.5% to 1% Gross NPLs. We don't
see it decaying any further from the December quarter. While we have seen an increase
in the NPLs quarter-on-quarter, we are hoping to contain them to a lower number in the
March quarter. We are not unduly worried about the collection efficiency.
With NHB issuing so many new licenses in housing finance, competition is only
increasing. How are we countering it?
31 Dec 2016
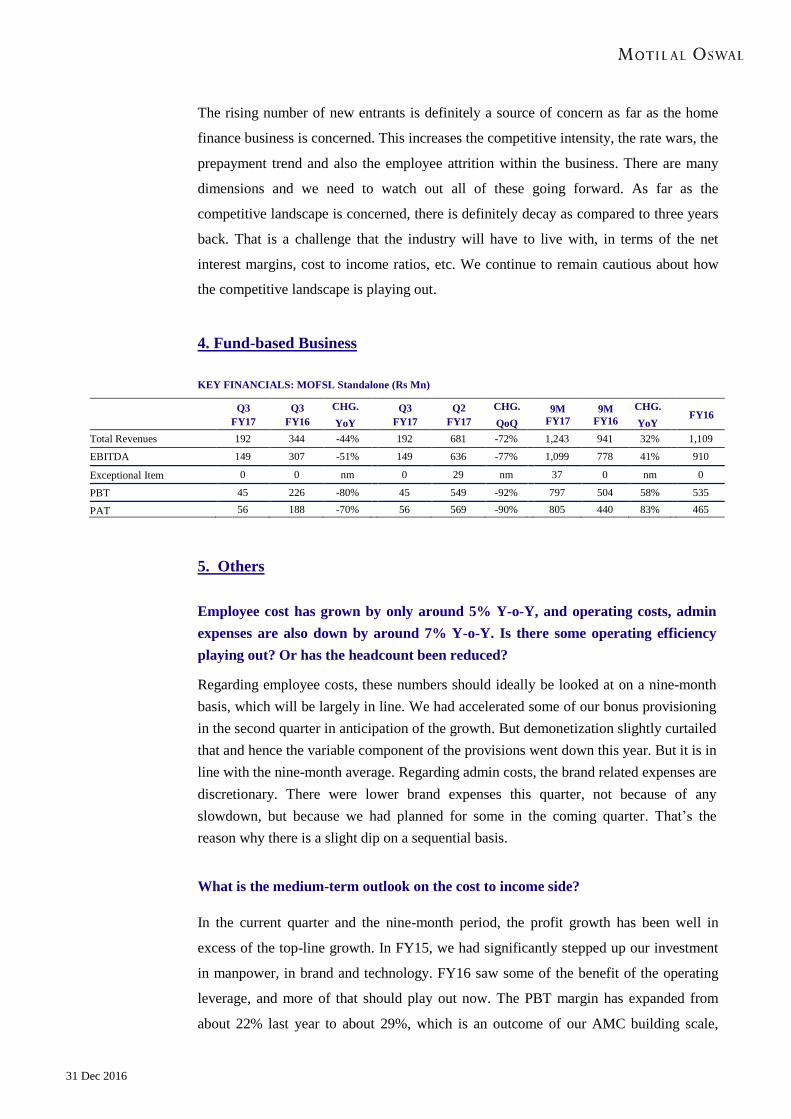
The rising number of new entrants is definitely a source of concern as far as the home
finance business is concerned. This increases the competitive intensity, the rate wars, the
prepayment trend and also the employee attrition within the business. There are many
dimensions and we need to watch out all of these going forward. As far as the
competitive landscape is concerned, there is definitely decay as compared to three years
back. That is a challenge that the industry will have to live with, in terms of the net
interest margins, cost to income ratios, etc. We continue to remain cautious about how
the competitive landscape is playing out.
4. Fund-based Business
KEY FINANCIALS: MOFSL Standalone (Rs Mn)
Q3
FY17
Q3
FY16
CHG.
YoY
Q3
FY17
Q2
FY17
CHG.
QoQ
9M
FY17
9M
FY16
CHG.
YoY FY16
Total Revenues 192 344 -44% 192 681 -72% 1,243 941 32% 1,109
EBITDA 149 307 -51% 149 636 -77% 1,099 778 41% 910
Exceptional Item 0 0 nm 0 29 nm 37 0 nm 0
PBT 45 226 -80% 45 549 -92% 797 504 58% 535
PAT 56 188 -70% 56 569 -90% 805 440 83% 465
5. Others
Employee cost has grown by only around 5% Y-o-Y, and operating costs, admin
expenses are also down by around 7% Y-o-Y. Is there some operating efficiency
playing out? Or has the headcount been reduced?
Regarding employee costs, these numbers should ideally be looked at on a nine-month
basis, which will be largely in line. We had accelerated some of our bonus provisioning
in the second quarter in anticipation of the growth. But demonetization slightly curtailed
that and hence the variable component of the provisions went down this year. But it is in
line with the nine-month average. Regarding admin costs, the brand related expenses are
discretionary. There were lower brand expenses this quarter, not because of any
slowdown, but because we had planned for some in the coming quarter. That’s the
reason why there is a slight dip on a sequential basis.
What is the medium-term outlook on the cost to income side?
In the current quarter and the nine-month period, the profit growth has been well in
excess of the top-line growth. In FY15, we had significantly stepped up our investment
in manpower, in brand and technology. FY16 saw some of the benefit of the operating
leverage, and more of that should play out now. The PBT margin has expanded from
about 22% last year to about 29%, which is an outcome of our AMC building scale,

31 Dec 2016
Aspire building scale, and investment banking contributing significantly to the top-line
and bottom line. So these are kicking in operating leverage. There were investments still
going on in the nine months of the current year, like in brand and marketing in the asset
management business. The distribution network for the home finance business has also
been doubled on a year-on-year basis. So the investments in all of these three areas,
manpower, technology and brand continue. With a little more tailwind for the economy,
corporate earnings and the capital markets in general, we could see better operating
leverage in each of these businesses.
How is the transition of investors from real estate and gold to equity playing out?
How does the future look like?
The transition from physical to financial savings is playing out in many ways. Each one
of our businesses, like broking, mutual funds, PMS, wealth management, are a play on
this trend. We are very optimistic of continued transition towards financial savings,
which should benefit each of these businesses
Which business has seen a strong pick-up post demonetization?
The asset management business has seen the biggest benefit due to demonetization
Any plans to foray into microfinance?
We do not have any plans to enter into any new businesses like microfinance.
31 Dec 2016
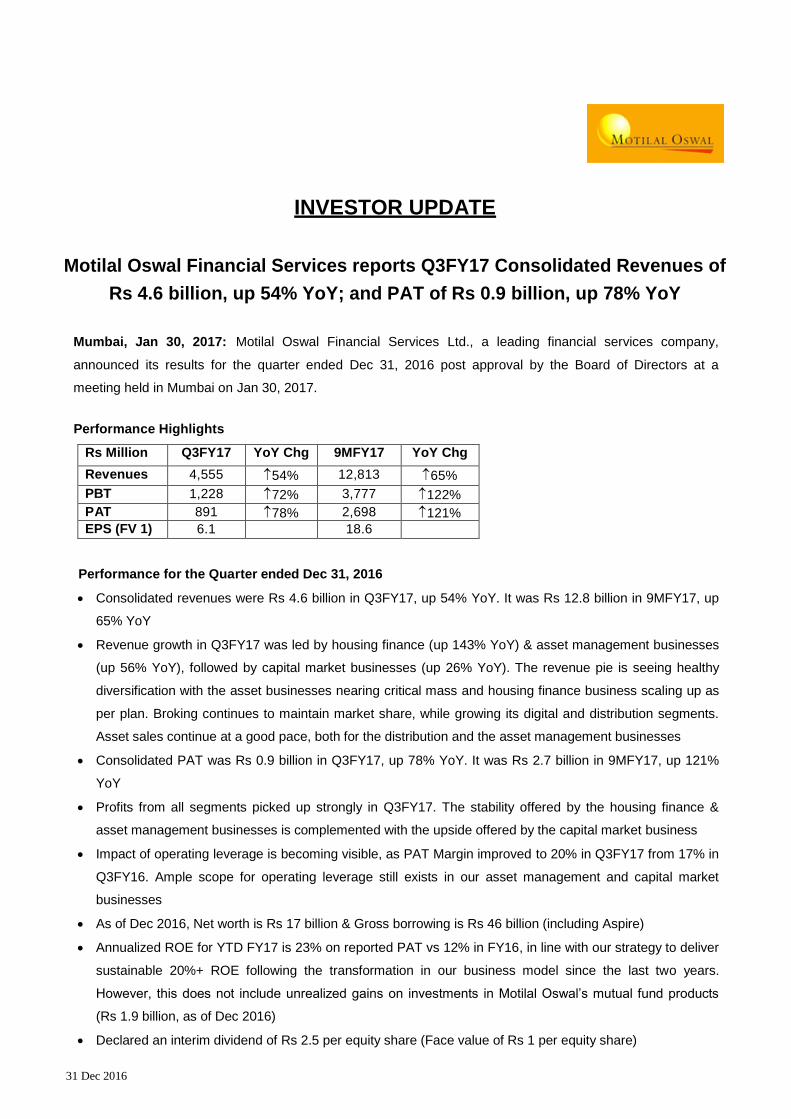
INVESTOR UPDATE
Motilal Oswal Financial Services reports Q3FY17 Consolidated Revenues of
Rs 4.6 billion, up 54% YoY; and PAT of Rs 0.9 billion, up 78% YoY
Mumbai, Jan 30, 2017: Motilal Oswal Financial Services Ltd., a leading financial services company,
announced its results for the quarter ended Dec 31, 2016 post approval by the Board of Directors at a
meeting held in Mumbai on Jan 30, 2017.
Performance Highlights
Rs Million Q3FY17 YoY Chg 9MFY17 YoY Chg
Revenues 4,555 54% 12,813 65%
PBT 1,228 72% 3,777 122%
PAT 891 78% 2,698 121%
EPS (FV 1) 6.1 18.6
Performance for the Quarter ended Dec 31, 2016
Consolidated revenues were Rs 4.6 billion in Q3FY17, up 54% YoY. It was Rs 12.8 billion in 9MFY17, up
65% YoY
Revenue growth in Q3FY17 was led by housing finance (up 143% YoY) & asset management businesses
(up 56% YoY), followed by capital market businesses (up 26% YoY). The revenue pie is seeing healthy
diversification with the asset businesses nearing critical mass and housing finance business scaling up as
per plan. Broking continues to maintain market share, while growing its digital and distribution segments.
Asset sales continue at a good pace, both for the distribution and the asset management businesses
Consolidated PAT was Rs 0.9 billion in Q3FY17, up 78% YoY. It was Rs 2.7 billion in 9MFY17, up 121%
YoY
Profits from all segments picked up strongly in Q3FY17. The stability offered by the housing finance &
asset management businesses is complemented with the upside offered by the capital market business
Impact of operating leverage is becoming visible, as PAT Margin improved to 20% in Q3FY17 from 17% in
Q3FY16. Ample scope for operating leverage still exists in our asset management and capital market
businesses
As of Dec 2016, Net worth is Rs 17 billion & Gross borrowing is Rs 46 billion (including Aspire)
Annualized ROE for YTD FY17 is 23% on reported PAT vs 12% in FY16, in line with our strategy to deliver
sustainable 20%+ ROE following the transformation in our business model since the last two years.
However, this does not include unrealized gains on investments in Motilal Oswal‟s mutual fund products
(Rs 1.9 billion, as of Dec 2016)
Declared an interim dividend of Rs 2.5 per equity share (Face value of Rs 1 per equity share)

31 Dec 2016
Speaking on the performance of the company, Mr. Motilal Oswal, CMD said
“Our strategy to transform the business model is showing results, as our revenues and profits are now well
balanced between Asset management, Housing Finance and Capital markets businesses. In broking
business, we maintained our market share in the high-yield cash segment as we continued to add retail clients
at a healthy run rate. Our asset mobilization continued at a very strong pace. Our expansion of the housing
finance network and the loan book is going as per plan. We are working towards our strategic imperative to
generate 20%+ ROE on a sustainable basis. We have been investing in critical resources, be it manpower,
technology or network, and have built strong competitive positioning in each of our businesses. The
opportunity size in our business segments is still huge. As we deepen our penetration in each business, we
are well placed to benefit from the sizeable opportunities these businesses offer.”
Performance of Business Segments for the Quarter ended Dec 31, 2016
Capital markets Businesses (broking & investment banking) are showing results
o Broking & related revenues were Rs 1.6 billion in Q3FY17, up 18% YoY. It was Rs 4.9 billion in
9MFY17, up 27% YoY. The quarter saw the market volume mix move further towards F&O. This
continued shift towards F&O in the market meant that our overall equity market share dipped from
2.3% in Q3FY16 to 1.9% in Q3FY17. However, we held our market share in the high-yield cash
segment in Q3FY17, both on a YoY & QoQ basis. Our blended yield in Q3FY17 was 3.1 bps
o In retail broking & distribution, online business continues to grow, forming 44% of retail volumes in
Q3FY17 from 31% in Q3FY16. Mobile app continues to form an increasing share within the online
volume. Over 50% of accounts are now opened with e-KYC, and over 50% of leads are generated
through online sources. Our monthly addition of retail clients grew at a brisk 52% YoY. Asset sales
continued unabated, and our financial products AUM were up 73% YoY. We saw a significant uptick in
MF SIP distribution. The growth potential in this space remains immense
o In institutional broking, our new thematic research products are evincing increased client interest.
The share of blocks holds steady in our volumes
o Investment banking fees were Rs 148 million in Q3FY17, up 306% YoY. It was Rs 432 million in
9MFY17, up 173% YoY. Our IB business continued its momentum by concluding some ECM
transactions and has filed DRHP for 4 companies with SEBI. We also announced a large cross-border
M&A transaction. These transactions are part of our pipeline with revenues expected in the coming
quarters
o Capital markets businesses collectively contributed ~38% of revenues in Q3FY17, as compared to
~46% in Q3FY16
Asset and Wealth Management Businesses continue to see strong business traction
o Total AUM/AUA across asset management & private equity businesses was Rs 186 billion, up 49%
YoY. Wealth management AUM was Rs 91 billion, up 49% YoY
o In asset management, our AUM across MF, PMS & AIF was Rs 155 billion, up 53% YoY. Net inflows
increased 37% to Rs 15 billion this quarter vs Rs 11 billion each in Q2FY17 & Q3FY16, as we
deepened distributor relationships. Our QGLP philosophy continues to deliver on performance. Our
rank in Equity AUM improved to 10 from 12 a year ago. Our market share in Equity MF AUM was
~1.2% in this YTD while our market share in Equity MF Net Sales was significantly higher at ~3.1%. An

31 Dec 2016
incremental Rs 78 million was spent YTD in advertising and marketing and this should help boost
brand-recall in the long term. Our flagship MF product, F-35, will finish 3-year performance track record
in April 2017, which will likely enhance participation from distribution channels. The continued shift of
Indian savings towards financial savings and away from physical savings coupled with mobilization of
offshore assets, which account for two-thirds of institutionally managed equity assets, are key growth
drivers for the asset management business
o In private equity, we manage an AUM of Rs 31 billion across 2 growth capital PE funds & 3 real
estate funds. The PE business has demonstrated robust profitability & the RE business has shown
significant scalability. The 1st growth fund has seen 6 full-exits & 2 partial exits, translating into ~201%
capital returned (INR). It is in advanced stages for 1 exit in the coming months, which may allow it to
return an additional ~14% capital. We estimate the PE fund to deliver a gross multiple of ~3.5X. The
2nd
growth fund has committed ~89.5%, after raising commitments from marquee institutions
o Asset Management fee (asset management & private equity together) were Rs 945 million in Q3FY17,
up 56% YoY. It was Rs 2.5 billion in 9MFY17, up 54% YoY. This contributed ~21% of consolidated
revenues in Q3FY17, same as in Q3FY16
o In Wealth management, higher RM head count and improved RM productivity drove growth in our
AUM. We continue to enjoy a respectable yield of ~1% due to the higher share of equity & alternative
products in our AUM. This business offers enormous scope for scalability as it builds synergies with
the Group‟s other businesses to deepen its reach
Housing finance has shown traction in assets & liabilities, while maintaining risk & operational
parameters
o Housing finance related income was Rs 1.5 billion in Q3FY17, up 143% YoY. It was Rs 4.0 billion in
9MFY17, up 212% YoY
o On the assets side, the loan book was Rs 33 billion, up 136% YoY. It has funded ~36,000 families so
far. Our average yield has held at ~13.4% since the last 4 successive quarters
o In terms of network, our branch count doubled YoY to 84 in the existing 4 states
o On the liabilities side, ~53% borrowings were from NCDs, ~31% from term loans & ~16% from CP. We
had credit lines from 29 banks & 2 NBFCs vs 19 a year ago. The average cost of borrowing raised
cumulatively has been ~9.6%, while it was ~9.1% on the borrowings raised in this YTD. Our D/E ratio
was 5.8x
o Cumulative capital infusion from sponsor is Rs 5 billion and net worth is Rs 6 billion, as of Dec 2016.
Strong liquidity in the Group‟s balance sheet (~Rs 8.2 billion) is adequate for Aspire‟s funding needs,
as of now
o We have invested significantly in Digitization for long-term operational and process improvements,
through our Sales app, Credit app, Customer app, Smart-Track for documents, Vendor Management
app, etc. We expect a large part of the total transactions to be covered by our digital initiatives by
March 2017
o Annualized ROA for 9MFY17 was ~2.6%, ROE is ~15%, and NIM is ~4.15%. GNPL is 0.6% as of Dec
2016 vs 0.3% in Sep 2016 and this number is without using the relaxation offered by RBI in NPA
recognition norms post demonetisation
o Housing Finance contributed ~33% of consolidated revenues in Q3FY17, as compared to ~21% in

31 Dec 2016
Q3FY16
Fund Based Business includes sponsor commitments to our AMC & PE funds, and NBFC LAS book.
Fund based income was Rs 354 million in Q3FY17, up 2% YoY. It was Rs 1.0 billion in 9MFY17, up 15%
YoY
o Our investments in Motilal Oswal‟s mutual funds (at cost) stood at Rs 6.3 billion. The unrealized gain
on these as of Dec 2016 is Rs 1.9 billion. The same is not reflected in the reported PAT in the P/L. The
post-tax XIRR of these investments (since inception) is ~19% & is significantly higher than the 7-9%
post tax returns earned prior to the shift in capital allocation two years back
o Our investments in Motilal Oswal‟s alternative investment funds stood at Rs 2.5 billion
o Both these commitments have not only helped “seed” these new businesses by investing in highly
scalable opportunities, but they also represent liquid “resources” available for deployment in any future
opportunities
o NBFC LAS lending book was Rs 2.3 billion as of Dec 2016, which is now run as a spread business
Other income was Rs 12 million in Q3FY17 and Rs 53 million in 9MFY17
In line with the goal to achieve a sustainable 20%+ ROE, consolidated ROE for the Group for 9MFY17
was 23% annualized (without including unrealized gains on mutual funds investments of Rs 1.9 billion).
Within this, Housing Finance RoE was 15% annualized, Asset and Wealth Management business RoE
was 200% annualized, Capital Markets RoE was 52% annualized and Fund based business RoE was 6%
annualized (without considering unrealized gains on mutual funds)
About Motilal Oswal Financial Services Limited
Motilal Oswal Financial Services Ltd. is a financial services company. Its offerings include capital markets
businesses (retail broking, institutional broking & investment banking), asset & wealth management (asset
management, private equity & wealth management), housing finance & equity based treasury investments.
Motilal Oswal Securities won the „Best Performing National Financial Advisor Equity Broker' award at the
CNBC TV18 Financial Advisor Awards for the 5th
time. It was ranked the Best in Events/Conferences,
ranked amongst Top-2 for Overall Sales Services & Best Roadshows/Company Visits & amongst the Top-
3 in Best Local Brokerage, Best Execution & Sales Trading Visits at the AsiaMoney Awards 2015. Motilal
Oswal Private Equity won the „Best Growth Capital Investor-2012‟ award at the Awards for PE Excellence
2013. Motilal Oswal Private Wealth Management won at the UTI-MF CNBC Financial Advisor Award in
HNI Wealth Management category for 2015. Aspire Housing Finance was awarded „India‟s Most Admired
& Valuable Housing Finance Company‟ at India Leadership Conclave 2015.
For further details contact:
Mr. Ramnik Chhabra
Motilal Oswal Financial Services
Ph- +91-22-39825500,
Mob- +91-9820301984
Mr. Sameer Kamath
Motilal Oswal Financial Services
Ph- +91-22-39825500
Mob- +91-9820130810
Mr. Anirudh Rajan / Alpesh Nakrani
Paradigm Shift Public Relations
Ph- +91-22 22813797
Mob- +91-9892343828 / +91-
9869121167
31 Dec 2016
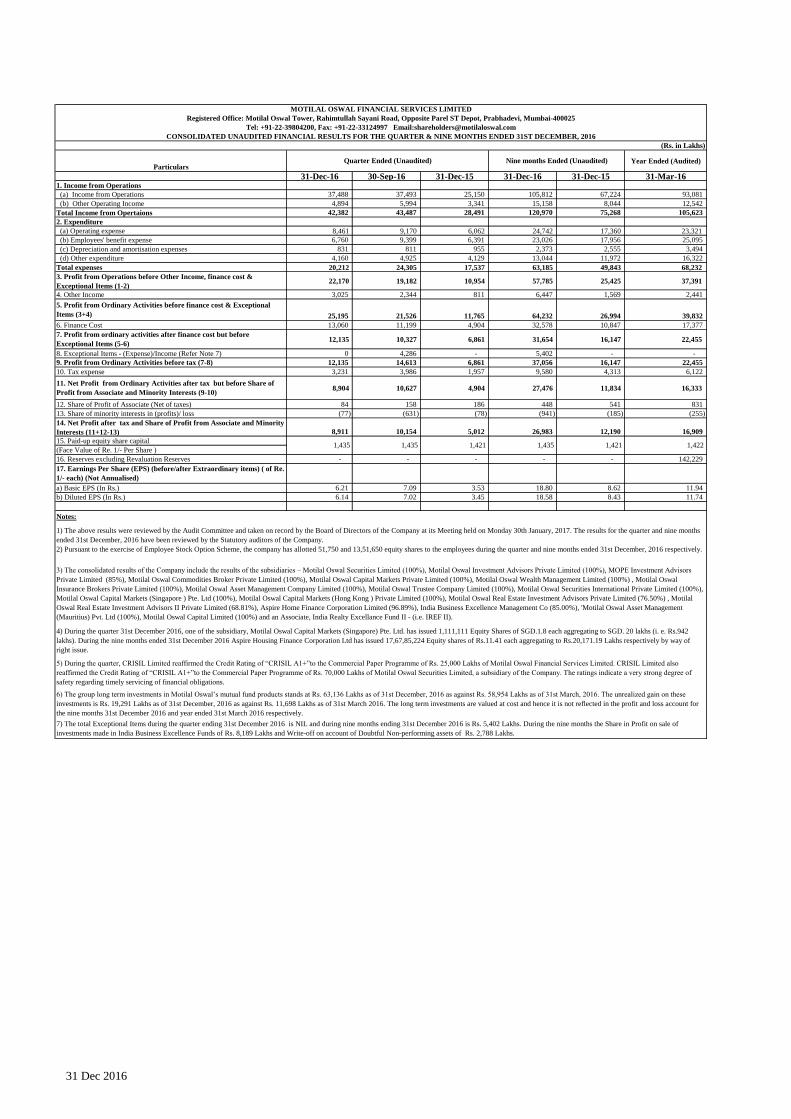
MOTILAL OSWAL FINANCIAL SERVICES LIMITED
Registered Office: Motilal Oswal Tower, Rahimtullah Sayani Road, Opposite Parel ST Depot, Prabhadevi, Mumbai-400025
Tel: +91-22-39804200, Fax: +91-22-33124997 Email:[email protected]
CONSOLIDATED UNAUDITED FINANCIAL RESULTS FOR THE QUARTER & NINE MONTHS ENDED 31ST DECEMBER, 2016
(Rs. in Lakhs)
ParticularsYear Ended (Audited)
31-Dec-16 30-Sep-16 31-Dec-15 31-Dec-16 31-Dec-15 31-Mar-161. Income from Operations
(a) Income from Operations 37,488 37,493 25,150 105,812 67,224 93,081
(b) Other Operating Income 4,894 5,994 3,341 15,158 8,044 12,542
Total Income from Opertaions 42,382 43,487 28,491 120,970 75,268 105,623
2. Expenditure
(a) Operating expense 8,461 9,170 6,062 24,742 17,360 23,321
(b) Employees' benefit expense 6,760 9,399 6,391 23,026 17,956 25,095
(c) Depreciation and amortisation expenses 831 811 955 2,373 2,555 3,494
(d) Other expenditure 4,160 4,925 4,129 13,044 11,972 16,322
Total expenses 20,212 24,305 17,537 63,185 49,843 68,232
22,170 19,182 10,954 57,785 25,425 37,391
4. Other Income 3,025 2,344 811 6,447 1,569 2,441
25,195 21,526 11,765 64,232 26,994 39,832
6. Finance Cost 13,060 11,199 4,904 32,578 10,847 17,377
12,135 10,327 6,861 31,654 16,147 22,455
8. Exceptional Items - (Expense)/Income (Refer Note 7) 0 4,286 - 5,402 - -
12,135 14,613 6,861 37,056 16,147 22,455
10. Tax expense 3,231 3,986 1,957 9,580 4,313 6,122
8,904 10,627 4,904 27,476 11,834 16,333
12. Share of Profit of Associate (Net of taxes) 84 158 186 448 541 831
13. Share of minority interests in (profits)/ loss (77) (631) (78) (941) (185) (255)
8,911 10,154 5,012 26,983 12,190 16,909
15. Paid-up equity share capital
(Face Value of Re. 1/- Per Share )
16. Reserves excluding Revaluation Reserves - - - - - 142,229
a) Basic EPS (In Rs.) 6.21 7.09 3.53 18.80 8.62 11.94
b) Diluted EPS (In Rs.) 6.14 7.02 3.45 18.58 8.43 11.74
Notes:
9. Profit from Ordinary Activities before tax (7-8)
Quarter Ended (Unaudited) Nine months Ended (Unaudited)
3. Profit from Operations before Other Income, finance cost &
Exceptional Items (1-2)
5. Profit from Ordinary Activities before finance cost & Exceptional
Items (3+4)
7. Profit from ordinary activities after finance cost but before
Exceptional Items (5-6)
11. Net Profit from Ordinary Activities after tax but before Share of
Profit from Associate and Minority Interests (9-10)
14. Net Profit after tax and Share of Profit from Associate and Minority
Interests (11+12-13)
1,435 1,435 1,421 1,422
17. Earnings Per Share (EPS) (before/after Extraordinary items) ( of Re.
1/- each) (Not Annualised)
1,421 1,435
1) The above results were reviewed by the Audit Committee and taken on record by the Board of Directors of the Company at its Meeting held on Monday 30th January, 2017. The results for the quarter and nine months
ended 31st December, 2016 have been reviewed by the Statutory auditors of the Company.
2) Pursuant to the exercise of Employee Stock Option Scheme, the company has allotted 51,750 and 13,51,650 equity shares to the employees during the quarter and nine months ended 31st December, 2016 respectively.
3) The consolidated results of the Company include the results of the subsidiaries – Motilal Oswal Securities Limited (100%), Motilal Oswal Investment Advisors Private Limited (100%), MOPE Investment Advisors
Private Limited (85%), Motilal Oswal Commodities Broker Private Limited (100%), Motilal Oswal Capital Markets Private Limited (100%), Motilal Oswal Wealth Management Limited (100%) , Motilal Oswal
Insurance Brokers Private Limited (100%), Motilal Oswal Asset Management Company Limited (100%), Motilal Oswal Trustee Company Limited (100%), Motilal Oswal Securities International Private Limited (100%),
Motilal Oswal Capital Markets (Singapore ) Pte. Ltd (100%), Motilal Oswal Capital Markets (Hong Kong ) Private Limited (100%), Motilal Oswal Real Estate Investment Advisors Private Limited (76.50%) , Motilal
Oswal Real Estate Investment Advisors II Private Limited (68.81%), Aspire Home Finance Corporation Limited (96.89%), India Business Excellence Management Co (85.00%), 'Motilal Oswal Asset Management
(Mauritius) Pvt. Ltd (100%), Motilal Oswal Capital Limited (100%) and an Associate, India Realty Excellance Fund II - (i.e. IREF II).
4) During the quarter 31st December 2016, one of the subsidiary, Motilal Oswal Capital Markets (Singapore) Pte. Ltd. has issued 1,111,111 Equity Shares of SGD.1.8 each aggregating to SGD. 20 lakhs (i. e. Rs.942
lakhs). During the nine months ended 31st December 2016 Aspire Housing Finance Corporation Ltd has issued 17,67,85,224 Equity shares of Rs.11.41 each aggregating to Rs.20,171.19 Lakhs respectively by way of
right issue.
5) During the quarter, CRISIL Limited reaffirmed the Credit Rating of “CRISIL A1+”to the Commercial Paper Programme of Rs. 25,000 Lakhs of Motilal Oswal Financial Services Limited. CRISIL Limited also
reaffirmed the Credit Rating of “CRISIL A1+”to the Commercial Paper Programme of Rs. 70,000 Lakhs of Motilal Oswal Securities Limited, a subsidiary of the Company. The ratings indicate a very strong degree of
safety regarding timely servicing of financial obligations.
6) The group long term investments in Motilal Oswal’s mutual fund products stands at Rs. 63,136 Lakhs as of 31st December, 2016 as against Rs. 58,954 Lakhs as of 31st March, 2016. The unrealized gain on these
investments is Rs. 19,291 Lakhs as of 31st December, 2016 as against Rs. 11,698 Lakhs as of 31st March 2016. The long term investments are valued at cost and hence it is not reflected in the profit and loss account for
the nine months 31st December 2016 and year ended 31st March 2016 respectively.
7) The total Exceptional Items during the quarter ending 31st December 2016 is NIL and during nine months ending 31st December 2016 is Rs. 5,402 Lakhs. During the nine months the Share in Profit on sale of
investments made in India Business Excellence Funds of Rs. 8,189 Lakhs and Write-off on account of Doubtful Non-performing assets of Rs. 2,788 Lakhs.

31 Dec 2016
8) Consolidated segment results for the quarter and nine months ended 31st December 2016
(Rs. in Lakhs)
ParticularsYear Ended (Audited)
31-Dec-16 30-Sep-16 31-Dec-15 31-Dec-16 31-Dec-15 31-Mar-161. Segment Revenue
(a) Broking & Other related activities 17,939 20,873 14,892 54,409 42,632 56,959
(b) Fund Based activities 4,435 2,684 2,320 12,269 10,499 15,531
(c) Asset Management & Advisory 9,940 9,014 6,200 25,746 16,600 23,687
(d) Asset Management & Advisory (Exceptional items) 0 7,515 (0) 11,356 - -
(e) Investment Banking 1,507 2,022 377 4,369 1,635 2,483
(f) Home Finance 15,209 14,702 6,252 39,939 12,895 22,051
(g) Unallocated 158 376 511 929 799 774
Total 49,188 57,186 30,552 149,017 85,060 121,485
Less: Inter Segment Revenue 3,635 3,594 956 9,529 7,388 12,115
Income From Operations, Other Operating income & Other Income 45,553 53,592 29,596 139,488 77,672 109,370
2. Segment Results Profit / (Loss) before tax and interest from Each segment
(a) Broking & Other related activities 5,313 5,230 4,988 14,106 8,976 10,074
(b) Fund Based activities 2,594 1,128 1,064 6,801 5,480 8,559
(c) Fund Based activities (Exceptional items) - (788) - (2,788) -
(d) Asset Management & Advisory 2,431 1,583 1,426 5,460 3,313 4,457
(e) Asset Management & Advisory (Exceptional items) 0 5,074 (0) 8,189 - -
(f) Investment Banking 1,295 807 (183) 2,411 49 253
(g) Home Finance 2,691 3,038 1,597 8,091 3,418 4,706
(h) Unallocated (619) 38 (935) (864) (2,713) (1,094)
Total 13,705 16,110 7,957 41,406 18,523 26,955
Less: Interest 1,426 1,247 805 3,635 1,525 3,196
Profit/(Loss ) from Ordinary Activities before Tax 12,279 14,863 7,151 37,771 16,998 23,759
3. Segment Assets
(a) Broking & Other related activities 173,866 193,505 149,272 173,866 149,272 131,833
(b) Fund Based activities 135,107 143,377 159,950 135,107 159,950 141,917
(c) Asset Management & Advisory 15,060 15,828 8,392 15,060 8,392 11,295
(d) Investment Banking 2,539 2,515 1,083 2,539 1,083 573
(e) Home Finance 439,109 423,246 180,529 439,109 180,529 229,370
(f) Unallocated 70,492 69,376 45,162 70,492 45,162 51,160
Less : (Eliminations) (78,376) (83,170) (65,173) (78,376) (65,173) (57,089)
Total 757,797 764,677 479,215 757,797 479,215 509,059
4. Segment Liabilities
(a) Broking & Other related activities 95,625 97,016 68,646 95,625 68,646 86,528
(b) Fund Based activities 38,853 47,266 55,102 38,853 55,102 50,716
(c) Asset Management & Advisory 8,905 10,748 5,150 8,905 5,150 6,556
(d) Investment Banking 681 806 250 681 250 296
(e) Home Finance 380,715 366,282 153,041 380,715 153,041 194,623
(f) Unallocated 73,168 97,260 76,697 73,168 76,697 38,107
Less : (Eliminations) (12,668) (18,131) (24,467) (12,668) (24,467) (11,419)
Total 585,279 601,247 334,419 585,279 334,419 365,407
Notes:
9) The Board of Directors at its meeting held on 30th January 2017, has declared an interim divident of Rs. 2.5/- per equity share (on face value of Re 1/- per equity share) for financial year 2016-17.
10) The previous financial Quarters / Nine months / Year figures have been regrouped/rearranged wherever necessary to make them comparable.
On behalf of the Board of Directors
Motilal Oswal Financial Services Limited
Mumbai, 30th January, 2017 Motilal Oswal
[email protected] Chairman & Managing Director
Quarter Ended (Unaudited) Nine months Ended (Unaudited)
The above Segment information is presented on the basis of the reviewed consolidated financial statements. The company's operations predominantly relate to Broking and other related activities, Fund Based activities,
Asset Management & Advisory , Investment banking and Housing Finance. In accordance with Accounting Standard - 17 on Segment reporting, Broking and other related activities, Fund Based activities, Asset
Management & Advisory, Investment banking and Housing Finance are classified as reportable segments. The balance is shown as unallocated items.

31 Dec 2016