Morte Platform rMCZ Post-survey Site...
66
Morte Platform rMCZ Post-survey Site Report Contract Reference: MB0120 Report Number: 53 Version 2 April 2016
Transcript of Morte Platform rMCZ Post-survey Site...
Morte Platform rMCZ Post-survey Site Report
Contract Reference: MB0120
Report Number: 53 Version 2 April 2016

Project Title: Marine Protected Areas Data and Evidence Co-ordination Programme Report No 53. Title: Morte Platform rMCZ Post-survey Site Report Defra Project Code: MB0120 Defra Contract Manager: Carole Kelly Funded by: Department for Environment, Food and Rural Affairs (Defra) Marine Science and Evidence Unit Marine Directorate Nobel House 17 Smith Square London SW1P 3JR Authorship Louise Brown Centre for Environment, Fisheries and Aquaculture Science (Cefas) [email protected] Stefan Bolam Centre for Environment, Fisheries and Aquaculture Science (Cefas) [email protected] Acknowledgements We thank Anna Downie and Matthew Curtis, Cefas, for creating earlier drafts of this report. Disclaimer: The content of this report does not necessarily reflect the views of Defra, nor is Defra liable for the accuracy of information provided, or responsible for any use of the reports content. Although the data provided in this report have been quality assured, the final products - e.g. habitat maps – may be subject to revision following any further data provision or once they have been used in SNCB advice or assessments.

Cefas Document Control Title: Morte Platform rMCZ Post-survey Site Report
Submitted to: Marine Protected Areas Survey Co-ordination & Evidence Delivery Group
Date submitted: April 2016
Project Manager: David Limpenny
Report compiled by: Louise Brown, Stefan Bolam
Quality control by: Christopher Barrio Frojan
Approved by & date: Keith Weston (13/04/2016)
Version: V2
Version Control History
Author Date Comment Version
L Brown and S Bolam
27/01/2016 First draft V1
L Brown and S Bolam
13/04/2016 Revised following external reviewers’comments V2

Morte Platform rMCZ Post-survey Site Report i
Table of Contents
Table of Contents ........................................................................................................ i
List of Tables .............................................................................................................. iii
List of Figures ............................................................................................................. iv
1 Executive Summary: Report Card ................................................................. 1
1.1 Features proposed in the SAD for inclusion within the rMCZ designation ..... 1
1.2 Features present but not proposed in the SAD for inclusion within the rMCZ designation .................................................................................................... 2
1.3 Evidence of human activities occurring within the rMCZ ............................... 2
2 Introduction ................................................................................................... 3
2.1 Location of the rMCZ ..................................................................................... 3
2.2 Rationale for site position and designation .................................................... 4
2.3 Rationale for prioritising this rMCZ for additional evidence collection ........... 5
2.4 Survey aims and objectives .......................................................................... 5
3 Methods ........................................................................................................ 7
3.1 Acoustic data acquisition ............................................................................... 7
3.2 Ground truth sample acquisition .................................................................... 7
3.3 Production of the updated habitat map ......................................................... 9
3.4 Quality of the updated map ......................................................................... 11
4 Results ........................................................................................................ 13
4.1 Site Assessment Document (SAD) habitat map .......................................... 13
4.2 Updated habitat map based on new survey data ........................................ 14
4.3 Quality of the updated habitat map ............................................................. 16
4.4 Broadscale habitats identified ..................................................................... 16
4.5 Habitat FOCI identified ................................................................................ 17
4.6 Species FOCI identified .............................................................................. 17
4.7 Quality Assurance (QA) and Quality Control (QC) ...................................... 18
4.8 Data limitations and adequacy of the updated habitat map ......................... 18
4.9 Observations of human impacts on the seabed .......................................... 19
5 Conclusions ................................................................................................ 20
5.1 Presence and extent of broadscale habitats ............................................... 20
5.2 Presence and extent of habitat FOCI .......................................................... 20
5.3 Presence and distribution of species FOCI ................................................. 21
5.4 Evidence of human activities impacting the seabed .................................... 21
References ............................................................................................................... 22
Data sources ............................................................................................................ 24

Morte Platform rMCZ Post-survey Site Report ii
Annexes ................................................................................................................... 25
Annex 1. Broadscale habitat features listed in the ENG. ..................................... 25
Annex 2. Habitat FOCI listed in the ENG. ............................................................ 26
Annex 3. Low or limited mobility species FOCI listed in the ENG. ....................... 27
Annex 4. Highly mobile species FOCI listed in the ENG. ..................................... 28
Annex 5. Video and stills processing protocol. .................................................... 29
Appendices .............................................................................................................. 31
Appendix 1. Survey metadata ............................................................................... 31
Appendix 2. Outputs from acoustic surveys ......................................................... 34
Appendix 3. Evidence of human activities within the rMCZ ................................. 36
Appendix 4. Species list ....................................................................................... 37
Appendix 5. Analyses of sediment samples: classification and composition ....... 50
Appendix 6. BSH/EUNIS Level 3 descriptions derived from video and stills ........ 52
Appendix 7. Example images from survey for broadscale habitats ..................... 55
Appendix 8. Example images from survey for habitat FOCI ................................ 57

Morte Platform rMCZ Post-survey Site Report iii
List of Tables
Table 1. Broadscale habitats for which this rMCZ was proposed for designation. .... 4
Table 2. Habitat FOCI for which this rMCZ was proposed for designation. ............... 5
Table 3. Species FOCI for which this rMCZ was proposed for designation. .............. 5
Table 4. Description of derivatives calculated for bathymetry. ................................ 10
Table 5. Broadscale habitats identified in this rMCZ. .............................................. 17
Table 6. Habitat FOCI identified in this rMCZ. ......................................................... 17
Table 7. Species FOCI identified in this rMCZ. ....................................................... 17

Morte Platform rMCZ Post-survey Site Report iv
List of Figures
Figure 1. Location of the Morte Platform rMCZ. Bathymetry is from the Defra Digital Elevation Model (Astrium, 2011). ....................................................................... 4
Figure 2. Location of ground truth sampling sites in the Morte Platform rMCZ. Bathymetry displayed is from Defra’s Digital Elevation Model (Astrium, 2011). . 8
Figure 3. Habitat map from the Site Assessment Document. .................................. 14
Figure 4. Updated map of broadscale habitats based on newly acquired survey data. Insert maps show the location of ‘A4.1 High energy circalittoral rock’ observations. ................................................................................................... 15
Figure 5. Overall MESH confidence score for the updated broadscale habitat map. ......................................................................................................................... 16
Corrigendum
In July 2015 Defra declared the following amendments to reporting of Features of Conservation Importance (FOCI) in MPAG reports to reflect changes described within Defra MCZ consultation and designation material:
The habitat FOCI ‘Subtidal Sands and Gravels’ is considered to be adequately protected by its component broadscale habitat features, subtidal sand and/or subtidal coarse sediment, and is no longer included within MCZ designations.
The species FOCI ‘Stalked jellyfish (Haliclystus auricula)’ is now referred to as ‘Haliclystus species’ for the purpose of MCZ protection, to account for potential presence of Haliclystus octoradiatus that has not been consistently differentiated within scientific records. The
species are therefore considered jointly as an MCZ feature.
The species FOCI ‘Fan mussel (Atrina pectinata)’ should be correctly referred to as ‘Fan mussel (Atrina fragilis)’.
MCZs are no longer considered to be an appropriate tool for the protection of the species FOCI ‘European eel (Anguilla anguilla)’. They have been identified as habitat generalists for which it is particularly difficult to identify unique nursery or foraging grounds due to their wide distribution across coastal and freshwater zones. Conservation and management of European eels is considered to be more effectively achieved through the Eel Regulations and Eel Management Plans.
The species FOCI ‘Sea snail (Paludinella littorina)’ has been removed from Schedule 5 of the Wildlife and Countryside Act. This means that it is no longer a FOCI so has been removed as a feature for MCZ designation.
In January 2016 Defra declared the following amendments to reporting of Features of Conservation Importance (FOCI) in MPAG reports to reflect changes described within Defra MCZ consultation and designation material:
The habitat FOCI ‘Mud Habitats in Deep Water’ is considered to be adequately protected by its component broadscale habitat features, subtidal mud, and is no longer included within MCZ designations.
Whilst the agreed changes will be reflected in MCZ Post-survey Site Reports written after the declaration, those reports produced prior to August 2015 may still contain references to the above FOCI as they appeared in the original Ecological Network Guidance document (NE & JNCC, 2010).

Morte Platform rMCZ Post-survey Site Report 1
1 Executive Summary: Report Card
This report details the findings of a dedicated seabed survey at the Morte Platform recommended Marine Conservation Zone (rMCZ). The site is being considered for inclusion in a network of Marine Protected Areas (MPAs) in UK waters, designed to meet conservation objectives under the Marine and Coastal Access Act 2009. Prior to the dedicated survey, the site assessment had been made on the basis of best available evidence, drawn largely from historical data, modelled habitat maps and stakeholder knowledge of the area. The purpose of the survey was to provide direct evidence of the presence and extent of the broadscale habitats (BSH) and habitat FOCI (Features of Conservation Importance) that had been detailed in the original Site Assessment Document (SAD) (Lieberknecht et al., 2011).
This Executive Summary is presented in the form of a Report Card comparing the characteristics predicted in the original SAD with the updated habitat map and new sample data that result from the surveys of the site conducted by the Environment Agency (EA) in March 2012 and Cefas in November 2014. The comparison covers broadscale habitats and habitat FOCI.
1.1 Features proposed in the SAD for inclusion within the rMCZ designation
Feature
Extent according to
SAD
Extent according to updated habitat map
Accordance between SAD and updated habitat
map
Broadscale Habitats Presence Extent
A4.1 High energy circalittoral rock 4.86 km2 3 video stills* N/A N/A
A4.2 Moderate energy circalittoral rock 14.50 km2 3.11 km2 -11.39 km2
A5.1 Subtidal coarse sediment 6.11 km2 N/A* N/A N/A
Habitat FOCI
None proposed N/A N/A N/A N/A
Species FOCI
None proposed N/A N/A N/A N/A
* Although the BSH classes ‘A4.1 High energy circalittoral rock’ and ‘A5.1 Subtidal coarse sediment’ were observed during the 2012 and 2014 surveys, their extent could not be determined.

Morte Platform rMCZ Post-survey Site Report 2
1.2 Features present but not proposed in the SAD for inclusion within the rMCZ designation
Feature
Extent according to
SAD
Extent according to updated habitat map
Accordance between SAD and updated habitat
map
Broadscale Habitats Presence Extent
A5.1/5.4 Subtidal coarse/mixed sediments* N/A 22.34 km2 +22.34 km2
A5.6 Subtidal biogenic reefs** N/A 40 stills
Habitat FOCI
Subtidal Sands and Gravels*** 6.11 km2 N/A N/A N/A
Species FOCI
None observed N/A N/A N/A N/A
* A difference in the acoustic signature between BSHs ‘A5.1 Subtidal coarse sediment’ and ‘A5.4 Subtidal mixed sediments’ could not be detected. Therefore, the hybrid BSH ‘A5.1/5.4 Subtidal coarse/mixed sediments’ has been created. ** The BSH ‘A5.6 Subtidal biogenic reefs’ has been recorded based solely on still images as the exact nature of the biogenic reef could not be confirmed. *** Removed from list of habitat FOCI in July 2015. See Corrigendum. Its extent is the corrected value calculated using the estimated spatial extent of the BSH ‘A5.1 Subtidal coarse sediment’ stated in the SAD.
1.3 Evidence of human activities occurring within the rMCZ
There is evidence of three potential wrecks present within the boundaries of the rMCZ.
Morte Platform rMCZ Post-survey Site Report 3
2 Introduction
In accordance with the Marine and Coastal Access Act 2009, the UK is committed to the development and implementation of a network of Marine Protected Areas (MPAs). The network will incorporate existing designated sites (e.g. Special Areas of Conservation and Special Protection Areas) along with a number of newly designated sites which, within the English territorial waters and offshore waters of England, Wales and Northern Ireland, will be termed Marine Conservation Zones (MCZs). The first 27 rMCZs were designated in November 2013 and a second tranche of 23 rMCZs in January 2016.
In support of this initiative, four regional projects were set up to select sites that could contribute to this network because they contain one or more features specified in the Ecological Network Guidance (ENG; Natural England and the JNCC, 2010). The regional projects proposed a total of 127 rMCZs and compiled a Site Assessment Document (SAD) for each site. The SAD summarises what evidence was available for the presence and extent of the various habitat, species and geological features specified in the ENG, and for which the site was being recommended.
Due to the scarcity of survey-derived seabed habitat maps in UK waters, these assessments were necessarily made using best available evidence, which included historical data, modelled habitat maps and stakeholder knowledge of the areas concerned.
It became apparent that the best available evidence on features for which some sites had been recommended as MCZs was of variable quality. Consequently, Defra initiated a number of measures aimed at improving the evidence base, one of which took the form of a dedicated survey programme, implemented and co-ordinated by Cefas, to collect and interpret new survey data at selected rMCZ sites. This report provides an interpretation of the survey data collected jointly by the EA (during March 2012) and Cefas (during November 2014) personnel at the Morte Platform rMCZ.
2.1 Location of the rMCZ
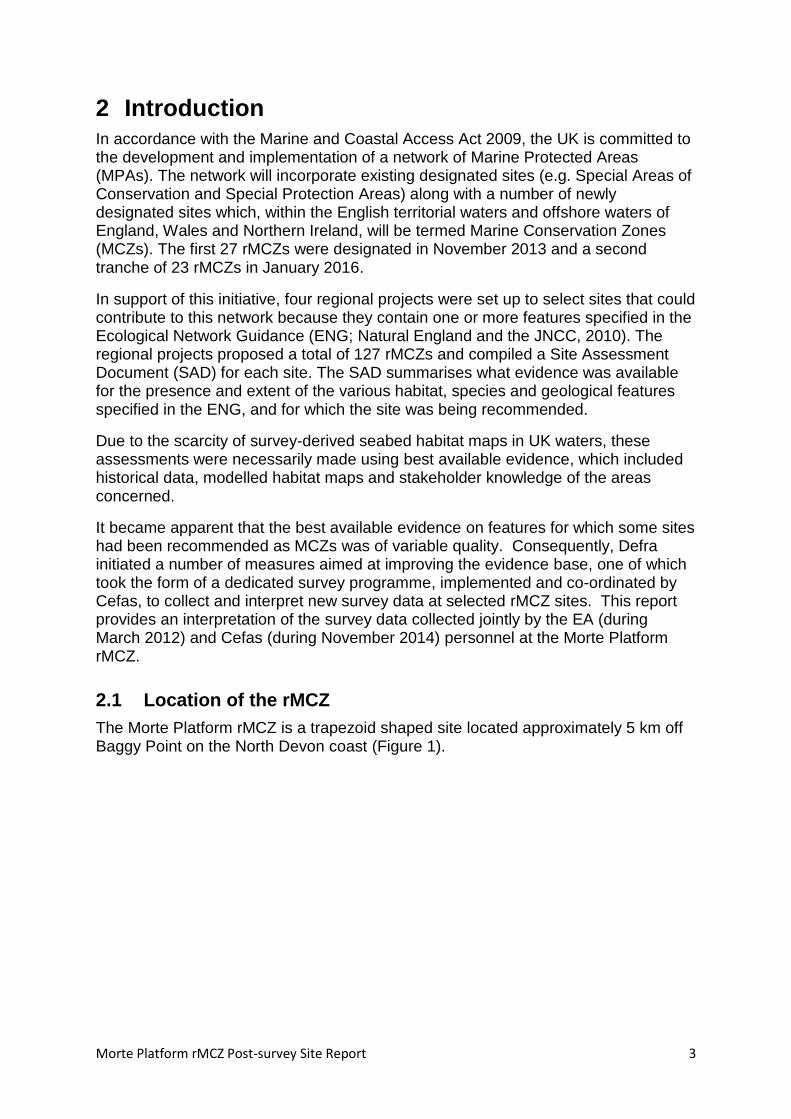
The Morte Platform rMCZ is a trapezoid shaped site located approximately 5 km off Baggy Point on the North Devon coast (Figure 1).

Morte Platform rMCZ Post-survey Site Report 4
Figure 1. Location of the Morte Platform rMCZ. Bathymetry is from the Defra Digital Elevation Model (Astrium, 2011).
2.2 Rationale for site position and designation
The Morte Platform rMCZ was included in the proposed network because of its contribution to Ecological Network Guidance (ENG) criteria to broadscale habitats, and its added ecological importance. For a detailed site description see ‘Finding Sanctuary final report and recommendations’ (Lieberknecht et al., 2011) and ‘The Marine Conservation Zone Project: Ecological Network Guidance’ (Natural England and the JNCC, 2010).
2.2.1 Broadscale habitats proposed for designation
Three broadscale habitats (BSH) were included in the recommendations for designation at this site (Table 1). See Annex 1 for the full list of broadscale habitats listed in the ENG.
Table 1. Broadscale habitats for which this rMCZ was proposed for designation.
EUNIS code & BSH Spatial extent according to the SAD
A4.1 High energy circalittoral rock 4.86 km2
A4.2 Moderate energy circalittoral rock 14.50 km2
A5.1 Subtidal coarse sediment 6.11 km2

Morte Platform rMCZ Post-survey Site Report 5
2.2.2 Habitat FOCI proposed for designation
The habitat FOCI ‘Subtidal Sands and Gravels’ proposed for designation within the Morte Platform rMCZ (Table 2) has since been removed from the list of FOCI. The full list of habitat FOCI is presented in Annex 2.
Table 2. Habitat FOCI for which this rMCZ was proposed for designation.
Habitat FOCI Spatial extent according to SAD
Subtidal Sands and Gravels* N/A
* Removed from list of habitat FOCI in July 2015. See Corrigendum.
2.2.3 Species FOCI proposed for designation
No ‘Low or limited mobility species’ and no ‘Highly mobile species’ FOCI were included in the recommendations for designation of this rMCZ (Table 3). The full list of these species FOCI is presented in Annexes 3 and 4.
Table 3. Species FOCI for which this rMCZ was proposed for designation.
Species FOCI Occurrence according to SAD
Low or limited mobility species
None proposed N/A
Highly mobile species
None proposed N/A
2.3 Rationale for prioritising this rMCZ for additional evidence collection
Prioritisation of rMCZ sites for further evidence collection was informed by a gap analysis and evidence assessment. The prime objective was to elevate the confidence status for as many rMCZs as feasible to support designation in terms of the amount and quality of evidence for the presence and extent of broadscale habitats and habitat FOCI and, where possible, species FOCI. The confidence status was originally assessed in the SADs according Technical Protocol E (Natural England and the JNCC, 2012).
The confidence score for the presence and extent of broadscale habitats and habitat FOCI reported for the Morte Platform rMCZ was Low/Moderate (Lieberknecht et al., 2011; JNCC and Natural England, 2012). This site was therefore prioritised for additional evidence collection.
2.4 Survey aims and objectives
Primary Objectives
To collect acoustic and groundtruthing data to allow the production of an updated map which could be used to inform the presence of broadscale habitats and habitat FOCI, and allow estimates to be made of their spatial extent within the rMCZ.

Morte Platform rMCZ Post-survey Site Report 6
Secondary Objectives
To provide evidence, where possible, of the presence of species FOCI listed within the ENG (Annexes 3 and 4) within the rMCZ.
To report evidence of human activity occurring within the rMCZ found during the course of the survey.
It should be emphasised that surveys were not primarily designed to address the secondary objectives under the current programme of work.
Whilst the newly collected data will be utilised for the purposes of reporting against the primary objectives of the current programme of work (given above), it is recognised that these data will be valuable for informing the assessment and monitoring of condition of given habitat features in the future.

Morte Platform rMCZ Post-survey Site Report 7
3 Methods
3.1 Acoustic data acquisition
Multibeam echosounder (MBES) bathymetry and backscatter data were collected at the Morte Platform rMCZ as part of the Civil Hydrography Programme (CHP) in 2002. However, the quality of the backscatter data was not sufficient for habitat mapping purposes. Therefore, another 100% coverage MBES survey was undertaken aboard the RV Cefas Endeavour in November 2014 (Cruise code: CEND 2514). Multibeam bathymetry and backscatter data were acquired using the Kongsberg EM2040 system operated at 300 kHz and deployed on the drop keel, which was lowered to its full extent to minimise the influence of poor weather on the acoustic signal.
The raw multibeam bathymetry data were processed using CARIS HIPS. All bathymetric data were collected and processed in accordance with the International Hydrographic Organisation (IHO) Standards for Hydrographic Surveys – Order 1 (Special Publication 44, Edition 4). Multibeam backscatter data were processed with Fledermaus Geocoder Toolbox to produce standard floating point (FP) geotiffs. Both bathymetry and backscatter datasets were gridded at 1 m resolution for analysis (see Appendix 2 for images derived from acoustic data).
3.2 Ground truth sample acquisition
Ground truth samples were collected during two surveys using a combination of grab and camera sampling techniques. The grab sampler was used to collect seabed sediments and associated fauna, while the underwater camera was used to collect both video and still images of the seabed (Figure 2; Appendix 1).
The first survey was undertaken by the EA on board the CSV Water Guardian (Cruise code: WGDN0412) in March 2012. For this survey, 45 stations were selected, based on a triangular lattice grid, for sediment sampling and drop camera work. Stations were spaced 0.75 km apart to ensure sufficient samples would be collected from each predicted broadscale habitat within the SAD map. Grab sampling was attempted first at each station and if this was unsuccessful the drop camera was deployed.
The second survey was undertaken on board the RV Cefas Endeavour (Cruise code: CEND2514) in November 2014. Ground truth sampling positions were also based on a 0.75 km spaced triangular lattice grid, but station positions were adjusted, based on the newly acquired MBES data, to improve the success rate of attaining a valid sample. Drop camera tows were undertaken at a subset of these stations (approx. one third of planned ground truth sampling stations) or when the acoustic data suggested the presence of a rocky substrate.

Morte Platform rMCZ Post-survey Site Report 8
Figure 2. Location of ground truth sampling sites in the Morte Platform rMCZ. Bathymetry displayed is from Defra’s Digital Elevation Model (Astrium, 2011).
In 2012, a Day grab was used during the early part of the survey due to inclement weather and sea conditions. The mini-Hamon grab was adopted during this survey as sea conditions abated, and this grab type was used at all stations during the 2014 survey. On recovery of the mini-Hamon grab, the contents were emptied into a large plastic container and a representative sub-sample of sediment (approx. 0.5 l) taken for Particle Size Analysis (PSA). The remaining sample was photographed and sieved over a 1 mm mesh sieve to collect the benthic fauna. Retained fauna were preserved in buffered formaldehyde solution for later processing ashore. The Day grab samples were treated in an identical manner as the mini-Hamon grab samples, except that PSA sub-samples were taken from the undisturbed sediment using a small sub-corer (3 cm diameter).
Video observations were made using a Drop Camera (DC) system which had the capability to collect both video and still images. A four-point laser device was used to provide a reference scale in the video and still images. Set-up and operation followed the MESH ‘Recommended Operating Guidelines (ROG) for underwater video and photographic imaging techniques’ (Coggan et al., 2007). Video was recorded simultaneously to a Sony GV-HD700 DV tape recorder and a computer hard drive. A video overlay was used to provide station metadata, time and position (of the GPS antenna) in the recorded video image. Camera tows lasted a minimum of 10 minutes, with the DC system being towed at ~0.3 knots. Still images were captured at regular one minute intervals (or every 10-15 metres on the 2012 survey) and opportunistically if specific features of interest were encountered. Video and still images were analysed following an established protocol developed and used by
Morte Platform rMCZ Post-survey Site Report 9
Cefas (Coggan and Howell, 2005; JNCC, in prep.; see Annex 5). Only still photographs (no video footage) were acquired during the 2012 survey.
For further detail on ground truth sample collection see the Morte Platform rMCZ Survey Reports (Godsell et al. (2013) for the 2012 survey; Murray (2015) for the 2014 survey).
3.3 Production of the updated habitat map
An updated habitat map was produced following analysis and interpretation of the newly acquired acoustic and ground truth data. Acoustic data were converted into raster images for ease of interpretation (see Appendix 2). The data integration and mapping process involved object-based image analysis and statistical modelling, as described below.
Object-based image analysis (OBIA) is a two-step process of segmentation and classification (Blaschke, 2010), implemented using the software package eCognition v9.0.2. Objects were created through segmenting the raster data layers. The resulting objects represent sections of the image which possess homogeneous characteristics across all data layers used in the segmentation process.
For each of the identified objects, mean and standard deviation values of primary acoustic data layers and their derivatives were calculated. These values were extracted to PSA point samples and observations of hard substrates in still images for statistical analysis. Rules used to split objects into habitat types in the classification step of OBIA were determined by applying Conditional Inference Tree analysis (CI; Hothorn et al., 2006) to the sample data. CI combines recursive binary partitioning with conditional inference procedures, embedding statistical tests into each classification split. The statistical analyses were carried out in the statistical programming environment R (R Development Core Team, 2012). A step-by-step description of the acoustic data analysis process is given below.
Stage 1. Data preparation
Prior to analysis, the bathymetry and backscatter datasets were re-sampled onto a common grid at 1 m resolution. This step results in a spatial grid with a single value for bathymetry (depth) and a single value for backscatter (acoustic reflectance) in each 1 m x 1 m grid cell and it is these data values that are used in the rest of the process.
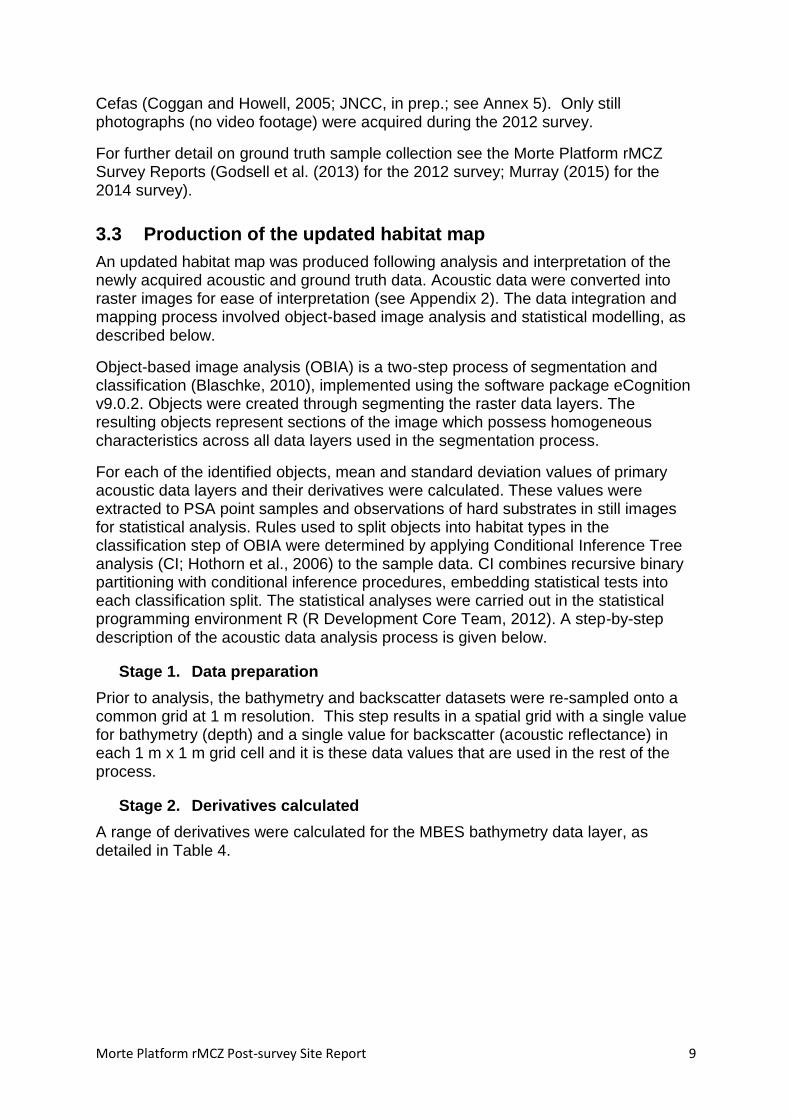
Stage 2. Derivatives calculated
A range of derivatives were calculated for the MBES bathymetry data layer, as detailed in Table 4.

Morte Platform rMCZ Post-survey Site Report 10
Table 4. Description of derivatives calculated for bathymetry.
Derivative Description
Slope The slope in degrees using the maximum change in elevation of each cell and its 8 neighbours
Roughness Calculated as the difference between the maximum and minimum value of each cell and its 8 neighbours
Curvature (profile and planar)
Curvature parallel to the direction of slope (profile) and perpendicular to the direction of slope (planar)
BPI Bathymetric position index (Lundblad et al., 2006); radii of 3, 5, 10, 25 cells
Aspect Expressed as eastness and northness (Wilson et al., 2007)
Stage 3. Segmentation and classification
Based on spectral characteristics, images generated from acoustic data can be segmented into small objects. Each object can be defined by a range of features including its layer statistics (mean, mode, standard deviation, skewness, etc.), geometry (extent, shape, etc.) and texture. The segmentation process was undertaken using multi-resolution segmentation. Multi-resolution segmentation commences with a single pixel and consecutively merges it with neighbouring pixels, based on the relative homogeneity criterion. The homogeneity criterion is based on both colour (standard deviation of spectral colours) and shape (standard deviation of a compact shape) of the pixel. The segmentation process continues until a threshold value for the scale parameter, determined by the analyst, is reached. The scale parameter determines the variability allowed within each object. The ultimate aim of the segmentation process is to create objects which represent areas of homogeneity within the image.
The segmentation and classification of the acoustic data for the Morte Platform rMCZ occurred in two stages. The aim of the first segmentation was to define and classify the extent of rock within the rMCZ, while that of the second segmentation was to define and classify the extent of sedimentary habitats within the rMCZ.
Rock segmentation and classification
When identifying the extent of rocky habitats within the Morte Platform rMCZ the bathymetry, backscatter and slope were used within the multi-resolution segmentation process with weightings of 1, 1, and 3 respectively. The segmentation was undertaken at the pixel level with a scale parameter of 5. These weightings and scale parameter were used as they best selected the distribution of rock within this site.
For each object created in this segmentation process, the mean and standard deviation values of the primary acoustic layers (e.g. mean bathymetry value for the grid cells lying within an object) and their derivatives outlined in Table 4 (roughness, slope, etc.) were calculated. Grey level co-occurrence matrix (GLCM) texture values, entropy and homogeneity, were also calculated for backscatter. These object-features and related values were exported as GIS shapefiles and extracted to each location associated with ground truthing samples. Ground truthing samples were either classified as “Rock” or “Sediment” depending on their broadscale habitat classification. This provided an analysis dataset for the classification process.

Morte Platform rMCZ Post-survey Site Report 11
The distribution of values for backscatter, bathymetry and bathymetric derivatives in the broadscale habitat classes found in the ground truth data were analysed to find the variables that best defined habitat classes. CI analysis (Hothorn et al., 2006) was used to identify the acoustic variables that most successfully differentiated between the observed broadscale habitats in the ground truthing datasets, and to establish the best cut-off values for those variables.
To produce the updated habitat map, the segmentation objects were classified according to the cut-off values identified in the CI analysis for the appropriate variables and the resulting classified objects were exported into GIS.
Sediment segmentation and classification
To classify the extent of sedimentary habitats within the rMCZ the regions of the Morte Platform rMCZ not classified as rocky habitats were resegmented. Firstly, a chessboard segmentation was undertaken at the image object level. A multi-resolution segmentation was then undertaken, also at the image object level, using slope, bathymetry and backscatter (weightings of 1, 2 and 3 respectively) with a scale parameter of 5. These weightings and scale parameter were used as they best selected the distribution of sedimentary habitats within this site. For each object created in this segmentation process, the mean and standard deviation values of the primary acoustic layers (e.g. mean bathymetry value for the grid cells lying within an object) and their derivatives outlined in Table 4 (roughness, slope, etc.) were calculated. Grey level co-occurrence matrix (GLCM) texture, entropy and homogeneity values were also calculated for backscatter. Finally, a spectral difference segmentation was used to fuse spectrally similar objects. These objects were exported as GIS shapefiles and extracted to each location associated with a ground truth sample. Groundtruthing samples were restricted to the sedimentary BSH classes ‘A5.1 Subtidal coarse sediment’ and ‘A5.4 Subtidal mixed sediments’.
The sedimentary data from PSA samples were analysed to determine whether a real difference could be identified between the two sediment types. However, it was decided that the boundary between BSHs ‘A5.1 Subtidal coarse sediment’ and ‘A5.4 Subtidal mixed sediments’ could not be distinguished with confidence. Therefore, sedimentary habitats were defined using a hybrid BSH classification ‘A5.1/5.4 Subtidal coarse/mixed sediments’.
Finally, the updated broadscale habitat map was exported as a GIS shapefile.
3.4 Quality of the updated map
The technical quality of the updated habitat map was assessed using the MESH ‘Confidence Assessment’ Tool1, originally developed by an international consortium of marine scientists working on the MESH (Mapping European Seabed Habitats) project. This tool considers the provenance of the data used to make a biotope/habitat map, including the techniques and technology used to characterise the physical and biological environment, and the expertise of the people who made the map. In its original implementation, the tool was used to make an auditable judgement of the confidence that could be placed on a range of existing, local biotope maps that had been developed using different techniques and data inputs, to
1 http://emodnet-seabedhabitats.eu/confidence/confidenceAssessment.html [Accessed 03/12/15]
Morte Platform rMCZ Post-survey Site Report 12
be used in compiling a full coverage map for northwest Europe. Where two of the original maps overlapped, that with the highest MESH confidence score would take precedence in the compiled map.
Subsequent to the MESH project, the confidence assessment tool has been applied to provide a benchmark score that reflects the technical quality of newly developed habitat/biotope maps. Both physical and biological survey data are required to achieve the top mark of 100 but, as the current MCZ exercise requires the mapping of broadscale physical habitats not biotopes, it excludes the need for biological data. In the absence of biological data, the maximum score attainable for a map based purely on physical data is 88.
In applying the tool to the current work, none of the weighting options were altered; that is, the tool was applied in its standard form, as downloaded from the internet.

Morte Platform rMCZ Post-survey Site Report 13
4 Results
During the 2012 survey, a total of 13 out of 45 targeted stations were successfully sampled using a combination of 0.1 m2 mini-Hamon and Day grabs. Eighteen drop camera tows were conducted from the 45 targeted stations, however, poor visibility during the tows resulted in the data acquired being of insufficient quality for any subsequent analyses at all but six of these.
A total of 31 grabs were collected from the 54 planned stations during the 2014 survey, while underwater video and still images were successfully acquired at 37 stations.
The combined list of benthic taxa found in the grab and video samples from both the 2012 and 2014 surveys is presented in Appendix 4; a total of 421 and 104 taxa were recorded from the grab and video samples respectively. No species FOCI were recorded at the Morte Platform rMCZ during either of the two surveys.
A summary of the results from particle size analysis of the sediments from the grab samples is given in Appendix 5. Of the 44 stations from the two surveys where a sample was obtained, coarse sediment was recorded at 22 stations and mixed sediments were recorded at a further 22 stations.
The results from the analysis of the seabed video and stills are summarised in Appendix 6. Example images taken during the survey of the BSHs recorded in the video analysis are given in Appendix 7.
4.1 Site Assessment Document (SAD) habitat map
The SAD habitat map (Figure 3) was produced using modelled data from the UKSeaMap 2010 v5 (McBreen et al., 2011). For further detail see Lieberknecht et al. (2011).

Morte Platform rMCZ Post-survey Site Report 14
Figure 3. Habitat map from the Site Assessment Document.
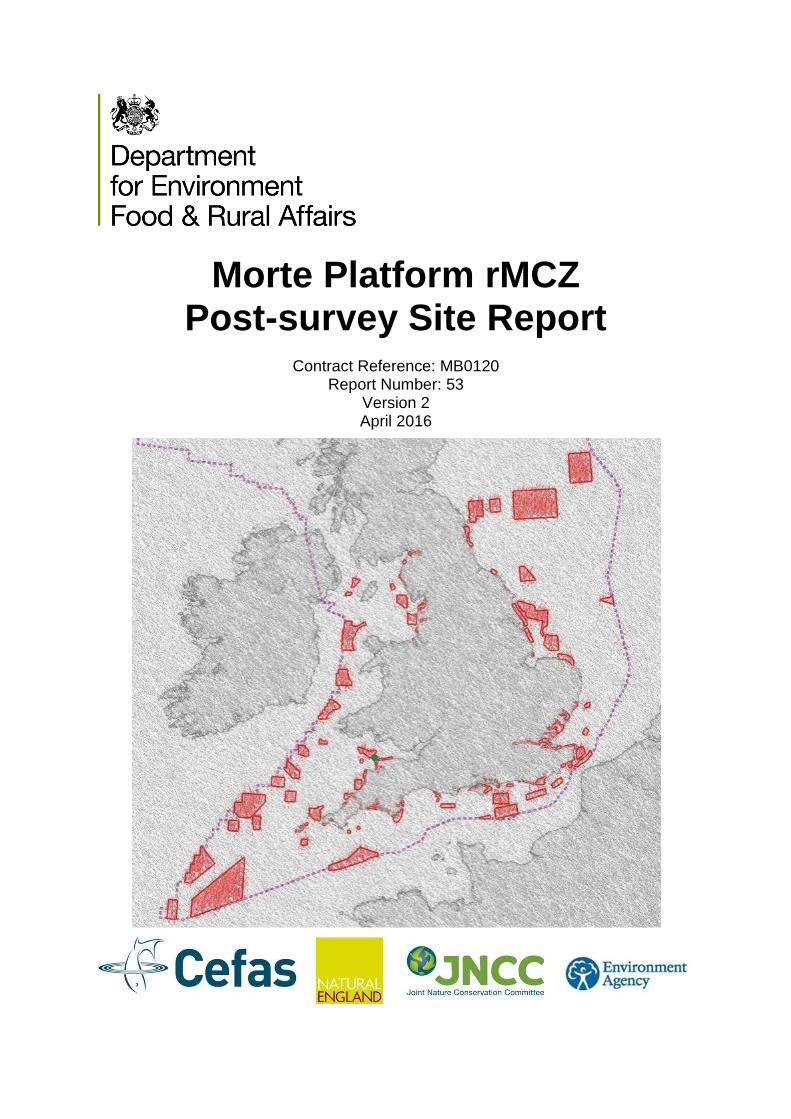
4.2 Updated habitat map based on new survey data
The updated habitat map resulting from an integrated analysis of the 2012 and 2014 dedicated survey data is presented in Figure 4. The results from the PSA suggest that the majority of the site consists of the BSHs ‘A5.1 Subtidal coarse sediment’ and ‘A5.4 Subtidal mixed sediments’. However, it is has not been possible in this instance to define the extent of these two broadscale habitats individually (see Section 3.3); they have, therefore, been defined as a mosaic of both BSHs, labelled as ‘A5.1/5.4 Subtidal coarse/mixed sediments’. It was possible to predict the extent of rocky habitats in this rMCZ using photographs taken during video tows. ‘A4.1 High energy circalittoral rock’ and ‘A4.2 Moderate energy circalittoral rock’ were both observed during the ground truthing process. However, despite ‘A4.1 High energy circalittoral rock’ being observed, all rocky habitats were classified as representing the BSH ‘A4.2 Moderate energy circalittoral rock’. This is because the extent of ‘A4.1 High energy circalittoral rock’ could not be extrapolated across the entire site due to insufficient observations of the BSH (only three stills were classed as such). Therefore, observations of ‘A4.1 High energy circalittoral rock’ have been plotted as points on the updated habitat map (Figure 4). The BSH ‘A5.6 Subtidal biogenic reefs’ was observed to be present from stills and video footage, however it is not possible to confidently ascertain the reef status solely based on this information. Therefore, while the BSH ‘A5.6 Subtidal biogenic reefs’ is named within this report, further dedicated survey work is needed to determine the true presence and extent of this BSH. In addition, it was not always possible to confidently distinguish between this BSH and ‘A5.4 Subtidal mixed sediments’. Therefore, images classified as the BSH ‘A5.6 Subtidal biogenic reefs’ have been plotted as point observations.

Morte Platform MCZ Post-survey Site Report 15
Figure 4. Updated map of broadscale habitats based on newly acquired survey data. Insert maps show the location of ‘A4.1 High energy circalittoral rock’ observations.
Morte Platform rMCZ Post-survey Site Report 16
4.3 Quality of the updated habitat map
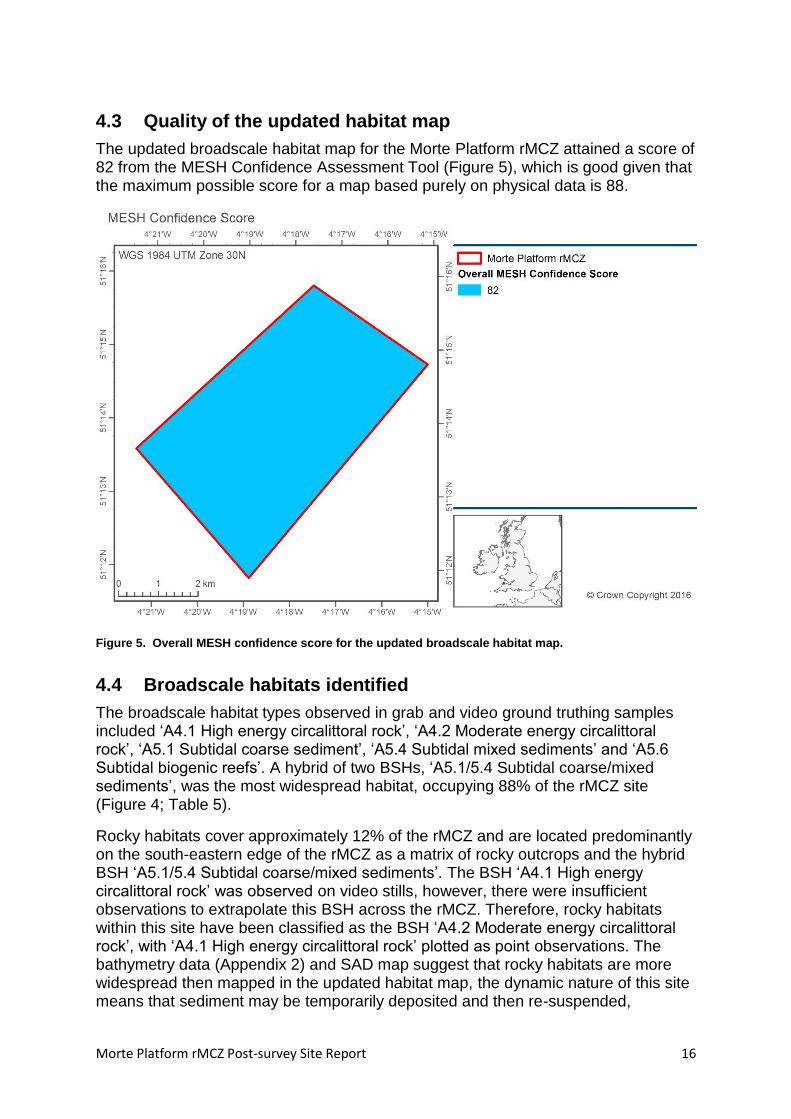
The updated broadscale habitat map for the Morte Platform rMCZ attained a score of 82 from the MESH Confidence Assessment Tool (Figure 5), which is good given that the maximum possible score for a map based purely on physical data is 88.
Figure 5. Overall MESH confidence score for the updated broadscale habitat map.
4.4 Broadscale habitats identified
The broadscale habitat types observed in grab and video ground truthing samples included ‘A4.1 High energy circalittoral rock’, ‘A4.2 Moderate energy circalittoral rock’, ‘A5.1 Subtidal coarse sediment’, ‘A5.4 Subtidal mixed sediments’ and ‘A5.6 Subtidal biogenic reefs’. A hybrid of two BSHs, ‘A5.1/5.4 Subtidal coarse/mixed sediments’, was the most widespread habitat, occupying 88% of the rMCZ site (Figure 4; Table 5).
Rocky habitats cover approximately 12% of the rMCZ and are located predominantly on the south-eastern edge of the rMCZ as a matrix of rocky outcrops and the hybrid BSH ‘A5.1/5.4 Subtidal coarse/mixed sediments’. The BSH ‘A4.1 High energy circalittoral rock’ was observed on video stills, however, there were insufficient observations to extrapolate this BSH across the rMCZ. Therefore, rocky habitats within this site have been classified as the BSH ‘A4.2 Moderate energy circalittoral rock’, with ‘A4.1 High energy circalittoral rock’ plotted as point observations. The bathymetry data (Appendix 2) and SAD map suggest that rocky habitats are more widespread then mapped in the updated habitat map, the dynamic nature of this site means that sediment may be temporarily deposited and then re-suspended,

Morte Platform rMCZ Post-survey Site Report 17
meaning that there is the potential for the relative proportion of rock and sediment across the site to change depending on other environmental factors. This means that the ratio of sedimentary to rocky habitats could vary over time.
The BSH ‘A5.6 Subtidal biogenic reefs’ was observed within the video and stills groundtruthing data. However, CI could not accurately predict its spatial extent due to it having a similar signature to that of the hybrid BSH ‘A5.1/5.4 Subtidal coarse/mixed sediments’. Therefore, the category ’A5.6 Subtidal biogenic reefs’ was not used in the CI process as it introduced too much uncertainty and was therefore plotted as point observations on the updated broadscale habitat map (Figure 4).
Table 5. Broadscale habitats identified in this rMCZ.
Broadscale Habitat Type (EUNIS Level 3)
Spatial extent according to the SAD
Spatial extent according to the updated habitat map
A4.1 High energy circalittoral rock 4.86 km2 3 stills
A4.2 Moderate energy circalittoral rock 14.50 km2 3.11 km2
A5.1 Subtidal coarse sediment 6.11 km2 N/A*
A5.4 Subtidal mixed sediments N/A N/A*
A5.1/5.4 Subtidal coarse/mixed sediments N/A 22.34 km2
A5.6 Subtidal biogenic reefs** N/A 40 stills
* It was not possible to calculate the extent of this BSH in isolation because it had the same acoustic signature as another BSH. The extent of the hybrid BSH is provided. ** The BSH ‘A5.6 Subtidal biogenic reefs’ has been identified on still images only. Further dedicated survey work is needed to confirm reef status.
4.5 Habitat FOCI identified
The habitat FOCI ‘Subtidal Sands and Gravels’ identified within the SAD has since been removed from the list of FOCI (Table 6), therefore its extent has not been calculated in the updated habitat map.
Table 6. Habitat FOCI identified in this rMCZ.
Habitat FOCI Spatial extent according
to the SAD Spatial extent according to
the updated habitat map
Subtidal Sands and Gravels* 6.11 km2** N/A
* Removed from list of habitat FOCI in July 2015. See Corrigendum. ** This is the corrected value calculated using the estimated spatial extent of the BSH ‘A5.1 Subtidal coarse sediment’ in the SAD.
4.6 Species FOCI identified
No species FOCI were recorded at the Morte Platform rMCZ during the 2012 and 2014 dedicated surveys.
Table 7. Species FOCI identified in this rMCZ.
Species FOCI Previously recorded
within rMCZ Identified during evidence
gathering survey
Low or Limited Mobility Species
None recorded N/A N/A
Highly Mobile Species
None recorded N/A N/A

Morte Platform rMCZ Post-survey Site Report 18
4.7 Quality Assurance (QA) and Quality Control (QC)
4.7.1 Acoustic data
Acquisition and processing of the bathymetry data complied with the International Hydrographic Organisation (IHO) Standards for Hydrographic Surveys-Order 1 (Special Publication 44, Edition 4). The accompanying multibeam backscatter data were reviewed and processed by specialist Cefas staff to ensure that they were suitable for use in the subsequent interpretations and production of the updated habitat map.
4.7.2 Particle Size Analysis of sediments
PSA on the samples collected in 2012 was carried out by the National Laboratory Service, Environment Agency, and Cefas, while Cefas conducted the PSA on those collected in 2014. All PSA procedures followed standard laboratory practices and complied with the recommendations of the National Marine Biological Analytical Quality Control (NMBAQC) scheme (Mason, 2011). Over-arching quality assurance checks were completed by Cefas. The habitat classification and composition based on the results of the PSA is shown in Appendix 5.
4.7.3 Infaunal samples from grabs
Infaunal samples taken during the 2012 survey were processed by Hebog Environmental Ltd, and those from the 2014 survey were processed by MES Ltd. Infaunal processing followed standard laboratory practices and the results were checked in accordance with the recommendations of the NMBAQC scheme (Worsfold et al., 2010).
4.7.4 Video and still images and analysis
Video and photographic stills from the 2012 survey were processed by RSS Marine Ltd, while those obtained during the 2014 survey were processed by Seastar Surveys Ltd. All processing was conducted in accordance with the guidance documents developed by Cefas and the Joint Nature Conservation Committee (JNCC) for the acquisition and processing of video and stills data (Coggan and Howell, 2005; JNCC, in prep.; summarised in Annex 5).
4.8 Data limitations and adequacy of the updated habitat map
The 2012 and 2014 surveys have provided substantial and robust evidence of the presence of the broadscale habitats mapped. The quality of the derived habitat map, in which a hybrid BSH class has been mapped, is assessed to be High (MESH assessment tool). It was not possible to differentiate between the BSHs ‘A5.1 Subtidal coarse sediment’ and ‘A5.4 Subtidal mixed sediments’ and map them separately, as the acoustic signatures of each BSH type were statistically indistinguishable. Also, sources of potential misclassification of habitats arise from the location of groundtruthing samples in relation to habitat types.
Although the BSHs ‘A4.1 High energy circalittoral rock’ and ‘A5.6 Subtidal biogenic reefs’ were observed in the groundtruthing samples, it was not possible to predict

Morte Platform rMCZ Post-survey Site Report 19
their extent across the whole site. It was not possible to predict the extent of ‘A4.1 High energy circalittoral rock’ due to the insufficient number of samples representing this BSH. It was not possible to predict the extent of ‘A5.6 Subtidal biogenic reefs’ due to the similarity of its acoustic signature with ‘A5.1/5.4 Subtidal coarse/mixed sediments’. Therefore, these two BSHs were plotted as point observations on the updated broadscale habitat map.
It is impractical (and undesirable) to sample the entire area of the site with grabs and video, so there is a chance that a BSH or FOCI may exist within the site which has not been recorded, especially if it was limited in extent.
The precise location of the boundaries between the broadscale habitats depicted on the map should be regarded as indicative, not definitive. In nature, such boundaries are rarely abrupt and normally, one BSH grades into another across a transitional boundary. In contrast, the mapped boundaries are abrupt and have been placed using best professional judgement. This may have implications when calculating the overall extent of any of the mapped habitats or FOCI.
The updated broadscale habitat map is a snapshot representing the distribution of broadscale habitat types at the time of survey. It is also important to note that the habitat boundaries delineated in this report are likely to shift with variations in hydrodynamic conditions, which will re-suspend and re-deposit the finer fraction of the sediments, covering and exposing underlying rocky habitats in the process.
4.8.1 Presence of Species FOCI
No species FOCI were included in the recommendations for proposal of this rMCZ, and none was recorded during the 2012 and 2014 surveys for this site.
4.9 Observations of human impacts on the seabed
There is evidence from the MBES bathymetry and backscatter images of three potential wrecks present within the boundaries of the Morte Platform rMCZ (see Appendix 3).

Morte Platform rMCZ Post-survey Site Report 20
5 Conclusions
5.1 Presence and extent of broadscale habitats
5.1.1 Presence
The 2012 and 2014 dedicated groundtruthing surveys have confirmed the presence of the BSHs ‘A4.1 High energy circalittoral rock’, ‘A4.2 Moderate energy circalittoral rock’ and ‘A5.1 Subtidal coarse sediment’ which were included in the recommendations made by the SAD for designating this site as an MCZ.
The 2012 and 2014 dedicated groundtruthing surveys have confirmed the presence of BSHs ‘A5.4 Subtidal mixed sediments’ and ‘A5.6 Subtidal biogenic reefs’. These BSHs were not included in the recommendations made by the SAD for designating this site as an MCZ.
The BSH ‘A5.6 Subtidal biogenic reefs’ was identified from video footage and still photographs, therefore, further survey work is required to confidently ascertain the presence and extent of this BSH.
The BSHs ‘A5.1 Subtidal coarse sediment’ and ‘A5.4 Subtidal mixed sediments’ could not be distinguished from one another on the acoustic data record, therefore a hybrid BSH type has been defined as ‘A5.1/5.4 Subtidal coarse/mixed sediments’.
5.1.2 Extent
The spatial extent of the BSH ‘A4.2 Moderate energy circalittoral rock’ is 3.11 km2. This is 11.39 km2 less than its extent in the SAD habitat map.
The spatial extent of each of the BSHs ‘A5.1 Subtidal coarse sediment’ and ‘A5.4 Subtidal mixed sediments’ could not be determined in the mapping process.
The spatial extent of the BSH hybrid ‘A5.1/5.4 Subtidal coarse/mixed sediments’ is 22.34 km2. This was not identified in the SAD map.
The spatial extent of each of the BSHs ‘A4.1 High energy circalittoral rock’ and ‘A5.6 Subtidal biogenic reefs’ could not be determined during the mapping process. Occurrence of both BSHs has been represented as point data on the updated habitat map.
5.2 Presence and extent of habitat FOCI
5.2.1 Presence
The 2012 and 2014 dedicated groundtruthing surveys did not identify any habitat FOCI.

Morte Platform rMCZ Post-survey Site Report 21
5.3 Presence and distribution of species FOCI
5.3.1 Low or limited mobility species
No low or limited mobility species were recorded at this site during the 2012 or 2014 dedicated surveys. This observation is consistent with the evidence presented in the SAD.
5.3.2 Highly mobile species FOCI
No highly mobile species FOCI were recorded at this site during the 2012 or 2014 dedicated surveys. This observation is consistent with the evidence presented in the SAD.
5.4 Evidence of human activities impacting the seabed
There is evidence from the MBES bathymetry and backscatter images of three potential wrecks present within the boundaries of the rMCZ (Appendix 3).

Morte Platform rMCZ Post-survey Site Report 22
References
Astrium (2011). Creation of a high resolution Digital Elevation Model (DEM) of the British Isles continental shelf: Final Report. Prepared for Defra, Contract Reference: 13820. 26 pp.
Blaschke, T. (2010). Object based image analysis for remote sensing. ISPRS Journal of Photogrammetry and Remote Sensing 65, 2-16.
Coggan, R., Mitchell, A., White, J. and Golding, N. (2007). Recommended operating guidelines (ROG) for underwater video and photographic imaging techniques. www.searchmesh.net/PDF/GMHM3_video_ROG.pdf [Accessed 03/12/15]
Coggan, R. and Howell, K. (2005). Draft SOP for the collection and analysis of video and still images for groundtruthing an acoustic basemap. Video survey SOP version 5. 10 pp.
Godsell, N., Fraser, M. and Jones, N. (2013) Morte Platform rMCZ.
JNCC (in prep.). Video/Stills Camera Standard Operating Procedure for Survey and Analysis: for groundtruthing and classifying an acoustic basemap, and development of new biotopes within the UK Marine Habitat Classification. JNCC Video and Stills Processing SOP v2. 6 pp.
JNCC and Natural England (2012). Marine Conservation Zone Project: JNCC and Natural England's advice to Defra on recommended Marine Conservation Zones. Peterborough and Sheffield. 1455 pp.
Lieberknecht, L.M., Hooper, T.E.J., Mullier, T.M., Murphy, A., Neilly, M., Carr, H., Haines, R., Lewin, S., and Hughes, E. (2011) Finding Sanctuary final report and recommendations.
Lundblad, E. R., Wright, D. J., Miller, J., Larkin, E. M., Rinehart, R., Naar, D. F., Donahue, B. T., Anderson, S. M. and Battista, T. (2006). A benthic terrain classification scheme for American Samoa. Marine Geodesy 29, 89-111.
Mason, C. (2011). NMBAQC’s Best Practice Guidance Particle Size Analysis (PSA) for Supporting Biological Analysis.
McBreen, F., Askew, N., Cameron, A., Connor, D., Ellwood, H. and Carter, A. (2011). UKSeaMap 2010 v5: Predictive mapping of seabed habitats in UK waters. JNCC Report, No. 446. Available online from http://jncc.defra.gov.uk/ukseamap.
Murray, J. (2015) Morte Platform Survey Report.
Natural England and the Joint Nature Conservation Committee (2010). The Marine Conservation Zone Project: Ecological Network Guidance. Sheffield and Peterborough, UK.
Natural England and the Joint Nature Conservation Committee (2012). SNCB MCZ Advice Project-Assessing the scientific confidence in the presence and extent of features in recommended Marine Conservation Zones (Technical Protocol E)

Morte Platform rMCZ Post-survey Site Report 23
R Development Core Team (2012). R: A language and environment for statistical computing. R Foundation for Statistical Computing. Vienna, Austria. ISBN 3-900051-07-0, URL http://www.R-project.org [Accessed 08/01/16]
Wilson, M.F.J., O’Connell, B., Brown, C., Guinan, J.C. and Grehan, A.J. (2007). Multiscale terrain analysis of multibeam bathymetry data for habitat mapping on the continental slope. Marine Geodesy 30, 3-35.
Worsfold, T.M., Hall, D.J. and O’Reilly, M. (2010). Guidelines for processing marine macrobenthic invertebrate samples: a processing requirements protocol version 1 (June 2010). Unicomarine Report NMBAQCMbPRP to the NMBAQC Committee. 33 pp. http://www.nmbaqcs.org/media/1175/nmbaqc-inv-prp-v10-june2010.pdf [Accessed 08/01/16]

Morte Platform rMCZ Post-survey Site Report 24
Data sources
All enquiries in relation to this report should be addressed to the following e-mail address: [email protected]
Morte Platform rMCZ Post-survey Site Report 25
Annexes
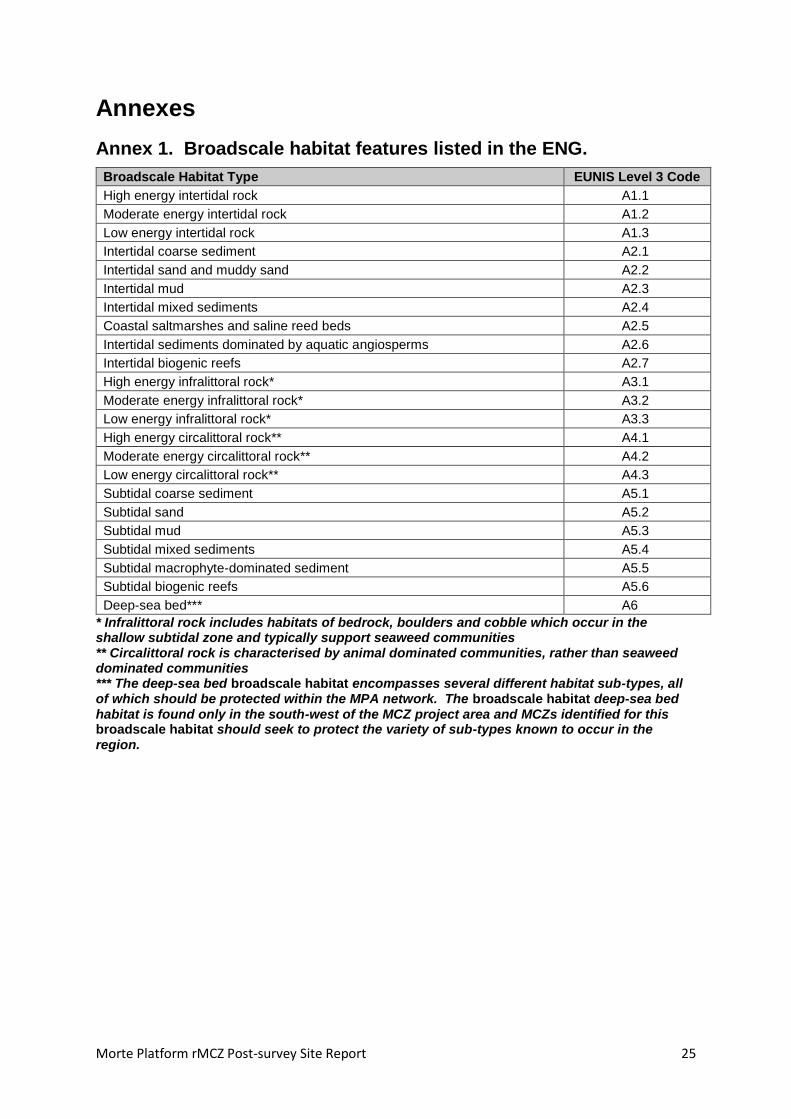
Annex 1. Broadscale habitat features listed in the ENG.
Broadscale Habitat Type EUNIS Level 3 Code
High energy intertidal rock A1.1
Moderate energy intertidal rock A1.2
Low energy intertidal rock A1.3
Intertidal coarse sediment A2.1
Intertidal sand and muddy sand A2.2
Intertidal mud A2.3
Intertidal mixed sediments A2.4
Coastal saltmarshes and saline reed beds A2.5
Intertidal sediments dominated by aquatic angiosperms A2.6
Intertidal biogenic reefs A2.7
High energy infralittoral rock* A3.1
Moderate energy infralittoral rock* A3.2
Low energy infralittoral rock* A3.3
High energy circalittoral rock** A4.1
Moderate energy circalittoral rock** A4.2
Low energy circalittoral rock** A4.3
Subtidal coarse sediment A5.1
Subtidal sand A5.2
Subtidal mud A5.3
Subtidal mixed sediments A5.4
Subtidal macrophyte-dominated sediment A5.5
Subtidal biogenic reefs A5.6
Deep-sea bed*** A6
* Infralittoral rock includes habitats of bedrock, boulders and cobble which occur in the shallow subtidal zone and typically support seaweed communities ** Circalittoral rock is characterised by animal dominated communities, rather than seaweed dominated communities *** The deep-sea bed broadscale habitat encompasses several different habitat sub-types, all of which should be protected within the MPA network. The broadscale habitat deep-sea bed habitat is found only in the south-west of the MCZ project area and MCZs identified for this broadscale habitat should seek to protect the variety of sub-types known to occur in the region.

Morte Platform rMCZ Post-survey Site Report 26
Annex 2. Habitat FOCI listed in the ENG.
Habitat Features of Conservation Importance (FOCI)
Blue Mussel Beds (including Intertidal Beds on Mixed and Sandy Sediments)**
Cold-Water Coral Reefs ***
Coral Gardens***
Deep-Sea Sponge Aggregations***
Estuarine Rocky Habitats
File Shell Beds***
Fragile Sponge and Anthozoan Communities on Subtidal Rocky Habitats
Intertidal Underboulder Communities
Littoral Chalk Communities
Maerl Beds
Horse Mussel (Modiolus modiolus) Beds
Mud Habitats in Deep Water*****
Sea-Pen and Burrowing Megafauna Communities
Native Oyster (Ostrea edulis) Beds
Peat and Clay Exposures
Honeycomb Worm (Sabellaria alveolata) Reefs
Ross Worm (Sabellaria spinulosa) Reefs
Seagrass Beds
Sheltered Muddy Gravels
Subtidal Chalk
Subtidal Sands and Gravels****
Tide-Swept Channels
* Habitat FOCI have been identified from the ‘OSPAR List of Threatened and/or Declining Species and Habitats’ and the ‘UK List of Priority Species and Habitats (UK BAP)’. ** Only includes ‘natural’ beds on a variety of sediment types. Excludes artificially created mussel beds and those which occur on rocks and boulders. *** Coldwater coral reefs, coral gardens, deep sea sponge aggregations and file shell beds currently do not have distributional data which demonstrate their presence within the MCZ project area. **** Subtidal Sands and Gravels are considered to be adequately protected by its component habitat features subtidal sand and/or subtidal coarse sediment, and is no longer included within MCZ designations. ***** ‘Mud Habitats in Deep Water’ is considered to be adequately protected by its component broadscale habitat feature ‘Subtidal mud’ and is no longer included within MCZ designation.

Morte Platform rMCZ Post-survey Site Report 27
Annex 3. Low or limited mobility species FOCI listed in the ENG.
Group Scientific name Common Name
Brown Algae Padina pavonica Peacock’s Tail
Red Algae Cruoria cruoriaeformis
Grateloupia montagnei
Lithothamnion corallioides
Phymatolithon calcareum
Burgundy Maerl Paint Weed
Grateloup’s Little-Lobed Weed
Coral Maerl
Common Maerl
Annelida Alkmaria romijni**
Armandia cirrhosa**
Tentacled Lagoon-Worm**
Lagoon Sandworm**
Teleostei Gobius cobitis
Gobius couchi
Hippocampus guttulatus
Hippocampus hippocampus
Giant Goby
Couch’s Goby
Long Snouted Seahorse
Short Snouted Seahorse
Bryozoa Victorella pavida Trembling Sea Mat
Cnidaria Amphianthus dohrnii
Eunicella verrucosa
Haliclystus auricula***
Leptopsammia pruvoti
Lucernariopsis campanulata
Lucernariopsis cruxmelitensis
Nematostella vectensis
Sea-Fan Anemone
Pink Sea-Fan
Stalked Jellyfish***
Sunset Cup Coral
Stalked Jellyfish
Stalked Jellyfish
Starlet Sea Anemone
Crustacea Gammarus insensibilis**
Gitanopsis bispinosa
Pollicipes pollicipes
Palinurus elephas
Lagoon Sand Shrimp**
Amphipod Shrimp
Gooseneck Barnacle
Spiny Lobster
Mollusca Arctica islandica
Atrina pectinata****
Caecum armoricum**
Ostrea edulis
Paludinella littorina*****
Tenellia adspersa**
Ocean Quahog
Fan Mussel****
Defolin’s Lagoon Snail**
Native Oyster
Sea Snail*****
Lagoon Sea Slug**
* Species FOCI have been identified from the ‘OSPAR List of Threatened and/or Declining Species and Habitats’, the ‘UK List of Priority Species and Habitats (UK BAP)’ and Schedule 5 of the Wildlife and Countryside Act. ** Those lagoonal species FOCI may be afforded sufficient protection through coastal lagoons designated as SACs under the EC Habitats Directive. However, this needs to be assessed by individual regional projects. *** The stalked jellyfish Haliclystus auricula is now referred to as Haliclystus species for the purpose of MCZ protection to account for potential presence of Haliclystus octoradiatus that has not been consistently differentiated within scientific records. The species are therefore considered jointly as an MCZ feature. **** Fan mussel should be correctly described as Atrina fragilis. ***** The sea snail (Paludinella littorina) has been removed from Schedule 5 of the Wildlife and Countryside Act. This means that it is no longer a Feature of Conservation Importance (FOCI) so has been removed as a feature for MCZ designation.

Morte Platform rMCZ Post-survey Site Report 28
Annex 4. Highly mobile species FOCI listed in the ENG.
Group Scientific name Common Name
Teleostei Osmerus eperlanus
Anguilla anguilla**
Smelt
European Eel**
Elasmobranchii Raja undulata Undulate Ray
* Species FOCI have been identified from the ‘OSPAR List of Threatened and/or Declining Species and Habitats’, the ‘UK List of Priority Species and Habitats (UK BAP)’ and Schedule 5 of the Wildlife and Countryside Act. ** MCZs are no longer considered to be an appropriate tool for the protection of European eels. They have been identified as habitat generalists for which it is particularly difficult to identify unique nursery or foraging grounds due to their wide distribution across coastal and freshwater zones. Conservation and management of European eels is considered to be more effectively achieved through the Eel Regulations and Eel Management Plans.
Morte Platform rMCZ Post-survey Site Report 29
Annex 5. Video and stills processing protocol.
The purpose of the analysis of the video and still images is to identify which habitats exist in a video record, provide semi-quantitative data on their physical and biological characteristics and to note where one habitat changes to another. A minimum of 10% of the videos should be re-analysed for QA purposes.
Video Analysis
The video record is initially viewed rapidly (at approximately 4x normal speed) in order to segment it into sections representing different habitats. The start and end points of each segment are logged, and each segment subsequently subject to more detailed analysis. Brief changes in habitat type lasting less than one minute of the video record are considered as incidental patches and are not logged.
For each segment, note the start and end time and position from the information on the video overlay. View the segment at normal or slower than normal speed, noting the physical and biological characteristics, such as substrate type, seabed character, species and life forms present. For each taxon record an actual abundance (where feasible) or a semi quantitative abundance (e.g. SACFOR scale).
Record the analyses on the video pro-forma provided (paper and/or electronic), which is a modified version of the Sublittoral Habitat Recording Form used in the Marine Nature Conservation Review (MNCR) surveys.
When each segment has been analysed, review the information recorded and assign the segment to one of the broadscale habitat (BSH) types or habitat FOCI listed in the Ecological Network Guidance (as reproduced in Annexes 1 and 2 above). Note also any species FOCI observed (as per Annex 3 above).
Stills analysis
Still images should be analysed separately, to supplement and validate the video analysis, and provide more detailed (i.e. higher resolution) information than can be extracted from a moving video image.
For each segment of video, select three still images that are representative of the BSH or FOCI to which the video segment has been assigned. For each image, note the time and position it was taken, using information from the associated video overlay.
View the image at normal or greater than normal magnification, noting the physical and biological characteristics, such as substrate type, seabed character, species and life forms present. For each taxon record an actual abundance (where feasible) or a semi quantitative abundance (e.g. SACFOR scale).
Record the analysis on the stills pro-forma provided (paper and/or electronic), which is a modified version of the Sublittoral Habitat Recording Form used in the MNCR surveys. Assign each still image to the same BSH or habitat FOCI as its ‘parent’ segment in the video.

Morte Platform rMCZ Post-survey Site Report 30
Taxon identification
In all analyses, the identification of taxa should be limited to a level that can be confidently achieved from the available image. Hence, taxon identity could range from the ‘life form’ level (e.g. sponge, hydroid, anemone) to the species level (e.g. Asterias rubens, Alcyonium digitatum). Avoid the temptation to guess the species identity if it cannot be determined positively from the image. For example, Spirobranchus sp. would be acceptable, but Spirobranchus triqueter would not, as the specific identification normally requires the specimen to be inspected under a microscope.

Morte Platform rMCZ Post-survey Site Report 31
Appendices
Appendix 1. Survey metadata
WGDN0412
Date Cruise Stn No. Stn Code Gear Latitude Longitude
27/03/2012 WGDN 04/12 3 Mort03 DG 51.20948 -4.32701
27/03/2012 WGDN 04/12 4 Mort04 DG 51.20948 -4.31519
27/03/2012 WGDN 04/12 6 Mort06 DG 51.21499 -4.33298
27/03/2012 WGDN 04/12 7 Mort07 DG 51.21505 -4.32237
27/03/2012 WGDN 04/12 8 Mort08 DG 51.21561 -4.31157
27/03/2012 WGDN 04/12 10 Mort10 DG 51.22074 -4.33876
28/03/2012 WGDN 04/12 11 Mort11 SOL DC 51.22094 -4.32806
28/03/2012 WGDN 04/12 11 Mort11 EOL DC 51.22011 -4.32734
28/03/2012 WGDN 04/12 12 Mort12 SOL DC 51.22152 -4.31694
28/03/2012 WGDN 04/12 12 Mort12 EOL DC 51.22022 -4.317
27/03/2012 WGDN 04/12 13 Mort13 DG 51.2215 -4.30663
28/03/2012 WGDN 04/12 16 Mort16 HG 51.22629 -4.33425
28/03/2012 WGDN 04/12 17 Mort17 SOL DC 51.22723 -4.3237
28/03/2012 WGDN 04/12 17 Mort17 EOL DC 51.22701 -4.32157
28/03/2012 WGDN 04/12 18 Mort18 SOL DC 51.22733 -4.31082
28/03/2012 WGDN 04/12 18 Mort18 EOL DC 51.22615 -4.31228
28/03/2012 WGDN 04/12 19 Mort19 HG 51.22727 -4.30089
28/03/2012 WGDN 04/12 22 Mort22 HG 51.23226 -4.33947
28/03/2012 WGDN 04/12 25 Mort25 HG 51.23268 -4.3065
28/03/2012 WGDN 04/12 26 Mort26 SOL DC 51.23359 -4.29428
28/03/2012 WGDN 04/12 26 Mort26 EOL DC 51.23262 -4.29643
29/03/2012 WGDN 04/12 30 Mort30 SOL DC 51.24022 -4.31242
29/03/2012 WGDN 04/12 30 Mort30 EOL DC 51.23817 -4.31281
29/03/2012 WGDN 04/12 32 Mort32 HG 51.23877 -4.29148
29/03/2012 WGDN 04/12 35 Mort35 DG 51.24465 -4.31817
Key: DG – Day Grab; HG - Mini Hamon Grab; DC – Drop Camera; EOL - End of Line; SOL – Start of
Line
CEND 2514
Date Cruise Stn No. Stn Code Gear Latitude Longitude
25/11/2014 CEND2514 17 GT52 HG 51.23893 -4.26522
25/11/2014 CEND2514 18 GT51 HG 51.24163 -4.26528
25/11/2014 CEND2514 19 GT54 HG 51.24483 -4.26019
25/11/2014 CEND2514 20 GT53 HG 51.25084 -4.26595
25/11/2014 CEND2514 25 GT39 SOL DC 51.25512 -4.29455
25/11/2014 CEND2514 25 GT39 EOL DC 51.25511 -4.29323
25/11/2014 CEND2514 26 GT42 SOL DC 51.24995 -4.28817
25/11/2014 CEND2514 26 GT42 EOL DC 51.25019 -4.28703
25/11/2014 CEND2514 27 GT45 SOL DC 51.24456 -4.28285
25/11/2014 CEND2514 27 GT45 EOL DC 51.24484 -4.28175
25/11/2014 CEND2514 29 GT48 HG 51.23925 -4.27734
25/11/2014 CEND2514 31 GT44 HG 51.23291 -4.28157
25/11/2014 CEND2514 33 GT38 HG 51.2435 -4.29221
25/11/2014 CEND2514 34 GT30 HG 51.24606 -4.29949

Morte Platform rMCZ Post-survey Site Report 32
Date Cruise Stn No. Stn Code Gear Latitude Longitude
25/11/2014 CEND2514 35 GT35 HG 51.25028 -4.29778
25/11/2014 CEND2514 37 GT21 SOL DC 51.24449 -4.31372
25/11/2014 CEND2514 37 GT21 EOL DC 51.24418 -4.31493
25/11/2014 CEND2514 40 GT37 HG 51.2342 -4.29422
25/11/2014 CEND2514 41 GT37 SOL DC 51.23413 -4.2944
25/11/2014 CEND2514 41 GT37 EOL DC 51.23361 -4.29563
25/11/2014 CEND2514 42 GT40 SOL DC 51.22954 -4.28795
25/11/2014 CEND2514 42 GT40 EOL DC 51.22906 -4.28898
25/11/2014 CEND2514 43 GT47 SOL DC 51.22711 -4.2813
25/11/2014 CEND2514 43 GT47 EOL DC 51.22649 -4.28249
25/11/2014 CEND2514 44 GT36 SOL DC 51.2212 -4.29179
25/11/2014 CEND2514 44 GT36 EOL DC 51.22025 -4.29234
25/11/2014 CEND2514 45 GT33 SOL DC 51.22624 -4.29932
25/11/2014 CEND2514 45 GT33 EOL DC 51.22625 -4.29759
25/11/2014 CEND2514 46 GT29 HG 51.23244 -4.3032
25/11/2014 CEND2514 47 GT20 HG 51.23236 -4.31408
25/11/2014 CEND2514 48 GT20 SOL DC 51.23245 -4.3137
25/11/2014 CEND2514 48 GT20 EOL DC 51.23272 -4.31229
25/11/2014 CEND2514 49 GT17 HG 51.23627 -4.32105
25/11/2014 CEND2514 50 GT13 HG 51.24395 -4.325
26/11/2014 CEND2514 52 GT12 HG 51.23387 -4.32712
26/11/2014 CEND2514 53 GT16 HG 51.22646 -4.31906
26/11/2014 CEND2514 54 GT24 HG 51.22664 -4.308
26/11/2014 CEND2514 58 GT23 SOL DC 51.21515 -4.30754
26/11/2014 CEND2514 58 GT23 EOL DC 51.21531 -4.30628
26/11/2014 CEND2514 59 GT32 SOL DC 51.21578 -4.29645
26/11/2014 CEND2514 59 GT32 EOL DC 51.21505 -4.297
26/11/2014 CEND2514 60 GT28 SOL DC 51.22047 -4.30216
26/11/2014 CEND2514 60 GT28 EOL DC 51.2201 -4.30329
26/11/2014 CEND2514 61 GT24 SOL DC 51.22693 -4.30802
26/11/2014 CEND2514 61 GT24 EOL DC 51.22664 -4.30896
26/11/2014 CEND2514 64 GT11 HG 51.22082 -4.32388
26/11/2014 CEND2514 65 GT08 HG 51.22661 -4.32952
26/11/2014 CEND2514 66 GT06 HG 51.23 -4.33
26/11/2014 CEND2514 67 GT03 HG 51.23214 -4.34582
26/11/2014 CEND2514 68 GT03 SOL DC 51.23218 -4.34537
26/11/2014 CEND2514 68 GT03 EOL DC 51.23164 -4.34677
26/11/2014 CEND2514 69 GT04 SOL DC 51.22805 -4.34154
26/11/2014 CEND2514 69 GT04 EOL DC 51.22746 -4.34251
26/11/2014 CEND2514 70 GT09 SOL DC 51.23848 -4.32985
26/11/2014 CEND2514 70 GT09 EOL DC 51.23771 -4.33053
26/11/2014 CEND2514 71 GT08 SOL DC 51.22621 -4.32996
26/11/2014 CEND2514 71 GT08 EOL DC 51.22651 -4.32873
26/11/2020 CEND2514 74 GT04 HG 51.22803 -4.34185
26/11/2020 CEND2514 75 GT01 HG 51.22619 -4.35118
26/11/2020 CEND2514 76 GT02 HG 51.22054 -4.34533
26/11/2014 CEND2514 77 GT05 SOL DC 51.22046 -4.3351
26/11/2014 CEND2514 77 GT05 EOL DC 51.22128 -4.33427
26/11/2014 CEND2514 78 GT15 SOL DC 51.21483 -4.31819
26/11/2014 CEND2514 78 GT15 EOL DC 51.21547 -4.31923
26/11/2014 CEND2514 79 GT10 SOL DC 51.209 -4.32308
26/11/2014 CEND2514 79 GT10 EOL DC 51.20953 -4.32435
26/11/2014 CEND2514 80 GT14 SOL DC 51.20368 -4.31785

Morte Platform rMCZ Post-survey Site Report 33
Date Cruise Stn No. Stn Code Gear Latitude Longitude
26/11/2014 CEND2514 80 GT14 EOL DC 51.20296 -4.3186
26/11/2014 CEND2514 81 GT18 SOL DC 51.2074 -4.31093
26/11/2014 CEND2514 81 GT18 EOL DC 51.20705 -4.31185
26/11/2014 CEND2514 83 GT07 HG 51.21491 -4.32902
26/11/2014 CEND2514 84 GT22 SOL DC 51.2052 -4.30599
26/11/2014 CEND2514 84 GT22 EOL DC 51.20475 -4.30682
26/11/2014 CEND2514 85 GT10 HG 51.20935 -4.32372
26/11/2014 CEND2514 86 GT27 SOL DC 51.20952 -4.30167
26/11/2014 CEND2514 86 GT27 EOL DC 51.2092 -4.30253
26/11/2014 CEND2514 87 GT19 SOL DC 51.22091 -4.31278
26/11/2014 CEND2514 87 GT19 EOL DC 51.22038 -4.31372
26/11/2014 CEND2514 88 GT44 SOL DC 51.23336 -4.28116
26/11/2014 CEND2514 88 GT44 EOL DC 51.23267 -4.2823
26/11/2014 CEND2514 89 GT50 SOL DC 51.2337 -4.27216
26/11/2014 CEND2514 89 GT50 EOL DC 51.23417 -4.27088
26/11/2014 CEND2514 90 GT41 SOL DC 51.23846 -4.28762
26/11/2014 CEND2514 90 GT41 EOL DC 51.2388 -4.28675
26/11/2014 CEND2514 91 GT47 HG 51.22724 -4.28191
26/11/2014 CEND2514 92 GT36 HG 51.22082 -4.29155
27/11/2014 CEND2514 94 GT21 HG 51.24436 -4.31398
27/11/2014 CEND2514 95 GT42 HG 51.25034 -4.28725
27/11/2014 CEND2514 97 GT54 SOL DC 51.24486 -4.26071
27/11/2014 CEND2514 97 GT54 EOL DC 51.24487 -4.25922
27/11/2014 CEND2514 98 GT49 SOL DC 51.25134 -4.27484
27/11/2014 CEND2514 98 GT49 EOL DC 51.25108 -4.27611
27/11/2014 CEND2514 99 GT46 SOL DC 51.2564 -4.28159
27/11/2014 CEND2514 99 GT46 EOL DC 51.25602 -4.28256
27/11/2014 CEND2514 103 GT56 HG 51.23896 -4.26503
27/11/2014 CEND2514 104 GT43 SOL DC 51.2612 -4.29162
27/11/2014 CEND2514 104 GT43 EOL DC 51.2608 -4.2925
27/11/2014 CEND2514 105 GT31 SOL DC 51.25605 -4.30303
27/11/2014 CEND2514 105 GT31 EOL DC 51.2558 -4.30415
27/11/2014 CEND2514 106 GT26 SOL DC 51.25054 -4.30875
27/11/2014 CEND2514 106 GT26 EOL DC 51.24988 -4.30928
27/11/2014 CEND2514 107 GT25 SOL DC 51.23825 -4.30865
27/11/2014 CEND2514 107 GT25 EOL DC 51.23856 -4.30803
27/11/2014 CEND2514 108 GT34 SOL DC 51.23855 -4.29813
27/11/2014 CEND2514 108 GT34 EOL DC 51.23877 -4.2972
Key: HG - Mini Hamon Grab; DC – Drop Camera; EOL - End of Line; SOL – Start of Line

Morte Platform rMCZ Post-survey Site Report 34
Appendix 2. Outputs from acoustic surveys

Morte Platform rMCZ Post-survey Site Report 35

Morte Platform rMCZ Post-survey Site Report 36
Appendix 3. Evidence of human activities within the rMCZ

Morte Platform rMCZ Post-survey Site Report 37
Appendix 4. Species list
Species list for grab samples (Species FOCI indicated by grey shading, if present). Percentage occurrence was calculated as the ‘Number of samples where the species occurs/total number of samples’ x 100.
Taxa % Occurrence
SPONGES
PORIFERA 19
Cliona celata 12
PORIFERA (Type A) 12
Suberitidae 9
Stelligera rigida 5
Hymeraphia 2
Sycon ciliata 2
HYDROIDS, CORALS, JELLYFISH, ANEMONES
ACTINIARIA 42
Hydrallmania falcata 35
Sertularia 28
Campanulariidae 5
Halecium 5
Dynamena pumila 2
Edwardsiidae 2
FLATWORMS
TURBELLARIA 19
PLATYHELMINTHES 14
RIBBON WORMS
NEMERTEA 81
Cerebratulus 16
Tubulanus polymorphus 12
Oerstedia dorsalis 2
NEMATODES
NEMATODA 63
PEANUT WORMS
SIPUNCULA 33
Nephasoma minutum 16
Golfingia elongata 7
Phascolion strombus 5
Aspidosiphon muelleri 2
Golfingia vulgaris 2
SEGMENTED WORMS
Mediomastus fragilis 81
Laonice bahusiensis 79
Clymenura 70
Glycera lapidum 70
Spirobranchus lamarcki 70
Sabellaria spinulosa 67

Morte Platform rMCZ Post-survey Site Report 38
Taxa % Occurrence
Lumbrineris cingulata 63
Caulleriella alata 56
Glycera 51
Sphaerosyllis bulbosa 51
Ampharete lindstroemi 49
Scalibregma celticum 49
Aonides paucibranchiata 47
Polynoidae 44
Hydroides norvegicus 40
Marphysa bellii 40
Notomastus latericeus 40
Lysidice unicornis 37
Dipolydora coeca 35
Pholoe baltica (sensu Petersen) 35
Pholoe inornata (sensu Petersen) 35
Syllis garciai 35
Polycirrus 33
Syllidia armata 30
Eulalia mustela 28
Laonice 28
Terebellides stroemi 28
Eunereis longissima 26
Lumbrineris gracilis 26
Notomastus 26
Praxillella affinis 26
Spirobranchus 26
Jasmineira elegans 23
Malmgrenia arenicolae 23
Schistomeringos rudolphi 23
Syllidae (Type A) 23
Syllis armillaris 23
Ampharetidae 21
Asclerocheilus intermedius 21
Nephtys kersivalensis 21
Paradoneis lyra 21
Spiophanes kroyeri 21
Syllis (Type E) 21
Aonides oxycephala 19
Dipolydora caulleryi 19
Eteone longa (agg) 19
Nephtys 19
Paraehlersia ferrugina 19
Prosphaerosyllis chauseyensis 19
Protodorvillea kefersteini 19
Syllis variegata 19
Chaetozone zetlandica 16

Morte Platform rMCZ Post-survey Site Report 39
Taxa % Occurrence
Eumida 16
Goniadella gracilis 16
Lepidonotus squamatus 16
Spirobranchus triqueter 16
Aphelochaeta 14
Glycinde nordmanni 14
Lumbrineridae 14
Odontosyllis fulgurans 14
Phyllodocidae 14
Polycirrus norvegicus 14
Serpulidae 14
Sphaerosyllis taylori 14
Chone dunerificta 12
Dipolydora socialis 12
Eteone longa 12
Eumida sanguinea 12
Eusyllis blomstrandi 12
Goniadella bobretzkii 12
Nereididae 12
Prionospio 12
Serpula vermicularis 12
Syllis 12
Aphelochaeta (Type A) 9
Eulalia ornata 9
Eulalia tripunctata 9
Exogone hebes 9
Exogone naidina 9
Grania 9
Lanice conchilega 9
Maldanidae (Type A) 9
Phisidia aurea 9
Polygordius 9
Sabellidae 9
Scalibregma inflatum 9
Sphaerodorum gracilis 9
Spionidae 9
Sthenelais boa 9
Syllides 9
Ampharete octocirrata 7
Anaitides longipes 7
Aphelochaeta marioni 7
Clymenura johnstoni 7
Goniadidae 7
Malmgrenia darbouxi 7
Marphysa 7
Paraonidae 7

Morte Platform rMCZ Post-survey Site Report 40
Taxa % Occurrence
Parasabella 7
Pseudomystides limbata 7
Pterocirrus 7
Rullierinereis ancornunezi 7
Scolelepis tridentata 7
Scoloplos armiger 7
Sphaerosyllis hystrix 7
Amphicteis midas 5
Branchiomma 5
Chone duneri 5
Euclymene lombricoides 5
Eulalia aurea 5
Eulalia bilineata 5
Exogone verugera 5
Glycera fallax 5
Glycera unicornis 5
Loimia medusa 5
Lumbrineriopsis paradoxa 5
Maldanidae 5
Malmgrenia ljungmani 5
Mysta picta 5
Nephtys caeca 5
Orbinia sertulata 5
Owenia 5
Petaloproctus 5
Pisione remota 5
Psamathe fusca 5
Pseudonotomastus southerni 5
Pseudopotamilla 5
Pseudopotamilla reniformis 5
Pygospio elegans 5
Sabellides octocirrata 5
Schistomeringos neglecta 5
Scolelepis korsuni 5
Scoletoma magnidentata 5
Syllis (Type D) 5
Syllis licheri 5
Terebellidae 5
Thelepus cincinnatus 5
Thelepus setosus 5
Anaitides groenlandica 2
Arenicola 2
Capitellidae 2
Cirratulus 2
Dioplosyllis cirrosa (?) 2
Drilonereis filum 2
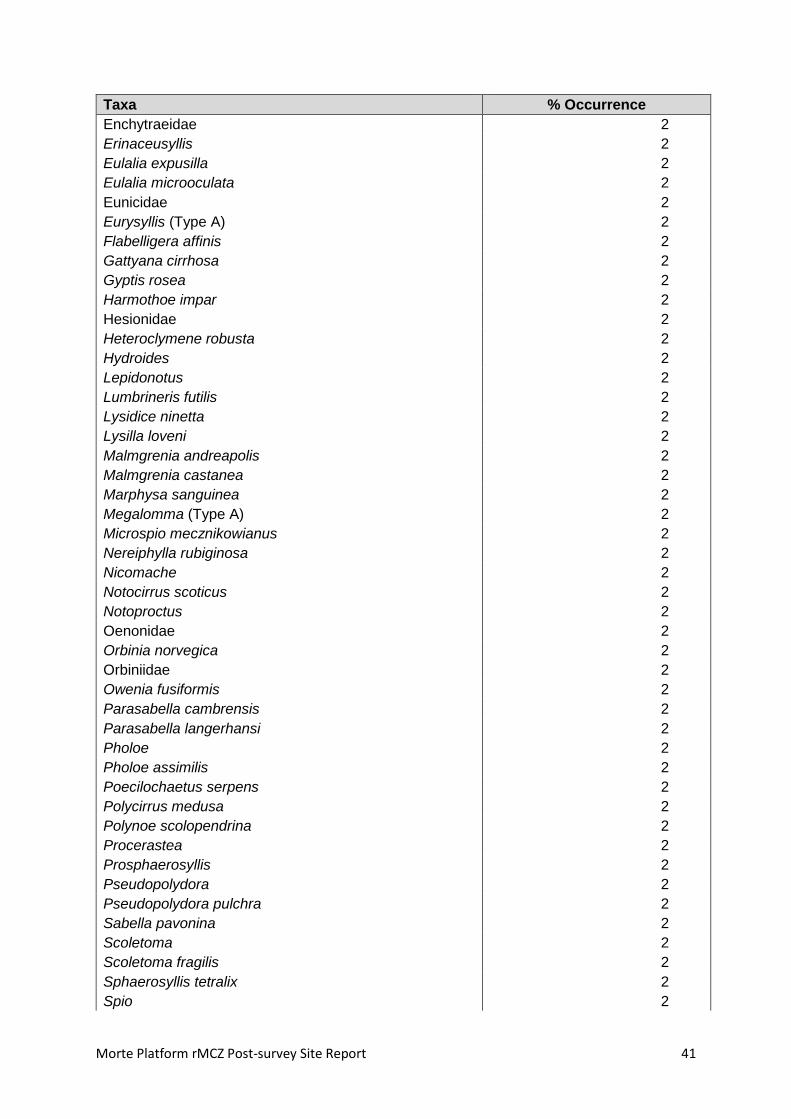
Morte Platform rMCZ Post-survey Site Report 41
Taxa % Occurrence
Enchytraeidae 2
Erinaceusyllis 2
Eulalia expusilla 2
Eulalia microoculata 2
Eunicidae 2
Eurysyllis (Type A) 2
Flabelligera affinis 2
Gattyana cirrhosa 2
Gyptis rosea 2
Harmothoe impar 2
Hesionidae 2
Heteroclymene robusta 2
Hydroides 2
Lepidonotus 2
Lumbrineris futilis 2
Lysidice ninetta 2
Lysilla loveni 2
Malmgrenia andreapolis 2
Malmgrenia castanea 2
Marphysa sanguinea 2
Megalomma (Type A) 2
Microspio mecznikowianus 2
Nereiphylla rubiginosa 2
Nicomache 2
Notocirrus scoticus 2
Notoproctus 2
Oenonidae 2
Orbinia norvegica 2
Orbiniidae 2
Owenia fusiformis 2
Parasabella cambrensis 2
Parasabella langerhansi 2
Pholoe 2
Pholoe assimilis 2
Poecilochaetus serpens 2
Polycirrus medusa 2
Polynoe scolopendrina 2
Procerastea 2
Prosphaerosyllis 2
Pseudopolydora 2
Pseudopolydora pulchra 2
Sabella pavonina 2
Scoletoma 2
Scoletoma fragilis 2
Sphaerosyllis tetralix 2
Spio 2

Morte Platform rMCZ Post-survey Site Report 42
Taxa % Occurrence
Spio armata 2
Spiochaetopterus typicus 2
Spiophanes 2
Spiophanes bombyx 2
Spirorbidae 2
Syllidae 2
Syllis columbretensis 2
Syllis cornuta 2
Tharyx killariensis 2
Trypanosyllis coeliaca 2
Tubificoides pseudogaster 2
Vermiliopsis striaticeps 2
SEA SPIDERS
Anoplodactylus petiolatus 26
Achelia echinata 12
Callipallene brevirostris 2
Callipallenidae 2
CRUSTACEANS
Verruca stroemia 49
Pisidia longicornis 28
Ampelisca spinipes 26
Monodaeus couchii 26
Gammaropsis maculata 23
Cheirocratus 19
Unciola crenatipalma 19
Ampeliscidae 16
Othomaera othonis 16
Socarnes erythrophthalmus 16
THORACICA 16
Pilumnus hirtellus 14
Isaeidae 12
Maerella tenuimana 12
Melitidae 12
Monocorophium sextonae 12
Paguridae 12
Urothoe elegans 12
Anthura gracilis 9
Atelecyclus rotundatus 9
Ericthonius punctatus 9
Leptocheirus pectinatus 9
Balanus crenatus 7
Ebalia 7
Ericthonius 7
Abludomelita obtusata 5
Acidostoma obesum (sensu Stoddart & Lowry) 5
Ampelisca diadema 5

Morte Platform rMCZ Post-survey Site Report 43
Taxa % Occurrence
Animoceradocus semiserratus 5
Corophiidae 5
Cumella pygmaea 5
Dyopedos monacantha 5
Ebalia tuberosa 5
Harpinia pectinata 5
Liljeborgia kinahani 5
Liocarcinus 5
OSTRACODA 5
Acidostoma neglectum 2
Ampelisca 2
Anapagurus hyndmanni 2
Bopyridae 2
Cheirocratus sundevallii 2
COPEPODA 2
Cressa dubia 2
DECAPODA 2
Ebalia tumefacta 2
Eriopisa elongata 2
Galathea 2
Gammaropsis longicornis 2
Gnathia oxyuraea 2
Guernea coalita 2
Heteromysis microps 2
Iphimedia perplexa 2
Janira maculosa 2
Listriella mollis 2
Lysianassidae 2
Macropodia 2
Munna 2
Nicippe tumida 2
Nototropis vedlomensis 2
Pandalina brevirostris 2
Parametaphoxus fultoni 2
Photis longicaudata 2
Pinnotheres pisum 2
Pseudoparatanais batei 2
Stenothoe marina 2
TANAIDACEA 2
Tanaopsis graciloides 2
Tritaeta gibbosa 2
Xanthidae 2
MOLLUSCS
Leptochiton asellus 47
Mytilidae 47
Gibbula tumida 44

Morte Platform rMCZ Post-survey Site Report 44
Taxa % Occurrence
Clausinella fasciata 30
Myidae 26
Sphenia binghami 26
Timoclea ovata 26
GASTROPODA 23
Spisula elliptica 23
Anomiidae 21
BIVALVIA 19
Diplodonta rotundata 19
Mactridae 19
Thecacera pennigera 19
Veneridae 19
Abra alba 16
Mytilus edulis 14
Cardiidae 12
POLYPLACOPHORA 12
Thracia 12
Abra 9
Caecum glabrum 9
Kurtiella bidentata 9
Moerella donacina 9
Dosinia lupinus 7
Gari tellinella 7
Hiatella arctica 7
Nucula nucleus 7
Onchidoris 7
Polititapes rhomboides 7
Thracia villosiuscula 7
Corbula gibba 5
Dosinia 5
Euspira nitida 5
Modiolus barbatus 5
Onchidorididae 5
Onoba semicostata 5
Pectinidae 5
ANOMALODESMATA 2
Dosinia exoleta 2
Epitonium clathrus 2
Epitonium turtonis 2
Gari 2
Hyala vitrea 2
Jujubinus montagui 2
Lyonsia norwegica 2
Mimachlamys varia 2
Montacuta substriata 2
Mysia undata 2

Morte Platform rMCZ Post-survey Site Report 45
Taxa % Occurrence
Nassariidae 2
Neomenia carinata 2
Palliolum tigerinum 2
Parvicardium scabrum 2
Pododesmus patelliformis 2
Tellimya ferruginosa 2
BRACHIOPODS
BRACHIOPODA 2
BRYOZOANS
Escharella immersa 77
Schizomavella 70
Disporella hispida 63
Conopeum reticulum 30
Tubulipora 30
Alcyonidium 28
Flustra foliacea 28
Electra pilosa 23
Cellepora pumicosa 21
Chorizopora brongniartii 16
Pentapora fascialis 14
Bugula 12
Schizomavella auriculata 12
Bicellariella ciliata 9
Crisia 9
Escharella variolosa 7
Plagioecia sarniensis 7
Porella concinna 7
Stomatoporina incurvata 7
Amphiblestrum auritum 5
Callopora discreta 5
Crassimarginatella solidula 5
Escharella ventricosa 5
Hincksina flustroides 5
Microporella ciliata 5
Tubulipora liliacea 5
Vesicularia spinosa 5
Alcyonidioides mytili 2
Alcyonidium diaphanum 2
Amphiblestrum flemingii 2
Cauloramphus spiniferum 2
Crisia aculeata 2
CYCLOSTOMATIDA 2
Electra monostachys 2
Eurystrotos compacta 2
Omalosecosa ramulosa 2
Phylactella labrosa 2

Morte Platform rMCZ Post-survey Site Report 46
Taxa % Occurrence
Puellina bifida 2
Puellina innominata 2
Pyripora catenularia 2
HORSESHOE WORMS
Phoronis 58
SEA STARS, URCHINS, SEA CUCUMBERS
OPHIUROIDEA 60
Amphipholis squamata 58
Echinocyamus pusillus 33
ECHINOIDEA 5
Ophiactis balli 5
Ophiothrix fragilis 5
Ophiura albida 5
Echinus 2
HOLOTHURIOIDEA 2
Leptosynapta cruenta 2
Ophiothrix 2
Ophiura 2
Ophiura ophiura 2
Psammechinus miliaris 2
ACORN WORMS
HEMICHORDATA 5
SEA SQUIRTS
Dendrodoa grossularia 58
ASCIDIACEA 21
Didemnidae 5
Didemnum maculosum 2
Molgula oculata 2
Pyura tessellata 2

Morte Platform rMCZ Post-survey Site Report 47
Species list for video samples (Species FOCI indicated by grey shading, if present). Percentage occurrence was calculated as the ‘Number of samples where the species occurs/total number of samples’ x 100.
Taxa % Occurrence
SPONGES
Porifera (encrusting)
Porifera (branching type1)
Porifera (globose)
Raspailia ramosa
Cliona celata
Porifera (branching type2)
Haliclona simulans
Hemimycale columella
59
20
9
7
5
5
2
2
HYDROIDS, CORALS, JELLYFISH, ANEMONES
Hydrozoa (turf)
Urticina sp.
Actiniaria
Alcyonium digitatum
Hydrozoa
Sagartiidae
Tubularia indivisa
Capnea sanguinea
Hydrallmania falcata
Sagartia sp.
Sagartia troglodytes
Abietinaria abietina
Sertularia
Metridium senile
Nemertesia sp.
Nemertesia antennina
Actinothoe sphyrodeta
Cerianthus lloydii
Plumularoidea
Sagartia elegans
Sertularia sp.
Zoantharia
80
70
66
61
52
50
30
20
18
16
11
9
9
7
7
7
5
5
5
5
5
2
SEGMENTED WORMS
Serpulidae
Spirobranchus sp.
Sabellaria spinulosa
Sabella pavonina
Polychaeta
Bispira volutacornis
Salmacina dysteri
Myxicola infundibulum
91
82
73
41
30
5
5
2

Morte Platform rMCZ Post-survey Site Report 48
Taxa % Occurrence
CRUSTACEANS
Paguridae
Ebalia sp.
Brachyura
Thoracica
Inachidae
Pandalidae
Munida rugosa
Maja squinado
Cancer pagurus
Galatheoidea
Liocarcinus sp.
Necora puber
Caridea
Decapoda
Homarus gammarus
Hyas sp.
Macropodia sp.
Portunidae
Semibalanus balanoides
70
41
34
34
32
30
14
7
5
5
5
5
2
2
2
2
2
2
2
MOLLUSCS
Calliostoma zizyphinum
Polyplacophora
Gastropoda
Trochidae
Pectinidae
Bivalvia
Buccinum undatum
Aequipecten opercularis
34
25
18
16
11
9
7
5
BRACHIOPODS
BRACHIOPODA 7
BRYOZOANS
Bryozoa (encrusting)
Flustra foliacea
Pentapora fascialis
Bryozoa (turf)
Alcyonidium diaphanum
Bryozoa (erect)
Cellepora pumicosa
80
57
50
45
11
2
2
SEA STARS, URCHINS, SEA CUCUMBERS
Asterias rubens
Marthasterias glacialis
Asteroidea
Echinus esculentus
Ophiura albida
Ophiura
Crossaster papposus
Ophiothrix fragilis
Ophiuroidea
Henricia
66
18
11
9
9
5
2
2
2
2

Morte Platform rMCZ Post-survey Site Report 49
Taxa % Occurrence
SEA SQUIRTS
ASCIDIACEA (non colonial)
ASCIDIACEA (colonial)
Dendrodoa grossularia
36
2
2
FISH
Scyliorhinus canicula
TELEOSTEI
Pleuronectiformes
Gadidae
Anguilla anguilla
Callionymus lyra
Trisopterus luscus
7
9
7
5
2
2
2
ALGAE
Phaeophyceae 5

Morte Platform rMCZ Post-survey Site Report 50
Appendix 5. Analyses of sediment samples: classification and composition
Stn No. Stn Code Latitude Longitude Sediment Description EUNIS Level 3/BSH Gravel (%) Sand (%) Silt/clay (%)
3 Mort 03 51.209475 -4.327012 mixed sediments A5.4 Subtidal Mixed Sediments 66.91 24.75 8.34
4 Mort 04 51.209478 -4.315190 coarse sediment A5.1 Subtidal Coarse Sediment 68.96 29.10 1.95
6 Mort 06 51.215610 -4.311572 mixed sediments A5.4 Subtidal Mixed Sediments 47.84 44.91 7.25
7 Mort 07 51.215050 -4.322365 coarse sediment A5.1 Subtidal Coarse Sediment 83.39 14.53 2.08
8 Mort 08 51.214990 -4.332977 coarse sediment A5.1 Subtidal Coarse Sediment 66.71 31.04 2.25
10 Mort 10 51.220742 -4.338758 mixed sediments A5.4 Subtidal Mixed Sediments 65.97 29.73 4.29
13 Mort 13 51.221498 -4.306632 coarse sediment A5.1 Subtidal Coarse Sediment 85.59 13.69 0.72
16 Mort 16 51.227272 -4.300890 coarse sediment A5.1 Subtidal Coarse Sediments 70.67 27.54 1.79
19 Mort 19 51.226287 -4.334253 mixed sediments A5.4 Subtidal Mixed Sediments 37.56 52.01 10.44
22 Mort 22 51.232258 -4.339468 mixed sediments A5.4 Subtidal Mixed Sediments 45.01 47.51 7.48
25 Mort 25 51.232683 -4.306500 coarse sediment A5.1 Subtidal Coarse Sediment 89.17 10.83 0.00
32 Mort 32 51.238767 -4.291478 coarse sediment A5.1 Subtidal Coarse Sediment 72.96 25.92 1.13
35 Mort 35 51.244653 -4.318173 mixed sediments A5.4 Subtidal Mixed Sediments 39.88 51.19 8.93
75 GT01 51.226190 -4.351179 mixed sediments A5.4 Subtidal Mixed Sediments 38.21 52.73 9.06
76 GT02 51.220540 -4.345325 coarse sediment A5.1 Subtidal Coarse Sediment 59.55 38.71 1.74
67 GT03 51.232140 -4.345815 mixed sediments A5.4 Subtidal Mixed Sediments 29.63 62.97 7.41
74 GT04 51.228030 -4.341845 mixed sediments A5.4 Subtidal Mixed Sediments 28.03 55.82 16.15
66 GT06 51.230000 -4.330000 mixed sediments A5.4 Subtidal Mixed Sediments 52.16 40.57 7.27
83 GT07 51.214910 -4.329020 mixed sediments A5.4 Subtidal Mixed Sediments 64.31 27.81 7.89
65 GT08 51.226610 -4.329518 mixed sediments A5.4 Subtidal Mixed Sediments 50.16 41.94 7.90
85 GT10 51.209350 -4.323721 coarse sediment A5.1 Subtidal Coarse Sediment 75.48 22.84 1.68
64 GT11 51.220820 -4.323877 coarse sediment A5.1 Subtidal Coarse Sediment 63.42 35.64 0.94
52 GT12 51.233870 -4.327118 mixed sediments A5.4 Subtidal Mixed Sediments 41.13 50.61 8.26
50 GT13 51.243950 -4.325002 mixed sediments A5.4 Subtidal Mixed Sediments 46.29 47.10 6.61
53 GT16 51.226460 -4.319063 coarse sediment A5.1 Subtidal Coarse Sediment 71.65 27.54 0.81
49 GT17 51.236270 -4.321047 mixed sediments A5.4 Subtidal Mixed Sediments 72.26 23.94 3.80
47 GT20 51.232360 -4.314075 coarse sediment A5.1 Subtidal Coarse Sediment 51.15 45.70 3.15
94 GT21 51.244360 -4.313978 coarse sediment A5.1 Subtidal Coarse Sediment 55.45 40.60 3.94
54 GT24 51.226640 -4.308004 coarse sediment A5.1 Subtidal Coarse Sediment 53.56 45.09 1.35
46 GT29 51.232440 -4.303195 coarse sediment A5.1 Subtidal Coarse Sediment 61.60 37.33 1.07
34 GT30 51.246060 -4.299492 mixed sediments A5.4 Subtidal Mixed Sediments 56.34 36.54 7.12

Morte Platform rMCZ Post-survey Site Report 51
Stn No. Stn Code Latitude Longitude Sediment Description EUNIS Level 3/BSH Gravel (%) Sand (%) Silt/clay (%)
35 GT35 51.250280 -4.297780 mixed sediments A5.4 Subtidal Mixed Sediments 50.26 42.29 7.45
92 GT36 51.220820 -4.291552 mixed sediments A5.4 Subtidal Mixed Sediments 60.60 33.67 5.73
40 GT37 51.234200 -4.294222 mixed sediments A5.4 Subtidal Mixed Sediments 45.02 46.60 8.38
33 GT38 51.243500 -4.292210 mixed sediments A5.4 Subtidal Mixed Sediments 55.85 31.91 12.24
95 GT42 51.250340 -4.287250 coarse sediment A5.1 Subtidal Coarse Sediment 62.66 34.07 3.27
31 GT44 51.232910 -4.281575 mixed sediments A5.4 Subtidal Mixed Sediments 76.83 20.82 2.35
91 GT47 51.227240 -4.281905 coarse sediment A5.1 Subtidal Coarse Sediment 87.52 8.70 3.77
29 GT48 51.239250 -4.277344 mixed sediments A5.4 Subtidal Mixed Sediments 72.42 19.01 8.58
18 GT51 51.241630 -4.265275 coarse sediment A5.1 Subtidal Coarse Sediment 87.73 11.45 0.83
17 GT52 51.238930 -4.265224 coarse sediment A5.1 Subtidal Coarse Sediment 71.49 28.51 0.00
20 GT53 51.250840 -4.265945 coarse sediment A5.1 Subtidal Coarse Sediment 86.83 12.30 0.87
19 GT54 51.244830 -4.260191 coarse sediment A5.1 Subtidal Coarse Sediment 63.74 33.35 2.91
103 GT56 51.238960 -4.265030 coarse sediment A5.1 Subtidal Coarse Sediment 68.30 31.03 0.68

Morte Platform rMCZ Post-survey Site Report 52
Appendix 6. BSH/EUNIS Level 3 descriptions derived from video and stills
Station No.
Station Code Latitude Longitude Habitat No. EUNIS Level 3/BSH MNCR Code
11 Mort11 51.22076 -4.3281 1 A5.1 Subtidal Coarse Sediment SS.SCS
11 Mort11 51.22068 -4.32802 2 A5.4 Subtidal Mixed Sediments SS.SMx
11 Mort11 51.22036 -4.3276 3 A5.1 Subtidal Coarse Sediment SS.SCS
11 Mort11 51.22028 -4.32748 4 A5.4 Subtidal Mixed Sediments SS.SMx
11 Mort11 51.22018 -4.3274 5 A5.1 Subtidal Coarse Sediment SS.SCS
11 Mort11 51.22011 -4.32734 6 A5.4 Subtidal Mixed Sediments SS.SMx
12 Mort12 51.22109 -4.31701 1 A5.4 Subtidal Mixed Sediments SS.SMx
12 Mort12 51.22097 -4.31702 2 A5.1 Subtidal Coarse Sediment SS.SCS
12 Mort12 51.22085 -4.31703 3 A5.4 Subtidal Mixed Sediments SS.SMx
17 Mort17 51.22724 -4.32304 1 A5.4 Subtidal Mixed Sediments SS.SMx
17 Mort17 51.22722 -4.32288 2 A5.1 Subtidal Coarse Sediment SS.SCS
17 Mort17 51.22712 -4.32215 3 A5.4 Subtidal Mixed Sediments SS.SMx
17 Mort17 51.22701 -4.32157 4 A5.1 Subtidal Coarse Sediment SS.SCS
18 Mort18 51.2269 -4.31185 1 A5.4 Subtidal Mixed Sediments SS.SMx
18 Mort18 51.22682 -4.31192 2 A5.1 Subtidal Coarse Sediment SS.SCS
18 Mort18 51.22674 -4.31197 3 A5.4 Subtidal Mixed Sediments SS.SMx
18 Mort18 51.22666 -4.31202 4 A5.1 Subtidal Coarse Sediment SS.SCS
26 Mort26 51.23326 -4.29509 1 A4.2 Moderate Energy Circalittoral Rock SM.SSSaG
26 Mort26 51.23318 -4.29525 2 A5.1 Subtidal Coarse Sediment SS.SCS
30 Mort30 51.23872 -4.31286 1 A5.1 Subtidal Coarse Sediment SS.SCS.CCS
68 GT03 51.23218 -4.34537 1 A5.4 Subtidal Mixed Sediments SS.SMx.CMx
69 GT04 51.22805 -4.34154 1 A5.6 Subtidal Biogenic Reef* SS.SBR.PoR.SspiMx
77 GT05 51.22046 -4.33510 1 A5.1 Subtidal Coarse Sediment SS.SCS.CCS
71 GT08 51.22621 -4.32996 1 A5.1 Subtidal Coarse Sediment SS.SCS.CCS
70 GT09 51.23848 -4.32985 1 A5.4 Subtidal Mixed Sediments SS.SMx.CMx
79 GT10 51.20906 -4.32321 1 A5.1 Subtidal Coarse Sediment SS.SCS.CCS
79 GT10 51.20913 -4.31336 2 A5.4 Subtidal Mixed Sediments SS.SMx.CMx
79 GT10 51.20916 -4.37344 3 A5.1 Subtidal Coarse Sediment SS.SCS.CCS
80 GT14 51.20368 -4.31785 1 A5.1 Subtidal Coarse Sediment SS.SCS.CCS
78 GT15 51.21483 -4.31819 1 A5.1 Subtidal Coarse Sediment SS.SCS.CCS
78 GT15 51.21502 -4.31851 2 A5.6 Subtidal Biogenic Reef* SS.SBR.PoR.SspiMx

Morte Platform rMCZ Post-survey Site Report 53
Station No.
Station Code Latitude Longitude Habitat No. EUNIS Level 3/BSH MNCR Code
78 GT15 51.21512 -4.31864 3 A5.1 Subtidal Coarse Sediment SS.SCS.CCS
78 GT15 51.21530 -4.31894 4 A5.6 Subtidal Biogenic Reef* SS.SBR.PoR.SspiMx
81 GT18 51.20740 -4.31093 1 A5.1 Subtidal Coarse Sediment SS.SCS.CCS
87 GT19 51.22091 -4.31278 1 A4.2 Moderate Energy Circalittoral Rock CR.MCR.CSab.Sspi
87 GT19 51.22085 -4.31290 2 A5.1 Subtidal Coarse Sediment SS.SCS.CCS
48 GT20 51.23245 -4.31370 1 A5.1 Subtidal Coarse Sediment SS.SCS.CCS
48 GT20 51.23265 -4.31253 2 A5.1 Subtidal Coarse Sediment SS.SCS.CCS
37 GT21 51.24449 -4.31372 1 A5.1 Subtidal Coarse Sediment SS.SCS.CCS
84 GT22 51.20520 -4.30599 1 A5.1 Subtidal Coarse Sediment SS.SCS.CCS
84 GT22 51.20497 -4.30640 2 A4.1 High Energy Circalittoral Rock CR.HCR.XFa
84 GT22 51.20490 -4.30653 3 A5.1 Subtidal Coarse Sediment SS.SCS.CCS
84 GT22 51.20490 -4.30654 4 A4.1 High Energy Circalittoral Rock CR.HCR.XFa
58 GT23 51.21515 -4.30754 1 A5.1 Subtidal Coarse Sediment SS.SCS.CCS
58 GT23 51.21521 -4.30713 2 A5.6 Subtidal Biogenic Reef* SS.SBR.PoR.SspiMx
58 GT23 51.21524 -4.30683 3 A5.1 Subtidal Coarse Sediment SS.SCS.CCS
58 GT23 51.21526 -4.30660 4 A5.1 Subtidal Coarse Sediment SS.SCS.CCS
61 GT24 51.22693 -4.30802 1 A5.1 Subtidal Coarse Sediment SS.SCS.CCS
107 GT25 51.23825 -4.30865 1 A5.4 Subtidal Mixed Sediments SS.SMx.CMx
106 GT26 51.25054 -4.30875 1 A5.4 Subtidal Mixed Sediments SS.SMx.CMx
86 GT27 51.20952 -4.30167 1 A5.6 Subtidal Biogenic Reef* SS.SBR.PoR.SspiMx
86 GT27 51.20949 -4.30174 2 A5.1 Subtidal Coarse Sediment SS.SCS.CCS
86 GT27 51.20941 -4.30194 3 A4.2 Moderate Energy Circalittoral Rock CR.MCR.CSab.Sspi
86 GT27 51.20936 -4.30207 4 A5.1 Subtidal Coarse Sediment SS.SCS.CCS
60 GT28 51.22047 -4.30216 1 A5.1 Subtidal Coarse Sediment SS.SCS.CCS
105 GT31 51.25605 -4.30303 1 A5.1 Subtidal Coarse Sediment SS.SCS.CCS
59 GT32 51.21578 -4.29645 1 A5.6 Subtidal Biogenic Reef* SS.SBR.PoR.SspiMx
59 GT32 51.21545 -4.29669 2 A5.1 Subtidal Coarse Sediment SS.SCS.CCS
59 GT32 51.21535 -4.29677 3 A4.2 Moderate Energy Circalittoral Rock CR.MCR
59 GT32 51.21516 -4.29693 4 A5.6 Subtidal Biogenic Reef* SS.SBR.PoR.SspiMx
45 GT33 51.22624 -4.29932 1 A5.4 Subtidal Mixed Sediments SS.SMx.CMx
108 GT34 51.23855 -4.29813 1 A5.1 Subtidal Coarse Sediment SS.SCS.CCS
44 GT36 51.22120 -4.29179 1 A5.1 Subtidal Coarse Sediment SS.SCS.CCS
44 GT36 51.22039 -4.29225 2 A5.1 Subtidal Coarse Sediment SS.SCS.CCS

Morte Platform rMCZ Post-survey Site Report 54
Station No.
Station Code Latitude Longitude Habitat No. EUNIS Level 3/BSH MNCR Code
41 GT37 51.23413 -4.29440 1 A5.1 Subtidal Coarse Sediment SS.SCS.CCS
41 GT37 51.23380 -4.29515 2 A5.6 Subtidal Biogenic Reef* SS.SBR.PoR.SspiMx
25 GT39 51.25512 -4.29455 1 A5.1 Subtidal Coarse Sediment SS.SCS.CCS
42 GT40 51.22954 -4.28795 1 A5.1 Subtidal Coarse Sediment SS.SCS.CCS
90 GT41 51.23846 -4.28762 1 A5.1 Subtidal Coarse Sediment SS.SCS.CCS
26 GT42 51.24995 -4.28817 1 A5.1 Subtidal Coarse Sediment SS.SCS.CCS
104 GT43 51.26120 -4.29162 1 A5.1 Subtidal Coarse Sediment SS.SCS.CCS
88 GT44 51.23336 -4.28116 1 A4.2 Moderate Energy Circalittoral Rock CR.MCR
27 GT45 51.24456 -4.28285 1 A5.1 Subtidal Coarse Sediment SS.SCS.CCS
99 GT46 51.25640 -4.28159 1 A5.1 Subtidal Coarse Sediment SS.SCS.CCS
43 GT47 51.22711 -4.28130 1 A5.1 Subtidal Coarse Sediment SS.SCS.CCS
98 GT49 51.25134 -4.27484 1 A5.1 Subtidal Coarse Sediment SS.SCS.CCS
98 GT49 51.25128 -4.27516 2 A4.2 Moderate Energy Circalittoral Rock CR.MCR.EcCr.FaAlCr.Flu
89 GT50 51.23370 -4.27216 1 A5.1 Subtidal Coarse Sediment SS.SCS.CCS
97 GT54 51.24486 -4.26071 1 A5.1 Subtidal Coarse Sediment SS.SCS.CCS
BSHs for the stations sampled during the 2012 survey, and for station GT10 during 2014, were classified using data from video stills only.
*The BSH ‘A5.6 Subtidal biogenic reefs’ has been classified based solely on video still images, further dedicated survey work would need to be undertaken to confirm reef status.
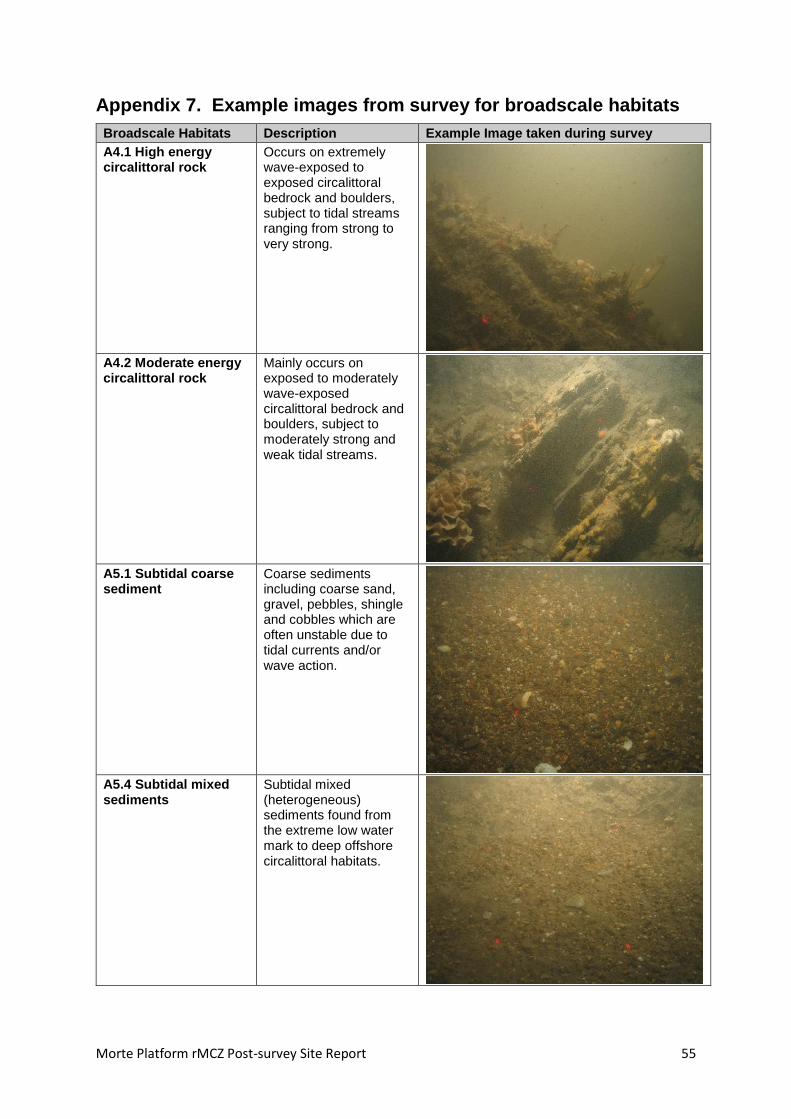
Morte Platform rMCZ Post-survey Site Report 55
Appendix 7. Example images from survey for broadscale habitats
Broadscale Habitats Description Example Image taken during survey
A4.1 High energy circalittoral rock
Occurs on extremely wave-exposed to exposed circalittoral bedrock and boulders, subject to tidal streams ranging from strong to very strong.
A4.2 Moderate energy circalittoral rock
Mainly occurs on exposed to moderately wave-exposed circalittoral bedrock and boulders, subject to moderately strong and weak tidal streams.
A5.1 Subtidal coarse sediment
Coarse sediments including coarse sand, gravel, pebbles, shingle and cobbles which are often unstable due to tidal currents and/or wave action.
A5.4 Subtidal mixed sediments
Subtidal mixed (heterogeneous) sediments found from the extreme low water mark to deep offshore circalittoral habitats.
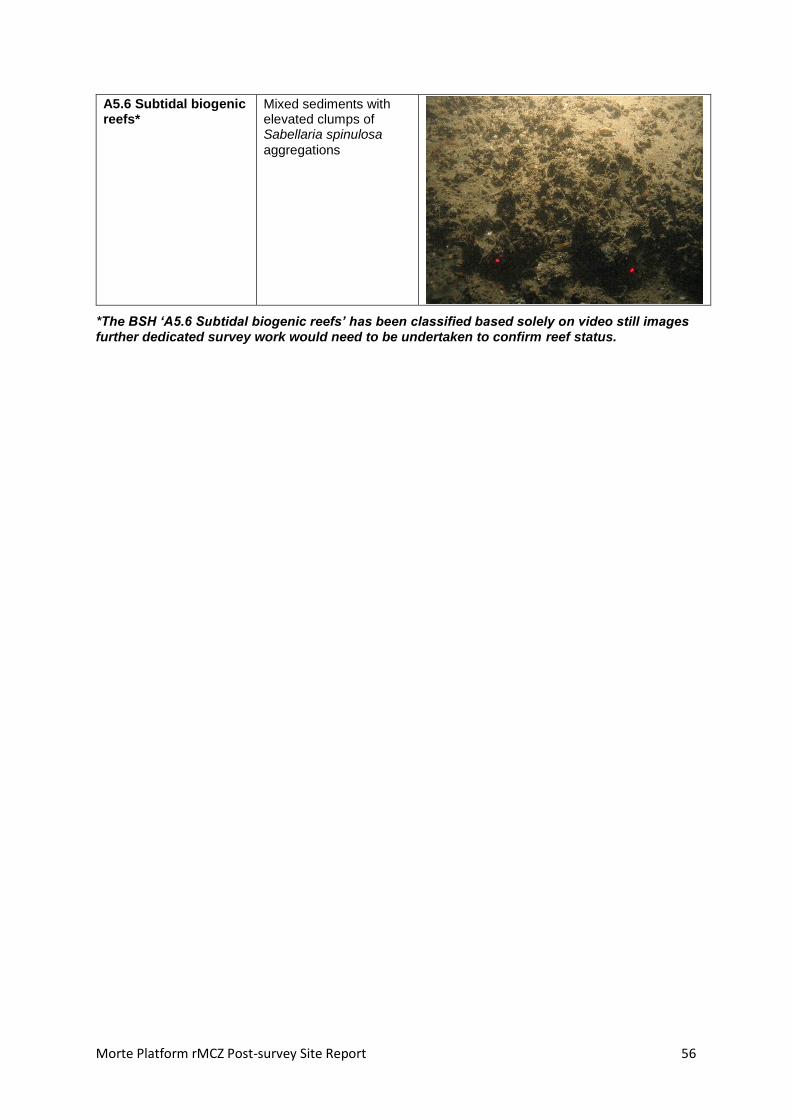
Morte Platform rMCZ Post-survey Site Report 56
A5.6 Subtidal biogenic reefs*
Mixed sediments with elevated clumps of Sabellaria spinulosa
aggregations
*The BSH ‘A5.6 Subtidal biogenic reefs’ has been classified based solely on video still images further dedicated survey work would need to be undertaken to confirm reef status.

Morte Platform rMCZ Post-survey Site Report 57
Appendix 8. Example images from survey for habitat FOCI
Habitat FOCI
Description Example Image taken during survey
None observed N/A N/A

Morte Platform rMCZ Post-survey Site Report 58
This page intentionally left blank

© Crown Copyright 2016