
Morphology, Crystallization and Melting Behavior of ......Morphology, Crystallization and Melting...
145
Morphology, Crystallization and Melting Behavior of Propylene-Ethylene Statistical Copolymers Julie Tammy Uan-Zo-li Dissertation submitted to the Faculty of the Virginia Polytechnic Institute and State University in partial fulfillment of the requirements for the degree of Doctor of Philosophy in Materials Science and Engineering Dr. Hervé Marand, Chairman Dr. Brian J. Love Dr. William Reynolds Dr. Alan Esker Dr. Richey Davis September 2005 Blacksburg, Virginia KEYWORDS: propylene-ethylene copolymers, ethylene inclusion, rigid amorphous fraction, thermodynamic heat of fusion, α and γ phases Copyright 2005, Julie T. Uan-Zo-li
Transcript of Morphology, Crystallization and Melting Behavior of ......Morphology, Crystallization and Melting...

Morphology, Crystallization and Melting Behavior
of Propylene-Ethylene Statistical Copolymers
Julie Tammy Uan-Zo-li
Dissertation submitted to the Faculty of the Virginia Polytechnic Institute and State University
in partial fulfillment of the requirements for the degree of
Doctor of Philosophy in
Materials Science and Engineering
Dr. Hervé Marand, Chairman
Dr. Brian J. Love Dr. William Reynolds
Dr. Alan Esker Dr. Richey Davis
September 2005 Blacksburg, Virginia
KEYWORDS: propylene-ethylene copolymers, ethylene inclusion, rigid amorphous fraction, thermodynamic heat of fusion, α and γ phases
Copyright 2005, Julie T. Uan-Zo-li

Morphology, Crystallization and Melting Behavior
of Propylene-Ethylene Statistical Copolymers
Julie T. Uan-Zo-li
Hervé Marand, Advisory Chairman
Abstract
In this work the morphology, crystallization and melting behavior of novel Dow
Chemical propylene-ethylene copolymers were investigated.
The incorporation of ethylene units into a polypropylene chain resulted in the
decrease in crystallization, melting and glass transition temperatures and overall
crystallinity. Based on the shape of heat capacity curves and the dependence of the
melting temperature offset on ethylene content, it was concluded that copolymers
prepared using different catalyst systems exhibited different ethylene sequence length
distributions.
The behavior of Dow Chemical propylene-ethylene copolymers was compared to
that of copolymers prepared using traditional metallocene and Ziegler-Natta catalysts.
The catalyst system used in the preparation of these new copolymers is similar to a
metallocene catalyst system.
It was demonstrated that ethylene defects are partially included in the polypropylene
crystal. The thermodynamic heat of fusion at the equilibrium melting temperature
decreased by 44% with an increase in ethylene concentration from 0 mol% to 21.2 mol%.
On the basis of calorimetric and density data, the inclusion model based on the Sanchez-
Eby crystallization theory was shown to be applicable for the evaluation of the degree of
crystallinity. At the same time, inadequacies were found in application of the rigid
amorphous fraction model to these copolymers.
iii
The formation of γ-phase crystals was shown to be favored by both an increase in the
ethylene content and a decrease in the crystallization rate. Increase in the ethylene
content was shown to lead to a decrease in the density, length and thickness of α-phase
crystals. It was also demonstrated that the cross-hatching morphology is present in all
propylene-ethylene copolymers.

iv
I would like to express my sincere gratitude to my advisor, Dr. Hervé Marand, for
his help and guidance over the past several years.
I would like to thank Dr. Brian J. Love, Dr. Alan Esker, Dr. Bill Reynolds and Dr.
Richey Davis for serving on my committee and for their useful remarks on my original
proposal.
I would like to thank Dow Chemical and GE scholarship program for providing the
financial support for this research project.
My gratitude to the following people for the help with this dissertation. Vickie Long
and Dr. Marek Pyda (University of Tennessee) for the use of their DSC equipment.
Steve McCartney for the help performing SEM experiments. My colleagues and friends
Chris Fratini, Brian Okerberg and Zhenyu Huang for their technical advice, for their
tremendous help with my experiments (especially when I was pregnant) and just for the
great time that we have shared.
Thank you to my friends, Ksenia Tcheslavskaia, Ksenia Pronina, Gleb Tcheslavski,
Alexey Pronin and Phil Papush for keeping me company and being there when I needed
them.
I would like to thank my family: my parents, Tamara and Mike, Rima, my brother
Joe, my sisters, Anna and Rachel, and my extended family: Svetlana and Boris for their
love and encouragement.
My special thank you to my mother, Tamara, and my mother-in-law, Svetlana, who
took months out of their busy schedules to help me to take care of my son Sean.
Thank you to my husband Alex for sharing with me all the ups and downs of our life,
for his support and love.
Finally, thank you to my wonderful son Sean, the joy of my life and my biggest
accomplishment.
ACKNOWLEDGEMENTS

v
To my family…

vi
1 INTRODUCTION..................................................................................................... 1
2 BACKGROUND ....................................................................................................... 3
2.1 STEREOCHEMISTRY OF POLYPROPYLENE ............................................................. 3
2.2 CRYSTALLIZATION............................................................................................... 4
2.3 COPOLYMER CRYSTALLIZATION.......................................................................... 8
2.4 MORPHOLOGY ................................................................................................... 13
2.5 TWO AND THREE PHASE MODELS...................................................................... 17
2.5.1 Two-Phase Model ......................................................................................... 17
2.5.2 Three-Phase Model....................................................................................... 19
2.6 NUCLEATING AGENTS........................................................................................ 22
3 PROPOSAL AND THESIS STATEMENT ........................................................ 24
THESIS STATEMENT ....................................................................................................... 26
4 EXPERIMENTAL.................................................................................................. 27
4.1 MATERIALS........................................................................................................ 27
4.2 METHODOLOGY ................................................................................................. 29
4.2.1 DSC Measurements....................................................................................... 29
4.2.2 Density Measurements .................................................................................. 33
4.2.3 Wide-Angle X-ray Measurements ................................................................. 33
4.2.4 Atomic Force Microscopy (AFM)................................................................. 34
4.2.5 Scanning Electron Microscopy (SEM).......................................................... 34
5 CALORIMETRY ANALYSIS .............................................................................. 36
5.1 HEAT CAPACITY CALCULATIONS....................................................................... 36
5.2 CRYSTALLINITY ANALYSIS ................................................................................ 41
5.2.1 Ethylene Inclusion Analysis .......................................................................... 45
TABLE OF CONTENTS

vii
5.2.2 RAF Based Analysis...................................................................................... 46
5.3 UNCERTAINTY ANALYSIS .................................................................................. 47
5.4 TG DETERMINATION........................................................................................... 50
5.5 MELTING AND CRYSTALLIZATION TEMPERATURES ........................................... 51
5.6 KINETICS OF ISOTHERMAL CRYSTALLIZATION................................................... 52
6 ANALYSIS OF DOW PROPYLENE-ETHYLENE COPOLYMERS.............. 53
6.1 RESULTS ............................................................................................................ 53
6.1.1 Crystallization and Melting Studies.............................................................. 53
6.1.2 Crystallinity and Thermodynamic Heat of Fusion........................................ 67
6.1.3 Morphology................................................................................................... 77
6.2 DISCUSSION ....................................................................................................... 93
6.2.1 Crystallization and Melting Studies.............................................................. 93
6.2.2 Crystallinity and Thermodynamic Heat of Fusion........................................ 98
6.2.3 Morphology................................................................................................. 103
7 NUCLEATED COPOLYMERS.......................................................................... 108
7.1 RESULTS .......................................................................................................... 108
7.2 DISCUSSION ..................................................................................................... 120
8 SUMMARY AND CONCLUSIONS ................................................................... 122
9 FUTURE WORK.................................................................................................. 125
9.1 ON THE CRYSTALLINITY AND THERMODYNAMIC HEAT OF FUSION
CALCULATIONS............................................................................................................ 125
9.2 ON THE MORPHOLOGY..................................................................................... 126
10 REFERENCES...................................................................................................... 127
APPENDIX 1…………………………………………………………….…….132
VITA…………………………………………………………...………………134

viii
Figure 2.1.1 Tacticity in poly(α-olefin)7 ............................................................................ 4 Figure 2.2.1 Polymer Spherulite with Chain-folded Lamellae ........................................... 5 Figure 2.2.2 Developmental Stages of a Spherulite............................................................ 6 Figure 2.2.3 Crystal Growth Regimes25.............................................................................. 8 Figure 2.3.1 Inclusion (top) and Exclusion (bottom) Models35 ....................................... 11 Figure 2.4.1 Two Unit Cells of iPP α-Phase Crystal........................................................ 14 Figure 2.4.2 γ iPP Crystal (left); α and γ Branching (right)57........................................... 16 Figure 2.5.1 Two-Phase Model......................................................................................... 17 Figure 2.5.2 Schematic representation of the semicrystalline material ............................ 20 Figure 5.1.1 Raw DSC cooling curve of PE-I (0.0, 320) as a function of temperature.... 37 Figure 5.1.2 Raw DSC cooling curve of PE-I (0.0, 320) as a function of time................ 37 Figure 5.1.3 Calculation of the Heat Displacement Curve ............................................... 38 Figure 5.1.4 PP Heat Capacities ....................................................................................... 39 Figure 5.1.5 Sapphire Cp Apparent and Cp Exact ............................................................. 39 Figure 5.1.6 Correction Factor (Fc)................................................................................... 40 Figure 5.2.1 Sample Crystallization Analysis Trace of PP............................................... 42 Figure 5.2.2 Reversible Heat Capacity of PE-VII (17.4, 290).......................................... 44 Figure 5.2.3 Crystallization of P/E (0.0, 330), ∆Hf
0 =207 J/g........................................... 44 Figure 5.2.4 Crystallization of P/E (0.0, 330), ∆Hf
0 =165 J/g........................................... 46 Figure 5.3.1 Deviation of Cp from the Cpliq in the Melt .................................................... 48 Figure 5.3.2 PE-III (12.3, 310) Cp Corrections................................................................. 48 Figure 5.3.3 Heat of Fusion Uncertainty Analysis ........................................................... 49 Figure 5.4.1 Schematic DSC Trace in the Glass Transition Region................................. 50 Figure 5.5.1 Schematic DSC Trace in the Melting Region .............................................. 52 Figure 6.1.1 DSC Crystallization Traces of Dow Copolymers: a) Series I-III, b) Series
VII, c) Series VI and VIII ......................................................................................... 54 Figure 6.1.2 DSC Melting Traces of Dow Copolymers: a) Series I-III, b) Series VII, c)
Series VI and VIIII.................................................................................................... 55 Figure 6.1.3 Crystallization and Melting Peak Temperatures of Dow Copolymers as a
Function of Ethylene Content ................................................................................... 56 Figure 6.1.4 Low and High Melting Endotherms (Dow Copolymers) as a Function of
Ethylene Content....................................................................................................... 56 Figure 6.1.5 Comparison of Dow Copolymers a) DSC Crystallization Traces, b) DSC
Melting Traces .......................................................................................................... 57 Figure 6.1.6 Crystallization Onset and Melt Offset Temperatures for Dow copolymers as
a Function of Composition........................................................................................ 58 Figure 6.1.7 Melt Offset Temperatures for Dow copolymers as a Function of
Composition.............................................................................................................. 58 Figure 6.1.8 Glass Transition Temperatures and Crystallinity of Dow Copolymers as a
Function of Composition .......................................................................................... 59
LIST OF FIGURES

ix
Figure 6.1.9 DSC Crystallization Traces of P/E Copolymers: a) Ziegler-Natta, b) Metallocene............................................................................................................... 61
Figure 6.1.10 DSC Melting Traces of P/E Copolymers: a) Ziegler-Natta, b) Metallocene................................................................................................................................... 62
Figure 6.1.11 Comparison of Dow, Ziegler-Natta and Metallocene Copolymers: DSC Traces a) Crystallization, b) Melting (4.4-5.4mol% Ethylene), c) Melting (12.8-13.6mol% Ethylene) ................................................................................................. 63
Figure 6.1.12 Crystallization Temperatures of Copolymers as a Function of Composition................................................................................................................................... 64
Figure 6.1.13 Melting Temperatures of Copolymers as a Function of Composition ....... 64 Figure 6.1.14 Crystallization Onset Temperatures of P/E Copolymers as a Function of
Composition.............................................................................................................. 65 Figure 6.1.15 Melt Offset Temperatures of P/E Copolymers as a Function of Composition
................................................................................................................................... 65 Figure 6.1.16 Crystallinity of P/E Copolymers as a Function of Composition ................ 66 Figure 6.1.17 Glass Transition Temperatures of P/E Copolymers as a Function of
Composition.............................................................................................................. 66 Figure 6.1.18 Dependence of the Thermodynamic Heat of Fusion on the Ethylene
Content...................................................................................................................... 68 Figure 6.1.19 Dependence of the Thermodynamic Heat of Fusion on the Ethylene
Content (Crystallization and Melting) ...................................................................... 68 Figure 6.1.20 Normalized ∆Hf
0 as a Function of Composition ........................................ 69 Figure 6.1.21 Normalized ∆Hf for Inclusion and RAF Models as a Function of
Composition.............................................................................................................. 69 Figure 6.1.22 Crystallinity from Inclusion and RAF Models as a Function of Composition
................................................................................................................................... 71 Figure 6.1.23 Heat Capacity Change at Tg and Rigid Amorphous Fraction as a Function
of Ethylene Content .................................................................................................. 71 Figure 6.1.24 XRAF and XMAF as a Function of Crystallinity............................................ 72 Figure 6.1.25 Xc by Density (Alamo Unit Cell) and DSC (RAF and Inclusion Model) as
a Function of Composition........................................................................................ 74 Figure 6.1.26 Xc by Density (Laihonen Unit Cell) and DSC (RAF and Inclusion Model)
as a Function of Composition ................................................................................... 74 Figure 6.1.27 RAF from Inclusion and RAF Models: a) vs. Ethylene Content, b) vs.
Crystallinity............................................................................................................... 75 Figure 6.1.28 RAF Model Crystallinity from Density and DSC as a Function of
Composition a) Alamo Unit Cell, b) Laihonen Unit Cell ......................................... 76 Figure 6.1.29Isothermal Crystallization: Effect of Composition a) PE-I (0.0, 320), b) PE-
II (4.4, 320), c) PE-III (7.8, 160), d) PE-I (8.2, 300), e) PE-III (12.3, 310), f) PE-I (13.6, 290), g) PE-I (15.7, 260)................................................................................. 78
Figure 6.1.30 Effect of the Crystallization Temperature on Isothermal Crystallization of PE-I (0.0, 320)........................................................................................................... 80
Figure 6.1.31 Effect of the Crystallization Temperature on Isothermal Crystallization of PE-II (4.4, 320) ......................................................................................................... 81
Figure 6.1.32 Effect of the Crystallization Temperature on Isothermal Crystallization of PE-I (15.7, 260)......................................................................................................... 82
x
Figure 6.1.33 Effect of the Ethylene Content and the Crystallization Temperature on Isothermal Crystallization: a) PE-I (0.0, 320), b) PE-II (4.4, 320), c) PE-III (7.8, 160), d) PE-I (8.2, 300), e) PE-III (12.3, 310), f) PE-I (13.6, 290) .......................... 84
Figure 6.1.34 Rate of the Crystal Phase Formation a) PE-I (0.0, 320) Tx = 122.1°C b) PE-II (4.4, 320), Tx = 96.1°C.......................................................................................... 85
Figure 6.1.35 Effect of the Crystallization Temperature on B(Tx) for a) PE-I (0.0,320), b) PE-II (4.4, 320) ......................................................................................................... 86
Figure 6.1.36 Effect of Composition on WAXD Signal for Selected Bench Top Cooled Dow Copolymers ...................................................................................................... 87
Figure 6.1.37 WAXD: Effect of the Ethylene Content and the Cooling Rate on the γ–Phase Content............................................................................................................ 87
Figure 6.1.38 The Effect on the Defect Concentration and Isotactic Sequences Length <Liso> on γ-Phase Content for Dow Copolymers, Alamo et al.50 P/E Copolymers, De Rosa et al.124 PP (Blue Line Represents the Trendline only through Dow Copolymers Data Points) .......................................................................................... 88
Figure 6.1.39 AFM: Effect of Composition on the Morphology of Propylene-Ethylene Copolymers: a) PE-I (0.0, 320), b) PE-II (4.4, 320), c) PE-I (8.2, 300), d) PE-I (13.6, 290), e) PE-I (15.7, 260), f) PE-I (19.4, 260) ............................................... 90
Figure 6.1.40 SEM: the Effect of Composition on Morphology of Propylene-Ethylene Copolymers: a) PE-I (0.0, 320), b) PE-I (8.2, 300) etched, c) PE-I (19.4, 260)...... 91
Figure 6.1.41 SEM: The Effect of the Catalyst System on Morphology of Propylene-Ethylene Copolymers: a) PE-I (8.2, 300) etched, b) ZN P/E 8.3 c) Met P/E 6.5 ..... 92
Figure 6.2.1 ∆Cp Deficiency Calculations ...................................................................... 103 Figure 7.1.1 Effect of the Type of Nucleating Agent at 3wt% on the a) Crystallization
DSC Trace, b) Melting DSC Trace......................................................................... 109 Figure 7.1.2 Effect of Nucleating Agent Content on Crystallization DSC Trace of P/E I
(8.2, 320): a) vanilla iPP-low MFR, b) vanilla iPP-high MFR, c) commercial HMS iPP, d) HDPE .......................................................................................................... 111
Figure 7.1.3 Effect of the Nucleating Agent Content on Melting DSC Trace of P/E I (8.2, 320): a) vanilla iPP-low MFR, b) vanilla iPP-high MFR, c) commercial HMS iPP, d) HDPE ...................................................................................................................... 114
Figure 7.1.4 Effect of the Nucleator Type and Level on Crystallization Onset of P/E I (8.2, 320)................................................................................................................. 115
Figure 7.1.5 WAXD: Effect of the Nucleator Type and Level on Crystallinity of P/E I (8.2, 320)................................................................................................................. 115
Figure 7.1.6 WAXD: Effect of the Nucleator Type and Level on γ-Phase content of P/E I (8.2, 320)................................................................................................................. 116
Figure 7.1.7 SEM: Effect of Nucleating Agent Type on Morphology of P/E-1(8.2,320) at 3wt% of Nucleator a) no nucleator, b) vanilla iPP-low MFR, c) vanilla iPP-high MFR, d) commercial HMS iPP............................................................................... 117
Figure 7.1.8 SEM: Effect of vanilla iPP-high MFR Level on Morphology of P/E-1(8.2,320) a) 0wt%, b) 3wt%, c) 10wt% ................................................................ 118
Figure 7.1.9 SEM Effect of HDPE Level on Morphology of P/E-1(8.2,320): a) 1wt%, b) 10wt % .................................................................................................................... 119

xi
Table 4.1.1 Dow Chemical Copolymers........................................................................... 27
Table 4.1.2 Tacticity and Regio-Error Content ................................................................ 28
Table 4.1.3 Metallocene Copolymers ............................................................................... 28
Table 4.1.4 Ziegler-Natta Copolymers ............................................................................. 29
Table 4.1.5 Types and Concentrations of Nucleating Agents .......................................... 29
Table 4.2.1 Isothermal Crystallization Conditions ........................................................... 32
Table 4.2.2 X-ray Samples Cooling Profile...................................................................... 34
Table 5.3.1 Heat of Fusion Uncertainty Analysis............................................................. 50
LIST OF TABLES

1
1 INTRODUCTION
Polypropylenes and polyethylenes belong to the commodity thermoplastics which
account for the majority (about two thirds) of plastic materials consumed.1 Both of these
materials are commonly used in a number of applications ranging from flexible bottles
and toys to TV cabinets and luggage.2 In order to improve the properties of these
materials and widen the spectrum of their uses, scientists copolymerize their monomers
to form ethylene-propylene and propylene-ethylene copolymers. Copolymerization of
ethylene and propylene results in increased clarity, toughness and flexibility3 of the final
product.
Initially, polyethylenes were synthesized by radical polymerization. However, the
resulting materials had high degrees of branching and low densities and the process itself
was carried out at high pressures and temperatures.4 Polypropylenes were initially
synthesized by several cationic initiators, but the resulting materials, which were atactic
low molecular weight polymers, did not have any commercial value.4 The discovery in
the fifties of Ziegler-Natta catalysts, which allowed the stereospecific polymerization at
low pressures and temperatures close to ambient, revolutionized the production of
polypropylene, polyethylene and their copolymers.3,4 The resulting materials were linear
and had fairly wide molecular mass distributions. The recent development of
metallocene catalysts has led to further improvements in polypropylene and polyethylene
chemistry, since it is now possible to obtain materials with high stereoregularity and
narrow molecular mass distribution. The polypropylenes, polyethylenes and ethylene-
propylene copolymers are now produced in vast quantities. The commercial production
of propylene-ethylene copolymers with high ethylene content has, however, remained
challenging.
Recently, the Dow Chemical Company has developed a novel catalyst system that
allows for the copolymerization of propylene with ethylene and alpha-olefin monomers
in solution over a wide compositional range. These materials have unusual

2
crystallization and melting behavior and are claimed to have superior mechanical and
optical properties.5
The purpose of this study is to establish structure-property relationships for
these new propylene-ethylene systems and to compare these materials to those
synthesized using the traditional Ziegler-Natta and metallocene catalysts. In this work,
the effect of comonomer content on the overall crystallinity, thermal properties and
thermodynamic heat of fusion will be addressed. The studies of the development of
crystallinity and morphology as a function of comonomer content and processing
conditions will also be conducted. Since the level of inclusion of ethylene units into the
propylene crystal phase is still debated, this study will also need to focus on the
fundamental understanding of the effects of ethylene copolymerization with propylene.
Finally, the studies of heterogeneous nucleation effects on these copolymers will be
presented.

3
2 BACKGROUND
2.1 Stereochemistry of Polypropylene
Polypropylenes belong to the group of polymers that exhibit isomers. There are
two kinds of the isomerism that will be discussed here: structural isomerism and
configurational isomerism.6
Structural isomerism deals with the orientation of the monomer units as they are
incorporated into the growing polymer chain. There are three possible options of
connecting monomer units: head-to-tail, head-to-head and tail-to-tail. Head-to-tail
isomers are called regio-regular. The other isomers are considered as defects in the
polymerization process and their presence leads to a decrease in the overall crystallinity
of the material.
Configurational isomerism deals with the spatial arrangements of the side-groups in
the polymer molecule. Since polypropylenes have pseudochiral centers, they possess an
ability to form different spatial arrangements or in other words to exhibit different
tacticity. In the case of polypropylene, the polymer is said to be isotactic when the
methyl-side groups lay on the same side of the pseudochiral centers. Conversely, the
polymer is said to be syndiotactic when the side groups are on alternating sides of the
polymer chain. Finally, the polymer is said to be atactic when the side groups are
distributed randomly on either sides of the pseudochiral centers7(Figure 2.1.1). The
placement of methyl groups in the isotactic fashion on one side of the pseudochiral center
is called meso-placement and is designated by m. On the other hand, placement of the
group on the opposite sides of the pseudochiral center is called racemic placement and is
designated by r. This way, an atactic polymer will have a random sequence of r’s and
m’s, since it has a random distribution of side groups on both sides of the pseudochiral
center.
Both structural and configurational isomerisms are controlled by the
polymerization process. Different catalyst systems favor the formation of one type of
isomers and inhibit the formation of the others.8 Polymerization conditions can also

4
affect the isomer distribution along the polymer backbone. Since stereochemistry plays
an important role in the ability of a polymer to crystallize and in defining the properties
of the resulting crystals,9 both structural and configurational isomerism will be discussed
in more details in the next chapters as we talk specifically about their role in the
crystallization of polypropylene.
H R H R H R H R
H HH HH HH H
Isotactic
H R H R H R H R
H HH HH HH H
H R H R H R H R
H HH HH HH H
Isotactic
H R H R R H H R
H HH HH HH H
Atactic
H R H R R H H R
H HH HH HH H
H R H R R H H R
H HH HH HH H
Atactic
H R R H H R R H
H HH HH HH H
Syndiotactic
H R R H H R R H
H HH HH HH H
H R R H H R R H
H HH HH HH H
Syndiotactic
H R H R H R H R
H HH HH HH H
Isotactic
H R H R H R H R
H HH HH HH H
H R H R H R H R
H HH HH HH H
Isotactic
H R H R R H H R
H HH HH HH H
Atactic
H R H R R H H R
H HH HH HH H
H R H R R H H R
H HH HH HH H
Atactic
H R R H H R R H
H HH HH HH H
Syndiotactic
H R R H H R R H
H HH HH HH H
H R R H H R R H
H HH HH HH H
Syndiotactic
Figure 2.1.1 Tacticity in poly(α-olefin)*
2.2 Crystallization
Since polymers can crystallize in a number of ways (melt, solution, quiescent,
flow-induced, etc…), an exhaustive discussion is beyond the scope of this work. We will
focus here on crystallization from the melt under quiescent conditions.
Polymer crystallization from the melt takes place in two stages: primary
crystallization and secondary crystallization.
* Adapted from Sperling L.H., Introduction to Physical Polymer Science, 2nded., John Wiley & Sons Inc., New York, 1992, ch.2

5
Primary crystallization consists of the nucleation and the growth of spherulites, up
to the point of spherulite impingement. Nucleation is believed to be heterogeneous and
require the presence of impurities in the polymer melt which serve as sites for the
formation of nuclei. After the onset of nucleation, growth of the spherulite proceeds in
the radial direction from the nucleus and results in the formation of crystalline fibrils of
approximately constant width.10 Each fibril is, in fact, constituted by chain-folded
lamellae, where the fold surfaces are in general parallel to the spherulite radius (Figure
2.2.111).
Entangledinterlamellarlinks
Entangledinterlamellarlinks
Figure 2.2.1 Polymer Spherulite with Chain-folded Lamellae*
The most important feature of a lamella is its thickness which is related to the fold
length. The lamellar thickness (l) varies with crystallization conditions and is inversely
proportional to the supercooling. If Kl is a constant related to polymer characteristics,
such as the end surface free energy and the enthalpy of fusion, and ∆T is the difference
between the equilibrium melting and crystallization temperatures, then,
T
Kl l
∆∝
Equation 2.2.112
Entangled interlamellar links between chain-folded lamellae that are shown in
Figure 2.2.1, consist of tie molecules that start in one of the lamella and end up in the
neighboring lamella. The tie molecules formed during primary crystallization are
* Adapted from Hoffman J., Davis G., Lauritzen J., Treatise on Solid State Chemistry, Vol 3, Crystalline and Noncrystalline Solids, Hannay N., Ed. Plenum Press, New York., 1976, ch.7

6
believed to be shorter than several times the dimension of a random coil.13 The
interlamellar links account for the incidence of plastic deformation of semicrystalline
materials by providing the mechanism for stress transfer between crystalline lamellar
regions.
According to the Keith, the spherulite goes through several developmental stages
during its growth (Figure 2.2.2).14 At first, a chain-folded precursor forms and serves as
a basis for the formation of sheaf-like structures (hedrites or axialites15), the intermediate
stages of the spherulite development. After lamellae splay outward, the familiar spherical
shape of the spherulitic structure appears.16 The spherulite texture changes with
crystallization temperature from compact and open at low temperature to coarse and fine
at high temperature10. Under isothermal conditions the rate of spherulitic growth is
constant in the radial direction17 and the growth continues until impingement with other
spherulites. As mentioned earlier, the impingement marks the end of the primary
crystallization.
RR
Figure 2.2.2 Developmental Stages of a Spherulite*
Depending on the chain structure, the secondary crystallization may involve the
processes of lamellar thickening and/or the formation of new lamellae in gaps between
existing lamellae.13,18 Since the lamellae formed during the primary crystallization have
high surface-to-volume ratios, they have high free energies. The process of thickening
leads to a decrease in free energy and the formation of a more stable crystal; it is then, by
definition, thermodynamically driven and can be explained mathematically as follows. If
the lateral dimension of a crystal is x, the thickness of the crystal is l, and the surface free
* Adapted from Khoury F., Passaglia E., Treatise on Solid State Chemistry, Vol 3, Crystalline and Noncrystalline Solids, Hannay N., Ed. Plenum Press, New York, 1976, ch.6

7
energies of the basal surfaces and the lateral surfaces are σ and σe (σe > σ) respectively,
then the surface free energy of the lamellar crystal is
es xxlG σσ 224 += Equation 2.2.2
The thickening leads to a decrease in x, an increase in l and, consequently a decrease in
Gs.19
The formation of new crystals in-between existing lamellae is possible because of
the presence of amorphous material consisting of interlamellar links, loose folds, etc....
Some of the variables that define the ease of formation of these crystals are the
crystallization conditions, the amount of entanglements, which is, in turn, a function of
the molecular weight and the amount of regio- and stereo-defects present in the chains,
which controls the amount of interlamellar links. 18,20
Over the years a number of theories have been proposed to describe lamellar and
spherulitic growth: among them the Keith-Padden theory10,15 Sadler’s entropic barrier
(rough surface) model,21,22 and the Lauritzen-Hoffman (LH) nucleation theory.*,23,24,25,26
The LH nucleation theory accounts for the dependence of lamellar thickness on
supercooling and the dependence of growth rate on crystallization temperature. It
provides an explanation for the observation of chain-folding and predicts the dependence
of growth rate on molecular weight. It views the growth of a crystal as a two-step
kinetically controlled mechanism: the critical deposition of a first stem on a lateral
surface and the subsequent chain-folding to complete a new layer of the substrate. The
LH theory defines three regimes of crystallization kinetics which are shown
schematically in Figure 2.2.3.
As defined by the LH theory, deposition of a stem occurs at the rate i, whereas
substrate completion associated with chain folding occurs at the rate g. Regime I, which
takes place at high temperatures, is characterized by a superior rate of substrate
completion as compared to the rate of deposition on the crystal substrate i (g>>i).
Regime II, which occurs at intermediate temperatures, is characterized by the competition
between stem deposition and lateral growth (g ≈ i). Finally, regime III, typically at large
supercoolings, is characterized by a superior rate of stem deposition leading to multiple
secondary nuclei formed on the substrate (i>>g). Regime III is observed when the niche
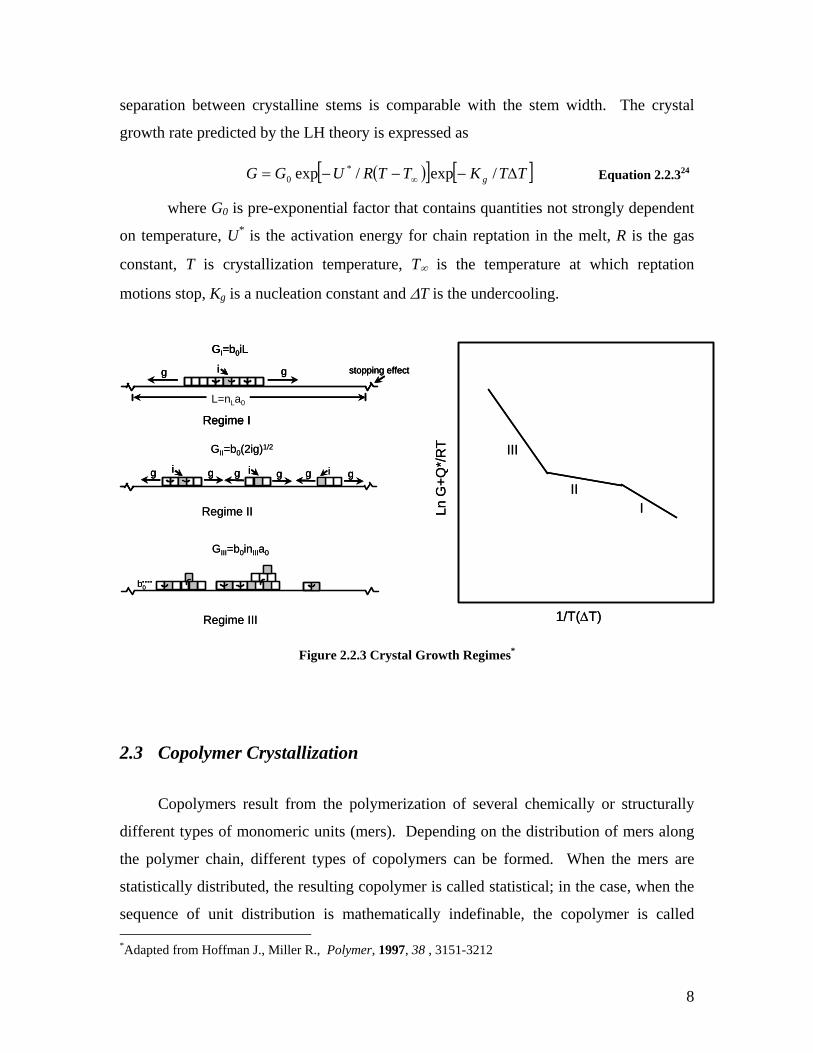
8
separation between crystalline stems is comparable with the stem width. The crystal
growth rate predicted by the LH theory is expressed as
( )[ ] [ ]TTKTTRUGG g ∆−−−= ∞ /exp/exp *0 Equation 2.2.324
where G0 is pre-exponential factor that contains quantities not strongly dependent
on temperature, U* is the activation energy for chain reptation in the melt, R is the gas
constant, T is crystallization temperature, T∞ is the temperature at which reptation
motions stop, Kg is a nucleation constant and ∆T is the undercooling.
gg stopping effecti
GI=b0iL
L=nLa0
Regime I
g
GII=b0(2ig)1/2
Regime II
GIII=b0inIIIa0
Regime III
i g i gg gg i
b0
gg stopping effecti
GI=b0iL
L=nLa0
Regime I
gg stopping effecti
GI=b0iL
L=nLa0
Regime I
gg
GII=b0(2ig)1/2
Regime II
GIII=b0inIIIa0
Regime III
ii gg ii gggg gggg i
b0
III
III
1/T(∆T)
LnG
+Q*/
RT III
III
1/T(∆T)
LnG
+Q*/
RT
Figure 2.2.3 Crystal Growth Regimes*
2.3 Copolymer Crystallization
Copolymers result from the polymerization of several chemically or structurally
different types of monomeric units (mers). Depending on the distribution of mers along
the polymer chain, different types of copolymers can be formed. When the mers are
statistically distributed, the resulting copolymer is called statistical; in the case, when the
sequence of unit distribution is mathematically indefinable, the copolymer is called *Adapted from Hoffman J., Miller R., Polymer, 1997, 38 , 3151-3212

9
unspecified7. Statistical copolymers include block, random and alternating copolymers.
In the case of block copolymers, long sequences of mers of one type are followed by long
sequences of mers of another type. In the case of alternating copolymers, the mers of
different types are distributed in alternating sequences. Finally, in the case of random
copolymers, the monomeric units of each type are distributed randomly throughout the
chain so that the probability of finding a mer of either type is independent of the nature of
its neighboring unit. Depending on the overall composition, random copolymers may
have a short order periodicity in the unit distribution and may have relatively long
sequences of either mer.
Repeat unit distribution is extremely important from the stand-point of copolymer
properties, in general, and copolymer crystallization, in particular. For example, in the
case of a block copolymer, if the mer-sequences are sufficiently long, the entropy of
mixing of the individual blocks is relatively low. If the block enthalpy of mixing is
sufficiently positive, an excess of free energy contribution may lead to microphase
separation. In this case, different phases would be present, with each phase exhibiting its
own glass transition temperature (Tg), melting temperature (Tm) and crystallization
temperature (Tc)27. On the other hand, chemically identical materials having shorter
blocks will be less susceptible to microphase separation and exhibit single Tg, Tm and Tc
intermediate between the values of the corresponding homopolymers. One can also
imagine that the properties of crystallizable copolymers will be greatly affected by the
“minority” comonomer inclusion in or exclusion from the “majority” comonomer crystal
as well as by the presence of stereo defects. Since there is considerable ongoing debate
on this topic, the review of prominent but extreme random copolymer crystallization
theories is presented here.
Flory’s thermodynamic equilibrium theory28,29,30 of copolymer crystallization
assumes that monomer B is excluded from the crystallites formed by A. The ability of a
sequence of A units to crystallize is dependent on its length ξ and on the crystallization
temperature: at a given temperature, if ξ is larger than a critical value, ξ*, then
crystallization takes place. At high temperatures, units of length ξ larger than ξ*
crystallize to form thick crystallites that in turn melt at high temperatures. As the
crystallization temperature decreases, the critical value of ξ* decreases as well and shorter

10
sequences are able to crystallize forming thinner crystals. As a result, copolymers exhibit
a significantly wider melting range than corresponding homopolymers whose chemical
structure consists entirely of units A. According to Flory, the equilibrium melting
temperature of a copolymer, Tm, is defined by the following relationship:
( ) pHRTT umm ln//1/1 0 ∆−=− Equation 2.3.130
where 0mT is the melting point of the pure polymer, R is a gas constant, uH∆ is the heat
of fusion per unit and p is a probability that unit A is succeeded by unit A regardless of
the preceding units. As evident from Equation 2.3.1, the melting temperature in Flory’s
model is independent of the chemical nature of unit B. The same is true of the degree of
crystallinity: the universal decrease in crystallinity due to copolymerization is solely a
function of the amount of units B and not of their chemical nature.
Based on the kinetic theory employed by Lauritzen, DiMarzio and Passaglia,31
Helfand and Lauritzen32 proposed a kinetic theory of copolymer crystallization that
accounts for both the incorporation of B units into A crystals and their exclusion. The
likelihood of inclusion of B units is considered from the perspective of energetic cost of
adding and detaching a stem during lamellar substrate formation and the energy
differences between the two processes. In the case of addition of an A unit, the crystal
free energy is lowered by ∆F0; however, in the case of insertion of a B unit, a free-energy
price ε is paid. The temperature dependence of ∆F0 is given as
( )( )TTTHF mmf −∆=∆ 000 / Equation 2.3.232
where 0mT is the melting point of a pure crystal and fH∆ is the heat of fusion of a pure
crystal. A decrease in temperature leads to a decrease in the crystal free energy and a
subsequent increase in the non-equilibrium inclusion of B units. This theory also
accounts for a lower copolymer melting temperature than that predicted by the exclusion
equilibrium model. This theory also predicts an increase in lamellar thickness due to B
unit incorporation. The model does not explicitly address the chemical nature of B.
Sanchez and Eby33,34,35 developed a kinetic theory of random copolymer
crystallization that accounts for both complete inclusion and exclusion as well as the

11
partial inclusion of units B into a crystalline matrix. These extreme models of inclusion
and exclusion are shown schematically in Figure 2.3.1.
The Sanchez-Eby model asserts that the crystalline morphology is kinetically
determined and the inclusion of B units into a crystal can lead to a thermodynamically
more stable system. In the inclusion model, the depression of the crystal melting point is
due to the decrease in the heat of fusion. Conversely, in the exclusion model, the melting
point depression is due to an increase in the entropy of fusion. Under isothermal
conditions, the Sanchez-Eby theory predicts an increase in lamellar thickness with
concentration of non-crystallizable B units, for both inclusion and exclusion models.
However, for a quenched system or for a system cooled at a constant rate, the crystal
thickness decreases with an increase in B concentration.35
Figure 2.3.1 Inclusion (top) and Exclusion (bottom) Models35 *
After thermodynamic and kinetic theories were published, numerous studies were
conducted and a large amount of evidence was collected to support both theories.36
Zimmerman37 studied the structural properties of Ziegler-Natta propylene-
ethylene copolymers with ethylene content up to 11%. He found that neither the
normalized heat of fusion nor the unit cell dimensions changed as a function of
* Reprinted with permission from Sanchez I., Eby R., Macromolecules, 1975, 8, 638-641. Copyright 1975 American Chemical Society

12
comonomer content. On the basis of these observations, Zimmerman concluded that
ethylene is excluded from polypropylene crystals.
Studies by Bruckner et al.38 and Feng et al.39,40 supported Zimmerman’s findings.
However, when Lahonen et al.41,42 studied propylene-ethylene copolymers in the same
ethylene concentration range as Zimmerman, their findings were opposite to those of
Zimmerman. They suggested a small decrease in the normalized enthalpy of fusion with
an increase in ethylene content and a slight expansion of the unit cell along the b
direction measured for propylene homopolymer and propylene-ethylene copolymers.
They concluded that ethylene is partially included in the propylene crystal. The same
conclusion was also reached in the number of other studies by De Rosa et
al.,43,44,4546,Starkweather et al.,47 Busico et al.,48 Hosier et al.49 and others.
A study conducted by Alamo et al.50 looked at the morphological partitioning of
ethylene defects in the random metallocene-based propylene-ethylene copolymers using
the solid state NMR spectroscopy. They have found that 42% of the ethylene units were
included in the propylene crystal for copolymers with ethylene concentration of 0.8-7.5
mol%. Furthermore, Alamo et al. demonstrated that the included ethylene units were
distributed equally through the whole crystal region and were not concentrated on the
crystal side of the interphase. They have also demonstrated the decrease in the
normalized heat of fusion associated with the ethylene inclusion in a polypropylene
crystal. The authors believe that the rate of ethylene unit incorporation in PP crystal
should stay at 42% or possibly higher for the copolymers with ethylene concentrations
above 7.5 mol % for the materials crystallized at the same undercoolings.
As will be demonstrated in the following chapters, we believe that the Sanchez-Eby
kinetic theory should apply in the case of propylene-ethylene copolymers, Ethylene units
can in fact enter the polypropylene crystal; however, the inclusion is limited to single
ethylene (E) units. The included single ethylene units will serve as defects in the
polypropylene crystal formation. For the PP crystallized non-isothermally, the inclusion
of ethylene will result in decrease in the lamellar thickness and will lead to decrease in
the crystallization and melting temperatures and overall crystallinity.49,51,52,53 EE, EEE or
larger sequences will be effectively excluded from the propylene crystal as predicted by
both Sanchez-Eby and Flory’s theories.

13
The inclusion of single copolymer units in a polypropylene crystal is not limited to
ethylene units. In the series of studies by De Rosa et al,43,54,55 butene, a bulkier
comonomer unit, was found to be included in the crystals of syndiotactic polypropylene
as well. However, comonomers such as hexene and higher alpha-olefins were excluded
from the polypropylene crystal in all instances.49
From the standpoint of previous discussions, it follows that both the chemical
nature and the unit distribution play a crucial role in determining the extent of
comonomer inclusion or exclusion and the resulting properties.
2.4 Morphology
Since it has been established that ethylene units can enter polypropylene crystals as
defects, it is now essential to take a look at the morphology of polypropylene and
propylene-ethylene copolymers in order to understand what happens to ethylene and
other defects as they enter the crystal.
It has been determined that polypropylene exhibits polymorphism. Depending on
the crystallization conditions and the regio and stereochemistry, polypropylene can form
α, β, γ or smectic phases, all of which are based on the 31 helical conformation56
characterized by a 6.5 A repeat distance.57,58
The β crystal phase of polypropylene has a trigonal unit cell with cell dimensions
of a = b = 11.03 A, c = 6.49 A and contains three isochiral helices as reported by Meille
et al.59 The β phase morphology exhibits significant screw dislocations,57 a density lower
than that of the γ and α phases,70,60 higher static disorder,60,61 higher spherulitic growth
rates and lower stability.70 The conditions59 favoring the β phase formation in isotactic
propylene are crystallization with the help of certain nucleating agents,62 directional
solidification in a temperature gradient and oriented crystallization under shear. Upon
heating, β phase crystals transform into α phase crystals.70
The smectic phase is an unstable, partially ordered phase of iPP that transforms to
α phase if annealed at temperatures above 70-80°C.63 Conditions favoring the smectic
phase formation are quenching, casting of both iPP and low ethylene content propylene-
ethylene copolymers63 and drawing at room temperature.57

14
Both β and smectic phases are not of a large significance for the present discussion
and will not be mentioned any further in this manuscript. Instead the focus will shift to
α and γ phase crystals since they are the subject of this work.
The α phase crystal of polypropylene shown in Figure 2.4.1 has a monoclinic unit
cell with cell dimensions a = 6.65 A, b= 20.96 A, c = 6.5 A, β = 99.8°.
Figure 2.4.1 Two Unit Cells of iPP α-Phase Crystal64*
As a result of steric repulsion effects between methyl groups, α phase crystals are
made up of sheets of alternating right handed (R) and left handed (L) helices.64 As a
result, regular packing in the α phase can be described as follows56
RL RL RL RL RL
However, if the chirality of two consecutive sheets happens to be the same due to a “local
accident”, the packing becomes56
RL RL RL + LR LR LR
This local accident gives rise to epitaxial lamellar branching which leads to the cross-
hatched morphology which is unique to polypropylene. In this case the helices are
parallel to different cell edges because of chain axis rotation by angle β with the a and c
axes of one unit cell parallel to the respective c and a axis of the other.65 As a result of
* Reprinted from Polymer, 37(22), Lotz B., Wittmann J.C., Lovinger A.J., Structure and morphology of poly(propylenes): A molecular analysis , 4979-4992, Copyright 1996 with permission from Elsevier

15
this rotation, daughter lamellae nucleate at angles of 100° and 80° from the parent
lamella. It is possible to obtain two distinct forms of α phase crystals: α1 and α2 which
differ by the degree of disorder.66 Transition from the less ordered α1 to the more
ordered α2 can be achieved by annealing with partial melting and subsequent
recrystallization.67,48
The γ crystal phase of polypropylene has an orthorhombic unit cell with the cell
dimensions a = 8.54 A, b = 9.93 A, c = 42.41 A as reported by Brückner and Meille.68The
alternating right and left handed helices form bilayers of the following structure:56
RL + LR + RL + LR + RL + LR
As first determined by Brückner et al.,68,69 polymer chains in γ phase crystals are
not parallel to each other: polymer chains are parallel to one of two diagonals of the (a, b)
plane and are, therefore, at 80° angle from each other and at a 40° angle from the parent
lamella (Figure 2.4.2). It is important to note that γ phase crystals grow on the ac lateral
faces of α phase lamellae70 and that γ phase crystals do not branch since they usually
grow by a process that is similar to the one leading to the formation of branches in α
phase. It has been shown that α and γ phase crystals can co-exist under a number of
experimental conditions and that this coexistence is a fundamental property of the
system;71,72 however, the γ crystals form much thinner lamellae than do α phase
crystals.73 It was reported by Campbell et al.73 that the lamellar thickness in iPP samples
containing only γ crystals is about half that found in samples containing only α phase
crystals formed at the same supercoolings. The transformation of γ phase crystals into α
phase crystals is possible for oriented systems obtained by drawing.70
The conditions favoring the formation of γ phase in isotactic polypropylene are
crystallization at high pressures,74,75,76 slow crystallization at high temperatures,57,77
crystallization of short chains,78 presence of ethylene units51,77,79 and other defects
affecting the stereo or regioregularity.71, 80, 81
Alamo et al.82 conducted a study aimed at determining whether the nature of the
defects, (i.e. regio vs. stereo) play a role in the formation of γ phase crystals. It was
found that materials containing identical amounts of defects but of different nature have
identical γ phase contents over the whole range of crystallization temperatures. The same

16
study examined the effect of isotactic sequence length on γ phase formation. The
conclusion was reached that γ phase formation becomes less favorable with increasing PP
sequence length. Yamada et al.83 studied the effects of tacticity (stereo defects) on the
cross-hatching morphology of polypropylene. They determined that the cross-hatching
density increases with a decrease in isotacticity. In the study by Burfield and Doi,84 it
was determined that tacticity also affects the glass transition behavior of polypropylene:
Tg of syndiotactic PP is 14oC higher than that of isotactic PP. VanderHart et al.85,86 used
solid-state NMR spectroscopy to study how different types of defects in iPP partition
between the crystal and amorphous regions. They determined that about half of the
common stereo-defects (i.e. defects of the mrrm type) are included in the iPP α-crystal
phase as opposed to about a quarter of 2,1 erythro defects (regio defects from head-to-
head insertion). Since the propylene-ethylene copolymers used in this work contain both
types of defects, these findings are extremely important for our study.
Figure 2.4.2 γ iPP Crystal (left); α and γ Branching (right)57*
* Reprinted from Prog. Polym. Sci., 16(2-3), Bruckner S., Meille S.V., Petraccone V., Pirozzi B., Polymorphism in isotactic polypropylene , 361-404, Copyright 1991 with permission from Elsevier

17
2.5 Two and Three Phase Models
In the preceding sections, the discussion was mainly focused on the crystalline
region; however, the amorphous and interfacial regions are equally important in the
material properties determination. There are two prominent models that are commonly
used in the semicrystalline material analysis: two-phase and three-phase models. Both of
them will be briefly described in this section since they will play an important part in the
discussion in the following chapters.
2.5.1 Two-Phase Model
The two-phase model depicts a semicrystalline polymer as having only two phases:
crystalline phase and amorphous phase (Figure 2.5.1).
The main assumption of the two-phase model is insignificance of the transitional
region between the crystalline and amorphous phases. It is assumed that the interphase
region is so thin that it does not contribute significantly to the overall material properties
and the system as treated as if the sharp transition exists between the crystalline and
amorphous regions. The overall crystallinity of such system is then expressed by
Equation 2.5.1:
( ) ( )TXTX ac −= 1 Equation 2.5.1
where Xc(T) is the mass fraction of the crystalline material and Xa(T) is the mass fraction
of the amorphous material.
Figure 2.5.1 Two-Phase Model

18
This model is routinely utilized in order to calculate the crystallinities of the
semicrystalline materials, especially as a part of the differential scanning calorimetry
analysis (Equation 2.5.2).
( ) 0f
fc
HH
TX∆
∆= Equation 2.5.2
where ∆Hf is the measured sample enthalpy change during melting and ∆H0f is the
thermodynamic heat of fusion at the melting point.
The crystallinity of the semicrystalline polymer can also be calculated by
evaluating the change in the heat capacity of the material measured at the glass transition
temperature (Tg). Tg is defined as the temperature at which large range coordinated
molecular motions (10-50 atoms) occur. Below the Tg the amorphous polymer chains are
frozen with only vibrational motion and short range rotations present.87 As the
temperature is raised the chains start gaining mobility. The change in the heat capacity
during Tg serves as the measure of the fraction of the relaxing amorphous material. If the
only contributors to the heat capacity are amorphous and crystalline regions and all
polymer chains in the amorphous region undergo the relaxation during the glass
transition, then the crystallinity of the polymer can be expressed by Equation 2.5.3
( ) liqp
scpc
C
CTX
∆
∆−= 1 Equation 2.5.3
where scpC∆ is the change in the heat capacity at Tg of the semicrystalline material and
liqpC∆ is the change in the heat capacity at Tg of the fully amorphous material. The
quantity liqp
scp
C
C
∆
∆is also called mobile amorphous fraction and is commonly denoted as
fmaf.
Finally, by employing the two-phase model, the weight percent crystallinities of
the semicrystalline polymers can be determined using density measurements. The

19
density is assumed to be a function of the densities of the crystalline and amorphous
regions and the crystallinities are calculated using Equation 2.5.4.
( )( )ac
accXρρρρρρ
−−
= Equation 2.5.4
The two-phase model is capable of predicting material behavior in the systems
where the contribution of the interphase region is negligible as in the case of linear
polymers without bulky side-groups. Its usage beyond these materials is a subject to
limitations and should be used only if approximate property predictions are sufficient.
2.5.2 Three-Phase Model The three-phase model is considered more advanced by comparison to a two-
phase model. It takes into an account the interfacial region between the crystalline and
the amorphous phases which is comprised of high fraction of non-crystallizable units and
stereo and regio defects that might be excluded from the crystal structure. It also holds
the chains folds of varying loop length that are the by-product of the chain-folding
mechanism of the crystal growth. The interfacial region is characterized by high
interfacial free energy.88 The three-phase model is shown schematically in Figure 2.5.2.
The interesting concept introduced in the scope of the three-phase model is that of
the rigid amorphous fraction (RAF). RAF consists of the non-crystalline amorphous
portion of material constrained by the crystalline region. These constraints result from
frequent crossing of the interface by long folded polymer chains.89 In most cases RAF
does not participate in the relaxation that occurs as a result of passing through a Tg. It is
believed that the relaxation of RAF occurs somewhere between the Tg(amorphous) and
Tm and in some cases, as was claimed for poly(oxy-2,6-dimethyl-1,4-phenylene), can
even occur above Tm.90 The separate from Tg (amorphous) relaxation attributed to RAF
was shown for polypropylene,91 PEEK,92 poly(oxymethylene),93,94 poly(phenylene
sulfide)95 and several others polymer systems.89
In the study conducted by Grebowicz et al.,91 three-phase model was applied in
the analysis of the thermal properties of isotactic polypropylene. It was found that the

20
material crystallized at 0.5K/min, reached 47% crystallinity. According to the authors, it
also contained 22% of the mobile amorphous fraction and 31% of the rigid amorphous
fraction that contributed to non-crystalline region.
Figure 2.5.2 Schematic representation of the semicrystalline material96*
Some polymers such as polyethylene and polyethylene-propylene copolymers do
not show a separate Tg for RAF and the effect of the crystal is displayed only in the
broadening of the glass transition region.97,89,90 However, according to Wunderlich89 the
RAF-like structure is present in HDPE as well as demonstrated by Electron Spectroscopic
Imaging (ESI) conducted by Kunz et al.98,99
The existence of RAF was further supported by considering its effect on the
overall heat capacity of the system. If a RAF is present, but does not participate in the
relaxation at Tg, then the sum of the mass fractions of crystallinity and mobile amorphous
phase should be less than 1. The magnitude of the heat capacity step at Tg should
decrease because the amount of chains relaxing at Tg has been decreased by the amount
corresponding to RAF. Hence, the right side of Equation 2.5.3 should be higher than the
* Reprinted with permission from Mandelkern L., J. Phys. Chem., 1971, 75, 3909-3920. Copyright 1971 American Chemical Society

21
left side. This deficiency in ∆Cp at Tg was first shown by Menczel and Wunderlich100
and later demonstrated in other studies.91,92,94
In order to take into account the RAF contribution to an overall heat capacity,
Equation 2.5.3 has to be adjusted to include the mass fraction of RAF. The three-phase
model then defines material crystallinity, Xc as
( ) RAFliqp
scp
RAFMAFc f
C
CffTX −
∆
∆−=−−= 11 Equation 2.5.5
where fMAF is the mass fraction of mobile amorphous phase and fRAF is the mass fraction
of rigid amorphous phase.
If the three-phase model is used, then the crystallinity calculations from the
density measurements should include the RAF contribution as well. The RAF density
should fall between the densities of the fully amorphous and full crystalline materials.
Only a few studies discussed the RAF densities. Huo and Cebe101 calculated the density
of RAF in poly(phenylene sulfide). They suggested that the RAF density was only
slightly higher than that of the mobile amorphous fraction and much lower than the PPS
crystal density. The studies by Fischer and Fakirov102 and Bornschlegl and Bonart103 of
the structure and properties of poly(ethylene terephthalate) and poly(butylene
terephthalate) did not specifically address the issue of RAF. However, both studies
looked at the changes in the amorphous density with the degree of crystallinity. It was
found that the constrained amorphous phase density of semicrystalline materials was
higher than the density of the fully amorphous materials and that the amorphous density
increased with the increase in crystallinity.
These results as well as the applicability of the two-phase and three-phase models to
the Dow propylene-ethylene copolymer system will be discussed in details in the latter
chapters of this work.

22
2.6 Nucleating Agents
It had been discussed in Section 2.2 that the nucleation is one of the processes that
controls the primary crystallization. The nucleation for polymeric materials is
heterogeneous and requires the presence of a nucleation site for the formation of nucleus.
One of the methods that are used to increase the polymer nucleation efficiency is the
addition to the polymer melt of a foreign surface in the form of a nucleating agent. The
introduction of a foreign surface reduces the free-energy barrier to a primary nucleation
leading to a decrease in the critical nucleus size. The result of lowering a free enthalpy of
nucleation is the decrease in the crystallization induction time, which, in turn, results in
the increase in the nucleation rates.104,105 In the bulk polymer, as the heterogeneous
nucleation is initiated, the growth spreads through the whole material in a very short time
period.106
Since the addition of the nucleating agents leads to an increase in the nucleation
rates, the number of spherulites appearing simultaneously increases. The spherulite
impingement then takes place at the smaller spherulite radii leading to a finer
morphology107 than would have been resulted in the absence of a nucleating agent. The
mechanism for the heterogeneous nucleation is believed to be epitaxial.108,109
The addition of a nucleating agent changes the mechanical and optical properties of
the modified materials. The reported improvement in the optical properties and impact
resistance, commonly reported as an outcome of this type of heterogeneous
crystallization, result from the decrease in the size of the spherulites110. The reported
improvement in the tensile strength and flexural modulus result from the increase in the
overall crystallinity of the materials.111, 112
The nucleating agents commonly used to enhance polymer crystallization are low
molecular weight compounds. These compounds are divided into mineral and organic
nucleating agents. In the past years, the organic nucleating agents have been used
extensively to increase the nucleation efficiency of the polymers and improve their
optical and mechanical properties.113 One of the most common and well studied groups
of the polypropylene organic nucleators consists of the sorbitol derivatives.113,114,115 The
efficiency of sorbitols in promoting the polypropylene nucleation has been linked to their

23
superior dispersion in the polymer matrix reached through the formation of
thermoreversible gels.116
Macromolecular nucleating agents can also be used to enhance the nucleation of the
polypropylene. In this case the resulting system can be treated as a blend with a low
concentration of the nucleating agent. In this work macromolecular additives, both
miscible and immiscible in the polypropylene matrix, will be used to enhance the
nucleation efficiency of the propylene-ethylene copolymers.

24
3 PROPOSAL AND THESIS STATEMENT
Although a number of published studies have been aimed at the determination of
structure-property relationships for propylene-ethylene copolymers, few, if any of the
previous researchers have had access to a series of materials displaying such a wide range
of ethylene concentrations as has been available in this study. The new catalyst system
developed by the Dow Chemical Company provided the means of preparing propylene-
ethylene copolymers of unique stereo- and regio-chemistry, where the regio and stereo
errors are believed to be at the origin of the much improved mechanical and optical
properties. At the same time this catalyst system made it possible to copolymerize
propylene and ethylene containing up to 30 mol % ethylene. Synthesis of these materials
has set the stage for a systematic study of the effects of ethylene content and other defects
on the morphology and properties of propylene-ethylene copolymers over a wide
compositional range. Since these materials exhibit some unusual characteristics such as
good optical and mechanical properties and, as will be demonstrated further, unusual
crystallization and melting behavior, it is beneficial to compare these novel copolymers
with copolymers prepared by traditional metallocene and Ziegler-Natta catalysts in order
to understand the source of these material improvements.
As was noted in the previous sections, there is an ongoing debate in the scientific
community on the issue of inclusion vs. exclusion of ethylene units from polypropylene
crystal. This question is important because it deals with the fundamental understanding
of copolymer crystallization and crystal perfection. It is also essential in correctly
determining the degree of crystallinity for copolymers and consequently for making
further material behavior predictions since these are often based on the knowledge of the
overall degree of crystallinity. In this work the degrees of crystallinity will be
determined by two different methods. In the first method, the inclusion of the ethylene
into the propylene crystal will be taken into the account and the two-phase model will be
applied to the Dow propylene-ethylene system. In the second method, the RAF will be

25
taken into the account. The details of crystallinity calculations and Calorimetry data
analysis will be presented in Chapter 5.
It has generally been assumed in the literature that even if ethylene units enter the
polypropylene crystal lattice, the theoretical heat of fusion of the resulting crystal does
not change. However, some evidence of unit cell expansion that exists in the literature42
suggests that ethylene incorporation may lead to a decrease in crystal density and to a
decrease in crystal cohesive forces.
This study is set to accomplish the following primary goals:
- Establish structure-property relationships for the new “Dow Chemical”
copolymers focusing on the effect of comonomer content on the overall crystallinity and
thermal properties (Chapter 6).
- Study the development of crystallinity as a function of the comonomer content
and processing conditions (Chapter 6).
- Study the morphology of these materials as a function of commoner content and
processing conditions focusing on the formation of α and γ crystal phases (Chapter 6).
- Compare the thermal properties of Dow Chemical materials to these of
copolymers prepared by Ziegler-Natta and metallocene catalysts (Chapter 6).
- Study the effects of ethylene content on the thermodynamic heat of fusion to
shed further light on the concept of crystal perfection and ethylene inclusion and
determine the validity of the two and three phase models in respect to this propylene-
ethylene system (Chapter 6).
As a secondary goal, this study will examine the behavior of nucleated propylene-
ethylene copolymers in order to establish a nucleation efficiency scale for copolymer
materials prepared with a small amount of macromolecular additives (Chapter 7).

26
Thesis Statement
Addition of ethylene to a propylene chain to form a statistical propylene-ethylene
copolymer favors the formation of γ phase crystals and leads to a systematic depression
of the melting, crystallization and glass transition temperatures as well as crystallinity.
Ethylene units are partially included in isotactic polypropylene crystals as defects.
Hence, the thermodynamic heat of fusion should be a function of the concentration of
combined stereo, regio and comonomer defects.

27
4 EXPERIMENTAL
4.1 Materials
Statistical isotactic propylene-ethylene copolymers were supplied in the form of
pellets by the Dow Chemical Company in several batches (series). The materials along
with their composition, series number, catalyst type, molecular weights and
polydispersity indexes (as determined by Dow) are listed in Table 4.1.1. The information
on tacticity and regio-errors content, as supplied by Dow, is listed in Table 4.1.2.
Table 4.1.1 Dow Chemical Copolymers
Sample Name Series Ethylene Content,
mol%
Mw,
g/mol Mw/Mn Catalyst Type
PE-I (0.0, 320) I 0.0 320,000 2.7 A PE-I (8.2, 300) I 8.2 300,000 2.2 A
PE-I (13.6, 290) I 13.6 290,000 3.1 A PE-I (15.7, 260) I 15.7 260,000 2.2 A PE-I (19.4, 260) I 19.4 260,000 2.4 A PE-II (4.4, 320) II 4.4 320,000 A PE-III (7.8, 160) III 7.8 160,000 2.2 A
PE-III (12.3, 310) III 12.3 310,000 2.6 A PE-III (12.4, 160) III 12.4 160,000 2.3 A PE-III (14.8, 160) III 14.8 160,000 2.3 A PE-III (15.0, 120) III 15.0 120,000 2.2 A PE-VI (18.0, 320) VI 18.0 320,000 3.4 B PE-VII (3.3, 230) VII 3.3 230,000 2.3 B PE-VII (5.4, 160) VII 5.4 160,000 2.4 B PE-VII (6.7, 330) VII 6.7 330,000 2.3 B PE-VII (7.0, 170) VII 7.0 170,000 2.3 B
PE-VII (12.3, 300) VII 12.3 300,000 2.4 B PE-VII (12.8, 150) VII 12.8 150,000 2.2 B PE-VII (16.6, 150) VII 16.6 150,000 2.3 B PE-VII (17.4, 290) VII 17.4 290,000 2.4 B PE-VII (21.2, 280) VII 21.2 280,000 2.4 B PE-VIII (4.8, 310) VIII 4.8 310,000 B PE-VIII (7.8, 220) VIII 7.8 220,000 B
PE-VIII (13.3, 290) VIII 13.3 290,000 B
28
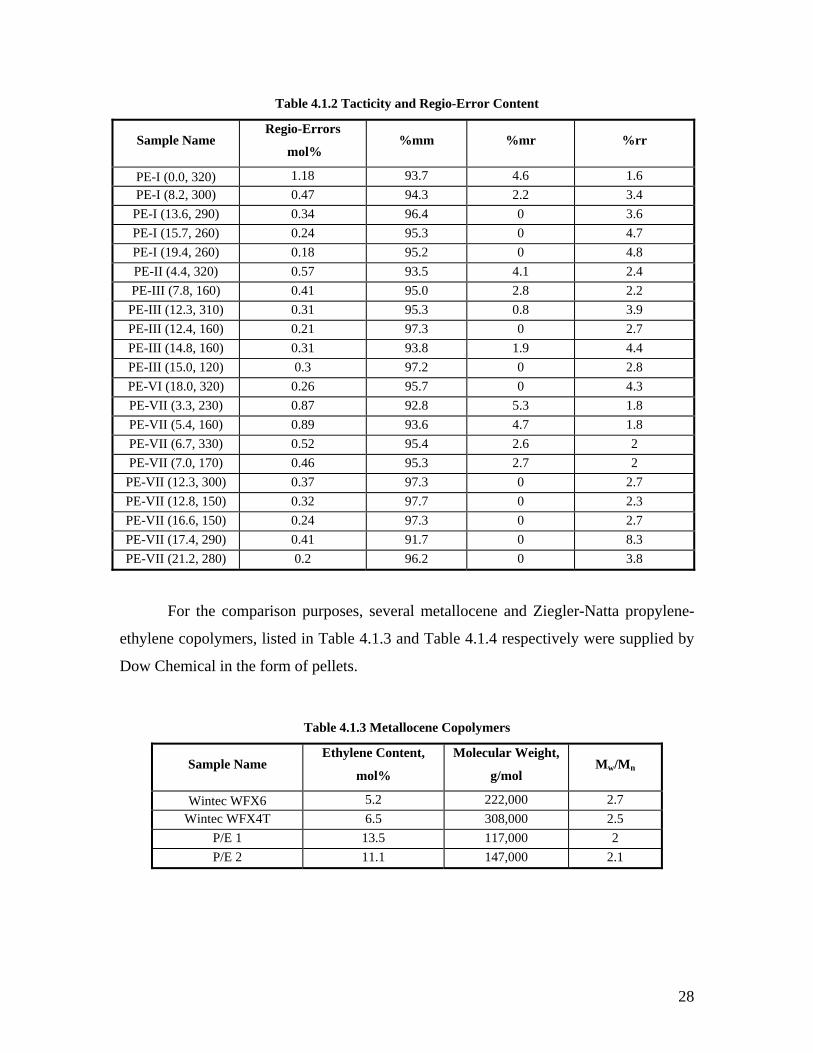
Table 4.1.2 Tacticity and Regio-Error Content
Sample Name Regio-Errors
mol% %mm %mr %rr
PE-I (0.0, 320) 1.18 93.7 4.6 1.6 PE-I (8.2, 300) 0.47 94.3 2.2 3.4
PE-I (13.6, 290) 0.34 96.4 0 3.6 PE-I (15.7, 260) 0.24 95.3 0 4.7 PE-I (19.4, 260) 0.18 95.2 0 4.8 PE-II (4.4, 320) 0.57 93.5 4.1 2.4 PE-III (7.8, 160) 0.41 95.0 2.8 2.2
PE-III (12.3, 310) 0.31 95.3 0.8 3.9 PE-III (12.4, 160) 0.21 97.3 0 2.7 PE-III (14.8, 160) 0.31 93.8 1.9 4.4 PE-III (15.0, 120) 0.3 97.2 0 2.8 PE-VI (18.0, 320) 0.26 95.7 0 4.3 PE-VII (3.3, 230) 0.87 92.8 5.3 1.8 PE-VII (5.4, 160) 0.89 93.6 4.7 1.8 PE-VII (6.7, 330) 0.52 95.4 2.6 2 PE-VII (7.0, 170) 0.46 95.3 2.7 2
PE-VII (12.3, 300) 0.37 97.3 0 2.7 PE-VII (12.8, 150) 0.32 97.7 0 2.3 PE-VII (16.6, 150) 0.24 97.3 0 2.7 PE-VII (17.4, 290) 0.41 91.7 0 8.3 PE-VII (21.2, 280) 0.2 96.2 0 3.8
For the comparison purposes, several metallocene and Ziegler-Natta propylene-
ethylene copolymers, listed in Table 4.1.3 and Table 4.1.4 respectively were supplied by
Dow Chemical in the form of pellets.
Table 4.1.3 Metallocene Copolymers
Sample Name Ethylene Content,
mol%
Molecular Weight,
g/mol Mw/Mn
Wintec WFX6 5.2 222,000 2.7 Wintec WFX4T 6.5 308,000 2.5
P/E 1 13.5 117,000 2 P/E 2 11.1 147,000 2.1

29
Table 4.1.4 Ziegler-Natta Copolymers
Sample Name Ethylene Content,
mol%
Mw
g/mol Mw/Mn
6D69 4.4 DS6D82 8.3 255,000 3.5
The nucleated PE-I (8.2, 300) copolymers were supplied by Dow Chemical. The
types and the concentrations of the commercial nucleating agents are listed in Table
4.1.5.
Table 4.1.5 Types and Concentrations of Nucleating Agents
Nucleating Agent Concentration,
Wt %
Vanilla iPP-low MFR (0.5) 1, 3 Vanilla iPP-high MFR (50) 1, 3, 10
Commercial HMS iPP 1, 3, 10 HDPE 1, 3, 10
4.2 Methodology
The different techniques used to analyze propylene-ethylene copolymers along with
the sample preparation conditions will be briefly outlined in this section.
4.2.1 DSC Measurements
Heating and Cooling Scans
The TA Q 1000 Differential Scanning Calorimeter (DSC) was used to obtain
heating and cooling traces of Dow, Ziegler-Natta and Metallocene copolymers. The
materials were heated to 180 °C, held isothermally for 5 min, cooled at 10 °C/min to -55
°C, held isothermally for 5 min, heated to 180 °C and held isothermally for 5 min. The
runs were conducted under helium atmosphere. The baseline run using two empty pans
was carried out before the first sample run and was repeated after every 5 samples.

30
The Perkin Elmer Pyris 1 DSC was used to obtain heating and cooling traces of
the nucleated copolymers. The materials were heated to 200 °C, held isothermally for 5
min, cooled at 10 °C/min to 25 °C, held isothermally for 5 min, heated to 200 °C and held
isothermally for 5 min. The runs were conducted under nitrogen atmosphere. The
baseline run using two empty pans was carried out before the first sample run and was
repeated after every 5 samples.
The materials were prepared by pressing the pellets between two pieces of
KaptonTM in a CarverTM hot press with nitrogen purge. Molds made of shims with a
thickness of .39 mm were used to regulate the film thickness. The temperature of the
press was set to 200°C. The samples were first allowed to melt for 5 min under low
pressure; a load of 2.3 metric tons was then applied for 10 sec, followed by release of
pressure for 10 sec. The last two steps were repeated 5 times in order to degas the melt
and minimize the amount of bubbles in the final film. Finally the films were quenched in
ice water.
In order to get a reliable signal in the low temperature region while introducing as
little heat transfer variations between the materials as possible, the masses of DSC
samples were kept between 10.500 and 11.500 mg.
The masses of sample and reference pans with lids were matched in order to
minimize heat flow displacement between the two sample holders. The sum of masses of
pans and lids was kept in the range from 27.680 mg to 27.760mg.
DSC scans were corrected for temperature lags for both cooling and heating
scans. Cooling scans117 were corrected by determining the temperature lag for the
nematic-to-isotropic transition onset of 4,4-azoxyanisole which occurs at 136°C. Heating
scans were corrected by determining the temperature lag during the melting of indium
(using PP-indium sandwiched films) the onset of which occurs at 156.6°C.
The enthalpy calibration using the enthalpy of melting of Indium of 28.5 J/g and
the initial melting Indium endotherm slope calibrations of the DSC machine were
performed prior to the measurements. These were done to ensure the correct shape of the
melting endotherm and the magnitude of the measured enthalpy change.
31
Specific heat capacities of the copolymers were calculated from the apparent heat
capacities by using a correction factor determined from the DSC trace recorded for a
28.296 mg sapphire standard.
Isothermal Crystallization
Isothermal crystallization experiments were carried out using a Perkin Elmer
Pyris 1 DSC.
The samples were prepared by the method described in the preceding section with
the exception of the thickness of shims which in this case was 0.1mm.
The masses of DSC samples were kept between 3.000 and 4.000 mg: small
enough to avoid heat transfer problems, but large enough to get a reliable stable signal.
The appropriate sample sizes were determined in the preliminary experiments where the
effect of mass (1.00 to 20.00 mg) on the reproducibility of the DSC signal was studied.
DSC scans were corrected for temperature lag during heating using the melting
onset of Indium (using PP-Indium sandwich) which occurs at 156.6°C.
The lowest crystallization temperatures for each copolymer were chosen based on
the crystallization onset temperature determined in independent heating/cooling
experiments. The runs were conducted using the following program. The materials were
melted at 200°C for 5 min, then cooled at 40 °C/min rate to the chosen crystallization
temperature, held for 1min, then heated at the 10 °C/min rate to 200°C melted for 5 min,
cooled at the 40 °C/min rate to the chosen crystallization temperature, held at this
temperature for a specified time, then heated at the 10 °C/min rate to 200°C and the entire
process (including 1min crystallization step used as a baseline) was repeated for the next
length of crystallization time. The runs were conducted under nitrogen atmosphere.
The samples, crystallization temperatures and times are summarized in Table
4.2.1.

32
Table 4.2.1 Isothermal Crystallization Conditions
Sample Name Crystallization Temperature
°C
Crystallization Time
min
PE-I (0.0, 320) 119.6 2, 4, 8, 16, 32, 64, 128 120.1 2, 4, 8, 16, 32, 64, 128 122.1 4, 8, 16, 32, 64, 128 124.1 8, 16, 32, 64, 128
PE-I (8.2, 300) 78.6 2, 4, 8, 16, 32, 64, 128 79.1 2, 4, 8, 16, 25, 32, 45, 64 84.1 10, 16, 32, 64 86.1 20, 32, 45, 64, 90
PE-I (13.6, 290) 64.6 2, 4, 8, 16, 32, 64, 128 70.1 8, 16, 32, 45, 60, 90 72.1 8, 16, 32, 45, 60, 90
PE-I (15.7, 260) 39.6 2, 8, 16, 32, 64, 128 44.1 8, 16, 32, 60, 90, 120 45.1 8, 16, 32, 60, 90, 120
PE-II (4.4, 320) 95.1 2, 4, 8, 16, 32, 64, 128, 256 97.1 2, 4, 8, 16, 32, 64, 128 99.1 4, 8, 16, 32, 64, 128 101.1 4, 8, 16, 32, 64, 128
PE-III (7.8, 160) 83 2, 4, 8, 16, 32, 64, 128 86 4, 8, 16, 32, 64, 128 88 4, 8, 16, 32, 64, 128
PE-III (12.3, 310) 71 2, 4, 8, 16, 32, 64, 128 73 4, 8, 16, 32, 64, 128 75 8, 16, 32, 64, 128
Temperature Modulated DSC (TMDSC)
TMDSC (TA Q1000) in the saw-tooth mode was used in order to evaluate the
reversible heat capacity of PE-VII (17.4, 290). A sample of 4.369 mg mass was prepared
by the method outlined in the preceding section. The material was cooled under helium
purge from 200°C to -90°C at 10°C/min overall rate with the temperature amplitude A of
1°C, period p of 60s and step rate q of 2°C/min.

33
4.2.2 Density Measurements* Density measurements were obtained using a TechneTM density column filled
with a mixture of isopropanol and water allowing a density gradient in the range of 0.81-
0.93 g/cm3. The water bath surrounding the column was kept at 23°C. The column was
calibrated using 14 standardized calibration glass beads.
The materials were prepared by pressing the pellets between two pieces of
KaptonTM in a CarverTM hot press with nitrogen purge. Molds made of shims with a
thickness of .39 mm were used to regulate the film thickness. The temperature of the
press was set to 200°C. The samples were first allowed to melt for 5 min under low
pressure; a load of 2.3 metric tons was then applied for 10 sec, followed by release of
pressure for 10 sec. The last two steps were repeated 5 times in order to degas the melt
and minimize the amount of bubbles in the final film. Finally the films were quenched in
ice water.
The samples were crystallized using Perkin Elmer Pyris 1 DSC. They were
melted at 180°C for 3 min, cooled to -40°C at the rate of 10°C/min, held at this
temperature for 5min and heated to 23°C at the rate of 10°C/min.
The materials were then cut in a variety of shapes with an approximate diameter
of 5 mm. Before being dropped inside the density column, the samples were dipped in
water in order to avoid creation of bubbles on the material surfaces.
4.2.3 Wide-Angle X-ray Measurements
Wide angle X-ray diffraction experiments were carried out using a Scintag XDS
2000 powder diffractometer operated at room temperature using a CuKα radiation. The
diffraction pattern was obtained with a step size of 0.04° and a step duration of 10s. In
order to capture the peaks associated with α and γ phases, the measurements were taken
for the 2θ angles of 17° to 21°118.
The materials were prepared by pressing the pellets in a CarverTM hot press with
nitrogen purge between two pieces of KaptonTM. A mold with a circular opening of 25 * Density column was prepared by Chris Fratini
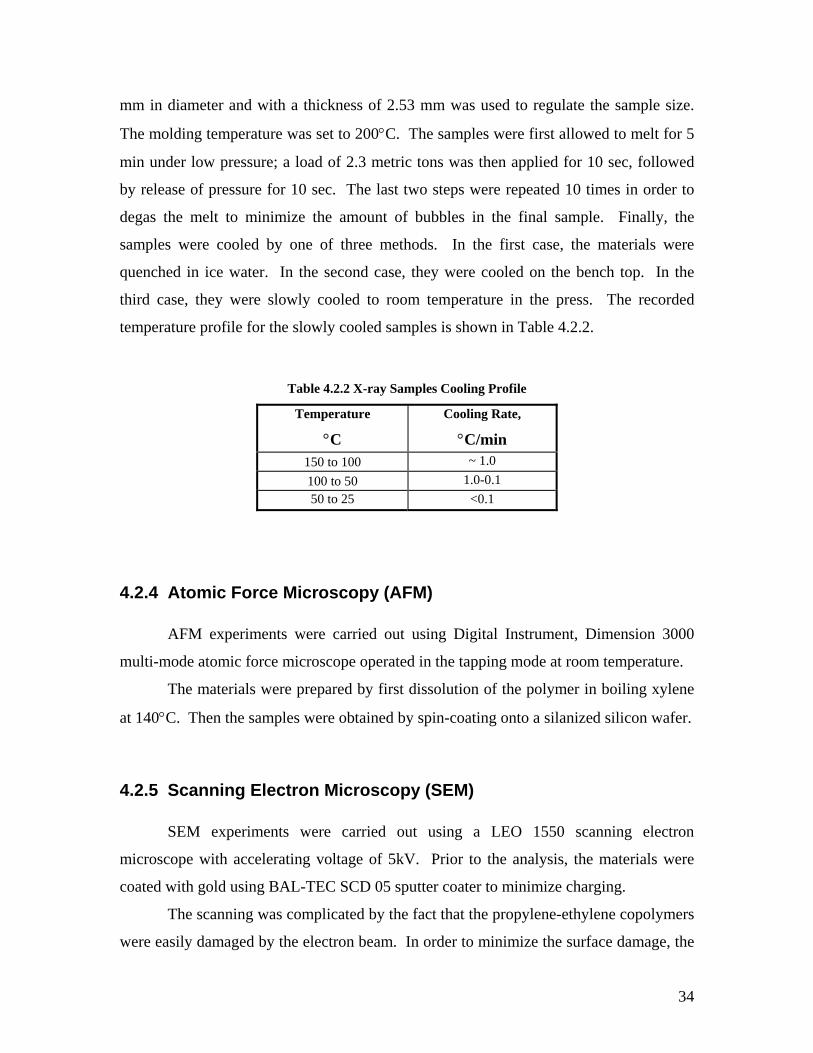
34
mm in diameter and with a thickness of 2.53 mm was used to regulate the sample size.
The molding temperature was set to 200°C. The samples were first allowed to melt for 5
min under low pressure; a load of 2.3 metric tons was then applied for 10 sec, followed
by release of pressure for 10 sec. The last two steps were repeated 10 times in order to
degas the melt to minimize the amount of bubbles in the final sample. Finally, the
samples were cooled by one of three methods. In the first case, the materials were
quenched in ice water. In the second case, they were cooled on the bench top. In the
third case, they were slowly cooled to room temperature in the press. The recorded
temperature profile for the slowly cooled samples is shown in Table 4.2.2.
Table 4.2.2 X-ray Samples Cooling Profile
Temperature
°C
Cooling Rate,
°C/min 150 to 100 ~ 1.0 100 to 50 1.0-0.1 50 to 25 <0.1
4.2.4 Atomic Force Microscopy (AFM)
AFM experiments were carried out using Digital Instrument, Dimension 3000
multi-mode atomic force microscope operated in the tapping mode at room temperature.
The materials were prepared by first dissolution of the polymer in boiling xylene
at 140°C. Then the samples were obtained by spin-coating onto a silanized silicon wafer.
4.2.5 Scanning Electron Microscopy (SEM)
SEM experiments were carried out using a LEO 1550 scanning electron
microscope with accelerating voltage of 5kV. Prior to the analysis, the materials were
coated with gold using BAL-TEC SCD 05 sputter coater to minimize charging.
The scanning was complicated by the fact that the propylene-ethylene copolymers
were easily damaged by the electron beam. In order to minimize the surface damage, the

35
sample sweeping time was kept as small as was possible for obtaining a good quality
image.
The SEM samples were prepared from the films pressed by the same method as
the one outlined in the material preparation section for the isothermal crystallization
studies. Samples of a variety of shapes were then cut out of the films and recrystallized
under nitrogen atmosphere on a glass cover slip in a TC 91/ THMS 600 Linkam hot stage
by melting at 200°C for 2min followed by cooling to room temperature at 1°C/min rate.
In order to obtain the SEM images with better resolution, the first batch of
samples was etched. The etching was carried out in a solution containing 60 ml of
concentrated H2SO4, 0.454g of KMnO4 and 30ml of 85 v/v %H3PO4. The etching
removed some of the amorphous material from the samples; however, it did not
significantly improve the SEM image quality (due to staining by the KMnO4 solution).
As a result, the etching was not used for the other batches of SEM samples. The images
obtained from etched samples will be specified when the SEM results will be presented.

36
5 CALORIMETRY ANALYSIS
5.1 Heat Capacity Calculations A Differential Scanning Calorimeter measures the difference in the heat flow
between the sample pan and the empty reference pan as the temperature changes linearly
with time or under isothermal conditions as time elapses. For the illustration, the raw
sample DSC output for the data collected during cooling of PE-I (0.0, 320) is shown as a
function of temperature and time in Figure 5.1.1 and Figure 5.1.2 respectively.
In order to convert this data into a heat capacity curves, it is necessary to obtain the
heat displacement curves for the sample, the sapphire and the baseline (if the baseline is
not already subtracted from the sample and the sapphire scans). The initial displacement
curves (D’) (shown in Figure 5.1.3 for PP sample) are obtained by fitting the stable part
of the isotherm at both ends of the scan, drawing the displacement baseline (shown in
red) through the red points and finally subtracting the baseline from the sample curve
(Equation 5.1.1, Equation 5.1.2 and Equation 5.1.3).
)('
samplentdisplacemesamplesample BaselineHeatflowD −= Equation 5.1.1
)('
sapphirentdisplacemesapphiresapphire BaselineHeatflowD −= Equation 5.1.2
)(baselinentdisplacemebaselinbaseline BaselineHeatflowD −= Equation 5.1.3
If the sample baseline has been already subtracted by the DSC program, then the
true displacement curve is equal to the initial displacement curve:
'samplesample DD = Equation 5.1.4
'sapphiresapphire DD = Equation 5.1.5

37
-5
0
5
10
15
20
25
30
35
40
-50 0 50 100 150 200T, C
Hea
t Flo
w, m
W
Figure 5.1.1 Raw DSC cooling curve of PE-I (0.0, 320) as a function of temperature
-5
0
5
10
15
20
25
30
35
40
0 5 10 15 20 25 30 35Time, min
Hea
t Flo
w, m
W
Figure 5.1.2 Raw DSC cooling curve of PE-I (0.0, 320) as a function of time
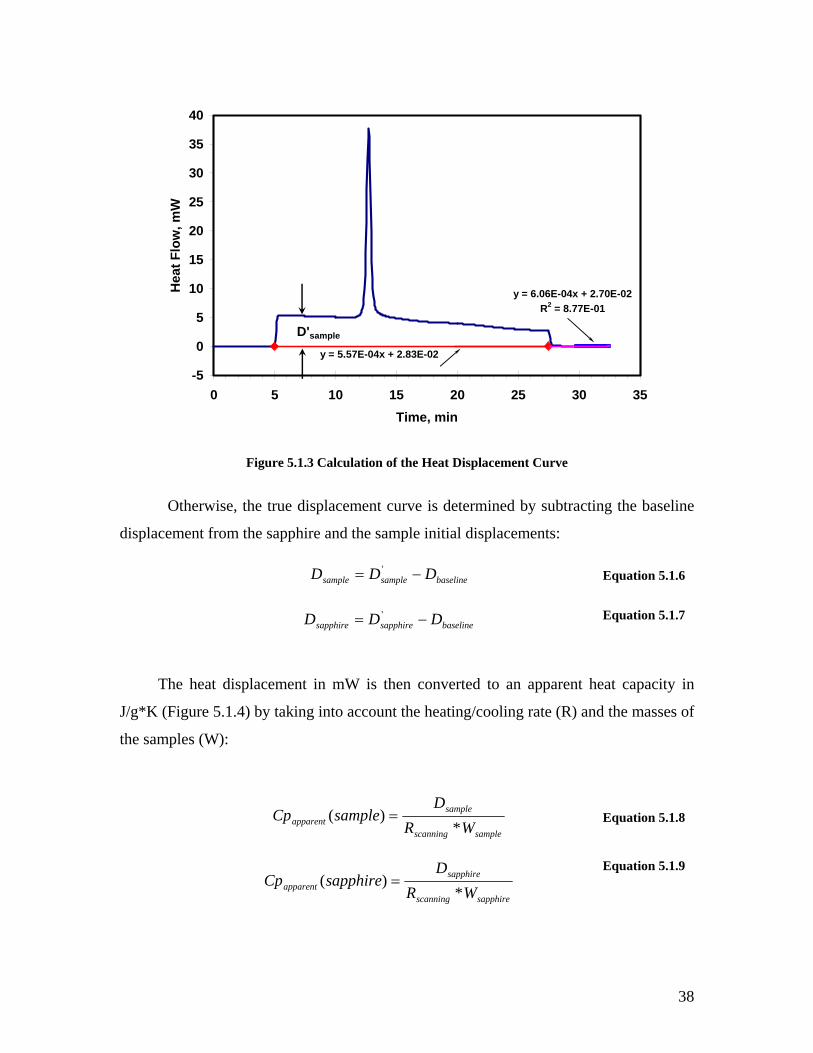
38
y = 6.06E-04x + 2.70E-02R2 = 8.77E-01
y = 5.57E-04x + 2.83E-02
-5
0
5
10
15
20
25
30
35
40
0 5 10 15 20 25 30 35Time, min
Hea
t Flo
w, m
W
D'sample
Figure 5.1.3 Calculation of the Heat Displacement Curve
Otherwise, the true displacement curve is determined by subtracting the baseline
displacement from the sapphire and the sample initial displacements:
baselinesamplesample DDD −= ' Equation 5.1.6
baselinesapphiresapphire DDD −= ' Equation 5.1.7
The heat displacement in mW is then converted to an apparent heat capacity in
J/g*K (Figure 5.1.4) by taking into account the heating/cooling rate (R) and the masses of
the samples (W):
samplescanning
sampleapparent WR
DsampleCp
*)( = Equation 5.1.8
sapphirescanning
sapphireapparent WR
DsapphireCp
*)( =
Equation 5.1.9

39
0
5
10
15
20
25
-50 0 50 100 150 200Temperature, C
Cp,
J/g*
KApparent CpCp
Figure 5.1.4 PP Heat Capacities
0.6
0.7
0.8
0.9
1
1.1
-50 0 50 100 150 200Temperature, C
Cp,
J/g
*K
Cp apparentCp exact
Figure 5.1.5 Sapphire Cp Apparent and Cp Exact

40
The correction factor (Fc) is obtained by dividing the exact heat capacity of
sapphire standard119 by the measured apparent sapphire standard heat capacity (Equation
5.1.10).
)()(
sapphireCpsapphireCp
Fapparent
exactc = Equation 5.1.10
Sapphire standard exact and apparent heat Cp’s as well as Fc are shown in Figure
5.1.5 and Figure 5.1.6 respectively. The heat capacities of the samples are then
calculated by multiplying the apparent heat capacities by the correction factor Fc (Figure
5.1.4):
capparent FsapphireCpsampleCp *)()( = Equation 5.1.11
0.8
0.9
1
1.1
1.2
-50 0 50 100 150 200Temperature, C
F c
Fc=1
Figure 5.1.6 Correction Factor (Fc)

41
5.2 Crystallinity Analysis
Crystallinity measurements are routinely performed in order to characterize and
compare materials as well as predict their properties. There are several methods to
analyze DSC data to find the crystallinity. The easiest and most commonly used
approach is to integrate the area under the crystallization or melting curve to get the
enthalpy and divide it by the thermodynamic heat of fusion (∆Hf0) of a 100% crystalline
material at melting (value generally found in the literature). While this approach is
straight forward and convenient and gives a “back of the envelope” estimate of the degree
of crystallinity, it lacks accuracy. First, it does not take into consideration the
temperature dependence of ∆Hf0, which, on the basis of heat capacity measurements120, is
expected to change for PP from 207 J/g at 188°C to 150 J/g at 0°C. Second, it uses an
arbitrarily drawn heat capacity baseline from an arbitrary temperature at the beginning of
the crystallization or melting curve to an equally arbitrary temperature at the end of that
curve. A more accurate approach117 for determination of crystallinity involves the use of
the true specific heat capacity curve, based on specific heat capacities of fully crystalline
(Cpc) and fully amorphous (Cpliq) PP and considering the temperature dependence of
∆Hf0. This approach assumes a two phase morphological model consisting of amorphous
and crystalline regions. This method is used in this work for crystallinity calculations on
propylene-ethylene copolymers. The values for Cpc, Cpliq and ∆Hf0 are derived using the
empirical rule of mixture for random copolymers from the ATHAS database composed
by Wunderlich.120
In theory, if the correction using the sapphire standard is done correctly and the
Cpliq and Cpc curves are representative of the material behavior in the melt and glass
regions respectively, no further data manipulation is necessary. However, often, when
the measurements are performed using the DSC equipment, there is a mismatch between
the Cpliq and Cpc curves and the measured heat capacity curves. In some cases a complete
match of the glassy and melt baselines can be achieved by simply shifting the
experimental heat capacity curves up or down. In other cases, a choice must be made
between matching the experimental and theoretical heat capacity baselines in the melt or
in the glass region. In this latter case, the remaining unmatched baseline is artificially

42
raised or lowered until the theoretical and experimental baselines coincide. (Note that
uncertainties of about 2-3 % in the baseline heat capacities are expected.) In this work,
when such a mismatch was encountered, the sample heat capacity curves were matched
in the glass region with a Cpc curve and the data points in the melt were raised or lowered
to match a Cpliq curve. The implications of different shifting procedures as well as the
logic behind matching the curves in the glassy region will be discussed in Section 5.3.
An example of two-phase model analysis is shown in Figure 5.2.1. It is assumed
that the specific heat capacity of a material (Cpb) in the absence of thermal transitions lies
between the specific heat capacities of the fully crystalline and the fully amorphous
materials117:
( ) ( ) ( ) ( ) ( )TCTXTCTXTC liqpa
cpc
bp += Equation 5.2.1
with
( ) ( ) 1=+ TXTX ac Equation 5.2.2
where Xc is mass fraction crystallinity. The crystallinity Xc is then calculated at each
small temperature interval by using Cp, ∆Hfo, Cpb, Cpc, and Cpliq. The exact algorithm
involved in this calculation is shown in the Appendix 1.
1
1.5
2
2.5
3
3.5
4
-50 0 50 100 150T, C
Cp,
J/g
*K
0
0.1
0.2
0.3
0.4
0.5
0.6
0.7X
c
CpCpliqCpcrystCpbXc
Figure 5.2.1 Sample Crystallization Analysis Trace of PP

43
According to a two-phase model, the crystallinity values obtained from the area
calculation and from the value of Cp just above Tg (based on its position between Cpc, and
Cpliq) have to be the same (Equation 5.2.3).
( ) ( ) ( ) ( )[ ]dTTCTCTHTHT
mTliqpcpmff ∫ −+∆=∆ 00 Equation 5.2.3
Propylene-ethylene copolymers were analyzed by the method outlined above with
the ∆Hf0 value of 207 J/g taken from the ATHAS database120. It was assumed that the
Cpliq values for the copolymers are the weight average values of the propylene and
ethylene homopolymers. Using the rule of mixture, they were calculated by Equation
5.2.4.
)()1()()(/ TCTCTC PPpliq
PEliqp
EPliqp φφ −+=
Equation 5.2.4
where the P/E denotes propylene-ethylene copolymer, PE – polyethylene, PP –
polypropylene and φ is the weight fraction of ethylene. The assumption of additivity of
homopolymer heat capacities was tested by evaluating the reversible heat capacity of PE-
VII (17.4, 290) using TMDSC (Figure 5.2.2). Since the calculated and measured heat
capacities are in agreement, both in the melt and in the glassy state, this approximation
should be satisfactory for further analysis.
The analysis of P/E (0.0, 330) is shown in Figure 5.2.3. In this sample, the
crystallinity determined from the area calculation is 48% and the crystallinity determined
from the Cp value just above Tg (marked by point A) is 65%. Clearly, this result is in a
direct disagreement with the Equation 5.2.3. Identical problems were encountered
during the analysis of all propylene-ethylene copolymers.
The following sections described two possible approaches for resolution of the
crystallinity mismatch dilemma. Application of these approaches for Dow Chemical
copolymers will be discussed in Chapter 6.

44
1
1.5
2
2.5
3
-100 0 100 200 300Temperature, C
Cp,
J/g*
KCpcrystCpliqCp rev
Figure 5.2.2 Reversible Heat Capacity of PE-VII (17.4, 290)
1
2
3
4
-50 0 50 100 150T, C
Cp,
J/g*
K
0
0.1
0.2
0.3
0.4
0.5
Xc
CpCpliqCpcrystCpbXc
Xc=0.48
Xc=0.65
AB
Figure 5.2.3 Crystallization of P/E (0.0, 330), ∆Hf0 =207 J/g

45
5.2.1 Ethylene Inclusion Analysis
The two-phase model analysis of crystallinity outlined in the previous section
does not specifically address the issue of copolymer inclusion and exclusion from the
crystal. The thermodynamic constants used to calculate the thermal properties of the
propylene-ethylene copolymer crystals were the equilibrium polypropylene
thermodynamic heat of fusion ∆Hf0 at melting temperature Tm
0 for pure polypropylene.
The Sanchez-Eby kinetic theory of random copolymers34,35, discussed in Section
2.3, allows for the incorporation of comonomer units into the crystal. It also shows that
as a result of such incorporation the equilibrium melting temperature and the
thermodynamic heat of fusion of the equilibrium copolymer crystal decrease.
The following analysis assumes that as a result of defect incorporation, either in
the form of copolymer units or of regio and stereo errors, the resulting crystal
thermodynamic heat of fusion decreases. The validity of this analysis will be discussed
in Chapter 6.
If the thermodynamic heat of fusion depression assumption is accepted, the
mismatch in crystallinity between the ∆H and the Cp calculation can be explained by an
overestimation in the ∆Hf0 values. Use of an unreasonably high thermodynamic heat of
fusion leads to the underestimation of the crystalline phase contribution to the overall
specific heat capacity. As a result, the baseline Cpb is too large and the crystallinity
determined by ∆H calculations is lower than determined from the baseline heat capacity.
If the P/E (0.0, 330) polymer is analyzed with the lower ∆Hf0 of 165 J/g, an
excellent consistency in the degrees of crystallinity from two calculations is observed
(Figure 5.2.4).
In this analysis values of thermodynamic heat of fusion lower than 207 J/g ∆Hf0
were used in the crystallinity calculations of all propylene-ethylene copolymers. ∆Hf0
values were found iteratively by matching crystallinities obtained from the area
calculation and from the magnitude of Cp just above Tg.

46
1
1.5
2
2.5
3
3.5
4
-50 0 50 100 150T, C
Cp,
J/g
*K
0
0.1
0.2
0.3
0.4
0.5
0.6
0.7
Xc
CpCpliqCpcrystCpbXc
Xc=0.65
Xc=0.65
Figure 5.2.4 Crystallization of P/E (0.0, 330), ∆Hf0 =165 J/g
5.2.2 RAF Based Analysis
The second analysis is based on the three-phase model that considers the
contribution from the rigid amorphous heat capacity (RAF) to the overall heat capacity.
The concept of RAF was developed by Wunderlich89,91,92 and has been discussed in
Section 2.5.2.
This analysis utilizes the same treatment of the crystallinity as was used in the
polypropylene study by Grebowicz et al.91 (Section 2.5.2). The mismatch in the
crystallinity between ∆H and the Cp (Tg ) calculations in Figure 5.2.3 is attributed to the
presence of a RAF.
In this case, the thermodynamic heat of fusion of the equilibrium propylene-
ethylene crystal is assumed to be the same as it was for the equilibrium propylene crystal.
It is assumed that the measured heat capacity is underestimated due to the presence of a
RAF. If a RAF were not there, the point A in Figure 5.2.3 would be moved to a point B
resulting in the 48 % crystallinity calculated at Cp (Tg ). As a result, the crystallinity from

47
∆H and the Cp (Tg ) calculations would match. The crystallinity is obtained from the area
calculations and both amorphous and rigid fractions are calculated using Equation 2.5.5.
The applicability of this analysis to Dow propylene-ethylene copolymers will be
discussed in Chapter 6.
5.3 Uncertainty Analysis
In this section the uncertainty in the thermodynamic heat of fusion calculations due
to different procedures of matching the Cpliq and Cpc curves and the measured heat
capacity curves will be discussed.
Two possible sources of uncertainty have been identified, namely the experimental
error due to the instrument limitations and the error in the theoretical Cpliq and Cpc curves
themselves.
It is generally accepted that TA Q1000 DSC is capable of measuring accurate heat
capacities in the glassy region.121 The possible inaccuracies of the melt region
measurements can then be corrected by subsequent sapphire correction summarized in
Section 5.1. Since in our case the mismatch between the measured and theoretical heat
capacity curves for some samples is still present after sapphire calibration, this correction
is not sufficient. In light of this, in order to use the theoretical Cpliq and Cpc curves in
crystallinity calculations, the measured Cp is matched in the low temperature region by
shifting Cp curves up or down. The remaining deviation from the Cpliq curve in the melt
for both cooling and melting traces is demonstrated in Figure 5.3.1. Most of the
differences between the measured and the theoretical melt heat capacities fall within 2%
of the theoretical values. This deviation is corrected in the final step by raising or
lowering the experimental data points corresponding to the melt region prior to the
transition onset until they match with the Cpliq (Figure 5.3.2) (Method 1).

48
-0.1
-0.08
-0.06
-0.04
-0.02
0
0.02
0.04
0.06
0.08
0.1
0 5 10 15 20 25
Ethylene content, mol %
Cp
devi
atio
n, J
/g*K
MeltingCrystallizationCpliq Deviation
2% Deviation
1% Deviation
1% Deviation
2% Deviation
3% Deviation
3% Deviation
Figure 5.3.1 Deviation of Cp from the Cpliq in the Melt
0.5
1.5
2.5
3.5
-100 -50 0 50 100 150 200Temperature, C
Cp,
J/g*
K
Cp crystCpliq CpShifted CpCorrected Cp
Figure 5.3.2 PE-III (12.3, 310) Cp Corrections
The theoretical Cpliq curves for the copolymers were calculated based on the
weight average values of the propylene and ethylene homopolymers. While the rule of
mixture assumption was tested using reversible heat capacity measurements for PE-VII
(17.4, 290), the calculated amorphous and crystalline heat capacity curves might not be

49
representative of the real copolymer system. In this case the possible solution to the
mismatch problem would be first matching the measured Cp curves either in melt or in
the glass and then raising or lowering the theoretical Cpliq or Cpc curves respectively until
the agreement between the curves both in the melt and in the glass is achieved (Method 2
and 3).
In order to estimate the uncertainty on the calculated thermodynamic heat of
fusion, the crystallinity for several materials was determined by all three possible
matching scenarios. In addition, the analysis in which the curves were matched only in
the glass without any further data manipulation was added to the uncertainty calculations
(Method 4). The results are demonstrated in Figure 5.3.3 and Table 5.3.1. The line in the
Figure 5.3.3 corresponds to the linear fit through ∆Hf0 values calculated from the
crystallization data. These results suggest that the uncertainty is due to errors in both,
instrumental limitations and theoretical Cpliq or Cpc curves. These conclusions will be
important in Chapter 6, when the accuracy of the theoretical heat of fusion calculations
will be discussed.
80
100
120
140
160
180
-1 4 9 14 19Ethylene Content, mol%
∆H
f0 , J/g
Ave CrystallizationAve MeltingMethod 1 CrystallizationMethod 1 Melting
Figure 5.3.3 Heat of Fusion Uncertainty Analysis

50
Table 5.3.1 Heat of Fusion Uncertainty Analysis
Sample Name Melting
∆Hf0, J/g
Crystallization
∆Hf0, J/g
PE-I (0.0, 320) 159.2 ± 9.8 163.0 ± 9.1 PE-III (7.8, 160) 139.5 ± 1.7 138.5 ± 1.7
PE-III (12.3, 310) 138.0 ± 12.6 144.5 ± 9.0 PE-III (15.0, 120) 130.0 ± 0.0* 125.0 ± 0.0* PE-VI (18.0, 320) 112.5 ± 17.6 117.6 ± 13.3
* In this case the perfect match between the experimental and theoretical heat capacity curves was obtained without any data manipulation
5.4 Tg Determination Thermodynamically, the glass transition is a pseudo-second order transition and,
consequently, is marked by a step in the specific heat capacity curve. Five distinct
temperature regions of the glass transition were described by Cheng et al.92 and are
demonstrated in Figure 5.4.1.
TTg
Glass
Liquid
Tb
TeT2
T1
∆Cp
TTg
Glass
Liquid
Tb
TeT2
T1
∆Cp
Figure 5.4.1 Schematic DSC Trace in the Glass Transition Region
Tb and Te temperatures correspond to the first deviation from either the crystalline
or the amorphous heat capacity curves on both sides of the transition. The temperatures
T1 and T2 mark the beginning and the end of the major part of the transition and are used

51
in the calculations of the glass transition breadth. The glass transition temperature Tg
corresponding to the half-devitrification, as judged by the heat capacity step increase.
In order to determine the ∆Cp change at Tg in this work, the glass and the liquid
heat capacities adjacent to the glass transition onset were fitted by a linear fit. ∆Cp was
then calculated by subtracting the values of the fit at the temperature corresponding to Tg.
5.5 Melting and Crystallization Temperatures
In this work, the concepts of the melting peak, onset and offset temperatures and
crystallization peak, onset and offset temperatures will be used to describe the melting
and the crystallization behavior of Dow copolymer system. Ordinarily, it is sufficient to
define only the peak transition temperatures. However, as will be demonstrated in the
next chapters, these propylene-ethylene copolymers have broad crystallization and
melting transitions and the introduction of the onset and the offset concepts thus becomes
necessary.
The typical melting curve is demonstrated in Figure 5.5.1. The melting
temperature Tm is defined at the peak of the melting endotherm at point 2. The melting
onset temperature is defined at point 1. Point 1 corresponds to the intersection of the
extended baseline and the extended slope of the left side of the melting curve. Similarly,
the melting offset temperature is defined at point 3. Point 3 corresponds to the
intersection of the extended baseline and the extended slope of the right side of the
melting curve. The crystallization temperature, Tx is defined at the peak of the
crystallization curve. The onset and the offset crystallization temperatures are defined
similarly to those for the melting temperatures, except that point 1 on the curve would
correspond to the crystallization offset and point 3 would correspond to the crystallization
onset.

52
TonsetToffsetTm
1 3
2
TTonsetToffsetTm
1 3
2
T
Figure 5.5.1 Schematic DSC Trace in the Melting Region
5.6 Kinetics of Isothermal Crystallization
The DSC data recorded during isothermal crystallization can provide information
about the crystallization kinetics. In our case, as it will be discussed in Chapter 6, two
melting peaks are observed during heating following the isothermal crystallization, which
correspond to the two distinct crystal populations.
The rate of shift of the melting temperature B(Tx) for low and high endotherms
defined by Equation 5.6.1 can be calculated from the slope of the melting temperature
Tm as a function of logarithm of time plot.
)log()()( xxxxm tTBTATT ++= Equation 5.6.1
The deconvolution of the low and high endotherms was accomplished by drawing a
vertical line at the lowest point of the valley between the corresponding peaks.

53
6 ANALYSIS OF DOW PROPYLENE-ETHYLENE COPOLYMERS
6.1 Results
In this section the results of the studies of bulk propylene-ethylene copolymers
properties will be presented. First, the results of crystallization and melting behavior
studies of Dow, Ziegler-Natta and Metallocene copolymers will be given. Then the
results of the crystallinity and the thermodynamic heat of fusion calculations will be
shown for both inclusion and RAF models. Finally, the results of the morphology
studies of Dow materials will be presented.
6.1.1 Crystallization and Melting Studies
The apparent heat capacities during crystallization and melting for different series
of copolymers were calculated from the DSC data by the method outlined in section 5.1
and are shown in Figure 6.1.1 and Figure 6.1.2. There is a steady decrease in the peak
crystallization and melting temperatures with an increase in the ethylene content in all
sets of data as demonstrated in Figure 6.1.3. The peak crystallization and melting
temperatures of Dow Chemical copolymers follow the same linear trends throughout all
series. The rate of decrease in the peak crystallization temperature is comparable with
the rate of decrease in the peak melting temperature as judged by the slopes of the linear
fits of two sets of data. The differences between samples from different series of Dow
copolymers are evident when the materials of about the same composition are compared
in Figure 6.1.5 and the results, demonstrated in Figure 6.1.6 and Figure 6.1.7, are
examined. While the crystallization peak onsets follow the same linear decrease with
increase in ethylene content for the copolymers of all series, the melting offsets do not.
The change in the melting offsets with ethylene content for series I-III is similar to the
change in the crystallization onsets. However, series VII and VIII demonstrate different
trends. The change in the melting offsets is significantly lower than for series I-III,

54
a)
0
2
4
6
8
10
12
-50 0 50 100 150 200Temperature,C
Cp,
J/g*
K
P/E I(0.0, 320)P/E II(4.4, 320)P/E III(7.8, 160)P/E I(8.2, 300)P/E III(12.3, 310)P/E III(12.4, 160)P/E I(13.6, 290)P/E III(14.8, 160)P/E I(15.7, 260)P/E I(19.4, 260)
b)
0
2
4
6
8
10
12
-50 0 50 100 150 200Temperature,C
Cp,
J/g*
K
P/E VII(3.3, 230)P/E VII(5.4, 160)P/E VII(6.7, 330)P/E VII(7.0, 170)P/E VII(12.3, 300)P/E VII(12.8, 150)P/E VII(16.6, 150)P/E VII(17.4, 290)P/E VII(21.2, 280)
c)
0
2
4
6
8
10
12
-50 0 50 100 150 200Temperature,C
Cp,
J/g*
K
P/E VIII(4.8, 310)P/E VIII(7.8, 220)P/E VIII(13.3, 290)P/E VI(18.0, 320)
Figure 6.1.1 DSC Crystallization Traces of Dow Copolymers: a) Series I-III, b) Series VII, c) Series
VI and VIII
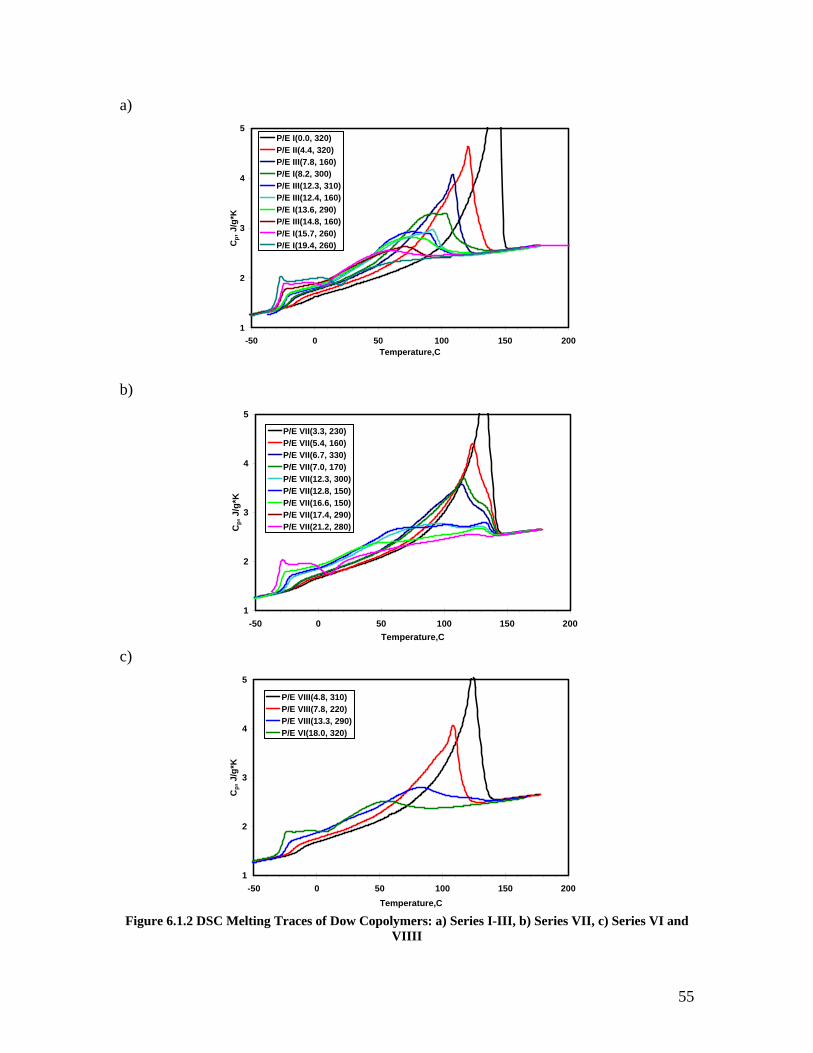
55
a)
1
2
3
4
5
-50 0 50 100 150 200Temperature,C
Cp,
J/g
*K
P/E I(0.0, 320)P/E II(4.4, 320)P/E III(7.8, 160)P/E I(8.2, 300)P/E III(12.3, 310)P/E III(12.4, 160)P/E I(13.6, 290)P/E III(14.8, 160)P/E I(15.7, 260)P/E I(19.4, 260)
b)
1
2
3
4
5
-50 0 50 100 150 200Temperature,C
Cp,
J/g*
K
P/E VII(3.3, 230)P/E VII(5.4, 160)P/E VII(6.7, 330)P/E VII(7.0, 170)P/E VII(12.3, 300)P/E VII(12.8, 150)P/E VII(16.6, 150)P/E VII(17.4, 290)P/E VII(21.2, 280)
c)
1
2
3
4
5
-50 0 50 100 150 200Temperature,C
Cp,
J/g*
K
P/E VIII(4.8, 310)P/E VIII(7.8, 220)P/E VIII(13.3, 290)P/E VI(18.0, 320)
Figure 6.1.2 DSC Melting Traces of Dow Copolymers: a) Series I-III, b) Series VII, c) Series VI and
VIIII

56
Tc = -5.04XE + 107.19R2 = 0.92
Tm = -5.12XE + 145.68R2 = 0.92
0
20
40
60
80
100
120
140
160
0 5 10 15 20 25Ethylene content, mol%
Tem
pera
ture
, CTc (Series I-III)Tc (Series VII)Tc (Series VIII)Tm (Series I-III)Tm (Series VII)Tm (Series VIII)
Figure 6.1.3 Crystallization and Melting Peak Temperatures of Dow Copolymers as a Function of
Ethylene Content
Tm (low) = -5.12XE + 145.68R2 = 0.92
Tm(high) = -0.81XE + 138.03R2 = 0.87
0
20
40
60
80
100
120
140
160
0 5 10 15 20 25Ethylene content, mol%
Tem
pera
ture
, C
Tm (low) (Series I-III)Tm (low) (Series VII)Tm (low) (Series VIII)Tm (high) (Series VII)
Figure 6.1.4 Low and High Melting Endotherms (Dow Copolymers) as a Function of Ethylene
Content

57
a)
0
2
4
6
8
10
12
0 20 40 60 80 100 120 140Temperature,C
Cp,
J/g*
K
P/E II(4.4, 320)P/E VII(5.4, 160)P/E VIII(4.8, 310)
b)
1
2
3
4
5
6
-50 0 50 100 150 200Temperature,C
Cp,
J/g*
K
P/E II(4.4, 320)P/E VII(5.4, 160)P/E VIII(4.8, 310)
Figure 6.1.5 Comparison of Dow Copolymers a) DSC Crystallization Traces, b) DSC Melting Traces

58
T (onset cryst) = -4.37XE + 114.44R2 = 0.92
T(offset melt) = -3.61XE + 153.65R2 = 0.95
0
20
40
60
80
100
120
140
160
180
0 5 10 15 20 25Ethylene content, mol%
Tem
pera
ture
, C
cryst (Series I-III)cryst (Series VII)cryst (Series VIII)melt (Series I-III)
Figure 6.1.6 Crystallization Onset and Melt Offset Temperatures for Dow copolymers as a Function
of Composition
y = -0.49x + 145.03
y = -3.61x + 153.65
y = -0.76x + 142.83
60
70
80
90
100
110
120
130
140
150
160
0 5 10 15 20 25Ethylene content, mol%
Mel
t Offs
et, C
Series I-IIISeries VIISeries VIII
Figure 6.1.7 Melt Offset Temperatures for Dow copolymers as a Function of Composition

59
especially in the case of the series VII copolymers. There is also a high temperature
endotherm present in the melting traces of series VII copolymers that is not found in
other series (Figure 6.1.4). The high temperature endotherm melting peaks of series VII
show a very weak dependence on the ethylene content.
The shapes of the crystallization and melting curves of series I-III, VII and VII
are also quite different (Figure 6.1.5). While the crystallization exotherms for series I-III
are sharp, the corresponding curves for series VII and VIII are much broader.
The glass transition temperatures and crystallinities of Dow Chemical copolymers
are shown in Figure 6.1.8. The degrees of crystallinity were calculated just above the
glass transition temperature using the inclusion model. Both, the glass transition
temperature and crystallinity, decrease with increase in the ethylene concentration. The
linear dependence of both the glass transition temperatures and crystallinities on the
ethylene content is found for the copolymers of all series for up to 8.2 mol% of ethylene.
The deviation from the linear behavior occurs for the copolymers of higher ethylene
concentration.
-55
-45
-35
-25
-15
-5
0 5 10 15 20 25Ethylene mol %
Tg, C
0
0.2
0.4
0.6
0.8
1
Xc
Tg Series I-IIIITg Series VIITg Series VIII Xc Series I-IIIXc Series VIIXc Series VIII
Figure 6.1.8 Glass Transition Temperatures and Crystallinity of Dow Copolymers as a Function of
Composition

60
The apparent heat capacities during crystallization and melting of Ziegler-Natta
and Metallocene copolymers are shown in Figure 6.1.9 and Figure 6.1.10. As
demonstrated in Figure 6.1.12, Figure 6.1.13, Figure 6.1.14, the peak crystallization and
melting temperatures, as well as the crystallization onsets for Metallocene copolymers
follow exactly the same trends as the Dow copolymers. The corresponding temperatures
for Ziegler-Natta materials are higher than those for Dow copolymers but they also
decrease with an increase in the ethylene content. The change in the melting offset with
ethylene content for Ziegler-Natta and Metallocene copolymers is shown in Figure
6.1.15. While it is almost the same for Metallocene and Dow series I-III copolymers, the
change in the melt offset for Ziegler-Natta materials is lower and falls between the
changes of Metallocenes and series I-III on one extreme and series VII and VIII on the
other extreme.
The glass transition temperatures of both Ziegler-Natta and Metallocene
copolymers fit exactly the same line of decrease as do the Dow copolymer Tgs (Figure
6.1.17). For the sake of comparing Dow copolymers with Metallocene and Ziegler-Natta
materials, the degrees of crystallinity were calculated just above the glass transition
temperature using the inclusion model. The crystallinities of Ziegler-Natta copolymers
are slightly higher than those of the corresponding Dow materials (Figure 6.1.16);
however the difference between the data sets might not be significant. The same can be
said about the Metallocene crystallinities. While the crystallinities of lower ethylene
content Metallocene copolymers lie precisely on the fit line for the Dow copolymers, the
values for higher ethylene content Metallocenes are somewhat higher.
The shapes of the crystallization and melting heat capacity curves for Dow,
Ziegler-Natta and Metallocene copolymers of about the same concentration are compared
in Figure 6.1.11. Both crystallization curves of the Ziegler-Natta and Metallocene
copolymers are narrow and tall and are similar to those of the series I-III Dow
copolymers. The melting Ziegler-Natta peaks are significantly taller than the
corresponding Dow materials peak. The melting peaks of the low ethylene concentration
Metallocene samples are only slightly higher than those of the Dow copolymers; however
as ethylene concentration increases, the difference between the peaks becomes

61
significant. At high ethylene concentration, the melting endotherms of Dow copolymers
are broader than those for Metallocenes.
a)
0
2
4
6
8
10
12
-50 0 50 100 150 200Temperature,C
Cp,
J/g*
K Z-N P/E 4.4Z-N P/E 8.3
b)
0
2
4
6
8
10
12
-50 0 50 100 150 200Temperature,C
Cp,
J/g*
K
Met P/E 5.2Met P/E 6.5Met P/E 11.1Met P/E 13.5
Figure 6.1.9 DSC Crystallization Traces of P/E Copolymers: a) Ziegler-Natta, b) Metallocene

62
a)
1
2
3
4
5
-50 0 50 100 150 200Temperature,C
Cp,
J/g*
KZ-N P/E 4.4Z-N P/E 8.3
b)
1
2
3
4
5
-50 0 50 100 150 200Temperature,C
Cp,
J/g*
K
Met P/E 5.2Met P/E 6.5Met P/E 11.1Met P/E 13.5
Figure 6.1.10 DSC Melting Traces of P/E Copolymers: a) Ziegler-Natta, b) Metallocene

63
a)
0
2
4
6
8
10
12
-50 0 50 100 150 200Temperature,C
Cp,
J/g*
K
P/E II(4.4, 320)P/E VII(5.4, 160)P/E VIII(4.8, 310)Z-N P/E 4.4Met P/E 4.4
b)
1
3
5
7
-50 0 50 100 150 200Temperature,C
Cp,
J/g*
K
P/E II(4.4, 320)P/E VII(5.4, 160)P/E VIII(4.8, 310)Z-N P/E 4.4Met P/E 4.4
c)
1
2
3
4
-50 0 50 100 150 200Temperature,C
Cp,
J/g*
K
P/E I(13.6, 290)P/E VII(12.8, 150)P/E VIII(13.3, 290)Met P/E 13.5
Figure 6.1.11 Comparison of Dow, Ziegler-Natta and Metallocene Copolymers: DSC Traces a)
Crystallization, b) Melting (4.4-5.4mol% Ethylene), c) Melting (12.8-13.6mol% Ethylene)

64
Tc(Dow) = -5.04XE+ 107.19R2 = 0.92
0
20
40
60
80
100
120
0 5 10 15 20 25Ethylene content, mol%
Peak
Cry
stal
lizat
ion
Tem
pera
ture
, C Dow CopolymersZiegler-NattaMetallocenes
Figure 6.1.12 Crystallization Temperatures of Copolymers as a Function of Composition
Tm(Dow) = -5.12XE + 145.68R2 = 0.92
0
20
40
60
80
100
120
140
160
0 5 10 15 20 25Ethylene content, mol%
Peak
Mel
ting
Tem
pera
ture
, C
Dow CopolymersZiegler-NattaMetallocenes
Figure 6.1.13 Melting Temperatures of Copolymers as a Function of Composition

65
T(onset cryst Dow)= -4.37XE + 114.44R2 = 0.92
0
20
40
60
80
100
120
140
0 5 10 15 20 25Ethylene content, mol%
Cry
stal
lizat
ion
Ons
et, C
Dow CopolymersZiegler-NattaMetallocenes
Figure 6.1.14 Crystallization Onset Temperatures of P/E Copolymers as a Function of Composition
y = -0.49x + 145.03
y = -3.61x + 153.65
y = -0.76x + 142.83
y = -1.65x + 160.61
y = -3.27x + 152.05
80
90
100
110
120
130
140
150
160
0 5 10 15 20 25Ethylene content, mol%
Mel
t Offs
et, C
Series I-IIISeries VIISeries VIIIZiegler-NattaMetallocene
Figure 6.1.15 Melt Offset Temperatures of P/E Copolymers as a Function of Composition

66
0
0.2
0.4
0.6
0.8
0 5 10 15 20 25Ethylene content, mol%
X c
Dow CopolymersZiegler-NattaMetallocene
Figure 6.1.16 Crystallinity of P/E Copolymers as a Function of Composition
-35
-30
-25
-20
-15
-10
-5
0
0 5 10 15 20 25Ethylene mol %
T g, C
Dow CopolymersZiegler-NattaMetallocene
Figure 6.1.17 Glass Transition Temperatures of P/E Copolymers as a Function of Composition

67
6.1.2 Crystallinity and Thermodynamic Heat of Fusion
The dependence of the thermodynamic heat of fusion on the ethylene content was
calculated from the cooling traces by the method outlined in Section 5.2.1 and is shown
in Figure 6.1.18 for the crystallization data. Within the experimental error there is a
steady linear decrease in the ∆Hf0 values with an increase in the ethylene content. The
thermodynamic heat of fusion values calculated from both crystallization and melting
data are presented in Figure 6.1.19 together with a 10% deviation lines for the
crystallization data set. The deviation boundary was chosen based on the results of the
uncertainty analysis presented in Section 5.3. The figure of 10% was calculated by
averaging the largest uncertainties in ∆Hf0 values given in Table 5.3.1. Most of the
calculated values for both melting and crystallization are within the boundaries of the
deviation. The thermodynamic heat of fusion values calculated from the melting data are
somewhat lower than those obtained from the crystallization data; however considering
the possible 10% error in the thermodynamic heat of fusion values, the difference
between two data sets is not significant. The scatter in the data becomes more substantial
as the ethylene content increases.
Since the inclusion theory based on the Sanchez-Eby kinetic theory assumes that
the ethylene is at least partially included in a propylene crystal, it is important to test this
assumption. The evidence of the ethylene inclusion would be the dependence of the
normalized thermodynamic heat of fusion on the ethylene content. The ∆Hf0 values
were normalized with respect to the mass of polypropylene units in the crystal. The
dependence of the normalized thermodynamic heat of fusion at melting on the ethylene
content, calculated from the data presented in Figure 6.1.18 is shown in Figure 6.1.20.
There is a linear decrease in the normalized ∆Hf0 values with an increase in the ethylene
concentration.
Next several data sets will examine the inclusion and RAF models in the context
of the heat of fusion, crystallinity and density calculations. The validity and implications
of these results will be discussed in Section 6.2.2.
The normalized experimental enthalpy of fusion is shown for both the RAF and
the inclusion model in Figure 6.1.21. The enthalpy of fusion for the inclusion model was

68
∆Hf0 = -2.76XE + 165.29
R2 = 0.81
60
80
100
120
140
160
180
0 5 10 15 20 25Ethylene content
∆H
f0 , J/g
Series I-IIISeries VIISeries VIII
Figure 6.1.18 Dependence of the Thermodynamic Heat of Fusion on the Ethylene Content
y = -2.76x + 165.29R2 = 0.81
y = -2.51x + 160.56R2 = 0.67
60
80
100
120
140
160
180
200
0 5 10 15 20 25Ethylene mol %
∆H
, J/g
CrystallizationMelting10% Deviation
Figure 6.1.19 Dependence of the Thermodynamic Heat of Fusion on the Ethylene Content
(Crystallization and Melting)

69
∆Hf0 = -1.83XE + 165.94
R2 = 0.60
60
80
100
120
140
160
180
0 5 10 15 20Ethylene mol %
Nor
mal
ized
∆H
f0 , J/g
PP
Figure 6.1.20 Normalized ∆Hf
0 as a Function of Composition
∆Hf(inclusion) = -4.63XE + 95.97R2 = 0.97
∆Hf(RAF) = -4.47XE + 90.48R2 = 0.97
0
20
40
60
80
100
120
0 5 10 15 20Ethylene mol%
Nor
mal
ized
∆H
f, J/
g PP
Inclusion ModelRAF Model
Figure 6.1.21 Normalized ∆Hf for Inclusion and RAF Models as a Function of Composition

70
calculated using the ∆Hf0 values obtained from Figure 6.1.18. The enthalpy of fusion for
the RAF model was calculated using the ∆Hf0 values of 207 J/g from the ATHAS
database. There is a linear decrease in the normalized enthalpy with an increase in the
ethylene concentration for both inclusion and RAF models. However, the normalized
∆Hf values for RAF model are slightly lower than those for the inclusion model.
The crystallinities calculated from the DSC data for inclusion and RAF models
are compared in Figure 6.1.22. There is a steady decrease in the crystallinity with an
increase in the ethylene concentration for both sets of data. However, the RAF
crystallinity values are significantly lower, especially in the low ethylene content region.
The amorphous and semicrystalline ∆Cps as a function of ethylene content are
plotted in Figure 6.1.23. The amorphous ∆Cp was calculated using the theoretical
amorphous and crystalline heat capacities at Tg. The semicrystalline ∆Cp was calculated
from the experimental data by the method outlined in Section 5.4. As expected, at high
ethylene content, corresponding to negligible crystallinity values, the semicrystalline ∆Cp
overlaps with the amorphous ∆Cp.
In order to evaluate the validity of the RAF model, the XRAF and XMAF, calculated
using the amorphous and semicrystalline ∆Cps from Figure 6.1.23 by the method outlined
in Section 2.5.2 and 5.2.2, are plotted as a function of crystallinity (Figure 6.1.24). The
crystallinity in this case was calculated using ∆Hf0=207 J/g. The content of rigid
amorphous fraction increases with an increase in the crystallinity, while the content of the
mobile amorphous fraction decreases.
In order to obtain an estimation of the degree of crystallinity independent from the
DSC measurements, the densities of these copolymers were measured and analyzed using
Equation 2.5.4. The amorphous density, ρa, used in the computations was 0.8530
g/cm3;122 however, the choice of crystal density, ρc, was not as clear. Two sets of density
base crystallinities were calculated using the unit cell volumes reported by Isasi et al.123
(for polypropylene with regio- and stereo- defects, V=0.9125nm3), and by Laihonen et
al.42 (for polypropylene, V=0.896nm3, and propylene-ethylene copolymer, V=0.912 nm3).

71
0
0.2
0.4
0.6
0.8
0 5 10 15 20 25Ethylene content, mol%
X c
Inclusion ModelRAF Model
Figure 6.1.22 Crystallinity from Inclusion and RAF Models as a Function of Composition
0
0.1
0.2
0.3
0.4
0.5
0.6
0 5 10 15 20 25Ethylene mol %
∆C
P, J
/g*K
0
0.1
0.2
0.3
0.4
0.5
X RA
FDelta Cp (am)Delta Cp (semicryst)XRAF
Figure 6.1.23 Heat Capacity Change at Tg and Rigid Amorphous Fraction as a Function of Ethylene
Content

72
a)
0
0.1
0.2
0.3
0.4
0.5
0 0.1 0.2 0.3 0.4 0.5 0.6Xc
X RA
F
b)
0
0.2
0.4
0.6
0.8
1
0 0.1 0.2 0.3 0.4 0.5 0.6Xc
X MA
F
Figure 6.1.24 XRAF and XMAF as a Function of Crystallinity

73
The crystal densities corresponding to these unit cells are ρc=0.919 g/cm3 (Alamo unit
cell), ρc(PP)=0.934 g/cm3 and ρc(PE)=0.9194 g/cm3 (Laihonen unit cell). The crystal
densities of the propylene-ethylene copolymers were further reduced by considering the
effect of morphological partitioning of ethylene defects. Based on the study by Alamo et
al.50, it was assumed that 42% of ethylene units are included in the polypropylene crystal,
independent of the overall copolymer composition. Hence, the unit cell masses must be
accordingly corrected.
The results of the crystallinity calculations based on both Alamo and Laihonen
unit cells together with the DSC crystallinity values for the RAF and inclusion models are
presented in Figure 6.1.25 and Figure 6.1.26, respectively. The density crystallinities
from Alamo and Laihonen unit cells are extremely close, except for pure polypropylene.
The density crystallinities are slightly higher than those from the DSC inclusion model
for low ethylene content copolymers. The disparity between these data sets becomes
more pronounced as the ethylene concentration increases. The RAF crystallinity values
are significantly lower than the density crystallinity through the whole ethylene
concentration range.
As the inclusion model crystallinities, calculated from ∆Cp (Tg) and from Cpb(just
above Tg) were compared, it was discovered that the materials evaluated by the inclusion
model might have ∆Cp deficiency that can be, at first, attributed to RAF. As
demonstrated in Figure 6.1.27a), the amount of this “rigid amorphous fraction” is
significantly lower than predicted by the RAF model. It ranges between 8% and 15% for
the copolymers with the 0-8 ethylene mol% and then decreases to 0% RAF. When
evaluated as a function of crystallinity (Figure 6.1.27b), the copolymers with the Xc
values of under 0.3 have the “RAF” below 0.05. However, as will be discussed in section
6.2.2, this supposed ∆Cp deficiency is not in fact an indication of the RAF presence.
Finally, the rigid amorphous fraction for the RAF models was included in the
density calculations. Since the RAF density is unknown, the two extremes were
considered. In the first case, it was assumed that the rigid amorphous fraction density is
equal to the mobile amorphous fraction density of 0.853 g/cm3. In the second case, it was

74
0
0.2
0.4
0.6
0.8
1
0 5 10 15 20 25Ethylene mol %
Xc
DSC Inclusion ModelDSC RAF ModelDensity
Figure 6.1.25 Xc by Density (Alamo Unit Cell) and DSC (RAF and Inclusion Model) as a Function of Composition
0
0.2
0.4
0.6
0.8
1
0 5 10 15 20 25Ethylene mol %
Xc
DSC Inclusion ModelDSC RAF ModelDensity
Figure 6.1.26 Xc by Density (Laihonen Unit Cell) and DSC (RAF and Inclusion Model) as a Function
of Composition
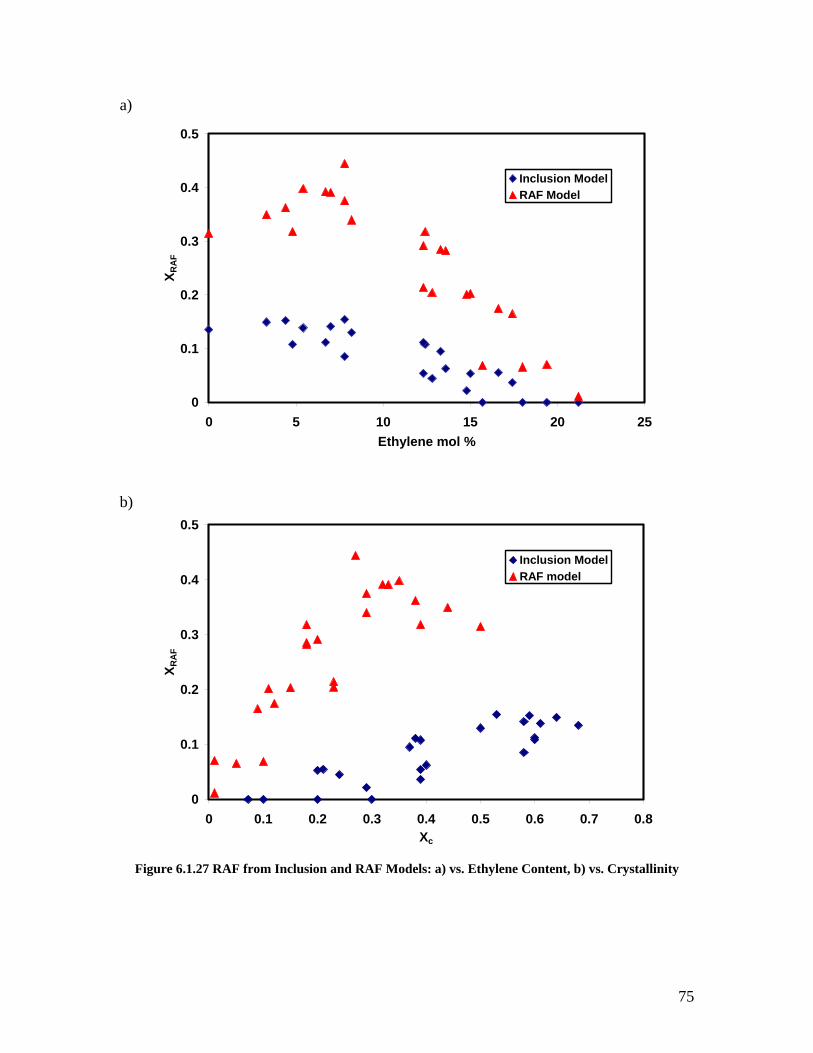
75
a)
0
0.1
0.2
0.3
0.4
0.5
0 5 10 15 20 25Ethylene mol %
X RA
FInclusion ModelRAF Model
b)
0
0.1
0.2
0.3
0.4
0.5
0 0.1 0.2 0.3 0.4 0.5 0.6 0.7 0.8Xc
X RA
F
Inclusion ModelRAF model
Figure 6.1.27 RAF from Inclusion and RAF Models: a) vs. Ethylene Content, b) vs. Crystallinity

76
a)
0
0.2
0.4
0.6
0.8
1
0 5 10 15 20 25Ethylene mol %
XcDSC RAF ModelDensity RAF Model
b)
0
0.2
0.4
0.6
0.8
1
0 5 10 15 20 25Ethylene mol %
Xc
DSC RAF ModelDensity RAF Model
Figure 6.1.28 RAF Model Crystallinity from Density and DSC as a Function of Composition a)
Alamo Unit Cell, b) Laihonen Unit Cell

77
assumed that the rigid amorphous fraction density is equal to the crystal density. The
first case was already presented in Figure 6.1.25 and Figure 6.1.26. The second case is
demonstrated in Figure 6.1.28a) for the Alamo unit cell and in Figure 6.1.28b) for the
Laihonen unit cell. The results are similar for the Alamo and Laihonen unit cells with
the exception of polypropylene homopolymer. For the most part, the RAF model density
crystallinities are slightly higher than the crystallinities obtained from the DSC RAF
model for the copolymers with low ethylene content. The discrepancy between the data
sets increases with an increase in the ethylene content.
Overall, there is a relatively good agreement between the crystallinity values
obtained from the density and the DSC inclusion model for the copolymers of low
ethylene content. However, the dissimilarity increases with the increase in the ethylene
content. The crystallinities calculated from the RAF model are generally significantly
lower than the density crystallinities for all ethylene concentrations.
6.1.3 Morphology
The morphology of Dow copolymer materials was studied using DSC, Wide-
angle X-ray analysis, AFM and SEM.
The effect of composition on the melting behavior following isothermal
crystallization at the lowest practical temperature for each material is shown in Figure
6.1.29 for several copolymers. In all cases the development of the low temperature
endotherm is preceded by the growth of the high temperature endotherm. In the case of
isothermal crystallization of PE-I (0.0, 320), the relative height of the low endotherm
peak is smaller than that of the high endotherm. However, as the concentration of the
ethylene increases, the relative heights of the endotherms become reversed. In the PE-I
(13.6, 290) and PE-I (15.7, 260), the low temperature endotherm is considerably larger
than the high temperature endotherm after just 2min of isothermal crystallization. There
is also a noticeable shift in the melting temperatures of both endotherms with an increase
in the crystallization time.
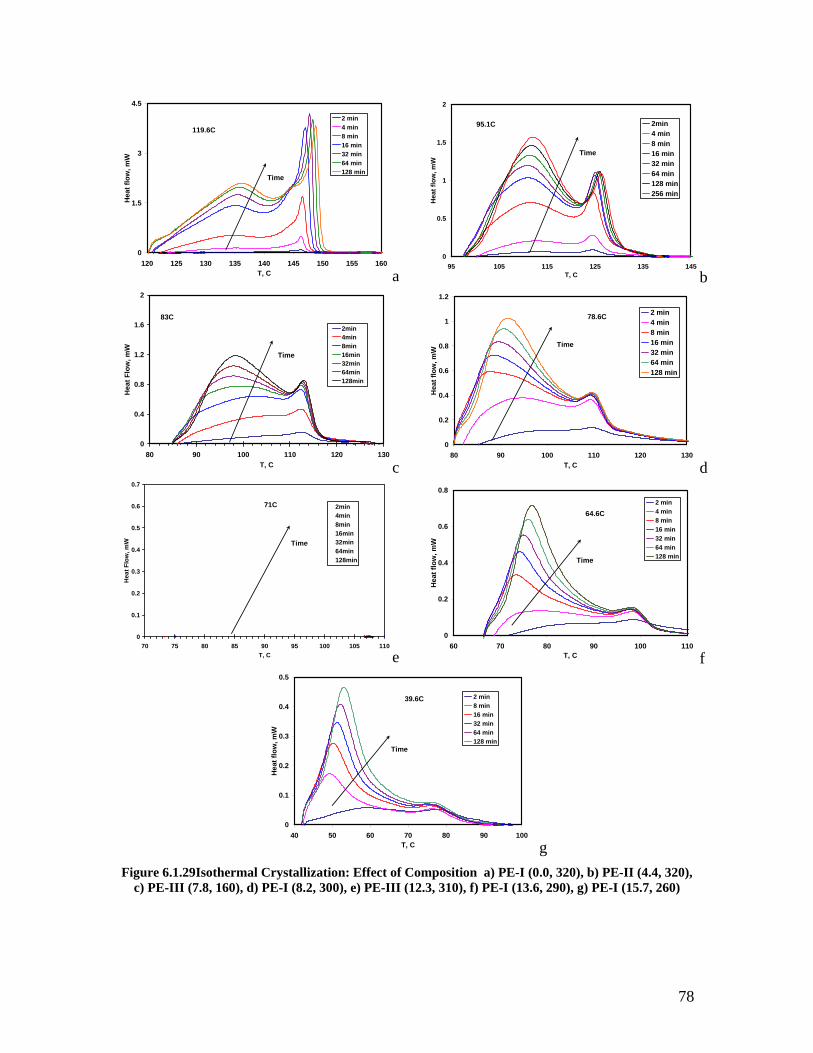
78
0
1.5
3
4.5
120 125 130 135 140 145 150 155 160T, C
Hea
t flo
w, m
W2 min4 min8 min16 min32 min64 min128 min
119.6C
Time
a 0
0.5
1
1.5
2
95 105 115 125 135 145T, C
Hea
t flo
w, m
W
2min4 min8 min16 min32 min64 min128 min256 min
95.1C
Time
b
0
0.4
0.8
1.2
1.6
2
80 90 100 110 120 130T, C
Hea
t Flo
w, m
W
2min4min8min16min32min64min128min
83C
Time
c 0
0.2
0.4
0.6
0.8
1
1.2
80 90 100 110 120 130T, C
Hea
t flo
w, m
W
2 min4 min8 min16 min32 min64 min128 min
78.6C
Time
d
0
0.1
0.2
0.3
0.4
0.5
0.6
0.7
70 75 80 85 90 95 100 105 110T, C
Hea
t Flo
w, m
W
2min4min8min16min32min64min128min
71C
Time
e 0
0.2
0.4
0.6
0.8
60 70 80 90 100 110T, C
Hea
t flo
w, m
W
2 min4 min8 min16 min32 min64 min128 min
64.6C
Time
f
0
0.1
0.2
0.3
0.4
0.5
40 50 60 70 80 90 100T, C
Hea
t flo
w, m
W
2 min8 min16 min32 min64 min128 min
39.6C
Time
g Figure 6.1.29Isothermal Crystallization: Effect of Composition a) PE-I (0.0, 320), b) PE-II (4.4, 320),
c) PE-III (7.8, 160), d) PE-I (8.2, 300), e) PE-III (12.3, 310), f) PE-I (13.6, 290), g) PE-I (15.7, 260)

79
The effect of crystallization temperature on the behavior of PE-I (0.0, 320), PE-I
(4.4, 320) and PE-I (15.7, 260) is shown in Figure 6.1.30, Figure 6.1.31 and Figure
6.1.32, respectively. With an increase in the crystallization temperature, the rate of
crystallization decreases. The same effect is also apparent form the results given in
Figure 6.1.33. For each copolymer the crystallization rate (as judged by the initial slopes
of the crystallinity curves) and the overall crystallinity decrease with an increase in the
crystallization temperature. There is also a significant decrease in the crystallinity with
an increase in ethylene concentration.
The growth rates of the low and high endotherm are shown in Figure 6.1.34 for
PE-I (0.0, 320) and PE-II (4.4, 320). At the shortest crystallization time of 2 min, the
areas of these endotherms are the same. The effect of crystallization temperature rate of
shift of the melting temperature B(Tx) are shown in Figure 6.1.35. The B(Tx) for PE-I
(0.0, 320) values increase with the crystallization temperature. The dependence of B(Tx)
on the crystallization temperature for PE-II (4.4, 320) is not as strong as for PE-I (0.0,
320).
The WAXD data for several copolymers crystallized on the bench top are shown
in Figure 6.1.36. The peak at the scattering angle 2θ around 18.4° is characteristic of α-
phase crystals and the peak at the scattering angle 2θ around 19.4° is characteristic of γ-
phase crystal.118 Similar results were obtained for the other copolymers crystallized by
slow, fast and bench top cooling methods outlined in Section 4.2.3. From these results,
the relative γ-phase content values were calculated. These WAXD results demonstrate
the effect of ethylene content and cooling rate on the formation of γ-phase crystals
(Figure 6.1.37). The lines in Figure 6.1.37 represent the trend lines and not the fit lines to
the data sets shown. There is a steady increase in the γ-phase crystal content with
increasing ethylene concentration. The increase in the γ-phase content with ethylene
concentration is larger at lower cooling rate. The dependence of the amount of γ-phase
crystals on the defect concentration for Dow copolymers is shown in Figure 6.1.38. The
defect mol% includes the contribution from the ethylene units as well as regio-errors.
There is an increase in the γ-phase content with the increase in the defect concentration.
For comparison, the data from Alamo et al.50 for propylene-ethylene copolymers and De

80
a) 0
1.5
3
4.5
120 125 130 135 140 145 150 155 160T, C
Hea
t flo
w, m
W
2 min4 min8 min16 min32 min64 min128 min
119.6C
Time
b) 0
1.5
3
4.5
120 125 130 135 140 145 150 155 160T, C
Hea
t flo
w, m
W
2 min4 min8 min16 min32 min64 min128 min
120.1C
Time
c) 0
1.5
3
4.5
120 125 130 135 140 145 150 155 160T, C
Hea
t flo
w, m
W
4 min8 min16 min25 min32 min45 min64 min128 min
122.1C
Time
d) 0
1.5
3
4.5
120 125 130 135 140 145 150 155 160T, C
Hea
t flo
w, m
W
8 min16 min25 min32 min45 min64 min128 min
124.1C
Time
Figure 6.1.30 Effect of the Crystallization Temperature on Isothermal Crystallization of PE-I (0.0,
320)

81
a) 0
0.5
1
1.5
2
95 105 115 125 135 145T, C
Hea
t flo
w, m
W
2min4 min8 min16 min32 min64 min128 min256 min
95.1C
Time
b) 0
0.5
1
1.5
2
95 105 115 125 135 145T, C
Hea
t flo
w, m
W
2 min4 min8 min16 min32 min64 min128 min
97.1C
Time
c) 0
0.5
1
1.5
2
95 105 115 125 135 145T, C
Hea
t flo
w, m
W
4 min8 min16 min32 min64 min128 min
99.1C
Time
d)
0
0.5
1
1.5
2
95 105 115 125 135 145T, C
Hea
t flo
w, m
W
4 min8 min16 min32 min64 min128 min
101.1C
Time
Figure 6.1.31 Effect of the Crystallization Temperature on Isothermal Crystallization of PE-II (4.4,
320)

82
a)
0
0.1
0.2
0.3
0.4
0.5
40 50 60 70 80 90 100T, C
Hea
t flo
w, m
W
2 min8 min16 min32 min64 min128 min
39.6C
Time
b)
0
0.1
0.2
0.3
0.4
0.5
40 50 60 70 80 90 100T, C
Hea
t flo
w, m
W
8 min16 min32 min60 min90 min120 min
44.1C
Time
c)
0
0.1
0.2
0.3
0.4
0.5
40 50 60 70 80 90 100T, C
Hea
t flo
w ,
mW
8 min16 min32 min60 min90 min120 min
45.1C
Time
Figure 6.1.32 Effect of the Crystallization Temperature on Isothermal Crystallization of PE-I (15.7,
260)

83
a)
0
0.1
0.2
0.3
0.4
0.5
0 20 40 60 80 100 120 140Time, min
X c
119.6C120.1C122.1C124.1C
b)
0
0.1
0.2
0.3
0 20 40 60 80 100 120 140Time, min
X c 95.1C97.1C99.1C101.1C
c)
0
0.1
0.2
0.3
0 20 40 60 80 100 120 140time, min
Xc
83C86C88C

84
d)
0
0.05
0.1
0.15
0.2
0 20 40 60 80 100 120 140Time, min
X c78.6C79.1C84.1C86.1C
e)
0
0.02
0.04
0.06
0.08
0.1
0 20 40 60 80 100 120 140Time, min
X c
71C73C75C
f)
0
0.02
0.04
0.06
0.08
0.1
0 20 40 60 80 100 120 140time, min
X c
64.6C70.1 C72.1C
Figure 6.1.33 Effect of the Ethylene Content and the Crystallization Temperature on Isothermal
Crystallization: a) PE-I (0.0, 320), b) PE-II (4.4, 320), c) PE-III (7.8, 160), d) PE-I (8.2, 300), e) PE-III (12.3, 310), f) PE-I (13.6, 290)

85
a)
0.1
1
10
100
1 10 100 1000Time, min
∆H
f, J/
g
alpha crystalsgamma crystals
b)
0.1
1
10
100
1 10 100 1000Time, min
∆H
f, J/
g
alpha phasegamma phase
Figure 6.1.34 Rate of the Crystal Phase Formation a) PE-I (0.0, 320) Tx = 122.1°C b) PE-II (4.4, 320),
Tx = 96.1°C

86
a)
0
0.2
0.4
0.6
0.8
1
119 120 121 122 123 124 125Tx, C
B (T
x)
Low EndothermHigh Endotherm
b)
0
0.2
0.4
0.6
0.8
1
94 96 98 100 102Tx, C
B (T
x)
Low EndothermHigh Endotherm
Figure 6.1.35 Effect of the Crystallization Temperature on B(Tx) for a) PE-I (0.0,320), b) PE-II (4.4,
320)

87
0
2
4
6
8
10
12
14
16
18
17 17.5 18 18.5 19 19.5 20 20.5 21
Angle 2θ
Sign
al, A
rbitr
ary
Uni
ts
P/E I(0.0, 320)P/E II(4.4, 320)P/E VII(12.3, 300)P/E I(19.4, 260)
Figure 6.1.36 Effect of Composition on WAXD Signal for Selected Bench Top Cooled Dow
Copolymers
0
0.2
0.4
0.6
0.8
1
0 5 10 15 20Ethylene mol %
γ / (
γ +
α)
Slow CoolQuenchBench Top
Figure 6.1.37 WAXD: Effect of the Ethylene Content and the Cooling Rate on the γ–Phase Content

88
1
10
100
0 0.2 0.4 0.6 0.8 1γ-Phase Conent
Def
ects
, mol
%
10
100
1000
<Lis
o>
Dow CopolymersAlamo CopolymersDe Rosa PPDe Rosa PP
Figure 6.1.38 The Effect on the Defect Concentration and Isotactic Sequences Length <Liso> on γ-
Phase Content for Dow Copolymers, Alamo et al.50 P/E Copolymers, De Rosa et al.124 PP (Blue Line Represents the Trendline only through Dow Copolymers Data Points)
Rosa et al.124 for propylene homopolymer with regio- and stereo- defects are included in
the same plot. For a given defect concentration, Dow copolymers exhibit slightly lower
fraction of γ-phase crystals, especially when compared to the values reported by De Rosa
et al. However, the rates of change of the γ-phase content with the defect concentration
are similar for Dow copolymers for materials studied by Alamo et al. and De Rosa et al.
The dependence of the isotactic sequences length, <Liso>, on the amount of γ-phase
crystals from De Rosa et al.124 is also shown inFigure 6.1.38. <Liso> increase
corresponds to the decrease in both, the defect concentration and γ-phase crystal content.
Figure 6.1.39 and Figure 6.1.40 contain the AFM and SEM micrographs of Dow
copolymers of different ethylene content. The cross-hatching morphology is present in
all images. As the ethylene content increases, the density of cross-hatching and the
thickness and the length of lamellar crystals decrease. There is also an increase in the
amount of amorphous phase as can be judged by the increase in the size and the number
of dark regions on the AFM micrographs.
The morphologies of Dow, Ziegler-Natta and Metallocene copolymers of similar
ethylene content are compared in Figure 6.1.41. All three structures are very similar and
exhibit the signs of cross-hatching.

89
a)
b)
c)

90
d)
e)
f) Figure 6.1.39 AFM: Effect of Composition on the Morphology of Propylene-Ethylene Copolymers: a) PE-I (0.0, 320), b) PE-II (4.4, 320), c) PE-I (8.2, 300), d) PE-I (13.6, 290), e) PE-I (15.7, 260), f) PE-I
(19.4, 260)

91
a)
b)
c) Figure 6.1.40 SEM: the Effect of Composition on Morphology of Propylene-Ethylene Copolymers: a)
PE-I (0.0, 320), b) PE-I (8.2, 300) etched, c) PE-I (19.4, 260)

92
a)
b)
c) Figure 6.1.41 SEM: The Effect of the Catalyst System on Morphology of Propylene-Ethylene
Copolymers: a) PE-I (8.2, 300) etched, b) ZN P/E 8.3 c) Met P/E 6.5

93
6.2 Discussion
6.2.1 Crystallization and Melting Studies The crystallization and melting behavior of propylene-ethylene copolymers is to a
large extent determined by the distribution polypropylene sequence lengths between
defects and by the ability of these defects to enter the propylene crystal lattice.
According to Flory’s thermodynamic equilibrium theory28,29,30, at any given temperature
only the sequences of length larger than some critical value ξ are able to crystallize. As
the crystallization temperature decreases, ξ decreases and shorter sequences can form
crystals. Flory’s treatment is applicable for copolymers where the “minor” comonomer is
totally excluded from the lattice of the “major” comonomer. In the case of propylene-
ethylene copolymers, defects along the polymer chain are either regio- or stereo-defects
or ethylene units. A number of previous studies have suggested that a regio, stereo and
small single co-unit defects can be included in the polypropylene crystal42-49,85,86 One
should expect that these different types of defects will disrupt the crystallization process
of propylene sequences to various extents. In general, the larger the number of defects
along the polymer chain, the lower the concentration of long chain sections able to
crystallize at high temperatures and the larger the fraction of shorter sections able to
crystallize at lower temperatures. It had been shown by Keller et al.12 that the lamellar
thickness is inversely proportional to the supercooling. The crystals formed at the lower
crystallization temperatures then are composed of thinner lamella that melts at lower
temperature. Hence, the inclusion of defects in the propylene chain leads to
crystallization at lower temperature and formation of thinner crystals that melt at lower
temperature. .
Dow copolymers contain region, stereo and ethylene defects. As PP-I (0.0, 320) is
considered, peak crystallization and melting temperatures of 106°C and 144°C,
respectively, are reported in this work for cooling and heating rates of 10oC/min. These
values are lower than these usually reported for PP homopolymer (e.g Tc of about 116°C
and Tm of about 162°C were reported by Ojeda et al.125 and Tc of 115°C and Tm of 170°C
were reported by Feng et al.40). The reduction in melting and crystallization temperatures
94
is accounted for by the large defect content of this material. The content of regio defects
in PP-I (0.0, 320) is 1.18 mol% and the content of stereo defects is 6.7 mol%.
As ethylene co-units are added to the polypropylene chain, they further disrupt the
ability of these chains to crystallize. With an increase in ethylene concentration, one of
two scenarios can occur. Each scenario is determined by the nature of the particular
catalytic system and depends on the co-unit distribution.
If the ethylene units are distributed relatively randomly through the polymer chain
(catalyst A), an increase in ethylene concentration leads to an increase in the amount of
single E units. As a result of such incorporation, the copolymer chain has a substantial
amount of short PP sequences surrounded by single ethylene units. As the number of E
units increases, the energetic penalties become too large for this number of ethylene units
to be included into the propylene crystal. Hence, the closely-spaced ethylene units and
the short neighboring propylene sequences are rejected during crystallization, resulting in
a lower degree of crystallinity.
On the other hand, if the distribution of ethylene units is fairly blocky (catalyst B),
then, with an increase in ethylene concentration, the probability of formation of EE and
longer sequences increases. Since these longer ethylene sequences can not be included in
the crystal, the overall system crystallinity will decrease.
In both cases, a steady decrease in the degree of crystallinity, peak melting and
crystallization temperatures is observed with increasing ethylene content (Figure 6.1.3
and Figure 6.1.8). However, the change in crystallinity observed with for the propylene-
ethylene copolymers is much less severe than that observed for copolymers of propylene
with 1-hexene or 1-octene.126 In this latter investigation, it was shown that the depression
in melting temperature, crystallization temperature and degree of crystallinity was the
same for these two copolymer series, consistent with Flory’s model for copolymers
exhibiting exclusion effects. These results are in accordance with the present argument
that ethylene units in the case of propylene-ethylene copolymers are at least partially
included in the polypropylene crystals.
The increase in ethylene content must lead to a decrease in the thickness of crystal
lamellae and consequently, to a decrease in the crystallization peak and onset
temperatures, melting peak and offset temperatures and the overall system crystallinity

95
(Figure 6.1.3, Figure 6.1.6, Figure 6.1.7 and Figure 6.1.8). The plots of the
crystallization onsets and melting offsets for the series I-III of Dow copolymers fit this
theory well. However, series VII and VIII exhibit different behavior. Series VII
copolymers with ethylene content in the range 12-21 mol% exhibit a high melting
temperature shoulder that almost develops into a separate high temperature endotherm as
the ethylene concentration is increased (Figure 6.1.4 and Figure 6.1.7). The peak
associated with this endotherm has a very weak temperature dependence and corresponds
to that expected for the copolymer with about 4 mol% of ethylene. The melting offsets
for both series VII and VIII show almost no dependence on the ethylene content. These
features are accompanied by a decrease in the crystallinity with increase in ethylene
content for both Series of the same magnitude as was shown for series I-III Dow
copolymers. These results suggest that copolymers in each of the series VII and VIII
must have approximately the same long polypropylene sequences that allow
crystallization at relatively high temperatures. This appears to be the case even for
copolymers with an ethylene content as high as 21.2 mol%. These long polypropylene
sequences form thicker lamellae that melt at temperatures corresponding to the melting of
a copolymer with about 4 ethylene mol % for Series VII materials and about 6 mol % for
series VIII materials.
The exact nature of the catalyst system used in the polymerization of Dow
copolymers is unknown to us. However, it is known that the catalyst used for series I-III
(catalyst A) is different form that used in series VII and VIII (catalyst B). While catalyst
A is reported by Dow Chemical to yield a comonomer distribution that exhibits slight
tendency toward alternation,127 catalyst B results in materials that display significant
blockiness in the ethylene unit distribution. Samples in series VII and VIII only differ in
the polymerization conditions (pilot plant versus miniplant). Both series were
polymerized by the same catalyst B. It can be speculated that the polymerization
conditions of series VII and VIII copolymers led to the processing variability and that
resulted in series VII copolymers having high crystalline fraction and series VIII
copolymers having lower crystalline fraction present. Whatever maybe the source of the
differences between series VII and VIII, it is clear that unit distribution plays a crucial
role in shaping not only the crystallization and melting behavior of these materials but the
96
overall copolymer properties as well. For example, the presence of high crystalline
fraction in series VII and VIII copolymers (responsible of the high melting temperature
offset and the high temperature shoulder observed in DSC traces (Figure 6.1.2, Figure
6.1.4 and Figure 6.1.7) can become beneficial from the material processing standpoint.
Since the melting window of theses copolymers is over 100°C, they should possess good
processing flexibility that includes fiber spinning and film blowing.5
As the crystallinity of these copolymers decreases with an increase in the ethylene
content, as was demonstrated for copolymers of all series, the amount of amorphous
phase present between crystal lamellae increases. The behavior of a copolymer in
amorphous regions is governed by the total amount of crystals and the intrinsic mobility
of the parent homopolymers. Polypropylene exhibits a higher glass transition
temperature than polyethylene due to restrictions in conformational changes associated
with the presence of a pendant methyl group on every second carbon. An increase in
ethylene concentration along the copolymer chain should, therefore, lead to a lower glass
transition temperature. An increase in ethylene content also leads to a decrease in
crystallinity, hence in the constraints exerted on the amorphous fraction. The net result of
this decrease in crystallinity is therefore a further reduction of the glass transition
temperature. This reduction in Tg is due to the decrease in the energy required to set off
long range molecular motions in the less confined system. The glass transition depression
for the Dow copolymers exhibit the same behavior for all series (Figure 6.1.8) and is
consistent with the reduction from about -6°C for 0 mol% ethylene to about -35°C for 20
mol % previously reported for Ziegler-Natta propylene-ethylene copolymers by Gan et
al.128
One of the goals of this work was to compare the properties of Dow copolymers to
these of typical metallocene and Ziegler-Natta copolymers.
In general, metallocene and Ziegler-Natta catalysts differ in their nature and in the
polymerization mechanism. While typical metallocene catalyst systems are
homogeneous, the Ziegler-Natta catalysts are heterogeneous. Polymers prepared using
Ziegler-Natta catalysts are characterized by much wider molecular weight distributions
compared to the relatively narrow distribution achieved with metallocene systems
(Mw/Mn ~ 2.0). Since the chain lengths vary greatly in Ziegler-Natta materials, their
97
crystallization and melting transitions tend to be wider than those for metallocene
polymers.
Ziegler-Natta polypropylene generally crystallize in the α form even if the defect
concentration is substantial. 57 α-phase crystals form thicker lamellae that melt at high
temperature.129,130 In contrast, metallocene polymers routinely crystallize into a mixture
of α-phase and γ-phase crystals50,82,124. Since γ-phase crystals form thinner lamellae,
these polymers usually have lower crystallization and melting temperatures than Ziegler-
Natta polymers. These differences in crystal characteristics are due to the defect
distribution along the polymer chain and relates to differences in the polymerization
mechanism with metallocene and Ziegler-Natta catalyst systems.131 Polymerization with
metallocene catalysts leads to a polymer with more randomly distributed defects than
does polymerization with Ziegler-Natta catalysts. In the latter case, the defects are
concentrated in clusters of poorly crystallizable material.85,131 As a result, the defects in
metallocene catalyzed polymer disrupt the long polypropylene sequences leading to a
large amount of poorly crystallizable sequences with high defect concentration. At the
same time, the segregation of defects in the Ziegler-Natta catalyzed polymer into clusters
leaves very long polypropylene sequences free of defects. The fact that shorter sequences
tend to crystallize into γ-phase crystals82 explains the preferable formation of the γ-phase
in metallocene polymers as opposed to the Ziegler-Natta materials.
In our case, Dow copolymers have relatively narrow molecular weight distributions
(Mw/Mn ~ 2.2-2.7) and crystallization and melting temperatures comparable to those of
metallocene copolymers (Figure 6.1.12 and Figure 6.1.13). They also exhibit a
substantial fraction of γ-phase crystals, even for the lowest ethylene content materials, as
demonstrated by both, the isothermal crystallization and the WAXD data (Figure 6.1.29
and Figure 6.1.37). The crystallization and melting temperatures of the Ziegler-Natta
copolymers of about the same concentration are substantially higher than those of
metallocene and Dow copolymers. Judging by the lower crystallization and melting
temperatures, which correspond to the crystallization and melting of thinner lamellae, the
defect distribution in Dow copolymers is closer to that of metallocene catalyzed
materials. On the other hand, the melting traces of Dow copolymers with 13 mol%
ethylene and the crystallization traces of series VII and VIII have peaks that are

98
significantly broader than those for metallocene copolymers (Figure 6.1.11). These
copolymers also have higher melting temperature offsets than do metallocene copolymers
(Figure 6.1.15). These calorimetric studies confirm that while the Dow copolymers are in
many respects similar to their metallocene-catalyzed counterparts, their propylene
sequence distribution is less random and in the case of series VII and VIII, contains a
much larger fraction of long propylene sequences.
6.2.2 Crystallinity and Thermodynamic Heat of Fusion
When crystallinities are calculated either from DSC or density data, a set of
underlying assumptions has to be considered. Both approaches require the knowledge of
some physical properties for the fully crystalline and fully amorphous materials. In the
case of density calculations, these are the amorphous and the crystal densities. In the
case of DSC analysis, these are the crystal and the amorphous heat capacities and the
thermodynamic heat of fusion at melting.
In either of these approaches, the property of a semicrystalline polymer is
principally governed by the amount of crystalline and amorphous phases, as well as by
the properties of these phases. It has been proposed that the transition between the
amorphous and the crystal phases is not sharp and can be described as an interphase
composed of non-crystallizable units, defects that might be excluded from the crystal, and
chain folds of varying lengths. The contribution of the interfacial region varies from
polymer to polymer depending on the polymer molar mass, the stiffness of the polymer
backbone, the bulkiness of the side-groups, the amount of defects, the distribution of
crystallizable sequence lengths, etc… The properties of the interfacial region in
propylene-ethylene copolymers are not well established. One approach followed by
some researchers is to describe a semicrystalline polymer using a three-phase model with
crystalline, mobile amorphous and constrained amorphous fractions.87-99 While some
studies claim that the density of the constrained amorphous phase is about the same as
that of the mobile amorphous phase,101 others report it to be higher.102,103

99
When the crystallinity of polypropylene is determined by the method outlined by
Mathot,117 the amorphous and crystalline heat capacities that are necessary for the
calculations, are obtained from the ATHAS database. These database heat capacities
were calculated using Tarasov functions. The experimental data was based on the
average of a number of measurements performed on isotactic, syndiotactic and atactic
polypropylenes.132 Heat capacity values for a propylene-ethylene copolymer melt are
obtained using the rule of mixture.
The polypropylene crystallinity calculations using the database values of Cpliq,
Cpc and ∆Hf0 = 207 J/g result in an underestimation of ∆Cp at the glass transition
temperature, in agreement with results of Grebowicz et al.91 Since the materials studied
here contain stereo, regio and ethylene defects, their Cpliq, Cpc and ∆Hf0 values may
differ from those reported in the ATHAS database for pure polypropylene. Consequently,
two approaches must be considered. In the first case, the Cpliq, Cpc and ∆Hf0 values
quoted for polypropylene are assumed to be applicable and the ∆Cp deficiency is then
attributed to the presence of a third phase (i.e. the rigid amorphous fraction). In the
second approach, the two-phase model is assumed to hold and the ∆Cp deficiency is a
calculation artifact associated with the use of inappropriate values of Cpliq, Cpc and ∆Hf0.
The possible disparity in amorphous and crystalline heat capacity values have
been discussed in section 5.3 as a part of the uncertainty analysis. It was demonstrated
that in the worse case, the heat capacity variability results in a 15% standard deviation
and in most cases in less than 10% deviation from the calculated values. This uncertainty
can not account for the ∆Cp deficiency.
The possible disparity in the values of the thermodynamic heat of fusion deserves
a closer attention. It has been proposed by Sanchez and Eby34,35 and demonstrated in a
number of studies41-50 that certain defects (stereo and single ethylene units) can be
included in the propylene crystal. A dilation of the crystal unit cell as a result of defect
incorporation in the polypropylene chain was shown by Laihonen et al.41,42 in the case of
ethylene defects and by Isasi et al.123 for stereo and regio defects. As defects are included
in a polypropylene crystal, the degree of crystal perfection decreases.
The thermodynamic heat of fusion at melting measures the amount of energy that
is required to melt a perfect crystal. It is directly related to the crystal degree of

100
perfection. As a crystal with defects is considered, its equilibrium ∆Hf0 value should
reflect the amount of energy required to melt this particular defective crystal. This means
that the thermodynamic heat of fusion at melting that is used in the crystallinity
calculations should depend on the amount of stereo and structural defects that are
included in the crystal. A linear decrease in ∆Hf0 with increasing ethylene defect
concentration is demonstrated for Dow propylene-ethylene copolymers in Figure 6.1.18.
Using solid-state NMR spectroscopy, Alamo et al.50 showed that 42% of the
ethylene units along a copolymer chain are included in the crystal phase. The partial
inclusion of ethylene units in the crystal phase of Dow propylene-ethylene copolymers is
demonstrated by the dependence of both the normalized calculated thermodynamic heat
of fusion at melting and the normalized experimental enthalpy of fusion (Figure 6.1.20
and Figure 6.1.21). Normalization consisted in dividing the heat of fusion by the total
mass of propylene units in the copolymer. Since both of these quantities are still a
function of the ethylene content after normalization, then, ethylene units have to be
included in the propylene crystal. The decrease in the normalized heat of fusion is shown
to be ca. 4.5 J/gPP/mol% ethylene, a value which is consistent with 3-4 J/g/mol% ethylene
reported by Laihonen et al.42
It has been demonstrated that the ethylene defects are included in γ-phase crystals
and an increase in the defect concentration further favors the formation of γ phase.51 It
can be then argued that a calculated change in the thermodynamic heat of fusion may be
due to a decrease in the content of α-phase crystals and an increase in the content of γ-
phase crystals. However, it has been determined by Ferro et al.133 that the packing
energies of α-phase and γ-phase crystals are almost the same. This means that the
thermodynamic heat of fusion of the two phases should be about the same and the
calculated change in the ∆Hf0 values is not due to differences in the fractions of α-phase
and γ-phase crystals obtained after crystallization.
We now examine the applicability of the RAF and inclusion models to describe
the morphology of these copolymers. The dependence of crystallinity on ethylene content
calculated by both the RAF and the inclusion models is shown in Figure 6.1.22. Since
the thermodynamic heat of fusion values used in the inclusion model calculations are
lower than the value of 207 J/g used in the RAF model, the crystallinities calculated for

101
the inclusion model are significantly higher than those obtained with the RAF model.
For comparison purpose, it would therefore be valuable to obtain an estimate of the
degree of crystallinity through a non-calorimetric method.
A second estimate of crystallinity was obtained from density measurements. The
issue related to the choice of crystal density for the crystallinity calculations has been
presented in Section 6.1.2. Since the crystal density is closely related to the degree of
crystal packing, it should be greatly affected by the inclusion of defects into the crystal
phase. Two studies addressed the issue of density for defective polypropylene crystals.
Isasi et al.123 investigated the effect of regio and stereo defects on the crystal density,
while Laihonen et al.42 studied the effect of ethylene inclusion on the crystal density. The
unit cell dimensions determined in both of these studies have been used for the density
calculations. As was shown in Section 6.1.2, the crystallinities calculated using these
unit cells are very similar except for the propylene homopolymer.
The crystallinities calculated by the inclusion model are slightly lower than the
density crystallinities calculated using the unit cell dilation parameters from the Alamo
and Laihonen studies for low ethylene content materials. The disparity between these
crystallinities increases with ethylene content. There can be several reasons for the
disparities between the two data sets. Alamo’s study demonstrated that the presence of
regio defects causes unit cell dilation. However, it did not describe the dependence of the
crystal density on the defect concentration. Laihonen et al.42 investigated the effect of
ethylene inclusion on the propylene unit cell dilation in the range of 0-11 ethylene mol%.
Finally, to calculate copolymer crystal densities from unit cell dimensions, one must
account for the mass deficiency associated with the substitution of some propylene units
by ethylene units. This was achieved by recalling the conclusion of a NMR study of 0.8 -
7.5 mol% ethylene copolymers that 42% of ethylene units are partitioned in the crystal
phase.50 It is reasonable to assume that with a further increase in ethylene content, a
saturation of the crystal by ethylene units could be reached and the partitioning
coefficient may decrease. The partitioning coefficients for the low ethylene content
copolymers could also be lower than 42%. Dow copolymers have a large number of
regio and stereo defects. The inclusion of these defects in the propylene crystal alongside
the ethylene defects can effectively reduce the fraction of the included ethylene units.

102
Unfortunately, there is no reliable data in the literature that addresses both, the crystal
density for copolymers with a large amount of ethylene defects and the partitioning
coefficients for propylene-ethylene copolymers with a significant amount of regio- and
stereo defects included in the chain. The disparity between DSC crystallinities calculated
with the inclusion model and density crystallinities can then be attributed to uncertainties
in the values of crystal densities for high ethylene content copolymers and the partition
coefficients for these particular copolymers.
The crystallinities calculated with the RAF model are systematically lower than
the density crystallinities. Let us assume for the sake of argument that a RAF is present
in the material in the amount predicted by the RAF model and let us make the extreme
assumption that the density of the rigid amorphous phase is the same as crystal density.
While the RAF density should be somewhat higher than the amorphous density since the
interphase is the region where the crystalline order is dissipated, it is a disordered phase
and should be less dense than the crystal phase. Even with this extreme assumption, the
density crystallinity values do not agree with the RAF DSC crystallinities.
In Figure 6.1.27, the presence of a rigid amorphous fraction was also considered
within the scope of the inclusion model. In fact, the observed ∆Cp deficiency does not
need to be a proof for the existence of rigid amorphous fraction. As demonstrated in
Figure 6.2.1 for higher crystallinity copolymers, the region just above Tg exhibits
contributions from both, the continuing relaxation of the glass transition and the onset of
melting. As a result, the slope of the extrapolated Cpb line is overestimated, leading to the
underestimation of ∆Cp(Tg). The ∆Cp deficiency artifact is shown in Equation 6.2.1 and
Equation 6.2.2 and in Figure 6.2.1.
cliq
sc XCpltheoreticaCpltheoretica
−=∆∆
1 Equation 6.2.1
RAFcliq
sc XXCpmeasuredCpmeasured
−−=∆∆
1 Equation 6.2.2

103
Among the two approaches used to calculate the crystallinities of Dow
copolymers, the RAF and inclusion model, the inclusion model agrees with the density
crystallinities to a higher degree. The inclusion of ethylene units into the polypropylene
crystal phase has been demonstrated and the application of the inclusion model to this
copolymer system appears rational. At the same time, application of the rigid amorphous
phase concept to copolymers with included defects was shown to be inadequate when
attempting to account for a ∆Cp deficiency at Tg.
TTg
Xc
measured Cpsc
theoretical Cpsc
Cpcryst
theoretical Cpliq
measured Cpliq
TTg
Xc
measured Cpsc
theoretical Cpsc
Cpcryst
theoretical Cpliq
measured Cpliq
Figure 6.2.1 ∆Cp Deficiency Calculations
6.2.3 Morphology
Crystallization of polypropylenes with low defect concentrations leads primarily to
α-phase crystals. It was demonstrated in a number of studies that if the chirality of two
consecutive sheets (of R or L it-PP helices) is the same, then, epitaxial lamellar branching
is observed.56,65,64 This leads to the cross-hatched morphology, characteristic of
propylene-based materials. In the case of epitaxial lamellar branching, a daughter lamella
nucleates at angles of 80° or 100° from the parent lamella. As defects are added to a
polypropylene chain, they become mostly included in γ-phase crystals which nucleate at
40° angles from the parent α-phase lamellae.70

104
Propylene-ethylene copolymers exhibit both α-phase and γ-phase crystals.
Isothermal crystallization studies clearly reveal two distinct crystal populations as
demonstrated by two distinct melting endotherms (Figure 6.1.29, Figure 6.1.30, Figure
6.1.31 and Figure 6.1.32) for all propylene-ethylene copolymers. These two endotherms
correspond to the melting of α-phase and γ-phase crystals.
The relative ease of formation of α-phase and γ-phase crystals is governed by the
local density of ethylene defects. It was already discussed in Section 6.2.1 that shorter
sections of polypropylene chain or sections of polypropylene chain with a larger
concentration of defects tend to crystallize into γ-phase crystals. These form thinner
lamellae that melt at lower temperature. Since γ-phase crystals are expected to melt at
lower temperature than do α-phase crystals, the lower melting endotherm in the
isothermal crystallization studies corresponds to the melting of the γ-phase crystals and
the high endotherm corresponds to the melting of the α-phase crystals. This assignment
of the endotherms correlates well with the results in Figure 6.1.29. The PE-I (0.0, 320)
polymer with no ethylene units, has a large number of long polypropylene sequences free
of defects. Consequently, it crystallizes predominantly into α-phase crystals. The γ-
phase crystals formed for this polymer are the result of the partial inclusion of some
stereo and regio defects. The isothermal crystallization trace reflects this scenario: PE-I
(0.0, 320) low temperature endotherm peak, which was assigned to the melting of γ-phase
crystals, is lower than the high temperature endotherm peak which was assigned to the
melting of α-phase crystals. As the ethylene content increases, the availability of long
propylene sequences decreases. As a result, for higher ethylene content copolymers, the
γ-phase content increases, leading to a more prominent low temperature endotherm.
An increase in crystallization temperature is typically associated with an increase in
lamellar thickness. However, the number of propylene sequences of a given length
decreases with the sequence length. Hence, a lesser number of sections of polypropylene
chains will tend to crystallize at higher temperature. The predicted decrease in
crystallinity with an increase in crystallization temperature is shown in Figure 6.1.33 for
each copolymer. The larger the ethylene content, the shorter the average propylene
sequence free of defects, the lower the crystallization temperature of that copolymer.

105
Consequently, high ethylene content copolymers crystallize at lower temperatures and
achieve lower overall crystallinities.
One of the questions concerning the morphology of propylene-ethylene copolymers
is which phase (α or γ) crystallizes first. As demonstrated in Figure 6.1.34, at short
crystallization times (2 min) the α-phase peak is about the same height as the γ-phase
peak. This suggests that the α-phase and γ phase crystals develop simultaneously. As
the crystallization time increases, the peak associated with the growth of α-phase crystals
reaches a maximum at an earlier time than that associated with the growth of γ -phase
crystals. Similar results were obtained by Alamo et al.82 in the study of polypropylene
with regio-defects. These results agree with the assumption that γ -phase crystals form by
epitaxial nucleation on α-phase crystals using the more defective chain sections. As the
long propylene sequences are used up during the formation of α-phase crystals, the γ -
phase continues growing as long as the shorter polypropylene sequences are available.
The rate of shift of the melting temperature B(Tx) for PE-I (0.0, 320) and PE-II (4.4,
320) is shown in Figure 6.1.35. The shift of the melting temperature with crystallization
time results from the lamellar thickening process and is associated with secondary
crystallization. As the thickness of a lamella increases, its melting temperature increases
as well. Since the lamellar thickening process is made possible by the existence of
conformational motion within the crystal phase, an increase in temperature implies an
increase in the rate of conformational changes, hence, an increase in the rate of lamellar
thickening.134 The values of B(Tx) then should increase with an increase in the
crystallization temperature, as demonstrated in Figure 6.1.35.
The results of the WAXD data analysis support the conclusions reached in the
isothermal crystallization studies of propylene-ethylene copolymers. As the propylene
sequence lengths decrease as a result of the increase in the ethylene concentration, the
amount of the γ -phase crystals increases (Figure 6.1.37).
The ease of formation of γ-phase crystals is also dependent on the crystallization
rate. The copolymers crystallized at slower rates have larger amount of γ-phase crystals
as compared with copolymers crystallized at higher rates. At higher temperatures,
corresponding to the crystallization at the slower rates, only the longer propylene

106
segments can crystallize. For propylene-ethylene copolymers, especially for those with
high ethylene content, the sequences that can crystallize at high temperature necessarily
include a number of ethylene defects. Since α-phase crystals can not accept these
defects, predominantly γ-phase crystals will form. Of course, if the crystallization
temperature is sufficiently high, then the necessary crystallizable sequence must be large.
Consequently, the fraction of chains sections that can crystallize into γ-phase crystals
eventually decreases. At high cooling rates, corresponding to the crystallization at lower
temperature, the shorter sequences without defects can crystallize into α-phase crystals.
Alamo et al.82 demonstrated that with an increase in the crystallization temperature the
content of the γ-phase goes through the maximum. These findings are consistent with the
explanation of the cooling rate effect on the γ-phase crystal content.
The relationship between the defect content, isotactic sequence length and the γ-
phase crystal content is demonstrated in Figure 6.1.38, where the data obtained in this
study is combined with data from Alamo et al.50 and De Rosa et al.124 The increase in the
γ-phase crystal content with isotactic propylene sequence length is clearly demonstrated
by the data of De Rosa et al. These results fit well with the argument that the
introduction of defects into a propylene chain leads to a decrease in the long sequences
and, consequently, to a preferential nucleation of γ-phase crystals from shorter propylene
sequences.
The evolution of the morphology with an increase in ethylene content is further
demonstrated by the results of AFM and SEM studies.
The epitaxial lamellar branching, typical of the polypropylene morphology, is
present in most AFM and SEM micrographs (Figure 6.1.39 and Figure 6.1.40), as
evidenced by crystal orientations at 80° and 100° angles to each other. The 40° angle,
corresponding to γ-phase branching is especially well observed in the AFM micrograph
of PE-II (4.4, 320) material.
In PE-I (0.0, 320) and PE-II (4.4, 320) materials, the spherulitic behavior is
observed, as evidenced by the radial orientation of lamellae. However, as the ethylene
content is increased, the evidence of spherulitic behavior is no longer found. Similar
results were reported by Hosier et al.49 who observed the spherulitic behavior only in the

107
propylene-ethylene copolymers with ethylene concentration below 6 mol%. These
results suggest that the spherulitic lamellar arrangement is disrupted by high
concentration of defects and not by the branching of γ-phase crystals.49
With an increase in ethylene concentration, the amount of amorphous phase present
in the copolymers is increased. This change can be monitored by considering the
increase in the dark areas on the AFM micrographs, corresponding to a presence of a
softer material, for copolymers of increased ethylene content. Also, as the concentration
of ethylene defects increases, α-phase crystals become shorter and thinner (Figure
6.1.40).
These results correlate well with the discussion of the effect of defect concentration
on the morphology of propylene-ethylene copolymers. The increase in ethylene content
leads to a decrease in the length of the crystallizable isotactic polypropylene sequences.
This effect is exemplified by a decrease in length, thickness and number density of the α-
phase lamellae and an increase in length, thickness and number density of the γ-phase
lamellae.

108
7 NUCLEATED COPOLYMERS
In this chapter, the results of studies of P/E-I(8.2, 320) Dow copolymer modified by
four different nucleating agents (vanilla iPP-low MFR, vanilla iPP-high MFR,
commercial HMS iPP and HDPE) will be presented. In the first section, the results of
the crystallization and melting behavior studies of the nucleated copolymers will be
given, followed by the results of morphological studies of these materials. The second
section will contain the discussion of the presented results.
7.1 Results
The apparent heat capacities during crystallization and melting of the P/E-I(8.2,
320) nucleated by 3 wt% of vanilla iPP-low MFR, vanilla iPP-high MFR, commercial
HMS iPP and HDPE additives that were calculated from the DSC data by the method
outlined in Section 5.1, are shown in Figure 7.1.1. The addition of nucleating agent leads
to an increase in the crystallization temperature of the copolymer. As evident from
Figure 7.1.1, the non-nucleated sample has the lowest crystallization temperature. The
order of increase in crystallization temperature as a result of adding 3 wt% of nucleator
from the lowest Tx to the highest is the following: vanilla iPP-low MFR < HDPE <
vanilla iPP-high MFR < HMS iPP. In the copolymer, nucleated by 3 wt% of HMS iPP, a
second crystallization peak is visible at the temperature corresponding to Tx of the non-
nucleated P/E-I(8.2, 320). The crystallization exotherms of nucleated copolymers are
broader than for the virgin copolymer. The apparent melting heat capacities of the
copolymers modified by 3 wt % nucleating agent exhibit three distinct melting peaks.
The lowest temperature peak corresponds to the melting of the non-nucleated P/E-I(8.2,
320).
The effect of the level of nucleating agent on the crystallization heat capacities of
the P/E-I(8.2, 320) copolymer for each additive is demonstrated in Figure 7.1.2. In each
case there is an increase in the crystallization temperature of the materials with an
increase in the concentration of the nucleating agent. In the case of nucleation by vanilla
iPP- high MFR, the second exotherm appears at the Tx corresponding to the

109
a)
1
3
5
7
9
20 40 60 80 100 120 140Temperature, C
Cp,
J/g*
K
8.2PE8.2PE+vanilla iPP -high MFR8.2PE+ vanilla iPP- low MFR8.2PE + commercial HMS iPP8.2PE + HDPE
b)
1.5
2
2.5
3
3.5
4
20 70 120 170 220Temperature, C
Cp,
J/g*
K
8.2PE + vanilla iPP - high MFR8.2PE + commercial HMS iPP8.2PE + vanilla iPP - low MFR8.2PE8.2PE + HDPE
Figure 7.1.1 Effect of the Type of Nucleating Agent at 3wt% on the a) Crystallization DSC Trace, b)
Melting DSC Trace

110
a)
0
4
8
12
16
20 40 60 80 100 120 140 160Temperature, C
Cp,
J/g*
K
P/E I(8.2,320)P/E I(8.2,320) + 1%vanilla iPP - low MFRP/E I(8.2,320) + 3%vanilla iPP - low MFRvanilla iPP - low MFR
b)
0
4
8
12
16
20 40 60 80 100 120 140 160T, C
Cp,
J/g*
K
P/E I(8.2,320)1% vanilla iPP - high MFR3% vanilla iPP - high MFR10% vanilla iPP - high MFRvanilla iPP - high MFR

111
c)
0
4
8
12
16
20 40 60 80 100 120 140 160Temperature,C
Cp,
J/g*
K
P/E I(8.2,320)P/E I(8.2,320) + 1% HMS iPPP/E I(8.2,320) + 3% HMS iPPP/E I(8.2,320) + 10% HMS iPPCommercial HMS iPP
d)
0
4
8
12
16
20 40 60 80 100 120 140 160Temperature, C
Cp,
J/g*
K
P/E I(8.2,320) P/E I(8.2,320) + 1% HDPEP/E I(8.2,320) + 3% HDPEP/E I(8.2,320) + 10% HDPEHDPE
Figure 7.1.2 Effect of Nucleating Agent Content on Crystallization DSC Trace of P/E I (8.2, 320): a) vanilla iPP-low MFR, b) vanilla iPP-high MFR, c) commercial HMS iPP, d) HDPE

112
crystallization temperature of virgin P/E-I(8.2, 320) copolymer, at the concentration of 10
wt% of the nucleator. In the case of nucleation by HMS iPP, the second peak at Tx of
P/E-I(8.2, 320) is present for all nucleator concentrations. In the case of nucleation by
HDPE, the high temperature shoulder appears at the Tx corresponding to the
crystallization temperature of HDPE at the concentration of 3 wt% of the nucleator. The
shoulder develops into a separate high temperature exotherm at the concentration of 10
wt% of the HDPE.
The effect of content in nucleating agent on the apparent melting heat capacities of
the P/E-I(8.2, 320) copolymer is demonstrated in Figure 7.1.3 for each additive. For all
materials, a melting endotherm is observed at the temperature corresponding to the
melting of P/E-I(8.2, 320) copolymer. The second endotherm at the temperature
corresponding to Tm of the nucleator is present in the copolymers modified by vanilla
iPP-low MFR, vanilla iPP-high MFR and commercial HMS iPP. The copolymers
modified by HDPE have two high temperature endotherms, one corresponding to Tm of
HDPE and another, at the temperatures between the Tm of P/E-I(8.2, 320) and Tm of
HDPE.
The effect of content in and type of nucleating agent on the copolymer
crystallization onset is shown in Figure 7.1.4. The increase in crystallization onset
temperature with nucleator concentration is observed for all types of modifiers. Out of
the four nucleating agents, the commercial HMS iPP has the largest impact on the
crystallization onset of P/E-I(8.2, 320) copolymer.
The changes in the morphology of the P/E-I(8.2, 320) copolymer as a result of the
modification by the nucleating agents was studied by means of the WAXD analysis and
SEM.
The results of the WAXD measurements for copolymers nucleated by vanilla iPP-
high MFR, commercial HMS iPP and HDPE are shown in Figure 7.1.5 and Figure 7.1.6.
With the addition of any modifier, the crystallinity of the P/E-I(8.2, 320) decreased. On
the other hand, the amount of γ-phase in the nucleated copolymers increased, especially
in the case of nucleation by HDPE.

113
a)
1
3
5
7
9
20 70 120 170 220Temperature, C
Cp,
J/g*
K
P/E I(8.2,320)P/E I(8.2,320)+ 1% vanilla iPP low MFRP/E I(8.2,320)+ 3% vanilla iPP low MFRvanilla iPP - low MFR
b)
1
3
5
7
9
20 70 120 170 220Temperature, C
Cp,
J/g*
K
PE I (8.2, 320)1% vanilla iPP high MFR3% vanilla iPP - high MFR10% vanilla iPP - high MFRvanilla iPP - high MFR

114
c)
1
3
5
7
9
20 70 120 170 220Temperature,C
Cp,
J/g*
K
P/E I(8.2,320)P/E I(8.2,320) + 1% HMS iPPP/E I(8.2,320) + 3% HMS iPPP/E I(8.2,320) + 10% HMS iPPHMS iPP
d)
1
3
5
7
9
20 70 120 170 220Temperature, C
Cp,
J/g*
K
P/E I(8.2,320) P/E I(8.2,320) + 1% HDPEP/E I(8.2,320) + 3% HDPEP/E I(8.2,320) + 10% HDPEHDPE
Figure 7.1.3 Effect of the Nucleating Agent Content on Melting DSC Trace of P/E I (8.2, 320): a)
vanilla iPP-low MFR, b) vanilla iPP-high MFR, c) commercial HMS iPP, d) HDPE

115
60
70
80
90
100
110
120
130
0 2 4 6 8 10 12Nucleator, wt%
Cry
stal
lizat
ion
Ons
et, C
P/E-I(8.2, 320)vanilla iPP-low MFRvanilla iPP-high MFRcommercial HMS iPPHDPE
Figure 7.1.4 Effect of the Nucleator Type and Level on Crystallization Onset of P/E I (8.2, 320)
0.0
1.0
2.0
3.0
4.0
5.0
6.0
7.0
0 2 4 6 8 10 12Nucleator, wt%
Tota
l Are
a (C
ryst
allin
ity),
Arb
itrar
y U
nits
P/E I (8.2,320)
vanilla iPP- high MFR
commercial HMS iPP
HDPE
Figure 7.1.5 WAXD: Effect of the Nucleator Type and Level on Crystallinity of P/E I (8.2, 320)

116
0.0
10.0
20.0
30.0
40.0
50.0
0 2 4 6 8 10 12Nucleator, wt%
γ/(α
+γ)∗
100,
%
P/E I (8.2,320)
vanilla iPP- high MFR
commercial HMS iPP
HDPE
Figure 7.1.6 WAXD: Effect of the Nucleator Type and Level on γ-Phase content of P/E I (8.2, 320)
The addition of vanilla iPP-low MFR, vanilla iPP-high MFR and commercial
HMS iPP to P/E-I(8.2, 320) leads to a decrease in the length and increase in the thickness
of α-phase crystals, as demonstrated in Figure 7.1.7 and Figure 7.1.8. The addition of
HDPE results in a two-phase morphology with HDPE and P/E-I(8.2, 320) present in
different phases.
a)

117
b)
c)
d) Figure 7.1.7 SEM: Effect of Nucleating Agent Type on Morphology of P/E-1(8.2,320) at 3wt% of
Nucleator a) no nucleator, b) vanilla iPP-low MFR, c) vanilla iPP-high MFR, d) commercial HMS iPP

118
a)
b)
c) Figure 7.1.8 SEM: Effect of vanilla iPP-high MFR Level on Morphology of P/E-1(8.2,320) a) 0wt%,
b) 3wt%, c) 10wt%

119
a)
b) Figure 7.1.9 SEM Effect of HDPE Level on Morphology of P/E-1(8.2,320): a) 1wt%, b) 10wt %

120
7.2 Discussion
Commercially viable materials are required to have short processing times for the
fabrication of a final product from pellets. In order to decrease the polymer solidification
times, the addition of the nucleating agents is often utilized. These additives decrease the
crystallization induction time by providing sites for the nuclei to form. As a result of an
increase in nucleation rate, the average spherulite size usually decreases. The addition of
nucleating agent also generally results in an increase in crystallization temperature.
In this study, the effect of four macromolecular nucleating agents on the properties
of Dow P/E (8.2, 320) copolymer was studied. Three of these nucleating agents, vanilla
iPP-low MFR, vanilla iPP-high MFR and commercial HMS iPP were miscible with the
Dow propylene-ethylene copolymers. The fourth nucleating agent, HDPE, was
immiscible with Dow P/E (8.2, 320) copolymer.
Since the nucleating agents crystallize at higher temperatures than does P/E (8.2,
320) copolymer, they can provide heterogeneous crystalline sites for the nucleation of the
copolymer. Hence, the copolymer is able to crystallize at higher temperature, as shown in
Figure 7.1.1 and Figure 7.1.2. This leads to the formation of thicker lamellae that melts
at higher temperature. The nucleating efficiency increases with an increase in the
temperature at which the nucleating agent crystallizes from the melt. The addition of
nucleating agent also significantly broadens the melting endotherm. This result is
extremely beneficial from the processing point of view, since it increases the ease and the
flexibility of the final product fabrication. The addition of an immiscible nucleating
agent leads to macrophase separation, as is evidenced by the double peaks in both
crystallization and melting heat capacity traces.
The spherulites formed at higher temperature and at higher rate are expected to
impinge earlier than they would have in the absence of the nucleating agent. Since P/E
(8.2, 320) copolymer has a significant number of ethylene defects present in the chain
and the crystallization is carried out at higher temperatures, the availability of long
crystallizable polypropylene sequences free of the ethylene defects is limited. The result
is then the preferential formation of γ-phase crystals as opposed to α-phase crystals.
These argument is supported by the results of the WAXD analysis (Figure 7.1.6) showing

121
an increase in the γ-phase crystal content with content in nucleator. At the same time, a
decrease is observed in the overall crystallinity of the copolymers as shown in Figure
7.1.5.
The crystallization mechanism of non-nucleated copolymers and copolymers
modified by miscible nucleating agents, vanilla iPP-low MFR, vanilla iPP-high MFR and
HMS iPP is similar, as evidenced by the SEM micrographs (Figure 7.1.7, Figure 7.1.8).
All four materials exhibit cross-hatching morphology. With an increase in the
concentration of nucleating agent, the length of α-phase crystals decreases while their
thickness increases. This first effect is indicative of the formation of smaller radius
spherulites resulting from the increased nucleation efficiency. The second effect is
indicative of the presence of thicker lamellae formed as a result of crystallization at
higher temperature.
In the case of nucleation by immiscible HDPE, the macrophase separation is evident
for all concentrations of the nucleating agent (Figure 7.1.9). The copolymer with 1%
HDPE contains drops of HDPE surrounded by cross-hatched regions of P/E (8.2, 320).
As the concentration of HDPE increases, the HDPE migrates to the surface resulting in a
hard skin-core around the propylene-ethylene copolymer.

122
8 SUMMARY AND CONCLUSIONS
The purpose of this work was to establish the property-structure relationships for
novel Dow propylene-ethylene copolymers by studying the melting and crystallization
behavior and morphology of these materials. It was also important to focus on the issue
of ethylene inclusion into the polypropylene crystal and on the effect of inclusion on the
thermodynamic heat of fusion at melting.
In Section 6.2.1, the dependence of crystallization, melting and glass transition
temperatures and crystallinity on ethylene content for the propylene-ethylene copolymers
was studied. A steady decrease in the peak crystallization and melting temperatures, the
glass transition temperature and the crystallinity was observed with increasing ethylene
content for all series of Dow copolymers. The melting offsets of Series I-III copolymers
decreased with increasing ethylene concentration, while the melting offsets of Series VII
and VIII showed only a weak dependence on ethylene content. These trends were
explained by the effect of defect distribution on the length of isotactic polypropylene
sequences. Series I-III of Dow copolymers were shown to have a more or less random
defect distribution along the polypropylene chain, while Series VII and VIII exhibited
blocky behavior with evidence of a high crystalline fraction.
The behavior of Dow propylene-ethylene copolymers was compared to that of the
copolymers prepared with traditional metallocene and Ziegler-Natta catalysts. The
catalyst system used in the polymerization of Dow copolymers was found to be close to
the metallocene catalyst system. However, Dow copolymers were shown to have wider
distribution of isotactic propylene sequence lengths because of the less random
distribution of ethylene defects, especially in the case of series VII and VIII.
In the course of this work, the techniques of crystallinity determination were
reevaluated. It was demonstrated that in order to properly evaluate the crystallinity of
any semicrystalline polymer system, the precise knowledge of the behavior of crystalline
and amorphous material is essential. In the case of a copolymer or a homopolymer with a
substantial amount of regio and stereo defects incorporated into the chain, it is also
important to correctly establish the degree of inclusion of defects into the resulting

123
crystal. The last point stems from the fact that, as was demonstrated by this work, if the
defects are in fact incorporated into the crystal, the thermodynamic heat of fusion at
melting decreases. If an overestimated heat of fusion is used in the crystallinity
calculations, the resulting values of the calculated crystallinity are significantly
underestimated. Since crystallinity is routinely used in material property prediction
models, underestimated crystallinities can result in significant discrepancies between the
models and the actual systems whose behavior they are meant to predict.
In Section 6.2.2, the linear decrease in the thermodynamic heat of fusion with
increase in ethylene defect concentration was clearly demonstrated. On the basis of both
the DSC work and the density measurements, it was shown that the use of an inclusion
model based on the Sanchez-Eby crystallization theory is a valid approach for evaluating
the crystallinities of the given propylene-ethylene system. At the same time,
inadequacies in the application of the rigid amorphous fraction model to copolymers with
included defects were demonstrated.
In Section 6.2.3, the dependence of the Dow copolymer morphology on the
ethylene concentration was demonstrated. It was shown that due to the shortening of
isotactic polypropylene sequences as a result of addition of ethylene units, the amount of
α-phase crystals decreases while the amount of γ-phase crystals increases. Since γ-phase
crystals form thinner lamellae, the melting temperature of γ-phase crystals was lower then
that of the α-phase crystals. It was shown that both phases develop simultaneously. It
was also shown that the formation of the γ-phase crystals is favored by low crystallization
rates, corresponding to the crystallization at higher temperatures.
The cross-hatching morphology was present in all Dow propylene-ethylene
copolymers. With an increase in ethylene concentration and a corresponding decrease in
the isotactic propylene sequence lengths, the density, length and thickness of α-phase
crystals were found to decrease. These results confirmed the conclusions reached earlier
that an increase in ethylene concentration leads to more favorable conditions for the
formation of the γ-phase crystals.
Finally, the effect of modification of P/E-I (8.2, 320) copolymer by four different
nucleating agents, vanilla iPP – low MFR, vanilla iPP – high MFR, commercial HMS iPP
and HDPE, was studied. It was shown that all four nucleating agents amplified the

124
nucleating efficiency of the Dow copolymer. The nucleation efficiency increased with an
increase in the temperature at which the nucleating agent crystallized from the melt.
Vanilla iPP - low MFR, vanilla iPP – high MFR, commercial HMS iPP were miscible
with P/E-I (8.2, 320) copolymer system. HDPE was immiscible with P/E-I (8.2, 320).
The addition of the HDPE resulted in a two-phase system for which, the nucleating agent
was found to migrate to the surface when present in large concentration, resulting in a
skin-core morphology.

125
9 FUTURE WORK
9.1 On the Crystallinity and Thermodynamic Heat of Fusion Calculations
This work demonstrated the necessity of a precise knowledge of the behavior of
crystalline and amorphous phases for crystallinity determinations in semicrystalline
copolymers using either the DSC or the density methods. Since many of the properties
were unavailable for the calculations, the demonstrated trends showed a significant
uncertainty. The accuracy of the crystallinity calculations would be greatly improved if
some of the assumptions used in the calculations could removed.
It was assumed, based on the work of Alamo et al.50, that 42% of the available
ethylene units are included in the propylene crystal. This partitioning coefficient might
not be representative of the Dow copolymer system. The inclusion of the ethylene into
the propylene crystal partly depends on the amount of other defects present in the chain.
Alamo’s work did not address the issue of the partitioning coefficient of the propylene-
ethylene copolymers in the presence of regio and stereo defects nor did it consider the
inclusion of ethylene at the concentrations higher than 7.5 ethylene mol %. The
knowledge of the exact partitioning of the ethylene and other defects between the crystal
and the amorphous phase of the Dow copolymers would improve the accuracy in the
crystallinities obtained from both, the density and the DSC measurements.
The same problem existed in determining the crystal and amorphous densities of
these copolymers. The unit cell volumes used in the calculations were based in one case
on the value of the unit cell dimensions for polypropylene with regio errors and in the
second case, on the unit cell dimensions for propylene-ethylene copolymers having up to
11 ethylene mol% with different regio and stereo defect contents than the materials
studied in this work. The exact knowledge of the unit cell volumes would greatly benefit
the presented crystallinity calculations.
In this work, the WAXD measurements of the crystallinity development as a
material is crystallized at the rate of 10°C/min were not performed. This kind of data

126
would complement the crystallinity development curves obtained by the DSC
measurements.
While the determination of exact heat capacities for the amorphous and the
crystalline materials prior to the study of each new copolymer system might not be
practical, steps can be taken to improve the accuracy of the match between theoretical
and experimental heat capacities in the melt and in the glass regions. If multiple heat
capacity curves for each copolymer were available, their averaging could eliminate some
of the errors due to the DSC instrument behavior variation from run to run.
Finally, the study of the effect of the comonomer inclusion on the thermodynamic
heat of fusion of different copolymer systems would be beneficial. It would help to
reinforce the concepts developed in this study.
9.2 On the Morphology
The isothermal crystallization studies performed as a part of this work, did not
resolve the question of the relative rates of the formation of α- and γ-phase crystals. A
more involved studies where a better deconvolution of the low and high melting
endotherms were performed and the large number of the data points at short
crystallization times, corresponding to primary crystallization, would help to resolve this
issue.
It has been demonstrated by the results of the isothermal crystallization studies that α
and γ-phases develop simultaneously. These results can be further confirmed by
performing the WAXD experiments at the experimental conditions resembling those used
in the DSC work. Since the positions of the peaks corresponding to α- and γ-phases are
known, the exact time of the formation of each phase can be accurately determined form
this kind of WAXD data.

127
10 REFERENCES 1 Mangonon P.L., The Principles of Materials Selection for Engineering Design,
Prentice-Hall, Inc., 1999, ch.15 2 Callister W.D., Materials Science and Engineering, an Introduction, John Willey &
Sons, Inc., 3rd ed., 1994, ch.16 3 G.Odian, Principles of Polymerization, 3rded., John Wiley & Sons Inc., New York,
1991, ch.8 4 Rempp P., Merill E.W., Polymer Synthesis, 2nded., John Wiley & Sons Inc., 1991, ch.8 5 Swogger K., Poon B.C., Stephens C.H., Ansems P., Chum S., Hiltner A., Baer E.,
Annual Conference – Society of Plastics Engineers, 2003, 61, 1768-1774 6 Young R.J., Introduction to Polymers, Chapman and Hall, Ltd., 1989, ch.2 7 Sperling L.H., Introduction to Physical Polymer Science, 2nded., John Wiley & Sons
Inc., New York, 1992, ch.2, pp. 23-64 8 Sanders J.M., Komorski R.A., Macromolecules, 1977, 10, 1214-704 9 Janimak J., Cheng S., Giusti P., Hsieh E., Macromolecules, 1991, 24, 2253-2260 10 Keith H., Padden F., J. Appl. Phys., 1963, 34, 2409-2421 11 Hoffman J., Davis G., Lauritzen J., Treatise on Solid State Chemistry, Vol 3,
Crystalline and Noncrystalline Solids, Hannay N., Ed. Plenum Press, New York., 1976, ch.7
12 Keller A., Goldbeck-Wood G., Comprehensive Polymer Science, 2nd Supplement, Aggarual R., Ed. Elsevier, Oxford, 1996, ch.7
13 Keith H., Padden F., Vadimsky R., J. Appl. Phys., 1971, 42, 4585-4592 14 Keith H., J. Polym. Sci. A, 1964, 42, 4339-4360 15 Sperling L.H., Introduction to Physical Polymer Science, 2nded., John Wiley & Sons
Inc., New York, 1992, ch.6, pp. 198-278 16 Khoury F., Passaglia E., Treatise on Solid State Chemistry, Vol 3, Crystalline and
Noncrystalline Solids, Hannay N., Ed. Plenum Press, New York, 1976, ch.6 17 Keith H., The Physics and Chemistry of the Organic Solid State, Interscience
Publishers, Inc., New York 1963 18 Alizadeh A., Sohn S., Quinn J., Marand H., Shank L., Iler H., Macromolecules, 2001,
34, 4066-4078 19 Sanchez I., Colson J., Eby R., J. Appl. Phys., 1973, 44, 4332-4339 20 Marand H., Alizadeh A., Farmer R., Desai R., Velikov V., Macromolecules, 2000, 33,
3392-3403 21 Sadler D., Polymer, 1983, 24, 1401-1409 22 Sadler D., Gilmer G., Polymer, 1984, 25, 1446-1452 23 Lauritzen J., Hoffman J., J. Appl. Phys., 1973, 44, 4340-4352 24 Clark E.J., Hoffman., Macromolecules, 1984, 17, 878-885 25 Hoffman J., Miller R., Polymer, 1997, 38 , 3151-3212 26 Armstead J., Hoffman J., Macromolecules, 2002, 35, 3895-3913 27 Bates F., Fredrickson G., Physics Today, 1999,52, 32-38

128
28 Evans R., Mighton H., Flory P., J. Am. Chem. Soc.,, 1950, 72, 2018-2528 29 Flory P., Mandelkern L., Hall H., J. Am. Chem. Soc., 1951, 73, 2532-2538 30 Flory P., Trans. Faraday Soc., 1955, 51, 848-857 31 Lauritzen J., DiMarzio E., Passaglia E., J. Chem. Phys., 1966, 45, 4444-4454 32 Helfand E., Lauritzen J., Macromolecules, 1973, 6, 631-638 33 Colson J., Eby R., J. Appl. Phys., 1966, 37, 3511-3514 34 Sanchez I., Eby R., J. Res. Nat. Bur. Stand., Part A- Phys. Chem., 1973, 77a, 353-358 35 Sanchez I., Eby R., Macromolecules, 1975, 8, 638-641 36 Fischer E., Sterzel H., Wegner G ., Kolloid Z. Z. Polym., 1973, 251, 980-990 37 Zimmermann H.J., J. Macromol. Sci., Phys., 1993, B32, 141-161 38 Bruckner S., Phillips P., Mezghani K., Meille S.V., Makromol. Chem.: Rapid
Commun., 1997, 18, 1-7 39 Feng Y., Hay J.N., Polymer, 1998,39, 6589-6596 40 Feng Y., Hay J.N., Polymer, 1998, 39, 6723-6731 41 Laihonen S., Gedde U.W., Werner P.-E., Martinez-Salazar J., Polymer, 1997, 38, 361-
369 42 Laihonen S., Gedde U.W., Werner P.-E., Westdahl M., Jaaskelainen P., Martinez-
Salazar J., Polymer, 1997, 38, 371-377 43 De Rosa C., Auriemma F., Vinti V., Grassi A., Galimberti M., Polymer, 1998, 39,
6219-6226() 44 De Rosa C., Auriemma F., Talarico G., Busico V., Caporaso L., Capitani D.,
Macromolecules, 2002, 35, 1314- 1318 45 Auriemma F., De Rosa C., Macromolecules, 2002, 35, 9057-9068 46 De Rosa C., Auriemma F., Fanelli E., Talarico G., Capitani D., Macromolecules,
2003, 36, 1850-1864 47 Starkweather, Van-Catledge F., MacDonald R., Macromolecules, 1982, 15, 1600-1604 48 Busico V., Corradini P., De Rosa C., Di Benedetto E., Eur. Polym. J., 1985, 21, 239-
244 49 Hosier I.L, Alamo R.G., Lin J.S.., Polymer, 2004, 45, 3441-3455 50 Alamo R.G., VanderHart D.L., Nyden M.R., Mandelkern L., Macromolecules, 2000,
33, 6094-6105 51 Turner-Jones A., Polymer, 1971, 12, 487-508 52 Kim M.-H., Alamo R.G., Lin J.S., Polym. Eng. Sci., 1999, 39, 2117-2131 53 Avella M., Martuscelli E., Della Volpe G., Segre A., Rossi E., Simonazzi T.,
Makromol. Chem., 1986, 187, 1927-1943 54 De Rosa C., Auriemma F., Capitani D., Caporaso L., Talarico G., Polymer, 2000, 41,
2141-2148 55 De Rosa C., Talarico G., Caporaso L., Auriemma F., Galmberti M., Fusco O.,
Macromolecules, 1998, 31, 9109-9115 56 Lotz B., Eur. Polym. J. E, 2000, 3, 185-194 57 Bruckner S., Meille S.V., Petraccone V., Pirozzi B., Prog. Polym. Sci., 1991, 16, 361-
404 58 Bruckner S., Meille S.V., Sozzani P., Torri G., Makromol. Chem.: Rapid Commun.,
1990, 11, 55-60

129
59 Meille S.V., Ferro D.R., Bruckner S., Lovinger A.J., Padden F.J., Macromolecules,
1994, 27, 2615-2622 60 Ferro D.R., Meille S.V., Bruckner S., Macromolecules, 1998, 31, 6926-6934 61 Meille S.V., Ferro D.R., Bruckner S., Macromol. Symp., 1995, 89, 499-511 62 Turner-Jones A., Cobbold A.J., J. Polym. Sci.. Part B, Polym. Letters, 1968, 6, 539-
546 63 Marigo A., Marega C., Zanetii R., Fichera A., Ferrari P., Macromol. Chem. Phys.,
1995, 196, 3577-3584 64 Lotz B., Wittmann J.C., Lovinger A.J., Polymer, 1996, 37, 4979-4992 65 Lotz B., Wittmann J.C., J. Polym. Sci.: Part B: Polym. Phys., 1986, 24, 1541-1558 66 Auriemma F., de Ballesteros O.R., De Rosa C., Corradini P., Macromolecules, 2000,
33, 8764-8774 67 De Rosa C., Guerra G., Napolitano R., Petraccone V., Pirozzi B., Eur. Polym. J., 1984,
20, 937-941 68 Bruckner S., Meille S.V., Nature, 1989, 340, 455-457 69 Meille S.V., Bruckner S., Porzio W., Macromolecules, 1990, 23, 4114-4121 70 Turner-Jones A., Aizlewood J.M., Beckett D.R., Makromol. Chem., 1964, 75, 134-158 71 Marigo A., Marega C., Zanetii R., Paganetto G., Canossa E., Coletta F., Gottardi F.,
Makromol. Chem., 1989, 190, 2805-2813 72 Meille S.V., Phillips P., Mezghani K., Bruckner S., Macromolecules, 1996, 29, 795-
797 73 Campbell R.A., Phillips P., Lin J.S., Polymer, 1993, 34, 4809-4816 74 Pae K., Morrow D., Sauer J., Nature, 1966, 211, 514-515 75 Mezghani K., Phillips P., Polymer, 1997, 38, 5725-5733 76 Mezghani K., Phillips P., Polymer, 1998, 39, 3735-3744 77 Mezghani K., Phillips P., Polymer, 1995, 36, 2407-2411 78 Guidetti G.P., Busi P., Giulianelli I., Zanetti R., Eur. Polym. J. E, 1983, 19, 757-759 79 Marigo A., Marega C., Zanetii R., Paganetto G., Schmidt S., Zachmann H.G.,
Makromol. Chem., 1990, 191, 1967-1971 80 Auriemma F., De Rosa C., Boscato T., Corradini P., Macromolecules, 2001, 34, 4815-
4826 81 Meille S.V., Ferro D.R., Bruckner S., Macromol. Symp., 1995, 89, 499-511 82 Alamo R.G., Kim M.-H., Galante M.J., Isasi J.R., Mandelkern L., Macromolecules,
1999, 32, 4050-4064 83 Yamada K., Matsumoto S., Tagashira K., Hikosaka M., Polymer, 1998, 22, 5327-5333 84 Burfield D.R., Doi Y., Macromolecules, 1983, 16, 702-704 85 VanderHart D.L., Alamo R.G., Nyden M.R., Kim M.-H., Mandelkern L.,
Macromolecules, 2000, 33, 6078-6093 86 Nyden M.R., Vandehart D.L., Alamo R.G., Computational and Theoretical Polymer
Science, 2001, 11, 175-189 87 Sperling L.H., Introduction to Physical Polymer Science, 2nded., John Wiley & Sons
Inc., New York, 1992, ch.8 88 Mandelkern L., Physical Properties of Polymers., Ch 4, The Crystalline State, 2nded.,
ACS., Washington DC, 1993 89 Wunderlich B., Prog. Polym. Sci., 2003, 28, 383-450

130
90 Pak J., Pyda M., Wunderlich B., Macromolecules, 2003, 36, 495-499 91 Grebowicz J., Lau S.-F., Wunderlich B., J. Polym. Sci: Polym. Symp, 1984, 71, 19-37 92 Cheng S., Cao M.-Y., Wunderlich B., Macromolecules, 1986, 19, 1868-1876 93 Suzuki H., Grebowicz J., Wunderlich B., Br. Polym. J., 1985, 17, 1-3 94 Suzuki H., Grebowicz J., Wunderlich B., Makromol. Chem., 1985, 186, 1109-1119 95 Huo P., Cebe P., J. Polym. Sci: Part B: Polym. Phys. ed, 1992, 30, 239-250 96 Mandelkern L., J. Phys. Chem., 1971, 75, 3909-3920 97 Gaur U., Wunderlich B., Macromolecules, 1980, 13, 445-446 98 Kunz M., Moller M., Heinrich U.-R., Cantow H.-J, Makromol. Chem., Macromol.
Symp, 1988, 20/21, 147-158 99 Kunz M., Moller M., Heinrich U.-R., Cantow H.-J, Makromol. Chem., Macromol.
Symp, 1989, 23, 57-72 100 Menczel J., Wunderlich B., J. Polym. Sci: Polym. Letters Ed., 1981, 19, 261-264 101 Huo P., Cebe P., Colloid Polym. Sci., 1992, 270, 840-852 102 Fischer E., Fakirov S., J. Mat. Sci., 1976, 11, 1041-1065 103 Bornschhlegl E., Bonart R., Colloid Polym. Sci., 1980, 258, 319-331 104 Wunderlich B., Macromolecular Physics, Ch.5, Vol 2. Crystal Nucleation, Growth,
Annealing, Academic Press, New York, 1976 105 Feng Y., Jin X., J. Appl. Polym. Sci., 1998, 72, 1559-1564 106 Basset D., Principles of Polymer Morphology, Ch.2, Cambridge University Press,
Cambridge, 1981 107 Gahleitner M., Wolfschwenger J., Bachner C., Bernreitner K., Neibl W., J. Appl.
Polym. Sci., 1996, 61, 649-657 108 Wittmann J., Lotz B., Polym. Sci.: Part B: Polym. Phys., 1981, 19, 1837-1851 109 Wittmann J., Hodge A., Lotz B., Polym. Sci.: Part B: Polym. Phys., 1983, 21, 2495-
2509 110 Khanna Y., Macromolecules, 1993, 26, 3639-3643 111 Smith L., Masilamani D., Bui L., Khanna Y., Bray R., Hammond W., Curran S.,
Belles Jr. J., Binder-Castelli S., Macromolecules, 1994, 27, 3147-3155 112 Carroll C., Modern Plastics, 1984, 61, 108-112 113 Sterzynski T., Lambla M., Crozier H., Adv. Polym, Technol. 1994, 13, 25-36 114 Kristiansen M., Werner M., Tervoort T., Smith P., Blomenhofer M., Schmidt H.-W.,
Macromolecules, 2003, 36, 5150-5156 115 Martin C., Vaughan A., Sutton S., Swingler S., J. Polym. Sci.: Part B: Polym. Phys.,
2002, 40, 2178-2189 116 Thierry A., Straupe C., Lotz B., Wittmann J., Progr. Colloid Polym. Sci., 1992, 87,
28-31 117 Mathot V., Calorimetry and Thermal Analysis of Polymers, ch.5, Thermal
Characterization of States of Matter, Mathot V., Ed., Hanser Publishers, New York, 1994
118 Dai P.S., Cebe P., Capel M., Alamo R.G., Mandelkern L., J. Appl. Cryst., 2000, 33, 714-717
119 Ditmars D., Ishihara S., Chang S., Bernstein G., West E., J. Res. Nat. Bur. Stand., 1982, 2, 159-163

131
120 Wunderlich B., ATHAS – Table of Thermal Properties, University of Tennessee,
Knoxville, 2003 121 Private communication with Dr. Marek Pyda, ATHAS and Polymer Characterization
Laboratory Director, University of Tennessee 122 Isasi J.R., Mandelkern L., Galante M.J., Alamo R.G., J. Polym. Sci.: Part B: Polym.
Phys., 1999, 37, 323-334 123 Isasi J.R., Alamo R.G., Mandelkern L., J. Polym. Sci.: Part B: Polym. Phys., 1997, 35,
2511-2521 124 De Rosa C., Auriemma F., Circelli T., Waymouth R., Macromolecules, 2002, 35,
3622-3629 125Ojeda T., Liberman S., Amorim R., J. Polym. Eng., 1996/1997, 16, 105-120 126 A. Kumar, M.S. Thesis, Virginia Polytechnic Institute and State University, 2001 127 Private communication from Dow Chemical 128 Gan S, Burfield D.R., Macromolecules, 1985, 18, 2684-2688 129 Zhang F., Gong Y., He T., Eur. Polym. J., 2003, 39, 2315-2322 130 Nozaki K., Endo Y., Yamamoto T., Naiki M., J. Macromolecular Sci.: Part B – Phys.,
2003, B42, 697-707 131 De Rosa C., Auriemma F., Spera C., Talarico G., Tarallo O., Macromolecules, 2004,
37, 1441-1454 132 Gaur U., Wunderlich B., J. Phys. Chem. Ref. Data, 1981, 10, 1051-1064 133 Ferro D.R., Bruckner S., Meille S.V., Ragazzi M., Macromolecules, 1992, 25, 5231-
5235 134 Marand, H; Huang, Z., Macromolecules, 2004, 37, 6492-6497

132
APPENDIX 1
The algorithm of crystallinity calculations using the measured heat capacity (Cpapp),
theoretical amorphous (Cpl) and crystalline (Cpc) heat capacities and the thermodynamic
heat of fusion ∆Hf(T).
T6 T0T1T2T3T4T5T7T8
Cpl(T)
Cpc(T)
Cpapp(T)
∆H10
Cpb(T1)
∆Hsupp(2)
∆H20
Cpb(T2)
∆Hsupp(3)
T6 T0T1T2T3T4T5T7T8
Cpl(T)
Cpc(T)
Cpapp(T)
∆H10
Cpb(T1)
∆Hsupp(2)
∆H20
Cpb(T2)
∆Hsupp(3)
1) =∆ )1(0H area between bCp and Cp in the temperature range of 10 TT −
)1(pbC∆ - change in the baseline heat capacity due to crystallization between 10 TT − )1(pbC∆ <0
)()()1( 10
11 TCTCC pbpbpb −=∆
)()( 111 TCTC app
ppb =
)()( 110 TCTC L
ppb =
))()(()(
)1()1( 111
0
TCTCTH
HC Lp
cp
fpb −⋅
∆∆
=∆

133
)1()1( 0HH ∆=∆
)1()1()(
)1()1( 0
1
0
HHTH
HXf
C ∆=∆∆∆
= total crystallinity at T1
2)
)2()2()1()2( sup0
pHHHH ∆+∆+∆=∆ - total heat at crystallization at T2
)()1()2( 12sup TTCH pbp −⋅∆=∆
)()1()2()1()2(
2THHHXH
fcC ∆
∆−∆+=
=∆ )2(pbC change in heat capacity from baseline (liquid CpL) to Cp
sc(T2) due to crystallization between T0 and T2
))()(()2()2( 12 TCTCHC Lp
cpcpb −⋅=∆
3)
)3()3()2()3( sup0
pHHHH ∆+∆+∆=∆ )()2()3( 23sup TTCH pbp −⋅∆=∆
)()2()3()2()3(
3THHHXH
fcC ∆
∆−∆+=
))()(()3()3( 33 TCTCHC Lp
cpcpb −⋅=∆

134
VITA
Julie Uan-Zo-li, daughter of Tamara Golovach and Mikhail Dvorkin, was born on
March 19, 1973 in Minsk, Belarus. She attended the city school of Minsk from 1980 to
1990 and the nursing school from 1990 to 1991. In December of 1991, Julie immigrated
to the United States. In 1993 she graduated from Eagan High School in Eagan, MN after
attending University of St. Thomas in St. Paul, MN as a part of the post-secondary
program. In June of 1996, she graduated with a Bachelor of Science degree in Chemical
Engineering from the University of Minnesota. While at the University of Minnesota
Julie worked as a technical aide at 3M Science Research Laboratory. In December of
2001 Ms. Uan-Zo-li received a masters degree in Materials Science and Engineering
from the Virginia Polytechnic Institute and State University. In January 2002, she joined
Dr. Marand’s research group at VPI & SU.


![Surface Morphology in Selective Laser Melting of Metal Powders · 2017. 1. 23. · selective laser melting. Based on previously experimental results [8], the laser irradiation parameters](https://static.fdocuments.net/doc/165x107/60b33a662dca0e345c03e8ff/surface-morphology-in-selective-laser-melting-of-metal-powders-2017-1-23-selective.jpg)