
Morphology, composition and mixing state of individual ...
15
Atmos. Chem. Phys., 12, 693–707, 2012 www.atmos-chem-phys.net/12/693/2012/ doi:10.5194/acp-12-693-2012 © Author(s) 2012. CC Attribution 3.0 License. Atmospheric Chemistry and Physics Morphology, composition and mixing state of individual carbonaceous aerosol in urban Shanghai H. Fu 1 , M. Zhang 1,5 , W. Li 3 , J. Chen 1,2 , L. Wang 1 , X. Quan 4 , and W. Wang 3 1 Department of Environmental Science and Engineering, Fudan University, Shanghai 200433, China 2 Research Institute for the Global Environment Change, Fudan University, Shanghai 200433, China 3 Environment Research Institute, Shandong University, Jinan Shandong 250100, China 4 College of Environment and Life, Dalian University of Technology, Dalian Liaoning 116024, China 5 Key Laboratory of Data Analysis and Applications, The First Institute of Oceanography, State Oceanic Administration, Qingdao, 266061, China Correspondence to: J. Chen ([email protected]) Received: 25 May 2011 – Published in Atmos. Chem. Phys. Discuss.: 26 July 2011 Revised: 23 November 2011 – Accepted: 8 December 2011 – Published: 16 January 2012 Abstract. A total of 834 individual aerosol particles were collected during October and November 2010 in urban Shanghai, China. Particles were sampled under different weather and air quality conditions. Morphologies, compo- sitions and mixing states of carbonaceous aerosols were in- vestigated by transmission electron microscopy (TEM) cou- pled with energy-dispersive X-ray (EDX). Structures of some particles were verified using selected-area electron diffrac- tion (SAED). Among the aerosol particles observed, car- bonaceous aerosols were mainly categorized into four types: polymeric organic compound (POC), soot, tar ball, and bio- genic particle. Based on the detailed TEM-EDX analysis, most of the particles were coated with secondary organic aerosols (SOA), which commonly formed through conden- sation or heterogeneous reactions of precursor gases on pre- existing particles. Aged particles were associated with days with low wind velocities, showed complex structures, and were bigger in size. The internally mixed particles of sul- phates, organics and soot were encountered frequently. Such internally mixed particles may be preferentially formed dur- ing a stagnated air mass during serious pollution events, such as on 13 November. Although relative number counts var- ied with different species, sulphates (38–71 %) and soot (11– 22 %) constituted the most dominant species observed in the samples. However, soil-derived particles (68%) were rela- tively more frequently observed on the sample collected on 12 November during a dust storm. 1 Introduction Carbonaceous aerosols exert great influence on climate by changing the energy transfer through the atmosphere, and potentially affect public health as carriers of toxic chemicals (Jacobson, 2001; Ramana et al., 2010; Utsunomiya et al., 2002; Menon et al., 2002). Carbonaceous aerosols also sup- ply surfaces for heterogeneous chemical reactions to occur upon in the atmosphere, and alter the regional biogeochem- ical cycle by their long-range transport with nutrient species (Adachi et al., 2010; Geng et al., 2010a; Ro et al., 2005; Utsunomiya et al., 2004). Generally, carbonaceous aerosols in ambient air are broadly differentiated into two main frac- tions: elemental carbon (EC) and organic carbon (OC). EC is often used interchangeably with black carbon (BC) in terms of light absorbing (Jacobson, 2001; Andreae and Gelencs´ er, 2006). OC in aerosols ranges from small molecules such as oxalic acids, to polycyclic aromatic hydrocarbons, to viable bacteria, fungi, and spores, to secondary OC aerosols formed initially by oxidation of volatile organics (Pan et al., 2007). Carbonaceous aerosols have direct effects on climate by scattering and absorbing solar radiation. Soot particles pro- duce a net warming effect through absorption of sunlight (Ramanathan et al., 2008). The IPCC report indicates that their global, annual mean clear-sky radiative forcing is ap- proximately 0.34 Wm -2 , making them the largest contrib- utor to global warming after carbon dioxide and methane (IPCC, 2007). In high pollution areas such as Mexico City and Beijing, much of the soot particles are embedded with OC together with materials such as ammonium sulphate Published by Copernicus Publications on behalf of the European Geosciences Union.
Transcript of Morphology, composition and mixing state of individual ...

Atmos. Chem. Phys., 12, 693–707, 2012www.atmos-chem-phys.net/12/693/2012/doi:10.5194/acp-12-693-2012© Author(s) 2012. CC Attribution 3.0 License.
AtmosphericChemistry
and Physics
Morphology, composition and mixing state of individualcarbonaceous aerosol in urban Shanghai
H. Fu1, M. Zhang1,5, W. Li 3, J. Chen1,2, L. Wang1, X. Quan4, and W. Wang3
1Department of Environmental Science and Engineering, Fudan University, Shanghai 200433, China2Research Institute for the Global Environment Change, Fudan University, Shanghai 200433, China3Environment Research Institute, Shandong University, Jinan Shandong 250100, China4College of Environment and Life, Dalian University of Technology, Dalian Liaoning 116024, China5Key Laboratory of Data Analysis and Applications, The First Institute of Oceanography, State Oceanic Administration,Qingdao, 266061, China
Correspondence to:J. Chen ([email protected])
Received: 25 May 2011 – Published in Atmos. Chem. Phys. Discuss.: 26 July 2011Revised: 23 November 2011 – Accepted: 8 December 2011 – Published: 16 January 2012
Abstract. A total of 834 individual aerosol particles werecollected during October and November 2010 in urbanShanghai, China. Particles were sampled under differentweather and air quality conditions. Morphologies, compo-sitions and mixing states of carbonaceous aerosols were in-vestigated by transmission electron microscopy (TEM) cou-pled with energy-dispersive X-ray (EDX). Structures of someparticles were verified using selected-area electron diffrac-tion (SAED). Among the aerosol particles observed, car-bonaceous aerosols were mainly categorized into four types:polymeric organic compound (POC), soot, tar ball, and bio-genic particle. Based on the detailed TEM-EDX analysis,most of the particles were coated with secondary organicaerosols (SOA), which commonly formed through conden-sation or heterogeneous reactions of precursor gases on pre-existing particles. Aged particles were associated with dayswith low wind velocities, showed complex structures, andwere bigger in size. The internally mixed particles of sul-phates, organics and soot were encountered frequently. Suchinternally mixed particles may be preferentially formed dur-ing a stagnated air mass during serious pollution events, suchas on 13 November. Although relative number counts var-ied with different species, sulphates (38–71 %) and soot (11–22 %) constituted the most dominant species observed in thesamples. However, soil-derived particles (68 %) were rela-tively more frequently observed on the sample collected on12 November during a dust storm.
1 Introduction
Carbonaceous aerosols exert great influence on climate bychanging the energy transfer through the atmosphere, andpotentially affect public health as carriers of toxic chemicals(Jacobson, 2001; Ramana et al., 2010; Utsunomiya et al.,2002; Menon et al., 2002). Carbonaceous aerosols also sup-ply surfaces for heterogeneous chemical reactions to occurupon in the atmosphere, and alter the regional biogeochem-ical cycle by their long-range transport with nutrient species(Adachi et al., 2010; Geng et al., 2010a; Ro et al., 2005;Utsunomiya et al., 2004). Generally, carbonaceous aerosolsin ambient air are broadly differentiated into two main frac-tions: elemental carbon (EC) and organic carbon (OC). EC isoften used interchangeably with black carbon (BC) in termsof light absorbing (Jacobson, 2001; Andreae and Gelencser,2006). OC in aerosols ranges from small molecules such asoxalic acids, to polycyclic aromatic hydrocarbons, to viablebacteria, fungi, and spores, to secondary OC aerosols formedinitially by oxidation of volatile organics (Pan et al., 2007).
Carbonaceous aerosols have direct effects on climate byscattering and absorbing solar radiation. Soot particles pro-duce a net warming effect through absorption of sunlight(Ramanathan et al., 2008). The IPCC report indicates thattheir global, annual mean clear-sky radiative forcing is ap-proximately 0.34 Wm−2, making them the largest contrib-utor to global warming after carbon dioxide and methane(IPCC, 2007). In high pollution areas such as Mexico Cityand Beijing, much of the soot particles are embedded withOC together with materials such as ammonium sulphate
Published by Copernicus Publications on behalf of the European Geosciences Union.

694 H. Fu et al.: Morphology, composition and mixing state of individual carbonaceous aerosol
(Adachi and Buseck, 2008; Li et al., 2010; Li and Shao,2009a). These embedding materials and coatings act aslenses that focus light on soot and thus amplify absorption(Adachi et al., 2007). Jacobson (2001) suggests that inter-nally mixed soot particles, commonly present in the atmo-sphere, could be the second most significant component ofglobal warming. OC consists of primary organic aerosolsand secondary organic aerosols, having highly variable op-tical properties. Light-absorbing organic aerosol is tenta-tively named “brown carbon” and may be associated withhigh molecular weight humic-like substances (HULIS) frombiomass burning or soil deflation (Alexander et al., 2008;Hoffer et al., 2006). HULIS not only leads to the efficientabsorption of solar radiation in the UV and visible range,but also exhibits much stronger wavelength dependence atshorter wavelengths than EC (Alexander et al., 2008). At-mospheric models of the climate effects of carbonaceousaerosols assume that no light-absorbing particles are pro-duced in the air by secondary mechanisms. The main op-tical effect of light-coloured OC from secondary emission isthought to be scattering of sunlight, resulting in a net coolingeffect on global climate (Chung and Seinfeld, 2002).
Besides, carbon-bearing particles can serve as cloud con-densation nuclei (CCN) and may affect the formation, cover-age, and lifetime of clouds, thereby having an indirect effecton climate (Sun and Ariya, 2006). Recent studies on atmo-spheric aerosols have shown that OC aerosols are an impor-tant part of the global CCN budget. Their activation capabil-ity is assumed to be comparable to that of sulphate aerosols,which is considered the most effective CCN (Sun and Ariya,2006). Both organic acids and HULIS have been identifiedas the predominant constituents of organic CCN (Sun andAriya, 2006). Furthermore, OC aerosols can alter the hygro-scopic properties and CCN activity of inorganic particles bytheir mixing states. Inorganic particles with hygroscopic OCcoatings tend to be more spherical and larger and more hy-drophilic, enhancing their light scattering and CCN activity,both of which have cooling effects on the climate (Freneyet al., 2010; Semeniuk et al., 2007). Field measurementshave shown that a significant fraction of both continentaland marine inorganic aerosols are coated by organic films(Li et al., 2003a; Niemi et al., 2006; Russell et al., 2002).This widespread occurrence of mixed organic and inorganicspecies within the same particle implies a broad impact onthe global radiation balance. BC may play an important, butas yet undetermined, role in the cloud formation processes.Decesari et al. (2002) reported that the soot oxidation pro-cess caused the formation of HULIS, which may be poten-tial CCN precursors. The CCN ability of collapsed agedsoot particles was further recognized by Zuberi et al. (2005)through laboratory studies. In light of these observations,Sun and Ariya (2006) speculated that the CCN activity ofsoot particles may not be neglected when considering theirindirect radiative forcing.
Carbonaceous aerosol emissions in China are large and areestimated to account for around one-fourth of global anthro-pogenic carbonaceous aerosols (Menon et al., 2002; Zhouet al., 2009). Enhanced emissions due to the increased us-age of fossil fuels, combined with biomass burning and soildust, have been causing serious air pollution in urban areasand frequently extend to regional haze episodes (Li et al.,2010; Li and Shao, 2009a, 2010). It was well known thatcarbonaceous particles emitted from intense biomass burningcontribute significantly to the seasonal brown hazes in north-ern China (Li et al., 2010). Anthropogenic aerosols emittedfrom the developing megacities in China may have alteredthe regional atmospheric circulation, probably leading to in-creased summer flooding in the south and enhanced droughtin the north (Menon et al., 2002). Clearly, a complete under-standing of unique characteristics of anthropogenic aerosols,particularly carbonaceous aerosols, in the chemically rich at-mosphere of China, must be conducted before the climateimpacts of aerosols can be evaluated for China.
Our knowledge of Chinese urban aerosols is mostly in-debted to extensive studies using bulk analysis methods.These studies have provided useful insights into the generalcharacteristics of aerosols, including their concentrations,distributions and seasonal patterns (Zhou et al., 2009; Sun etal., 2006). However, urban aerosols are chemically and mor-phologically heterogeneous, so that the average compositiondoes not describe well the population of the particles. Di-rect evidence of the composition and morphology of aerosolparticles can be provided by single particle analysis (Geng etal., 2010b; Ro et al., 2005; Utsunomiya et al., 2004). Theanalytical TEM has been proven extremely useful for char-acterizing aerosols, especially for internally mixed particles,which is a unique source of information on particle coatings,agglomeration, and possible atmospheric reactions (Adachiet al., 2007; Freney et al., 2010). By using TEM techniques,Buseck et al. (2010) supplied visual evidence that the radia-tive property of soot was determined, to a large extent, by themixing state of soot within individual particles, suggestingthat the external mixing assumption is unrealistic for manyatmospheric situations (Adachi et al., 2008, 2010; Frency etal., 2010). Based on the work of Buseck’s group, we can sup-pose that the core-shell model used in current studies doesnot properly represent the shapes of ambient soot particles.Very recently, Posfai and Buseck (2010) reviewed the resultsof individual particle studies that use microscopy-based tech-niques, emphasizing TEM and focusing on achievements ofthe past ten years.
Shanghai is an international metropolis near the EastChina Sea with a population of over 18 million (31◦23′ N,121◦48′ E), which is home to China’s largest petrochemi-cal complex, steel makers, incinerators, and a seaport. Thelarge usage of coal and biofuel burning, the increasing num-ber of automobiles, rapid urbanization, and flourishing con-struction activities are all causing the high aerosol loadings(Gao et al., 2009; Ramana et al., 2010; Zhou et al., 2009).
Atmos. Chem. Phys., 12, 693–707, 2012 www.atmos-chem-phys.net/12/693/2012/

H. Fu et al.: Morphology, composition and mixing state of individual carbonaceous aerosol 695
These factors make Shanghai air pollution difficult to con-trol (Fu et al., 2008). To date, carbonaceous aerosols emittedfrom Shanghai are still not well known, especially by sin-gle particle analysis, although they may have a significantimpact on not only air quality of Yangtze River Delta butalso climate changes of east China. Toward this end wehave employed the TEM-EDX technique to characterize car-bonaceous aerosols in Shanghai. High-angle annular dark-field scanning transmission electron microscopy (HAADF-STEM) was used to create maps of element distributions ofa single particle, and chemical inhomogeneities can be vi-sualized within complex particles. We expected to gain in-sight into their formation and sources on local, regional, andlong-range levels, and to possibly make a contribution to thedetermination of the impact of these aerosols on regional airpollution in east China.
2 Experimental
2.1 Sampling
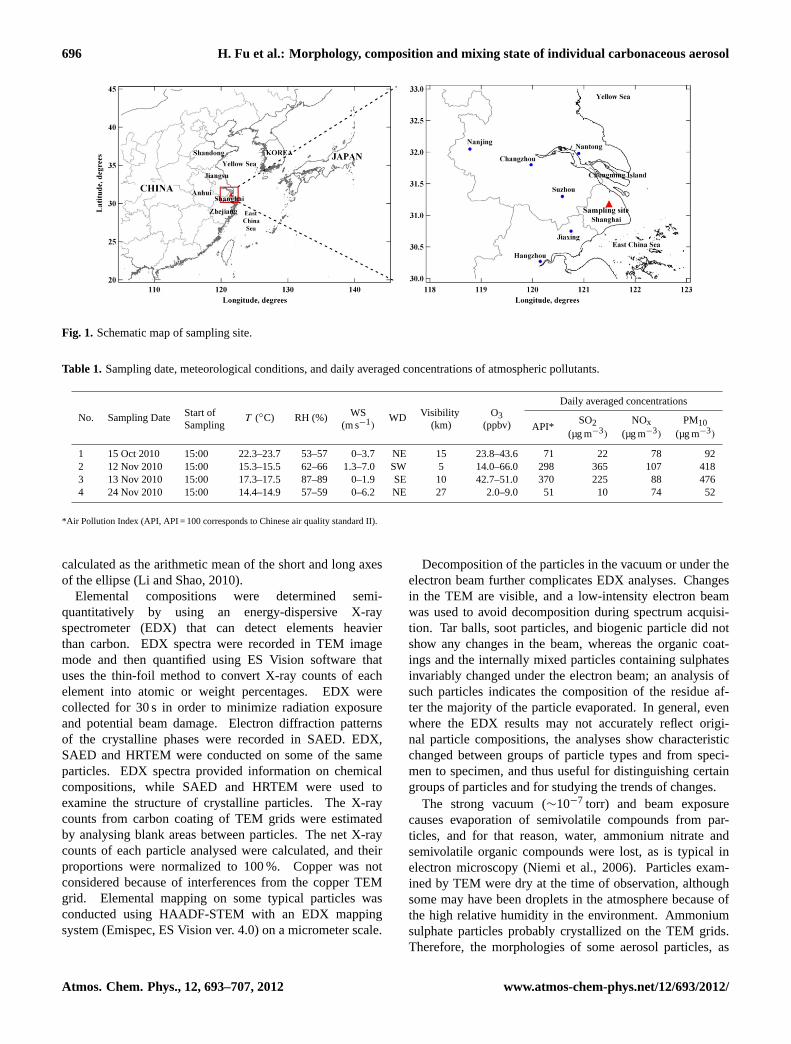
Overall, 4 sets of aerosol samples were collected during Oc-tober and November of 2010 at Fudan University (31◦18′ N,121◦ 29′ E), Shanghai, China (Fig. 1). The sampling siteis located on the rooftop of a five-storey building (about20 m above the ground) on the campus. The buildings sur-rounding the sampling site mostly consist of commercialproperties and residential dwellings. An incineration fa-cility (Jiangqiao) with a capacity of 1500 t d−1 is situated13 km west. Further into Shanghai’s industrial Boshan dis-trict, some 20 km north of the site, are several power plantswith capacities over 1200 MW. Another one (Yuqiao), lo-cated 16 km to the south of the site, could process 1200 tonsof solid waste per day. Apart from the point sources, vehic-ular traffic may also have affected the measurements madeat the study site. There is a local road (Guoding road) withlight traffic 300 m east of the observation site, and a heav-ily trafficked road (central ring road) is about 150 m southof the site. The site at Fudan University can be treated as arepresentative urban site influenced by a mixture of emissionsources, but not dominated by any one source.
Particles were collected onto the 300-mesh copper TEMgrids coated with carbon films using a single-stage cascadeimpactor with a 0.5-mm-diameter jet nozzle with a flow rateof 1.0 l min−1. The sampler has a collection efficiency of100 % at 0.5 µm aerodynamic diameter if the density of theparticles is 2 g cm−3. More information about the samplercan be found elsewhere (Li et al., 2010; Li and Shao, 2010).The grids contain fiber-like carbon substrates that minimizeparticle overlap, and TEM images show well-separated indi-vidual particles (Fig. S1). Sampling periods ranged between30 to 180 s, depending on particle loading. The collectedsamples were put in plastic carriers, sealed, and stored in a
desiccator to minimize exposure to ambient air and preservethem for further analysis.
Measurements of wind speed/direction, relative humidity,and ambient temperature were automatically recorded by aKestral 4000 Pocket Weather Tracker (Nielsen-KellermannInc., USA), as shown in Fig. S2. O3 was measured bypulsed UV fluorescence (Thermo Fisher Scientific, Co., Ltd.,Model 49i). NOx was measured by a molybdenum NO2-to-NO converter using the chemiluminescent reactions (ThermoFisher Scientific, Co., Ltd., Model 42i). Visibility, air pollu-tion index (API), and mass concentrations of SO2 and PM10were provided by Shanghai Meteorological Bureau. All thisinformation is shown in Table 1. A Wide-Range ParticleSpectrometer (WPS™, MSP Corporation model 1000XP)was used to measure size distributions in the range of 0.01–10 µm. The instrument is an aerosol spectrometer thatcombines the principles of Differential Mobility Analyser(DMA), Condensation Particle Counter (CPC) and LaserParticle Spectrometer (LPS) (Gao et al., 2009). Mass sizedistributions in this work were calculated by assuming anapparent particle density to be 1 g cm−3 and particles to bespherical shaped. A model ADI 2080 online analyzer forMonitoring of Aerosols and Gases (MARGA, Applikon An-alytical B.V. Corp., the Netherlands) with a particulate mattersampler (PM2.5) was used to measure mass concentrations ofmajor water-soluble inorganic ions in aerosols (NH+
4 , Na+,K+, Ca2+, Mg2+, SO2−
4 , NO−
3 , and Cl−) with one hour res-olution (Du et al., 2010).
Backward air mass trajectories were produced using theHybrid Single-Particles Lagrangian Integrated Trajectory(HYSPLIT4) model available at the NOAA/ARL’s (US Na-tional Oceanic and Air Administration/Air Resources Labo-ratory) web server. The Final Run (FNL) meteorological datawere used for the trajectory calculation (Draxler and Hess,1998).
2.2 TEM analysis
The TEM grid samples were examined with a JEOL-2100Ffield emission high-resolution transmission electron micro-scope (FE-HRTEM) equipped with an Oxford EDX, a scan-ning TEM unit with a HAADF detector. The TEM was op-erated on an accelerating voltage of 200 kV. The distribu-tion of aerosol particles on the TEM grids was not uniform.Coarser particles were deposited near the centers of the gridsand finer particles on the periphery. Outward from the gridcenters, the particles are more sparsely distributed. Becauseof the manual, labour-intensive operation of the TEM, onlylimited numbers of particles could be analyzed. To ensurethat the analyzed particles were representative of the entiresize range, three to four areas were chosen from the centerand periphery of the sampling spot on each grid. The sizeof each particle was calculated using the best fitting ellipseto a particle outline, and the diameter of each particle was
www.atmos-chem-phys.net/12/693/2012/ Atmos. Chem. Phys., 12, 693–707, 2012
696 H. Fu et al.: Morphology, composition and mixing state of individual carbonaceous aerosol
25
Fig. 1. Schematic map of sampling site. Fig. 1. Schematic map of sampling site.
Table 1. Sampling date, meteorological conditions, and daily averaged concentrations of atmospheric pollutants.
No. Sampling Date Start ofT (◦C) RH (%) WS WD Visibility O3
Daily averaged concentrations
Sampling (m s−1) (km) (ppbv) API*SO2 NOx PM10
(µg m−3) (µg m−3) (µg m−3)
1 15 Oct 2010 15:00 22.3–23.7 53–57 0–3.7 NE 15 23.8–43.6 71 22 78 922 12 Nov 2010 15:00 15.3–15.5 62–66 1.3–7.0 SW 5 14.0–66.0 298 365 107 4183 13 Nov 2010 15:00 17.3–17.5 87–89 0–1.9 SE 10 42.7–51.0 370 225 88 4764 24 Nov 2010 15:00 14.4–14.9 57–59 0–6.2 NE 27 2.0–9.0 51 10 74 52
*Air Pollution Index (API, API = 100 corresponds to Chinese air quality standard II).
calculated as the arithmetic mean of the short and long axesof the ellipse (Li and Shao, 2010).
Elemental compositions were determined semi-quantitatively by using an energy-dispersive X-rayspectrometer (EDX) that can detect elements heavierthan carbon. EDX spectra were recorded in TEM imagemode and then quantified using ES Vision software thatuses the thin-foil method to convert X-ray counts of eachelement into atomic or weight percentages. EDX werecollected for 30 s in order to minimize radiation exposureand potential beam damage. Electron diffraction patternsof the crystalline phases were recorded in SAED. EDX,SAED and HRTEM were conducted on some of the sameparticles. EDX spectra provided information on chemicalcompositions, while SAED and HRTEM were used toexamine the structure of crystalline particles. The X-raycounts from carbon coating of TEM grids were estimatedby analysing blank areas between particles. The net X-raycounts of each particle analysed were calculated, and theirproportions were normalized to 100 %. Copper was notconsidered because of interferences from the copper TEMgrid. Elemental mapping on some typical particles wasconducted using HAADF-STEM with an EDX mappingsystem (Emispec, ES Vision ver. 4.0) on a micrometer scale.
Decomposition of the particles in the vacuum or under theelectron beam further complicates EDX analyses. Changesin the TEM are visible, and a low-intensity electron beamwas used to avoid decomposition during spectrum acquisi-tion. Tar balls, soot particles, and biogenic particle did notshow any changes in the beam, whereas the organic coat-ings and the internally mixed particles containing sulphatesinvariably changed under the electron beam; an analysis ofsuch particles indicates the composition of the residue af-ter the majority of the particle evaporated. In general, evenwhere the EDX results may not accurately reflect origi-nal particle compositions, the analyses show characteristicchanged between groups of particle types and from speci-men to specimen, and thus useful for distinguishing certaingroups of particles and for studying the trends of changes.
The strong vacuum (∼10−7 torr) and beam exposurecauses evaporation of semivolatile compounds from par-ticles, and for that reason, water, ammonium nitrate andsemivolatile organic compounds were lost, as is typical inelectron microscopy (Niemi et al., 2006). Particles exam-ined by TEM were dry at the time of observation, althoughsome may have been droplets in the atmosphere because ofthe high relative humidity in the environment. Ammoniumsulphate particles probably crystallized on the TEM grids.Therefore, the morphologies of some aerosol particles, as
Atmos. Chem. Phys., 12, 693–707, 2012 www.atmos-chem-phys.net/12/693/2012/

H. Fu et al.: Morphology, composition and mixing state of individual carbonaceous aerosol 697
observed in the TEM, may differ from their shapes priorto collection (Li et al., 2003a). Despite possible changesin morphology, and except for volatile species, the compo-sitions of the particles measured herein should reflect theiroriginal compositions before collection. It should be notedthat the upper limits of the resulting size distributions maybe affected by the inhomogeneous distribution of particleson the grids, because some large particles pile up in the cen-ter, where particle overlap makes size measurements impos-sible. On the other hand, the lower ends of the size distribu-tions may have been affected by poor collection efficiency of<100 nm particles on the TEM grids (Posfai et al., 2003).
3 Results and discussion
3.1 Air quality and meteorology duringsampling periods
The samples were collected on 15 October, 12 November,13 November, and 24 November, with corresponding APIdaily averages of 71, 298, 370 and 51, respectively (Table 1).According to National Ambient Air Quality Stand (NAAQS)in China, two heavily polluted days occurred on 12 Novem-ber and 13 November. The daily average concentrationsof inhalable particles (PM10) were 418 and 476 µg m−3 on12 November and 13 November, respectively, nearly 3 timeshigher than Grade (II) of NAAQS in China (150 µg m−3).PM10 concentrations on 15 October and 24 November weremuch lower than Grade (II) of NAAQS while a bit higherthan Grade (I) of NAAQS (50 µg m−3); therefore, they wereconsidered as “two moderate days”.
To better understand the sources of the particulate matterduring sampling, we computed the backward air trajectoriesat three altitudes of 200, 500 and 1000 m above ground level(AGL), and the results are shown in Fig. 2. It is clear thatthe air masses on 12 November (Fig. 2b) originated fromMongolia, then passed through the desert and the semi-desertregions in western Inner Mongolia, carrying high concentra-tions of dust particles, and finally reached Shanghai along anorthwest direction within 3 days (Fig. 2b). The air masses at500 m and 1000 m fell and moved very slowly when they ar-rived at Shanghai, and may impact the ground-level air qual-ity in Shanghai. The air masses on 13 November (Fig. 2c)mainly originated from Jiangshu and Anhui provinces, andarrived at Shanghai from the direction of the East China Sea.The air masses at 200 m on both 24 November (Fig. 2d) and15 October (Fig. 2a) originated from Shandong and Bo Sea,both of which have a long distance to pass over the YellowSea before arriving at Shanghai.
The obvious increase of the particle mass concentrationsin the size range 1∼ 10 µm in Fig. 3a and b illustrates theoccurrence of a dust storm in Shanghai after 00:00 local time(LT) on 12 November. With the given assumption, the max-imum mass concentration of the dust particles observed was
approximately 250 µg m−3, and the particles withDp > 1µmaccounted for more than 90 % of the total mass concentra-tions which only accounted for around 35 % in the day be-fore 12 November, indicating that the coarse mode increasedgreatly when the dust storm approached the sampling siteand that the total particle mass was dominated by the coarsemode during the storm period. After 10:00 LT on 13 Novem-ber, the influence of the dust storm became less importantand the coarse mode of the mass-concentration distributionsdiminished.
The concentrations of water-soluble ions in PM2.5 pro-vided the additional proof for the dust event on 12 November(Fig. 4). Mg2+ and Ca2+ were mainly from crustal sources,such as resuspended road dust, soil dust, and constructiondust, and SO2−
4 , NO−
3 , and NH+
4 represented the secondarypollution sources from the transformation of their precursorsof SO2 and NO2 (Hwang et al., 2008; Jeong, 2008; Sun et al.,2006). The concentrations of Mg2+ and Ca2+ at 00:00 LT on12 November increased gradually and peaked at 08:00 LT on12 November. The peak values of Mg2+ and Ca2+ during thedust storm were 0.6 and 7 µg m−3, respectively, which wereabout 10 and 14 times higher than 00:00 LT on 11 Novem-ber (the day before the dust storm). The concentrations ofSO2−
4 , NO−
3 and NH+
4 decreased by a factor of 1.6–4.7 timesfrom 9.5, 12.1, and 7.1 µg m−3 to 6.0, 5.3, and 1.5 µg m−3,respectively, which could be the dilution effect of the duststorm. Variations of water-soluble ions were consistent withthe backward trajectory analysis and the meteorological con-ditions.
3.2 Major type and microstructure ofcarbonaceous aerosol
Here, we put more emphasis on carbonaceous aerosols col-lected from the urban Shanghai atmosphere, since they arethe major fraction of the aerosols by number in urban atmo-sphere, and are hence relevant for studying radiative effectsand CCN properties of aerosols (Zhou et al., 2009; Ramanaet al., 2010). Based on their morphologies and X-ray spec-tral data, carbonaceous aerosol occurring in the samples werecategorized into the following four types: (1) polymeric or-ganic compound, (2) soot, (3) tar ball, and (4) biogenic par-ticle. It must be noted that, since many different types ofinternally mixed particles were identified, for clarity, the par-ticles were grouped according to chemical species with thehighest content present in the particles. Based on this crite-rion, the particles with organic coating were not listed as aseparate type of carbonaceous aerosol, and will be discussedlater in detail.
3.2.1 Polymeric organic compounds (POCs)
The bulk of particles were that the sum of the C and mi-nor O and/or N contents was more than 90 % in atomic frac-tion based on X-ray spectral data. Such particles ranged in
www.atmos-chem-phys.net/12/693/2012/ Atmos. Chem. Phys., 12, 693–707, 2012

698 H. Fu et al.: Morphology, composition and mixing state of individual carbonaceous aerosol
26
Fig. 2. The backward air-mass trajectories ending at 200 m, 500 m and 1000 m for (a) 15October, 2010 (48 h), (b) 12 November, 2010 (72 h), (c) 13 November, 2010 (48 h) and (d) 24November, 2010 (48 h) with the pressure indicated by colour-coded line.
Fig. 2. The backward air-mass trajectories ending at 200 m, 500 m and 1000 m for(a) 15 October 2010 (48 h),(b) 12 November 2010 (72 h),(c) 13 November 2010 (48 h) and(d) 24 November 2010 (48 h) with the pressure indicated by colour-coded line.
diameter from 200 nm to 1.5 µm. They typically displayedrounded, relatively non-descript shapes, as shown in Fig. 5.Since EDX analyses only gave elemental compositions, wehad not direct evidence that C in these particles occurred inorganic compounds. However, it was widely assumed that allof EC in the tropospheric aerosols was within soot particles(Jacobson, 2001). Because these particles lacked the typicalconcentrically stacked graphitic layers of soot, we assumedthey consisted of organic substances. Unlike organic coating(will be discussed in the Sect. 3.3.1), POCs were not beamsensitive and did not evaporate under prolonged exposure tothe electron beam, as indicated by a couple of TEM analysis.Such insusceptibility against the electron beam lead to thehypothesis that POCs may be high-molecule organic com-pounds, such as HULIS (polycyclic aromatic hydrocarbons),which has been hypothesized to form from the incompletebreakdown of polymeric carbohydrates in the atmosphere(Alexander et al., 2008; Hoffer et al., 2006). HRTEM (theinset of Fig. 5d) exhibited completely amorphous structure ofthe POCs. In this work, we defined these particles as POCs.
Most of POCs contain soil-like elements such as Al, Mg,Si, and Ca. Particularly, they were coated or embeddedwith Si-rich particles (Fig. 5a and b). It has been reported
that many soil-derived aluminosilicate particles containedcarbonaceous species that probably come from humic sub-stances in soil (Geng et al., 2010; Jeong, 2008; Ro et al.,2001). Si-rich particle is the most common mineral in soilsbut can also form during fossil fuel combustion processes(Li and Shao, 2009b). However, soil-derived Si-rich parti-cles formed by mechanical processes are irregularly shaped.Fly ash particles produced during high-temperature combus-tion are typically spherically shaped (Geng et al., 2010). Thistype of POCs was encountered more frequently in the sampleof 12 November, collected during a dust storm event. Someof POCs contained K, in addition to Cl, S and Si (Fig. 5dand e). The potassium enrichment in aerosols has been usedas a fingerprint of their biomass-burning origin (Posfai et al.,2003, 2004; Li et al., 2003b). Previous field-measurementshave proposed that biomass burning was an important originof HULIS in East Asia (Alexander et al., 2008; Hoffer et al.,2006). POCs were often found to be coated by S- or N-richrim (Fig. 5c and d), indicating that they were readily oxi-dized by common atmospheric gases such as NOx and SO2.Figure 5f shows a typical POC particle with S-rich coating.Cube-like aggregated crystals (arrowed) indexed by the insetfast Fourier transform (FFT) pattern as CaSO4.
Atmos. Chem. Phys., 12, 693–707, 2012 www.atmos-chem-phys.net/12/693/2012/

H. Fu et al.: Morphology, composition and mixing state of individual carbonaceous aerosol 699
27
Fig. 3. The pollution event, 12-13 November, 2010: (a) Time series of mass, surface and number size distribution, (b) The average fractions of the particle mass and number concentrations indifferent size ranges, (c) Hourly meteorological data (WD = wind direction, WS = wind speed, RH= relative humidity).
(a)
(b)
(a)
(c)
Fig. 3. The pollution event, 12–13 November 2010:(a) time series of mass, surface and number size distribution,(b) the average fractionsof the particle mass and number concentrations in different size ranges,(c) hourly meteorological data (WD = wind direction, WS = windspeed, RH = relative humidity).
www.atmos-chem-phys.net/12/693/2012/ Atmos. Chem. Phys., 12, 693–707, 2012

700 H. Fu et al.: Morphology, composition and mixing state of individual carbonaceous aerosol
28
Fig. 4. Hourly concentrations of Ca2+, Mg2+, HN4+, Cl-, SO4
2-, and NO3- during the dust-haze
episode (12-13 November, 2010). Fig. 4. Hourly concentrations of Ca2+, Mg2+, HN+
4 , Cl−, SO2−
4 ,
and NO3− during the dust-haze episode (12–13 November 2010).
3.2.2 Soot
Soot was common in all samples, which was believed to beformed via a vaporization-condensation mechanism duringcombustion processes (Chen et al., 2005, 2006a; Li et al.,2003b). Typical soot aggregate has spherical primary par-ticles and fractal-like chain structures that can extend to acouple of micrometers or more (Fig. 6a and e). HRTEM im-age of the soot spheres shows onion-like structures of curved,disordered graphitic layers (Fig. 6d). STEM-EDX mappingshows that the soot aggregate mostly contained C and, to alesser extent, O (Fig. 6b and c). Typical SAED patterns ofsoot aggregates (Fig. 6g) exhibited three distinct rings, whichwere indexed to the crystalline structure of graphite (Viktoriaet al., 2006). The SAED pattern obtained from soot aggre-gates shows broad and diffuse 002 and hk rings, indicatinga microstructure consisting of randomly distributed crystal-lites that had a fine size and did not possess long range or-der, which was consistent with the previous study (Chen etal., 2005). Dark-field image (Fig. 6f) was used to visual-ize individual microcrystallites. The bright spots in the dark-field image were produced by diffraction from the 002 planesof microcrystallites. These bright spots were distributed un-evenly within the particles. Such patterns observed could bedue to a different density of circumferential 002 lattice planesparallel to the electron beam (Chen et al., 2005; Viktoria etal., 2006).
Besides the major component of C and O, soot may alsocontain variable, trace amounts of S, K, Si, Ca, Fe, Mn andZn. These external inorganic species may constitute an im-portant fingerprint that could be used to identify their pos-sible combustion and fuel sources (Chen et al., 2005). Thetype of the soot aggregates shown in Fig. 6a often containedtrace K element, suggesting the soot aggregate with largerparticles was most likely originated from biomass burning.The soot aggregates with smaller primary particles often
29
Fig. 5. TEM images of the typical POC particles collected from the atmosphere of Shanghai.Element of the detected parts of individual particles is mainly C (> 80%), and minor elements are indicated in square brackets. (a) C-rich particle coated by Si-rich layer. (b) C-rich particle internally mixed with Si-rich. (c) C-rich particle with S-rich rim. (d) C-rich particle with N-rich rim. HRTEM image in the inset shows amorphous microstructures of the particle bulk. (e) C-rich particle is attached to two metal-bearing particles (Fe, Mn, Zn). (f) C-rich particle with S-rich coating, surrounded by organic layer. Cube-like aggregated crystals (arrowed) indexed by the inset FFT pattern as CaSO4.
a b c
d e f
Fe, Mn-rich [Zn]
Si-rich S-rich
S-rich rim
N-rich rim
Si-rich
S-rich coating
CaSO4C-rich
[O,Cl,K] C-rich [O,Si,S,K]
C-rich [N,O,S,Cl]
C-rich [O,Al,Mg] C-rich
[O,Al,Si]
C-rich [O,N,Cl]
Organics
Fig. 5. TEM images of the typical POC particles collected from theatmosphere of Shanghai. Element of the detected parts of individualparticles is mainly C (>80 %), and minor elements are indicated insquare brackets.(a) C-rich particle coated by Si-rich layer.(b) C-rich particle internally mixed with Si-rich.(c) C-rich particle withS-rich rim. (d) C-rich particle with N-rich rim. HRTEM image inthe inset shows amorphous microstructures of the particle bulk.(e)C-rich particle is attached to two metal-bearing particles (Fe, Mn,Zn). (f) C-rich particle with S-rich coating, surrounded by organiclayer. Cube-like aggregated crystals (arrowed) indexed by the insetFFT pattern as CaSO4.
exhibited trace Si and Ca, which may originate from vehicleexhaust since Si can be found in the fuel, and Ca is a frequentadditive in oil (Kocbach et al., 2005; Vernooij et al., 2009). Ithas been reported that the smaller diameters of primary par-ticles from vehicle exhaust could be due to the higher flametemperatures for engines (approximately 2000◦C) (Kocbachet al., 2005). Trace Fe ingredient, often coupled with Mnand Zn in soot aggregates, may be used as indicators for coalcombustion (Chen et al., 2005). Soot aggregates exhibiting adiscernible S have previously been observed from the atmo-sphere of Kentucky, which were prominently derived fromthe combustion of coal and residual oil (Chen et al., 2006b).However, the S tracer was present in almost all of soot aggre-gates in our samples, indicating the S-content in soot aggre-gates might be due to a reaction with ambient air rather thana source difference.
Some of the soot particles showed a modified morphology,which most likely resulted from atmosphere aging (Fig. 6hand i). Once emitted into the air, the irregular geometry andcomplex microstructure of soot aggregates may provide ac-tive sites for deposition of common atmospheric gases suchas O3, NO2, and SO2, which could readily oxidize soot sur-faces (Decesari et al., 2002). The soot-O3 reaction is par-ticularly rapid, and prolonged exposure to ozone under lab-oratory conditions may lead to the collapse of the graphiticstructure (Zhang et al., 2008).
Atmos. Chem. Phys., 12, 693–707, 2012 www.atmos-chem-phys.net/12/693/2012/

H. Fu et al.: Morphology, composition and mixing state of individual carbonaceous aerosol 701
30
Soot
Dark field
Soot
Aged sootSAED
Fig. 6. TEM images of soot particles collected from the atmosphere of Shanghai. (a) The aggregate of chain-like soot particles with particle sizes (Dp>100 nm or Dp<80 nm). Elemental profiles obtained from STEM-EDS (HADDF-STEM mode) across the whole aggregate show the distribution of C (b) and O (c) elements. (d) High-resolution TEM shows the soot spheres with onion-like curved, disordered graphitic (graphene layers). Bright-field image (e) and corresponding 002 dark-field image (f) of a soot aggregate with homogeneous size (Dp<80 nm). (g) Typical SAED pattern of the soot particle exhibits three distinct rings, corresponding to 002, 10 and 11. (h) and (i) Aged soot.
Aged soot
Fig. 6. TEM images of soot particles collected from the atmo-sphere of Shanghai.(a) The aggregate of chain-like soot particleswith particle sizes (Dp > 100 nm orDp < 80 nm). Elemental pro-files obtained from STEM-EDS (HADDF-STEM mode) across thewhole aggregate show the distribution of C(b) and O(c) elements.(d) High-resolution TEM shows the soot spheres with onion-likecurved, disordered graphitic (graphene layers). Bright-field image(e) and corresponding 002 dark-field image(f) of a soot aggregatewith homogeneous size (Dp < 80 nm).(g) Typical SAED pattern ofthe soot particle exhibits three distinct rings, corresponding to 002,10 and 11.(h) and(i) aged soot.
3.2.3 Tar ball
Tar balls were readily recognized in TEM images (Fig. 7aand b) by their spherical shape, which are produced bya gas-to-particle transformation followed by condensationalgrowth in biomass smoke (Hand et al., 2005; Posfai et al.,2003). Tar balls had a diameter range from 100–500 nm witha few particles larger than 1 µm. HRTEM images (Fig. 7c)of tar balls did not indicate any semiordered graphitic mi-crostructure typical of soot. Their EDX spectra indicatedelemental compositions consisting of C and O with traceamounts of S, K, Cl and Si. Internal mixing of tar balls withother particle types was rarely observed.
In contrast to other widespread and spherical aerosol par-ticle types, such as sulphate and K-rich particles, tar ballswere stable and did not change visibly under prolonged ex-posure to the electron beam, suggesting they were composedof refractory material. It has been reported that the chem-ical compositions, densities, and carbon functional groupsof tar balls were distinctly different from soot and blackcarbon and more closely resembled high molecular weight
31
1 2 3 4
BackgroundPOC
KClSpSiCu
O
C
Cou
nts
Energy (keV)1 2 3 4
BackgroundTar ball
S KSi
Cu
O
C
Cou
nts
Energy (keV)
Fig. 7. TEM images of a typical spherical tar ball particle from a bright-field (a) and dark-field (b). HRTEM image of the same particle shows amorphous microstructures (c). A POC particle with sulphate-containing coating (d). The same particle expose to the strong beam (e). STEM-EDX maps showing the distributions of carbon element, oxygen element, silicon element, and sulphur element in the aged tar ball (f). EDX (g and h)recorded from the corresponding regions of white circles. The tar ball and a POC particle show similar element component (C, O, Si, and K elements), but varied ratios.
g h
Fig. 7. TEM images of a typical spherical tar ball particle from abright-field (a) and dark-field(b). HRTEM image of the same par-ticle shows amorphous microstructures(c). A POC particle withsulphate-containing coating(d). The same particle expose to thestrong beam(e). STEM-EDX maps showing the distributions ofcarbon element, oxygen element, silicon element, and sulphur el-ement in the aged tar ball(f). EDX (g andh) recorded from thecorresponding regions of white circles. The tar ball and a POC par-ticle show similar element component (C, O, Si, and K elements),but varied ratios.
polymeric humic-like substances, which could account fortheir reported optical properties (Posfai et al., 2004; Li et al.,2003b).
Of special interest was to compare tar ball with K-containing POCs (as noted previously), both of whichshowed similar element compositions with comparableamounts, amorphous microstructures, overlapped sizes, andstrong resistances against electron bombardment. SincePosfai et al. (2003) proposed that tar balls were probablycorrespond to an intermediate stage in the aging of organicparticles from biomass burning, we strongly suspected that afraction of K-containing POCs could be originated from tarballs. A typical POC particle with S-rich coating is shown inFig. 7d. When exposed to electron beam, surface sulphatessublimated when the particle was exposed to electron beam(Fig. 7e). Element maps proved that C, O, and Si elementshomogeneously distribute within the bulk of the particle. Ho-mogeneous internal distributions of C and O in tar balls werepreviously reported (Hand et al., 2005). Also, our assump-tion was supported by a few field studies performed on south-ern Africa and California (Hand et al., 2005; Posfai et al.,2003, 2004). Both tar balls and the organic particles with
www.atmos-chem-phys.net/12/693/2012/ Atmos. Chem. Phys., 12, 693–707, 2012

702 H. Fu et al.: Morphology, composition and mixing state of individual carbonaceous aerosol
32
Fig. 8. TEM images of particles classified as biological particles. (a) agglomerate of three brocosomes produced by leaf-hopping insects as a water-repellent body coat; (band c) unidentified biogenic particles in the present study.
Fig. 8. TEM images of particles classified as biological particles.(a) Agglomerate of three brocosomes produced by leaf-hopping in-sects as a water-repellent body coat; (b andc) unidentified biogenicparticles in the present study.
minor K, Cl, and S contents were characteristic products inaged biomass plumes. Given the small number of particlesanalyzed in this study, it was difficult to evaluate the valid-ity of this scenario, but it was certain that both K-containingPOCs and tar balls observed in the atmosphere of Shanghaicome from biomass burning.
3.2.4 Biogenic particle
Biogenic particles are a special type of organic particleswith special morphologies, ranging in size from millime-ters down to tens of nanometers. The number concentrationsof biogenic particles range from minor fractions of the to-tal aerosol in oceanic (1 %) and continental (2 %–3 %) set-tings, to∼25 % in a continental aerosol and 35 % in Ama-zonia (Wittmaack et al., 2005). The simultaneous presenceof minor N, P, S, Si and Cl with C and O was consideredas “biogenic fingerprint” in the previous studies (Geng et al.,2010b; Posfai and Buseck, 2010; Niemi et al., 2006). Mostbiological particles originate from terrestrial plants, while theocean with the “bubble-burst” mechanism is also an impor-tant producer (Wittmaack et al., 2005). In this work, bio-genic carbonaceous particles have also been observed in theurban air of Shanghai. Figure 8 shows the TEM images ofseveral typical biogenic particles. The morphology of theseparticles varied strongly from simple bar to complicated bio-logical structures. The HRTEM image exhibited completelyamorphous structure.
Particles having interesting, flower-like morphologies withdiameters around 400 nm, occurred in the sample collected15 October (Fig. 8a). They contained mostly of C and O andalso contained significant Si, which was believed to serve asa highly water repellent body coating of leafhoppers (Posfaiet al., 2010). They might originate mainly from local forests.Leafhopper is a common insect in Shanghai, and widely dis-tributed in east China. Particles with similar morphologiesand compositions were observed in other geographically di-verse regions, such as southern Africa, Munich and Kentucky(Posfai et al., 2003, 2010; Chen et al., 2005).
3.3 Mixing states of carbonaceous particles andformation mechanisms
3.3.1 Particles with organic coatings
Several TEM studies have shown the inorganic particleswith organic coating were widespread in urban atmosphere(Adachi and Buseck, 2008; Li and Shao, 2010). Similar re-sults were well observed in our samples. Most of the parti-cles, including S-rich particles, fly ashes, mineral dusts andmetal-rich particles were coated with a carbonaceous film,and a few typical particles with organic coating are shownin Fig. 9a–c. Similar particles, with coatings of variousthickness of organic coating, have been widely observed ina variety of samples, including those from pristine marinesand polluted continental environments (Adachi and Buseck,2008; Li and Shao, 2010; Russell et al., 2002; Niemi et al.,2006). Organic coatings were lost under strong beam bom-bardment. It was believed that organic coating was composedof second organic aerosol (SOA), which commonly formsthrough condensation of precursor gases on pre-existing par-ticles such as soot, ammonium sulphate (Fan et al., 2006).The high ozone and VOC concentrations in urban Shang-hai atmosphere suggested that the formation of SOA andtheir subsequent condensation may be a significant path-way in the formation of organic coating. Previous studieshave suggested that ozone, hydroxyl radical, nitrate radical,and other oxidants presented during atmospheric transportplayed a central role on the formation of SOA in Beijing at-mosphere (Li and Shao, 2010). In Shanghai, about half ofVOCs come from motor vehicles, and 10∼ 35 % of VOCswas from industrial activities, indicating the organic coatingin these aerosol particles were likely formed by VOCs fromfuel combustion, and a lesser extent from industrial activities(F. Geng et al., 2009). Tar balls were an indicator of biomassand biofuel burning (Hand et al., 2005; Posfai et al., 2004).The low abundance of tar balls indicated little influence frombiomass burning on the formation of organic coating (seethe Sect. 3.4). Laboratory experiments have found that SOAis slightly hygroscopic and exhibits a smooth water uptakewith increasing the particle sizes (Varubangkul et al., 2006).Therefore, the circle stamps in the grid indicate that their or-ganic coatings likely held water before they was sampled,suggesting the formation of such coating by aqueous-phaseprocessing of the particles during transport in atmosphere.Organic coatings could modify the particle hygroscopicity,CCN abilities and heterogeneous chemical reactivity, indi-cating that the ubiquitous presence of this particle type in ur-ban Shanghai atmosphere had important ramifications of theregional climate (Adachi et al., 2008; Russell et al., 2002; Liet al., 2003a).
Atmos. Chem. Phys., 12, 693–707, 2012 www.atmos-chem-phys.net/12/693/2012/

H. Fu et al.: Morphology, composition and mixing state of individual carbonaceous aerosol 703
33
(NH4)2SO4
ab c
d e f
g h i
OC coating
Sulphate particle ZnCl2
Zn-rich
OC coating
Na2SO4
weak beam strong beam
OC
Na-rich
S-N-rich
S-rich
S-rich
OC
soot fly ash
Fe-rich
(NH4)2SO4 S-rich
OC
OC
Biogenic particle soot
Na2SO4
OC coating
S-rich
OC
Fig. 9. TEM images of the typical C-bearing particles collected from the atmosphere ofShanghai. (a)A ammonium sulphate particle with organic coating. The inset is the diffraction pattern of ammonium sulphate. The diffraction pattern was obtained from a similar-looking particle, which was destroyed during electron-beam exposure. (b) Biogenic particle coated by thin organic layer. (c) ZnCl2 particle with organic coating (arrowed), and thenencapsulated in the Zn-rich layer. (d) Organic components embedded in the N-S-rich particle. (e) The exposed organic components from decomposition of the beam-sensitive N-S-rich particle. (f) The internally mixed organic/sulphate-containing particles (ammonium sulphate) after intentional strong beam exposure. The SAED image and EDS show the basis for the identification of the bar-shaped particles (arrowed) as Na2SO4. (g), and (h) the internally mixed particles containing soot, organic matter and sulphates. (i) Biogenic particle attached with Ca-rich material.
Ca-rich
Al, Si, Fe-rich
Fig. 9. TEM images of the typical C-bearing particles collectedfrom the atmosphere of Shanghai.(a) An ammonium sulphate par-ticle with organic coating. The inset is the diffraction pattern ofammonium sulphate. The diffraction pattern was obtained from asimilar-looking particle, which was destroyed during electron-beamexposure.(b) Biogenic particle coated by thin organic layer.(c)ZnCl2 particle with organic coating (arrowed), and then encapsu-lated in the Zn-rich layer.(d) Organic components embedded in theN-S-rich particle. (e) The exposed organic components from de-composition of the beam-sensitive NS- rich particle.(f) The inter-nally mixed organic/sulphate-containing particles (ammonium sul-phate) after intentional strong beam exposure. The SAED imageand EDS show the basis for the identification of the bar-shaped par-ticles (arrowed) as Na2SO4. (g), and(h) the internally mixed par-ticles containing soot, organic matter and sulphates.(i) Biogenicparticle attached with Ca-rich material.
3.3.2 Internally mixed particles
S-rich particles, likely ammonium sulphate, dominated inmost of samples. In TEM images, these particles were eu-hedral or rounded. Most particle diameters were<500 nm orfrom 800 nm to 1.5 µm. Close examination of TEM-EDXshowed that many of the ammonium sulphate grains con-sisted of organic components, which exhibited carbon peakshigher than those seen from background. The sulphates read-ily decomposed when exposed to an electron beam (Fig. 9d–f). When decomposing, they left a similar carbonaceousresidue. Laboratory studies showed that sulphate nucleationwas often coupled with aromatic acids (Zhang, 2004); thus, itwas not surprised that organics were present in small sulphateparticles. A smaller size of the sulphate grains seemed homo-geneous and were commonly coated by organic layer, whilethe larger ones were commonly internally mixed with soot
and organic matter (or more chemical species) (Fig. 9g andh). Within the internally mixed particles, most of organicsmay be beam-sensitive SOA (Fig. 9d and e), consistent withthe usual findings that SOA was coupled with S-rich particles(Kanakidou et al., 2005). However, some particles also con-tained beam-resistant dark inclusions without clear morpho-logical characteristics, which may be POCs, collapsed sootor tar ball. Previous water dialysis experiments of individualparticles have demonstrated that the coatings were water sol-uble, while organic inclusions were insoluble (Li and Shao,2010).
Such internally mixed particles may be preferentiallyformed in an aerosol mass stagnates, which often occurs dur-ing episodes of serious pollution (such as urban haze) whenthere is insufficient wind velocity to carry pollutants awayfrom the city. During these periods of pollutant retention,aerosols continue to collide and combine with each other,resulting in larger average sizes and complex components.Larger sizes are commonly associated with polluted environ-ment and adverse meteorological conditions (Li et al., 2010).In high pollution areas such as Mexico City, over half ofthe aerosol particles consist of internally mixed soot, organicmatter, and sulphates (Adachi and Buseck, 2008). Sulphatecoatings can have either negative or positive effects on theradiative forcing of BC. On one hand, the internally mixedsulphates can make organic matter and soot more hydrophilicand eventually make them efficient scatters of solar radiationand CCN. While, on the other hand, embedding sulphates actas lenses that focus light on soot and thus amplify absorptionof the internally particles (Adachi and Buseck, 2008; Adachiet al., 2010).
3.3.3 Aged biogenic particles
The aged biogenic particles were relatively frequently ob-served in both clean and polluted environments (Fig. S3).The particles shown in Fig. 8a commonly embedded in oraggregated with soot aggregates, but still retain their wholeflower-like morphology. The surface of the aged particleschanged apparently under electron bombardment, suggestingthat they may be coated by sulphates (Fig. S3d and e). Theattached sulphates could affect the hygroscopicity of the par-ticles, favouring the activation to CCN. Previous studies havereported that biogenic particles may act as CCN and play animportant role for the long-range transport of trace elementsinto and away from specific biomes (Witmaack et al., 2005).
3.4 Relative abundances and possible sources
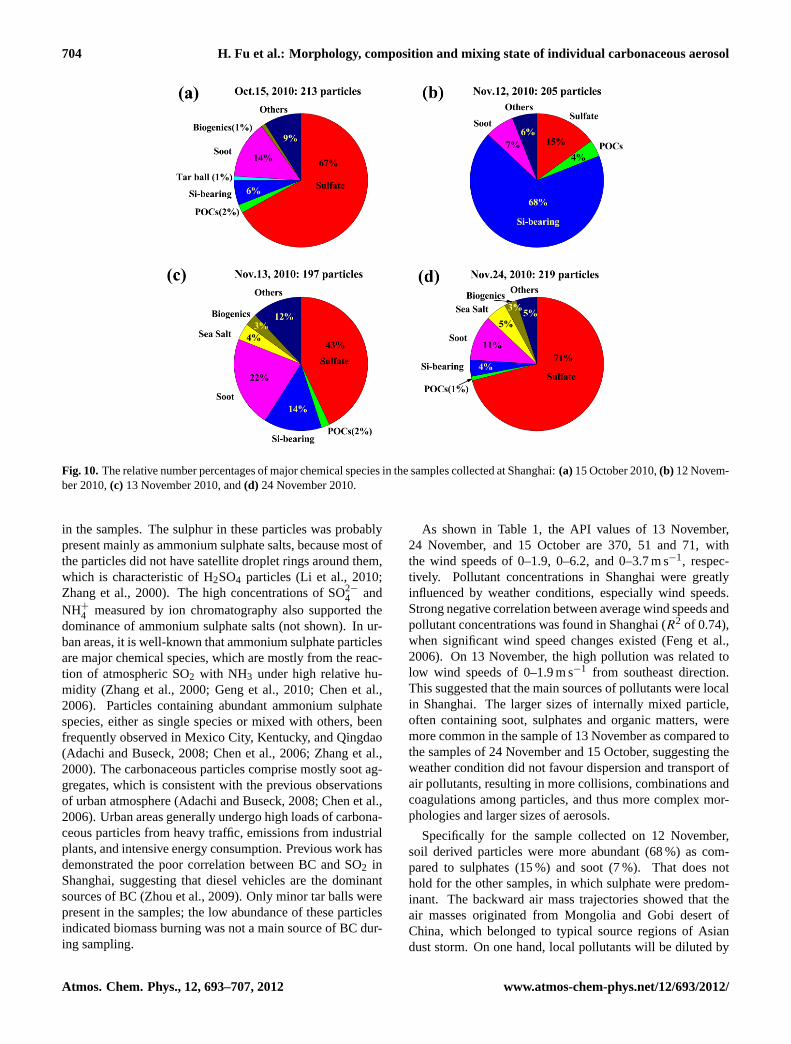
Figure 10 shows the relative number percentages of majorchemical species in the samples collected at different times.Although there was a variation in the relative number countsof different species, sulphates (15 %–71 %), followed by soot(7 %–22 %), constituted the most dominant species observed
www.atmos-chem-phys.net/12/693/2012/ Atmos. Chem. Phys., 12, 693–707, 2012
704 H. Fu et al.: Morphology, composition and mixing state of individual carbonaceous aerosol
Fig. 10.The relative number percentages of major chemical species in the samples collected at Shanghai:(a)15 October 2010,(b) 12 Novem-ber 2010,(c) 13 November 2010, and(d) 24 November 2010.
in the samples. The sulphur in these particles was probablypresent mainly as ammonium sulphate salts, because most ofthe particles did not have satellite droplet rings around them,which is characteristic of H2SO4 particles (Li et al., 2010;Zhang et al., 2000). The high concentrations of SO2−
4 andNH+
4 measured by ion chromatography also supported thedominance of ammonium sulphate salts (not shown). In ur-ban areas, it is well-known that ammonium sulphate particlesare major chemical species, which are mostly from the reac-tion of atmospheric SO2 with NH3 under high relative hu-midity (Zhang et al., 2000; Geng et al., 2010; Chen et al.,2006). Particles containing abundant ammonium sulphatespecies, either as single species or mixed with others, beenfrequently observed in Mexico City, Kentucky, and Qingdao(Adachi and Buseck, 2008; Chen et al., 2006; Zhang et al.,2000). The carbonaceous particles comprise mostly soot ag-gregates, which is consistent with the previous observationsof urban atmosphere (Adachi and Buseck, 2008; Chen et al.,2006). Urban areas generally undergo high loads of carbona-ceous particles from heavy traffic, emissions from industrialplants, and intensive energy consumption. Previous work hasdemonstrated the poor correlation between BC and SO2 inShanghai, suggesting that diesel vehicles are the dominantsources of BC (Zhou et al., 2009). Only minor tar balls werepresent in the samples; the low abundance of these particlesindicated biomass burning was not a main source of BC dur-ing sampling.
As shown in Table 1, the API values of 13 November,24 November, and 15 October are 370, 51 and 71, withthe wind speeds of 0–1.9, 0–6.2, and 0–3.7 m s−1, respec-tively. Pollutant concentrations in Shanghai were greatlyinfluenced by weather conditions, especially wind speeds.Strong negative correlation between average wind speeds andpollutant concentrations was found in Shanghai (R2 of 0.74),when significant wind speed changes existed (Feng et al.,2006). On 13 November, the high pollution was related tolow wind speeds of 0–1.9 m s−1 from southeast direction.This suggested that the main sources of pollutants were localin Shanghai. The larger sizes of internally mixed particle,often containing soot, sulphates and organic matters, weremore common in the sample of 13 November as compared tothe samples of 24 November and 15 October, suggesting theweather condition did not favour dispersion and transport ofair pollutants, resulting in more collisions, combinations andcoagulations among particles, and thus more complex mor-phologies and larger sizes of aerosols.
Specifically for the sample collected on 12 November,soil derived particles were more abundant (68 %) as com-pared to sulphates (15 %) and soot (7 %). That does nothold for the other samples, in which sulphate were predom-inant. The backward air mass trajectories showed that theair masses originated from Mongolia and Gobi desert ofChina, which belonged to typical source regions of Asiandust storm. On one hand, local pollutants will be diluted by
Atmos. Chem. Phys., 12, 693–707, 2012 www.atmos-chem-phys.net/12/693/2012/

H. Fu et al.: Morphology, composition and mixing state of individual carbonaceous aerosol 705
long-range transport of dust plumes. On the other hand, theformation of ammonium sulphate/bisulphate might be sup-pressed as sulphuric acid was taken up by mineral particleswith basic surfaces (Ro et al., 2005; H. Geng et al., 2009).Both of them lead to much lower contents of soot (7 %) andsulphates (15 %) in the sample of 12 November as comparedto the other samples. On the basis of the back-trajectories,the air-mass fell and moved very slowly when they arrived atShanghai, suggesting that dust particles had a chance to mixwith local pollutants for the reactions. TEM-EDX analysisshowed that most mineral particles, especially those particleswith small size, presented N-rich or S-rich coatings. It wasreported that Asian dust storm events provided a removalmechanism for NOx (or HNO3) and perhaps contributed tonitrogen deposition in the Yellow Sea and the eastern ChinaSea (H. Geng et al., 2009; Zhang et al., 2010).
4 Conclusions
In this study, individual aerosol in the urban atmosphere ofShanghai were observed using TEM-EDX. Several types ofcarbonaceous particles were present in our aerosol samples,which were POC, soot, tar ball, and biogenic particle. Or-ganic coating, commonly formed through condensation ofprecursor gases on pre-existing particles, was also widely ob-served in the most samples. Soot (11 %–22 %) constitutedthe most dominant carbonaceous species observed in thesamples. Soil-derived POCs particles were relatively morefrequently observed during the dust storm. During the pol-luted day, most carbonaceous particles were in aggregates,which had a significant influence on their physical and chem-ical properties and may change their radiative properties andthus their climatic effects. Aged particles were associatedwith days with low wind velocities, showed complex struc-tures, and were bigger in size.
Supplementary material related to thisarticle is available online at:http://www.atmos-chem-phys.net/12/693/2012/acp-12-693-2012-supplement.pdf.
Acknowledgements.We gratefully acknowledge the NOAA AirResources Laboratory (ARL) for the provision of the HYSPLITtransport model used in this publication. Thank Shanghai Meteoro-logical Bureau for providing meteorological data. Financial supportwas provided by National Natural Science Foundation of China(Nos. 40975074, 21177026, 21077025, 40875073); the PujiangTalent Program of Shanghai, the Key Laboratory of IndustrialEcology and Environmental Engineering, China. Ministry ofEducation and Science & Technology Commission of ShanghaiMunicipality (Nos. 09160707700, 10231203801, 10JC1401600).
Edited by: A. B. Guenther
References
Adachi, K. and Buseck, P. R.: Internally mixed soot, sulfates,and organic matter in aerosol particles from Mexico City, At-mos. Chem. Phys., 8, 6469–6481,doi:10.5194/acp-8-6469-2008,2008.
Adachi, K. and Buseck, P. R.: Hosted and free-floating metal-bearing atmospheric nanoparticles in Mexico City, Environ. Sci.Technol., 44, 2299–2304, 2010.
Adachi, K., Chung, S. H., Friedrich, H., and Buseck, P. R.: Frac-tal parameters of individual soot particles determined using elec-tron tomography: Implications for optical properties, J. Geophys.Res., 112, D14202,doi:10.1029/2006JD008296, 2007.
Adachi, K., Chung, S. H., and Buseck, P. R.: Shapes of soot aerosolparticles and implications for their effects on climate, J. Geo-phys. Res., 115, D15206,doi:10.1029/2009JD012868, 2010.
Alexander, D. T. L., Crozier, P. A., and Anderson, J. R.: Browncarbon spheres in east Asian outflow and their optical properties,Science, 321, 833–836, 2008.
Andreae, M. O. and Gelencser, A.: Black carbon or brown car-bon? The nature of light-absorbing carbonaceous aerosols, At-mos. Chem. Phys., 6, 3131–3148,doi:10.5194/acp-6-3131-2006,2006.
Chen, Y., Shah, N., Braun, A., Huggins, F. E., and Huffman, G.P.: Electron microscopy investigation of carbonaceous particu-late matter generated by combustion of fossil fuels, Energ. Fuel.,19, 1644–1651, 2005.
Chen, Y., Shah, N., Huggins, F. E., and Hoffman, G. P.: Micro-analysis of ambient particles from Lexington, KY, by electronmicroscopy, Atoms. Environ., 40, 651–663, 2006a.
Chen, Y., Shah, N., Huggins, F. E., and Huffman, G. P.: Micro-analysis of ambient particles from Lexington, KY, by electronmicroscopy, Atmos. Environ., 40, 651–653, 2006b.
Chung, S. H. and Seinfeld, J. H.: Global distribution and climateforcing of carbonaceous aerosols, J. Geophys. Res., 107, 4407,doi:10.1029/2001JD001397, 2002.
Decesari, S., Facchini, M. C., Matta, E., Mircea, M., Fuzzi, S.,Chughtai, A. R., and Smith, D. M.: Water soluble organic com-pounds formed by oxidation of soot, Atmos. Environ., 36, 1827–1832, 2002.
Draxler, R. R. and Hess, G. D.: An overview of the HYsplit-4 mod-eling system for trajectories, dispersion, and deposition, Aust.Meteorol. Mag., 47, 295–308, 1998.
Du, H., Kong, L., Chen, J., and Cheng, T.: Insights into ammo-nium particle-to-gas conversion: non-sulphate ammonium cou-pling with nitrate and chloride, Aerosol Air Qual. Res., 10, 589–595, 2010.
Fan, J., Zhang, R., Collins, D., and Li, G.: Contribution of sec-ondary condensable organics to new particles formation: A casestudy in Houston, Texas, Geophys. Res. Lett., 33, L15802,doi:10.1029/2006GL026295, 2006.
Feng, J., Hu, M., Chan, C. K., Lau, P. S., Fang, M., He, L., andTang, X.: A comparative study of the organic matter in PM2.5from three Chinese megacities in three different climatic zones,Atmos. Environ., 40, 3983–3994, 2006.
Freney, E. J., Adachi, K., and Buseck, P. R.: Internally mixed atmo-spheric aerosol particles: Hygroscopic growth and light scatter-ing, 115, D19210,doi:10.1029/2009JD013558, 2010.
Fu, Q., Zhuang, G., Wang, J., Xu, C., Huang, K., Li, J., Hou, B.,Lu, T., and Streets, D. G.: Mechanism of formation of the heav-
www.atmos-chem-phys.net/12/693/2012/ Atmos. Chem. Phys., 12, 693–707, 2012

706 H. Fu et al.: Morphology, composition and mixing state of individual carbonaceous aerosol
iest pollution episode ever recorded in the Yangtze River Delta,China, Atmos. Environ., 42, 2023–2026, 2008.
Gao, J., Wang, T., Zhou, X., Wu, W., and Wang, W.: Measurementof aerosol number size distributions in the Yangtze River delta inChina: formation and growth of particles under polluted condi-tions, Atmos. Environ., 43, 829–836, 2009.
Geng, F., Zhang, Q., Tie, X., Huang, M., Ma, X., Dong, Z., Qiong,Y., Quan, J., and Zhao, C.: Aircraft measurements of O3, NOx,CO, VOCs, and SO2 in the Yangtze River Delta region, Atoms.Environ., 43, 584–593, 2009.
Geng, H., Park, Y., Hwang, H., Kang, S., and Ro, C.-U.: Elevatednitrogen-containing particles observed in Asian dust aerosolsamples collected at the marine boundary layer of the BohaiSea and the Yellow Sea, Atmos. Chem. Phys., 9, 6933–6947,doi:10.5194/acp-9-6933-2009, 2009.
Geng, H., Ryu, J.-Y., Jung, H.-J., Chung, H., Ahn, K.-H., and Ro,C.-U.: Single-particles characterization of summertime Arcticaerosols collected at Ny-Alesund, Svalbard, Environ. Sci. Tech-nol., 44, 2348–2353, 2010a.
Geng, H., Kang, H., Jung, J., Choel, M., Kim, H., and Ro, C.-U.:Characterization of individual submicrometer aerosol particlescollected in Incheon, Korea, by quantitative transmission elec-tron microscopy energy-dispersive X-ray spectrometry, J. Geo-phys. Res., 115, D15306,doi:10.1029/2009JD013486, 2010b.
Gi, Y.-J.: Bulk and single-particle mineralogy of Asian dust and acomparison with its source soils, J. Geophys. Res., 113, D02208,doi:10.1029/2007JD008606, 2008.
Hand, J. L., Malm, W. C., Laskin, A., Day, D., Lee, T., Wang, C.,Carrico, C., Carrillo, J., Cowin, J. P., Collett, J., and Ledema,M. J.: Optical, physical, and chemical properties of tar balls ob-served during the Yosemite Aerosol Characterization Study, J.Geophys. Res., 110, D21210,doi:10.1029/2004JD005728, 2005.
Hoffer, A., Gelencser, A., Guyon, P., Kiss, G., Schmid, O., Frank,G. P., Artaxo, P., and Andreae, M. O.: Optical properties ofhumic-like substances (HULIS) in biomass-burning aerosols, At-mos. Chem. Phys., 6, 3563–3570,doi:10.5194/acp-6-3563-2006,2006.
Hwang, H., Kim, H., Ro, C.-U.: Single-particle characterization ofaerosol samples collected before and during an Asian dust stormin Chuncheon, Korea, Atmos. Environ., 42, 8738–8746, 2008.
IPCC: available at:http://www.ipcc.ch/publicationsanddata/ar4/syr/en/contents.html, 2007.
Jacobson, M. Z.: Strong radiative heating due to the mixing stateof black carbon in atmospheric aerosols, Nature, 409, 695–697,2001.
Kanakidou, M., Seinfeld, J. H., Pandis, S. N., Barnes, I., Dentener,F. J., Facchini, M. C., Van Dingenen, R., Ervens, B., Nenes, A.,Nielsen, C. J., Swietlicki, E., Putaud, J. P., Balkanski, Y., Fuzzi,S., Horth, J., Moortgat, G. K., Winterhalter, R., Myhre, C. E.L., Tsigaridis, K., Vignati, E., Stephanou, E. G., and Wilson,J.: Organic aerosol and global climate modelling: a review, At-mos. Chem. Phys., 5, 1053–1123,doi:10.5194/acp-5-1053-2005,2005.
Kis, V. K., Posfai, M., and Labar, J. L.: Nanostructure of atmo-spheric soot particles, Atmos. Environ., 40, 5533–5542, 2006.
Kocbach, A., Johansen, B. V., Schwarze, P. E., and Namork, E.:Analytical electron microscopy of combustion particles: a com-parison of vehicle exhaust and residential wood smoke, Sci. TotalEnviron., 346, 231–243, 2005.
Li, W. J. and Shao, L.: Transmission electron microscopy study ofaerosol particles from the brown hazes in northern China, J. Geo-phys. Res., 114, D09302,doi:10.1029/2008JD011285, 2009a.
Li, W. J. and Shao, L. Y.: Observation of nitrate coatings on at-mospheric mineral dust particles, Atmos. Chem. Phys., 9, 1863–1871,doi:10.5194/acp-9-1863-2009, 2009b.
Li, W. J. and Shao, L.: Mixing and water-soluble char-acteristics of particulate organic compounds in individualurban aerosol particles, J. Geophys. Res., 115, D02301,doi:10.1029/2009JD012575, 2010.
Li, W. J., Anderson, J. R., and Buseck, P. R.: TEM studyof aerosol particles from clean and polluted marine boundarylayers over the North Atlantic, J. Geophys. Res., 108, 4189,doi:10.1029/2002JD002106, 2003a.
Li, W. J., Posfai, M., Hobbs, P. V., and Buseck, P. R.: Individualaerosol particles from biomass burning in southern Africa: 2.Compositions and aging of inorganic particles, J. Geophys. Res.,108, 8484,doi:10.1029/2002JD002310, 2003b.
Li, W. J., Shao, L. Y., and Buseck, P. R.: Haze types in Beijingand the influence of agricultural biomass burning, Atmos. Chem.Phys., 10, 8119–8130,doi:10.5194/acp-10-8119-2010, 2010.
Menon, S., Hansen, J., Nazarenko, L., and Luo, Y.: Climate effectsof black carbon aerosols in China, Science, 297, 2250–2253,2002.
Niemi, J. V., Saarikoski, S., Tervahattu, H., Makela, T., Hillamo,R., Vehkamaki, H., Sogacheva, L., and Kulmala, M.: Changes inbackground aerosol composition in Finland during polluted andclean periods studied by TEM/EDX individual particle analysis,Atmos. Chem. Phys., 6, 5049–5066,doi:10.5194/acp-6-5049-2006, 2006.
Pan, Y.-L., Pinnick, R. G., Hill, S. C., Rosen, J. M., andChang, R. K.: Sing-particle laser-induced-fluorescence spec-tra of biological and other organic-carbon aerosols in the at-mosphere: Measurements at New Haven, Connecticut, andLas Cruces, New Mexico, J. Geophys. Res., 112, D24S19,doi:10.1029/2007JD008741, 2007.
Posfai, M. and Buseck, P. R.: Nature and climate effects of individ-ual tropospheric aerosol particles, Annu. Rev. Earth Pl. Sci., 38,17–43, 2010.
Posfai, M., Simonics, R., Li, J., Hobbs, P. V., and Buseck,P. R.: Individual aerosol particles from biomass burningin sourthern Africa: 1. Compositions and size distributionsof carbonaceous particles, J. Geophys. Res., 108, 8483,doi:10.1029/2002JD002291, 2003.
Posfai, M., Gelencser, A., Simonics, R., Arato, K., Li, J., Hobbs,P. V., and Buseck, P. R.: Atmospheric tar balls: particles frombiomass and biofuel burning, J. Geophys. Res., 109, D06213,doi:10.1029/2003JD004169, 2004.
Ramanathan, M. V. and Garmichael, G.: Global and regional cli-mate changes due to black carbon, Nat. Geosci., 1, 221–227,2008.
Ramana, M. V., Ramanathan, V., Feng, Y., Yoon, S.-C., Kim, S.-W., Carmichael, G. R., and Schauer, J. J.: Warming influencedby the ratio of black carbon to sulphate and the black-carbonsource, Nat. Geosci., 3, 542–545, 2010.
Ro, C.-U., Oh, K.-Y. Kim, H., Kim, Y., Lee, C., Kim, K.-H., Kang,C., Osan, J., Hoog, J., Worobiec, A., and Grieken, R. V.: Single-particle analysis of aerosols at Cheju Island, Korea, using low-Z electron probe X-ray microanalysis: a direct proof of nitrate
Atmos. Chem. Phys., 12, 693–707, 2012 www.atmos-chem-phys.net/12/693/2012/

H. Fu et al.: Morphology, composition and mixing state of individual carbonaceous aerosol 707
formation from sea salts, Environ. Sci. Technol., 35, 4487–4494,2001.
Ro, C.-U., Kim, H., Oh, K.-Y., Yea, S., Lee, C., Jang, M., andGrieken, R. V.: Single-particle characterization of urban aerosolparticles collected in three Korean cities using low-Z electronprobe X-ray microanalysis, Environ. Sci. Technol., 36, 4770–4776, 2002.
Ro, C.-U., Hwang, H., Kim, H., Chun, Y., and Grjeken, R. V.:Single-particle characterization of four “Asian dust” samples col-lected in Korea, Using low-Z particle electron probe X-ray mi-croanalysis, Environ. Sci. Technol., 39, 1409–1419, 2005.
Russell, L. M., Maria, S. F., and Myneni, S. C. B.: Mapping or-ganic coatings on atmospheric particles, Geophys. Res. Lett., 29,1779–1783, 2002.
Semeniuk, T. A, Wise, M. E., Martin, S. T., Russell, L. M., andBuseck, P. R.: Water uptake characteristics of individual atmo-spheric particles having coatings, Atmos. Environ., 41, 6225–6235, 2007.
Sun, J. and Ariya, P. A.: Atmospheric organic and bio-aerosols ascloud condensation nuclei (CCN): A review, Atmos. Environ.,40, 795–820, 2006.
Sun, Y., Zhuang, G., Tang, A., Wang, Y., and An, Z.: Chemicalcharacteristics of PM2.5 and PM10 in haze-fog episodes in Bei-jing, Environ. Sci. Technol., 40, 3148–3155, 2006.
Utsunomiya, S., Jensen, K. A., Keeler, G. J., and Ewing, R. C.:Uraninite and fullerene in atmospheric particulates, Environ. Sci.Technol., 36, 4943–4947, 2002.
Utsunomiya, S., Jensen, K. A., Keeler, G. J., and Ewing, R. C.: Di-rect identification of trace metals in fine and ultrafine particles inthe Detroit urban atmosphere, Environ. Sci. Technol., 38, 2289–2297, 2004.
Varutbangkul, V., Brechtel, F. J., Bahreini, R., Ng, N. L., Keywood,M. D., Kroll, J. H., Flagan, R. C., Seinfeld, J. H., Lee, A., andGoldstein, A. H.: Hygroscopicity of secondary organic aerosolsformed by oxidation of cycloalkenes, monoterpenes, sesquiter-penes, and related compounds, Atmos. Chem. Phys., 6, 2367–2388,doi:10.5194/acp-6-2367-2006, 2006.
Vernooij, M. G. C., Mohr, M., Tzvetkov, G., Zelenay, V., Huth-welker, T., Kaegi, R., Gehrig, R., and Grobety, B.: On sourceidentification and alteration of single diesel and wood smoke sootparticles in the atmosphere: An X-ray microspectroscopy study,Environ. Sci. Technol., 43, 5339–5344, 2009.
Vikt oria, K. K, Mihaly, P., and Janos, L.: Nanostructure of atmo-spheric soot particles, Atmos. Environ., 40, 5533–5542, 2006.
Wittmaack, K., Wehnes, H., Heinzzmann, U., and Agerer, R.:An overview on bioaerosols viewed by scanning electron mi-croscopy, Sci. Total Environ., 346, 244–255, 2005.
Zhang, D., Shi, G.-Y., Iwasaka, Y., and Hu, M.: Mixture of sulphateand nitrate in coastal atmospheric aerosols: individual particlestudies in Qingdao (36◦4′ N, 120◦21′ E), China, Atmos. Envi-ron., 34, 2669–2679, 2000.
Zhang, R.: Atmospheric new particle formation enhanced by or-ganic acids, Science, 304, 1487–1490, 2004a.
Zhang, R., Khalizov, A. F., Pagels, J., Zhang, D., Xue, H. X., andMcMurry, P. H.: Variability in morphology, hygroscopicity, andoptical properties of soot aerosols during atmospheric process-ing, P. Natl. Acad. Sci. USA, 105, 10291–10296, 2008.
Zhang, Y., Yu, Q., Ma, W., and Chen, L.: Atmospheric deposi-tion of inorganic nitrogen to the eastern China seas and its im-plications to marine biogeochemistry, J. Geophys. Res., 115,D00K10,doi:10.1029/2009JD012814, 2010.
Zhou, X., Gao, J., Wang, T., Wu, W., and Wang, W.: Measurementof black carbon aerosols near two Chinese megacities and the im-plications for improving emission inventories, Atoms. Environ.,43, 3918–3924, 2009.
Zuberi, B., Johnson, K. S., Aleks, G. K., Molina, L. T., Molina, M.J., and Laskin, A.: Hydrophilic properties of aged soot, Geophys.Res. Lett., 32, L01807,doi:10.1029/2004GL021496, 2005.
www.atmos-chem-phys.net/12/693/2012/ Atmos. Chem. Phys., 12, 693–707, 2012


![[AMT04] Surface Composition and Morphology of Layered Double …web.usm.my/nsf/proceedings/pAMT04.pdf · 2004-12-16 · [AMT04] Surface Composition and Morphology of Layered Double](https://static.fdocuments.net/doc/165x107/5e8f4d08ccfa371df80ee1bf/amt04-surface-composition-and-morphology-of-layered-double-webusmmynsfproceedings.jpg)


