Simple Chemical Routes for Changing Composition or Morphology in
Particle Size, Morphology, and Chemical Composition ControlledCoFe2O4 Nanoparticles with Tunable Magnetic Properties via OleicAcid Based Solvothermal Synthesis for Application in ElectronicDevicesSumayya M. Ansari,† Bhavesh B. Sinha,‡ Deodatta Phase,§ Debasis Sen,∥,⊥ Pulya U. Sastry,∥,⊥
Yesh D. Kolekar,*,† and Chintalapalle V. Ramana*,#
†Department of Physics, Savitribai Phule Pune University, Pune 411007, India‡National Center for Nanoscience and Nanotechnology, University of Mumbai, Mumbai 400098, India§UGC-DAE, Consortium for Scientific Research, Khandwa Road, Indore 452001, India∥Solid State Physics Division, Bhabha Atomic Research Centre, Mumbai 400085, India⊥Homi Bhabha National Institute, Anushaktinagar, Mumbai 400094, India#Center for Advanced Materials Research (CMR), University of Texas at El Paso, 500 W. University Avenue, El Paso, Texas 79968,United States
*S Supporting Information
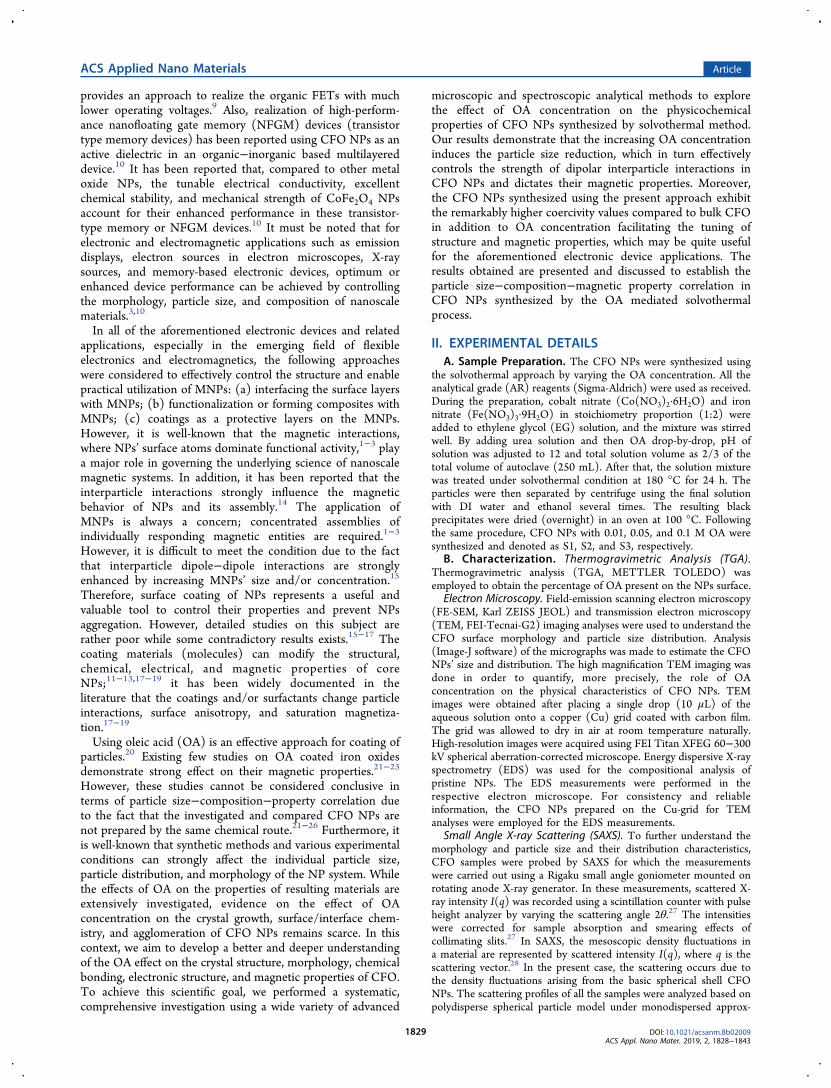
ABSTRACT: We report on the realization of particle size, morphology, andchemical composition controlled cobalt ferrite nanoparticles (CFO NPs) withtunable magnetic properties for application in electronic and electromagneticdevices. The effect of oleic acid concentration (0.0−0.1 M) on the structural,physical, chemical, electronic, and magnetic properties of solvothermallysynthesized CFO NPs is investigated in detail by using the oleic acid (OA)based chemical method for synthesis. Crystalline, cubic, and chemicallyhomogeneous CFO NPs (5−15 nm) can be obtained by controlling the OAconcentration. Spectroscopic analyses revealed that the OA molecules formcovalent bonds with CFO NPs. The particle-size control was achieved bybridging bidentate interactions between the OA molecules and CFO NPs.Detailed magnetic measurements revealed that the OA concentration helps toeffectively control the magnetic behavior of particle-size-controlled CFO NPs.The interfacing between OA molecules and CFO surface atoms leads tomodified magnetism which is the key to understand the underlying mechanisms and utilize magnetic nanoparticles in practicalapplications. The anisotropy constant variation directly with nanoparticle size indicates that the magnetocrystalline componentgoverns the magnetic anisotropy in OA coated CFO. Removal of OA (after thermal treatment) induces enhanced magneticanisotropy and exchange bias as consequence of surface component. The results and analyses suggest that the molecular coatingof nanoparticles offers the most important and critical step to design novel nanostructured magnetic materials for current andemerging electronic device technologies.KEYWORDS: cobalt ferrite, nanoparticles, surface coating, oleic acid, structure, magnetism
I. INTRODUCTION
Magnetic nanostructured cobalt ferrite, CoFe2O4 (CFO), hasthe vast potential for applications in several technologies.1−10
CFO nanoparticles (NPs) and nanomaterials find applicationin magnetic hyperthermia, molecular imaging, electronics,spintronics, information storage, supercapacitors, drug delivery,magnetic resonance imaging, and catalysis.1−8 Recently,nanostructured CFO has been proposed as a candidatematerial for the field emission based electronic displaydevices.3 By virtue of exceptional cubic magnetocrystallineanisotropy, which is (1.8−3.0) × 106 erg/cm3, and tunableelectrical properties, CFO NPs have been widely considered
for integration into many of the current and emergingelectronic and electromagnetic device applications.1−10 Mostrecently, CFO NPs have been attracting the attention ofscientific and research community for their effective utilizationin flexible and organic electronics, specifically in field effecttransistors (FETs) and memory devices for high-performancecomputing.9,10 For instance, functionalization of diphenylala-nine-based self-assembled nanotubes with CFO magnetic NPs
Received: November 7, 2018Accepted: February 26, 2019Published: February 26, 2019
Article
www.acsanm.orgCite This: ACS Appl. Nano Mater. 2019, 2, 1828−1843
© 2019 American Chemical Society 1828 DOI: 10.1021/acsanm.8b02009ACS Appl. Nano Mater. 2019, 2, 1828−1843
Dow
nloa
ded
via
UN
IV O
F T
EX
AS
AT
EL
PA
SO o
n Ju
ly 2
4, 2
019
at 1
7:47
:55
(UT
C).
See
http
s://p
ubs.
acs.
org/
shar
ingg
uide
lines
for
opt
ions
on
how
to le
gitim
atel
y sh
are
publ
ishe
d ar
ticle
s.
provides an approach to realize the organic FETs with muchlower operating voltages.9 Also, realization of high-perform-ance nanofloating gate memory (NFGM) devices (transistortype memory devices) has been reported using CFO NPs as anactive dielectric in an organic−inorganic based multilayereddevice.10 It has been reported that, compared to other metaloxide NPs, the tunable electrical conductivity, excellentchemical stability, and mechanical strength of CoFe2O4 NPsaccount for their enhanced performance in these transistor-type memory or NFGM devices.10 It must be noted that forelectronic and electromagnetic applications such as emissiondisplays, electron sources in electron microscopes, X-raysources, and memory-based electronic devices, optimum orenhanced device performance can be achieved by controllingthe morphology, particle size, and composition of nanoscalematerials.3,10
In all of the aforementioned electronic devices and relatedapplications, especially in the emerging field of flexibleelectronics and electromagnetics, the following approacheswere considered to effectively control the structure and enablepractical utilization of MNPs: (a) interfacing the surface layerswith MNPs; (b) functionalization or forming composites withMNPs; (c) coatings as a protective layers on the MNPs.However, it is well-known that the magnetic interactions,where NPs’ surface atoms dominate functional activity,1−3 playa major role in governing the underlying science of nanoscalemagnetic systems. In addition, it has been reported that theinterparticle interactions strongly influence the magneticbehavior of NPs and its assembly.14 The application ofMNPs is always a concern; concentrated assemblies ofindividually responding magnetic entities are required.1−3
However, it is difficult to meet the condition due to the factthat interparticle dipole−dipole interactions are stronglyenhanced by increasing MNPs’ size and/or concentration.15
Therefore, surface coating of NPs represents a useful andvaluable tool to control their properties and prevent NPsaggregation. However, detailed studies on this subject arerather poor while some contradictory results exists.15−17 Thecoating materials (molecules) can modify the structural,chemical, electrical, and magnetic properties of coreNPs;11−13,17−19 it has been widely documented in theliterature that the coatings and/or surfactants change particleinteractions, surface anisotropy, and saturation magnetiza-tion.17−19
Using oleic acid (OA) is an effective approach for coating ofparticles.20 Existing few studies on OA coated iron oxidesdemonstrate strong effect on their magnetic properties.21−23
However, these studies cannot be considered conclusive interms of particle size−composition−property correlation dueto the fact that the investigated and compared CFO NPs arenot prepared by the same chemical route.21−26 Furthermore, itis well-known that synthetic methods and various experimentalconditions can strongly affect the individual particle size,particle distribution, and morphology of the NP system. Whilethe effects of OA on the properties of resulting materials areextensively investigated, evidence on the effect of OAconcentration on the crystal growth, surface/interface chem-istry, and agglomeration of CFO NPs remains scarce. In thiscontext, we aim to develop a better and deeper understandingof the OA effect on the crystal structure, morphology, chemicalbonding, electronic structure, and magnetic properties of CFO.To achieve this scientific goal, we performed a systematic,comprehensive investigation using a wide variety of advanced
microscopic and spectroscopic analytical methods to explorethe effect of OA concentration on the physicochemicalproperties of CFO NPs synthesized by solvothermal method.Our results demonstrate that the increasing OA concentrationinduces the particle size reduction, which in turn effectivelycontrols the strength of dipolar interparticle interactions inCFO NPs and dictates their magnetic properties. Moreover,the CFO NPs synthesized using the present approach exhibitthe remarkably higher coercivity values compared to bulk CFOin addition to OA concentration facilitating the tuning ofstructure and magnetic properties, which may be quite usefulfor the aforementioned electronic device applications. Theresults obtained are presented and discussed to establish theparticle size−composition−magnetic property correlation inCFO NPs synthesized by the OA mediated solvothermalprocess.
II. EXPERIMENTAL DETAILSA. Sample Preparation. The CFO NPs were synthesized using
the solvothermal approach by varying the OA concentration. All theanalytical grade (AR) reagents (Sigma-Aldrich) were used as received.During the preparation, cobalt nitrate (Co(NO3)2·6H2O) and ironnitrate (Fe(NO3)3·9H2O) in stoichiometry proportion (1:2) wereadded to ethylene glycol (EG) solution, and the mixture was stirredwell. By adding urea solution and then OA drop-by-drop, pH ofsolution was adjusted to 12 and total solution volume as 2/3 of thetotal volume of autoclave (250 mL). After that, the solution mixturewas treated under solvothermal condition at 180 °C for 24 h. Theparticles were then separated by centrifuge using the final solutionwith DI water and ethanol several times. The resulting blackprecipitates were dried (overnight) in an oven at 100 °C. Followingthe same procedure, CFO NPs with 0.01, 0.05, and 0.1 M OA weresynthesized and denoted as S1, S2, and S3, respectively.
B. Characterization. Thermogravimetric Analysis (TGA).Thermogravimetric analysis (TGA, METTLER TOLEDO) wasemployed to obtain the percentage of OA present on the NPs surface.
Electron Microscopy. Field-emission scanning electron microscopy(FE-SEM, Karl ZEISS JEOL) and transmission electron microscopy(TEM, FEI-Tecnai-G2) imaging analyses were used to understand theCFO surface morphology and particle size distribution. Analysis(Image-J software) of the micrographs was made to estimate the CFONPs’ size and distribution. The high magnification TEM imaging wasdone in order to quantify, more precisely, the role of OAconcentration on the physical characteristics of CFO NPs. TEMimages were obtained after placing a single drop (10 μL) of theaqueous solution onto a copper (Cu) grid coated with carbon film.The grid was allowed to dry in air at room temperature naturally.High-resolution images were acquired using FEI Titan XFEG 60−300kV spherical aberration-corrected microscope. Energy dispersive X-rayspectrometry (EDS) was used for the compositional analysis ofpristine NPs. The EDS measurements were performed in therespective electron microscope. For consistency and reliableinformation, the CFO NPs prepared on the Cu-grid for TEManalyses were employed for the EDS measurements.
Small Angle X-ray Scattering (SAXS). To further understand themorphology and particle size and their distribution characteristics,CFO samples were probed by SAXS for which the measurementswere carried out using a Rigaku small angle goniometer mounted onrotating anode X-ray generator. In these measurements, scattered X-ray intensity I(q) was recorded using a scintillation counter with pulseheight analyzer by varying the scattering angle 2θ.27 The intensitieswere corrected for sample absorption and smearing effects ofcollimating slits.27 In SAXS, the mesoscopic density fluctuations ina material are represented by scattered intensity I(q), where q is thescattering vector.28 In the present case, the scattering occurs due tothe density fluctuations arising from the basic spherical shell CFONPs. The scattering profiles of all the samples were analyzed based onpolydisperse spherical particle model under monodispersed approx-
ACS Applied Nano Materials Article
DOI: 10.1021/acsanm.8b02009ACS Appl. Nano Mater. 2019, 2, 1828−1843
1829
imation.29 For the correlated structures of CFO NPs, interparticlemass fractal structure factors were taken into consideration for eachsample. The spherical shell form factor is parametrized with an innerradius R2 and outer radius R1 of particle. A more detailed account offitting procedures and underlying theory of SAXS is presented in theSupporting Information.X-ray Diffraction (XRD). D8-Advanced Bruker X-ray powder
diffractometer was used to perform XRD measurements using CuKα radiation (λ = 1.5406 Å). Powder sample was scanned slowly overa 2θ range of 20−80° at a scanning rate of 4° min−1. Rietveldrefinement was employed to obtain detailed structural information onthe CFO NPs. To generate theoretical XRD patterns, ICSD data withcollection code 109044 were used.Infrared and Raman Spectroscopy. To better understand the
adsorption mechanism of the OA on the surface of CFO NPs, theFourier transform infrared spectroscopic (FTIR) measurements wereperformed on pure OA and CFO NPs prepared with a variable OAconcentration. The FTIR spectra of powder samples were recordedwith the FTIR spectrometer (JASCO-6100) in the range of 400−4000 cm−1. Nanoparticles were analyzed by dispersing powders inKBr as 1:4 ratios followed by grinding and prepared the pellets. Inaddition to FTIR measurements, Raman spectroscopic measurementswere made to probe the chemical effects of OA and its concentrationon the chemical bonding and local structure. Raman spectroscopicstudies were performed on an InVia Micro RAMAN (Renishaw)spectrophotometer with 532 nm laser excitation. The recordedRaman spectra of all the samples were fitted by superposition ofLorentzian peak shape function.X-ray Photoelectron Spectroscopy (XPS). Chemical composition
analyses were made using X-ray photoelectron spectroscopy (XPS).Al Kα (1486.6 eV) X-ray source was employed for XPS measure-ments.Magnetic Measurements. Magnetic measurements were per-
formed using the Quantum Design (QD) Evercool II PPMS-6000.The magnetization hysteresis (M-H) loops were measured at 385 and5 K by applying the magnetic field up to ±60 kOe. The temperaturedependent magnetization, i.e., M(T), was measured under an appliedmagnetic field of 100 Oe and over a temperature range from 10 to 395K and zero-field-cooling (ZFC) and field-cooling (FC) conditions.
III. RESULTS AND DISCUSSIONA. Morphology, Crystallography, and Structural
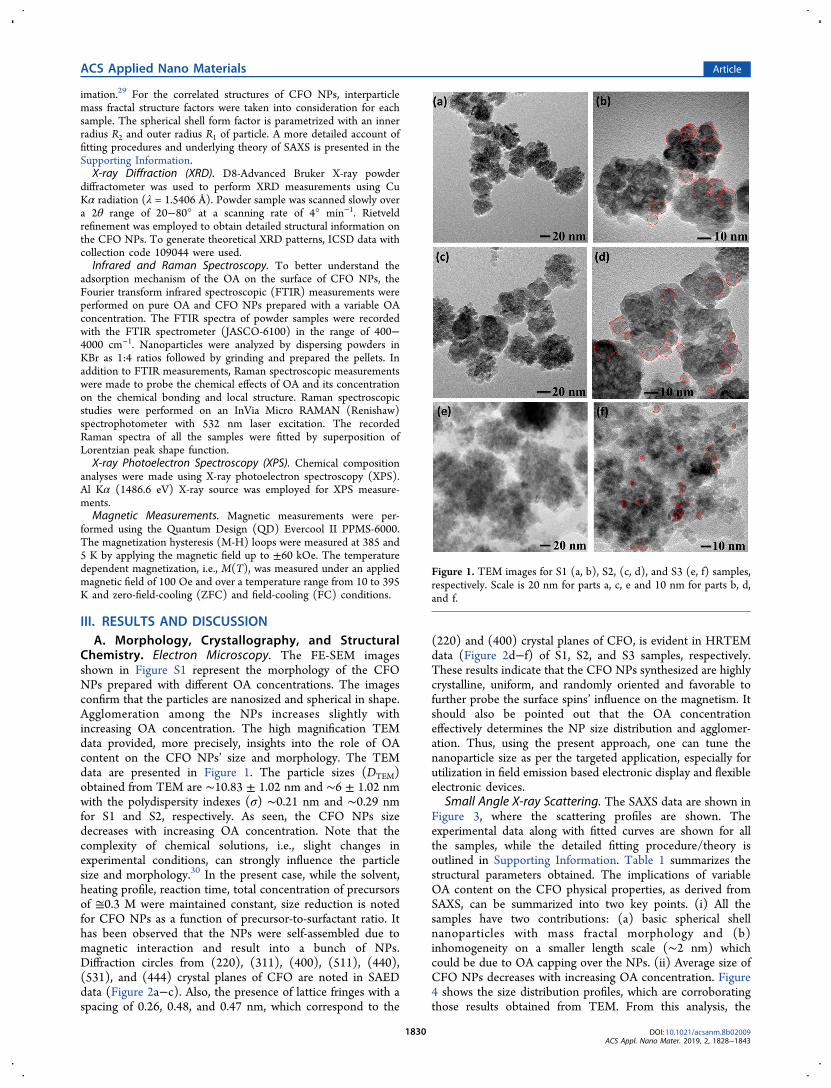
Chemistry. Electron Microscopy. The FE-SEM imagesshown in Figure S1 represent the morphology of the CFONPs prepared with different OA concentrations. The imagesconfirm that the particles are nanosized and spherical in shape.Agglomeration among the NPs increases slightly withincreasing OA concentration. The high magnification TEMdata provided, more precisely, insights into the role of OAcontent on the CFO NPs’ size and morphology. The TEMdata are presented in Figure 1. The particle sizes (DTEM)obtained from TEM are ∼10.83 ± 1.02 nm and ∼6 ± 1.02 nmwith the polydispersity indexes (σ) ∼0.21 nm and ∼0.29 nmfor S1 and S2, respectively. As seen, the CFO NPs sizedecreases with increasing OA concentration. Note that thecomplexity of chemical solutions, i.e., slight changes inexperimental conditions, can strongly influence the particlesize and morphology.30 In the present case, while the solvent,heating profile, reaction time, total concentration of precursorsof ≅0.3 M were maintained constant, size reduction is notedfor CFO NPs as a function of precursor-to-surfactant ratio. Ithas been observed that the NPs were self-assembled due tomagnetic interaction and result into a bunch of NPs.Diffraction circles from (220), (311), (400), (511), (440),(531), and (444) crystal planes of CFO are noted in SAEDdata (Figure 2a−c). Also, the presence of lattice fringes with aspacing of 0.26, 0.48, and 0.47 nm, which correspond to the
(220) and (400) crystal planes of CFO, is evident in HRTEMdata (Figure 2d−f) of S1, S2, and S3 samples, respectively.These results indicate that the CFO NPs synthesized are highlycrystalline, uniform, and randomly oriented and favorable tofurther probe the surface spins’ influence on the magnetism. Itshould also be pointed out that the OA concentrationeffectively determines the NP size distribution and agglomer-ation. Thus, using the present approach, one can tune thenanoparticle size as per the targeted application, especially forutilization in field emission based electronic display and flexibleelectronic devices.
Small Angle X-ray Scattering. The SAXS data are shown inFigure 3, where the scattering profiles are shown. Theexperimental data along with fitted curves are shown for allthe samples, while the detailed fitting procedure/theory isoutlined in Supporting Information. Table 1 summarizes thestructural parameters obtained. The implications of variableOA content on the CFO physical properties, as derived fromSAXS, can be summarized into two key points. (i) All thesamples have two contributions: (a) basic spherical shellnanoparticles with mass fractal morphology and (b)inhomogeneity on a smaller length scale (∼2 nm) whichcould be due to OA capping over the NPs. (ii) Average size ofCFO NPs decreases with increasing OA concentration. Figure4 shows the size distribution profiles, which are corroboratingthose results obtained from TEM. From this analysis, the
Figure 1. TEM images for S1 (a, b), S2, (c, d), and S3 (e, f) samples,respectively. Scale is 20 nm for parts a, c, e and 10 nm for parts b, d,and f.
ACS Applied Nano Materials Article
DOI: 10.1021/acsanm.8b02009ACS Appl. Nano Mater. 2019, 2, 1828−1843
1830

average outer radius of NPs is found to be 6.32, 4.02, and 3.59nm for S1, S2, and S3 samples, respectively. It is observed thatthe difference between outer and inner radius, i.e., ΔR, is foundto be <2 nm for S1 and S2, which indicates the OA monolayercoating (OA length size of ∼0.97 nm) for S1 and S2 samples.On the other hand, ΔR > 2 nm noted for S3 sample impliesthe multilayer OA coating. This agrees well with thermal
analysis where the weight loss was <20% for S1 and S2samples, confirming the monolayer coating of OA. Multilayersurfactant coating occurs for S3 sample for which the weightloss is >20%. It is noteworthy that the size of the fractalaggregate and monomer radius also decreases with increasingconcentration of OA.The marginal differences in the trend of particle-size
distribution, polydispersity index, and mean size as obtainedfrom SAXS and TEM may be due their specific sensitivity andorigin of the probing. It must be noted that SAXS providesstructural information averaged over a wider region of thesamples and gives the statistically averaged informationwhereas electron-microscopy-based techniques such FESEMand TEM provide direct but local information based on theregion of interest or a selected smaller region. In thiscircumstance, it will be more consistent to believe or acceptthe structural information obtained via the applied scatteringtechnique (i.e., SAXS data). As the crucial magnetic propertiesstrongly depend on the structural parameters of the systems, itbecomes more sensitive when dealing with the materials andsystems at nanoscale dimensions. Overall, the structural andmorphological analyses via TEM and SAXS strongly suggest orprovide evidence that the particle size of CFO NPs decreaseswith increasing OA concentration. The energy dispersive X-rayspectrometry (EDS) analysis of the samples was employed tounderstand the chemical composition and homogeneity of thepristine CFO NPs. The EDS spectrum obtained for all thesamples are shown in Figure S2. The results indicate the as-synthesized CFO NPs are chemically homogeneous withoutany impurities and/or contaminating elements from reagents.Furthermore, presence of C is expected due to the capping ofOA (CH3−(CH2)7−CHCH−(CH2)7−COOH) on thesurface of NPs.
X-ray Diffraction. The primary purpose of XRD analyses isto understand the effect of OA concentration on the crystalstructure and the average crystallite size of CFO NPs. X-raydiffraction patterns (Figure 5) along with the Rietveldrefinement indicate that all the samples are crystallized in thecubic structure in agreement with JCPDS card no. 22-1086
Figure 2. SAED pattern (a−c) and HRTEM images (d−f) for S1, S2, and S3 samples, respectively.
Figure 3. SAXS profile in double logarithmic scale for S1, S2, and S3samples. Solid line represents the fit of model to the experimentalcurve.
Table 1. Structural Parameter Obtained from SAXS Data
samples parameters S1 S2 S3
outer radius (R1, nm) 6.32 4.02 3.59inner radius (R2, nm) 4.35 2.05 1.17polydispersity index (σ, nm) 0.16 0.26 0.33radius of the monomer (ro, nm) 3.79 3.37 3.11size of aggregate (xi, nm) 20.53 44.92 51fractal dimension (D) 2.99 2.83 2.81
ACS Applied Nano Materials Article
DOI: 10.1021/acsanm.8b02009ACS Appl. Nano Mater. 2019, 2, 1828−1843
1831

with a space group Fd3m (227) without any impurities exceptfor S2. Sample S2 exhibits a weak peak of hematite, Fe2O3,phase at 2θ = 32.29° (JCPDS card no. 33-0664). The crystalstructure parameters resulting from refinement procedure arelisted in Table 2. With increasing OA concentration, the
diffraction peaks become broader implying the averagecrystallite size reduction. The average crystallite size estimatedfrom XRD data indicates a reduction from 15.4 to 6.89 nmwhich agrees with the other reports.22 Thus, by varying theconcentration of OA, one can tune the crystallite size of CFONPs. Furthermore, the lattice constants for S1 and S3 samplesare found to be smaller compared to bulk CFO (8.391 Å).Such lower values for NPs compared to bulk may bepredominantly due to reduced dimensionality size-effects,which also include surface dipole interactions, surface tension,and cation charge distribution,1,31 whereas for S2 sample, thelattice constant value is slightly larger than that of the bulkCFO which may be due to the presence of hematite phase.Overall, it is inferred that the crystallite size decreases whilelattice parameters vary due to change in OA concentration.From the structural analysis, CFO NP size decreases; however,agglomeration becomes dominant at higher OA concentration(S3). Thus, fundamentally, OA addition controls thenucleation, growth, and size of CFO NPs. Variation incrystallographic parameters was also noted in doped andsize-controlled CFO.1 In ferrites, the lattice constant is usuallyaffected by the cationic stoichiometry. However, in the presentcase, OA coating has not affected the cationic balance(confirmed by XPS) but affects the particle size and theaverage crystallite size as evidenced in TEM, SAXS, and XRDanalyses. Therefore, lattice parameter variation in CFO NPs
Figure 4. Size distribution obtained from SAXS profile for S1, S2, and S3 samples.
Figure 5. XRD data of CFO NPs. Rietveld refined XRD patternsalong with experimental data are shown for (a) S1, (b) S2, and (c) S3samples, respectively.
Table 2. Structural Parameters Obtained from RietveldRefinements of XRD Analysis
sample
goodnessof fit(GoF)(χ2)
crystallitesize (nm)for (311)peak
(±0.15)
latticeparameter(a, Å)
(±0.015)X-ray density(dX‑ray, g/cm
3)
volume ofunit cell(V, nm 3)
S1 0.964 15.4 8.365 5.324 0.585S2 1.07 8.94 8.393 5.271 0.591S3 1.01 6.89 8.377 5.302 0.588
ACS Applied Nano Materials Article
DOI: 10.1021/acsanm.8b02009ACS Appl. Nano Mater. 2019, 2, 1828−1843
1832

may be following a different mechanism. Note that theoccupancy and Wyckoff positions of Co2+ and Fe3+ cations arenearly same for all the samples at tetrahedral as well asoctahedral sites (Table S1). Moreover, different occupancy wasobserved for oxygen anion for all the samples. Therefore, itappears that OA established the chemical coordination withoxygen in the lattice with the covalent bond (from FTIR)being the origin. As a result, overall charge compensation ofCFO can become disturbed. Additionally, lattice defects maybe generated. All these factors may contribute to variation inlattice parameters. From Table 3, it can be seen that the bondlengths observed at tetrahedral site and octahedral site, i.e., O−Fe2, O−Co1 bond lengths, and intercation distances, i.e.,Co1−Co1, Co1−Fe2, slightly change with OA concentration.Simultaneously, it is evident from the bond angles observed attetrahedral and octahedral sites that the S1, S2, and S3 samplesare stabilized in the cubic structure with almost no localdistortion at the tetrahedral and octahedral sites. The O−Fe2−O and O−Co2−O angles exactly match with an ideal spinelvalue of 109.47° for all the samples. In addition, the O−Co1−O and O−Fe1−O bond angles are found to be in agreementwith the ideal value of 90°. Similarly, in agreement with idealvalue, the angle of Co1−O−Co2, Fe1−O−Co2, Co1−O−Fe2,and Fe1−O−Fe2 bonds is observed to be 125.26° for all thesamples. Therefore, (i) absence of local distortion attetrahedral and octahedral sites and (ii) decrease in sizefrom 15 to 6.89 nm strongly support the major role of oxygenand covalent bond formation of OA with CFO NPs. Differentvalues of oxygen occupancy observed from diffraction data alsosupport the observations made for all the samples.B. Thermogravimetric (TGA) Analysis. The TGA data
(Figure 6) reveal distinct four- and three-step weight loss forS2 and (S1, S3) samples, respectively. Initial weight loss(∼50−100 °C range) of 1.37%, 2.86%, and 1.24%, observedfor S1, S2, and S3, corresponds to chemical desorption ofmoisture and volatile components. S1 and S3 samples exhibitthe second weight loss of 4.69% and 13.93% in thetemperature range of 92−374 °C and 90−465 °C, respectively.Since the decomposition temperature of OA is 360 °C, thisweight loss must be due to the separation of functional groups(COOH) from surfactant layer. The third weight loss values of1.43% and 32.43% in the temperature range of 374−900 °Cand 465−690 °C were mainly from CO and CO2 effluentsfrom the S1 and S3, respectively. On the other hand, S2exhibits the second and third weight loss of 2.76% and 3.68%due to the breaking of weakly and well-bound functionalgroups (COOH) from surfactant molecules. And the fourth
weight loss of 2.2% is observed in 536−900 °C range. Overall,the total weight loss was observed to be 7.49%, 11.5%, and47.11% for S1, S2, and S3, respectively. The thermal behaviorof samples depends on several factors, namely, structure,homogeneity, composition, etc. Usually, a decrease in theparticle size leads to a faster release of decomposition products,i.e., faster weight loss. The particle size reduction increases thesurface area, as observed from calculation, leading to moreuptake of water molecules and their release during heating. Ithas been reported that monolayer coating of surfactant ispresent when weight loss is <20% and several layers ofsurfactant are present when weight loss is >20%.32,33 Thus,surfactant forming a monolayer on individual CFO NPs isevident for S1 and S2, whereas several surfactant layers are forS3, as the weight loss is >20%. For spherical NPs of diameter d,close-packed surfactant monolayer OA molecules occupysurface area “a”, and the surface area per particle is ∼πd2.Then, total number of particles is [(100 − W)/ρ](πd3/6),where “W” is the weight of surfactant in percentage and “ρ” isthe density of particle. If M is the surfactant molecular weight,the total number of surfactant molecules is WN0/M, where, N0is Avogadro number. Therefore, the surface area “a” occupiedby OA molecules is given by
Table 3. Bond Angle and Bond Length Extracted from Rietveld Refinement for the Samples
bond angle (deg) bond length (Å)
S1 S2 S3 S1 S2 S3
Co1−O−Fe2 125.26 125.25 124.26 d12 = Co1−O 2.091 2.098 2.094d23 = O−Fe2 1.811 1.8172 1.814d13 = Co1−Fe2 3.468 3.478 3.471
O−Fe2−O 109.47 109.47 109.47 d12 = O−Fe2 1.811 1.817 1.814d23 = Fe2−O 1.811 1.817 1.814d13= O−O 2.957 2.967 2.962
O−Co1−O 90 90 90 d12 = O−Co1 2.091 2.098 2.094d23 = Co1−O 2.091 2.098 2.094d13 = O−O 2.957 2.967 2.962Co1−Co1 2.957 2.967 2.962Co1−Fe2 3.468 3.478 3.473
Figure 6. Thermogravimetric curve (under air atmosphere) for (a)S1, (b) S2, and (c) S3 samples.
ACS Applied Nano Materials Article
DOI: 10.1021/acsanm.8b02009ACS Appl. Nano Mater. 2019, 2, 1828−1843
1833

ρ= −
aW M
N d W6(100 )
0 (1)
Thus, the surface area of OA molecule on CFO is 0.516 nm2,0.501 nm2, and 0.081 nm2 for S1, S2, and S3, respectively.32,33
Furthermore, by use of weight loss, the number of OAmolecules per particle can be estimated as
ρ π=
× −
NWN R
M
10043
3 23
(2)
where N is the number of surfactant molecules (ligands) perparticle, W is the weight loss in percent (%), N0 is Avogadro’snumber, ρ is the density of NPs, R is the average radius ofCFO NPs (obtained from SAXS analysis), and M is themolecular weight of OA (282.47 g/mol). The number of OAligands per particle is ∼899, 351, and 1041 for S1, S2, and S3,respectively.24,30
C. Chemical Bonding, Stability, and Surface Chem-istry. Fourier Transform Infrared Spectroscopy. The FTIRspectra of the samples are shown in Figure 7. Identification ofpeaks and mode assignment was made in accordance with theliterature.19,34,35 Vibrational modes observed for pure OA andOA coated CFO are presented in Supporting Information(Tables S2 and S3). A detailed description of FTIR spectra ofpure OA is also presented in Supporting Information. Figure7a presents the FTIR spectra (400−4000 cm−1) for S1, S2, andS3. From magnified data in the range of 2500−4000cm−1(Figure 7b), it has been observed that the S1, S2, and
S3 samples exhibit a broad peak at 3420 cm−1 and a broadpeak at 3301 cm−1, which are due to stretching vibrations ofhydroxyl groups likely originating from sample moisture.36 Aweak peak at 3003 cm−1, which is due to C−H stretching ofthe C−H group, can be noted only for S3 sample, while it isabsent for S1 and S2 samples. Furthermore, the −CH2−scissoring band is found to be at 1458 cm−1 for S1 sample,whereas this band is shifted to 1446 cm−1 for S2 and S3samples. Furthermore, −CH2− scissoring band becomesbroader and intense for S3 compared to S1 and S2 samples.The absorption band positioned at 1384 cm−1, which is clearlynoted for S2 and S3 samples, is assigned to the vibration ofdouble covalent bond in −CHCH−. The asymmetric andsymmetric stretching of a −CH2− group is positioned at(2927, 2925) cm−1 and (2858, 2854) cm−1, respectively. TheseIR bands are more intense for samples S1 and S3 compared toS2. Meanwhile, asymmetric stretching of a −CH3 groupappears as a weak shoulder at 2961 cm−1 for S1 and S2 (Figure7b). It is essential to mention that the two new peaks found at1664 (for S1 only) and 1500 cm−1 (for S1, S2, and S3) (Figure7c) are typical and ascribed to the asymmetric and symmetricstretching, respectively, of a −COO− group. According toliterature, confirmation for the capping of OA is revealed bythe absence of −CO stretching bond of the carboxyl group(OA) and the presence of two characteristic bands ofasymmetric and symmetric −COO− stretching bands.36
Thus, in the present study, it is evident that the −COstretching band of the carboxyl group, which is present at 1708
Figure 7. FTIR spectra for S1, S2, and S3 samples (a) for 400−4000 cm−1 and, for clarity, the magnified data (b) from 2500 to 4000 cm−1, (c)from 1100 to 2200 cm−1 that show asymmetric and symmetric −COO− stretching bands, (d) from 400 to 800 cm−1 which confirm the capping ofOA and pure phase formation of CFO NPs.
ACS Applied Nano Materials Article
DOI: 10.1021/acsanm.8b02009ACS Appl. Nano Mater. 2019, 2, 1828−1843
1834

cm−1 for pure OA (Figure S3), is fully absent in the spectra forS1, S2. and S3 samples (Figure 7c). However, the asymmetricstretching of a −COO− group shifts to 1659 cm−1 for S2 andS3 samples. Also, for all the samples, the asymmetric stretchingof a −COO− group is more intense compared to symmetricstretching of a −COO− group. The asymmetric stretching of a−COO− group is found to be broader and more intense for S3compared to S1 and S2 samples. Also, with increasing OAconcentration, broadening of the asymmetric stretching of a−COO− group increases. The difference in the averagecrystallite size accounts for this observation; enough spaceavailable to ligands to orient to stable conformation in largernanocrystals is not readily possible in smaller sized nanocryst-als. In addition, more surface related defects and thus fastervibrational relaxation occur in smaller size nanocrystals.Interestingly, S3 sample exhibits weak shoulder absorptionband at 1608 cm−1. In addition, a weak peak at 1718 cm−1
suggests the physically absorbed OA for S2 only. Overall, theabsence of (−COOH) characteristic peak suggests theformation of OA monolayer on the surface of CFO NPs andwe assume that the interaction of OA for S2 is poor comparedto S1 and S3. Thus, the absence of signature peak for thecarbonyl group and a decrease in intensity of the broad signalwith increasing OA concentration are the highlights of IRspectra.Furthermore, wavenumber separation (Δ) between the
asymmetric and symmetric (−COO−) stretching bands
dictates the type of interaction present between the carboxylateand metal atoms on the surface. The four types of interactionsare monodentate, bridging bidentate, chelating bidentate, andionic interaction. For monodentate interaction, Δ is largest(∼200−320 cm−1) while the smallest Δ (<110 cm−1)corresponds to the chelating bidentate. Bridging bidentateinteraction is characterized by the intermediate or mediumrange Δ (∼110−200 cm−1). The Δ values were 164, 159 cm−1
for S1, (S2 and S3) samples; thus, the characteristic bridgingbidentate interaction where both the oxygen atoms of OA forma covalent bond with the two different metal atoms on thesurface is evident. Furthermore, the IR spectra exhibit twomore absorption bands below 700 cm−1 as expected for ferriteNPs (Figure 7d). First absorption band (ν1) is observed at609, 597, and 599 cm−1, and second band (ν2) is positioned at(412, 422, 433, 442, and 454 cm−1), (416, 427, 453, 460, and470 cm−1), and (410, 418, 429, and 442 cm−1) for S1, S2, andS3 samples, respectively. The second band (ν2) could not beseen clearly since it is beyond the detection limit of our FTIRequipment (<400 cm−1). Thus, the formation of single phasespinel structure having two sublattices, tetrahedral (A) site andoctahedral (B) site, is confirmed by the absorption bandsobserved in the limit. Stretching vibrations of the tetrahedralmetal (Fe3+)−oxygen bond causes ν1 while ν2 is due to theoctahedral metal i.e., Co2+−oxygen and F+3−oxygen bondvibrations at octahedral sites. In the FTIR spectra recorded, theposition of the tetrahedral peak is at higher region compared to
Figure 8. Raman spectrum for (a) S1, (b) S2, and (c) S3 samples, where the experimental data, Raman active modes fitted with cumulative fit areshown.
ACS Applied Nano Materials Article
DOI: 10.1021/acsanm.8b02009ACS Appl. Nano Mater. 2019, 2, 1828−1843
1835

octahedral peak. Due to shorter bond length of the Fe−Obond at the tetrahedral lattice (compared to octahedral lattice,Table 3), more energy is required for the vibration. Therefore,the ν1 and ν2 intensity difference arises to the changes in bondlengths within octahedral versus tetrahedral site. In addition,minor splitting of the octahedral band observed near ν2 isattributed to the ‘“Jahn−Tellar”’ distortion, which is producedby Fe(II) ions causing the local deformation in the crystal fieldpotential with a result of the absorption band splitting.37,38
Raman Spectroscopy. The chemical effects of OA and itsconcentration on the CFO NPs were further confirmed by theRaman spectroscopic data, which are presented in Figure 8 andTable 4. The deconvoluted Raman spectra for all major peaksof the samples along with their fits are presented in Figure 8,while parameters derived are summarized in Table 4. Highquality cubic symmetry of CFO is further confirmed by thewell-defined peaks observed in Raman spectra. For CFO withan inverse cubic spinel structure (space group Fd3m (Oh
7)),group theory predicts five Raman active modes, i.e., A1g + Eg +3T2g. Thus, phonon mode assignment was carried out inaccordance with the literature.1 Raman peaks at 671, 672, and670 cm−1 for S1, S2, and S3 samples, respectively, representthe A1g mode, which is ascribed to the symmetric stretching ofoxygen with respect to metal ion in tetrahedral void. For S1,S2, and S3 samples, respectively, the Eg, T2g(2), and T2g(3)modes are reflected in the peaks located at Eg of 381, 375, and385 cm−1, T2g(2) of 466, 464, and 465 cm−1, and T2g(3) of586, 591, and 588 cm−1. Principally, Eg and 3T2g phononmodes that appear at <600 cm−1 are attributed to thesymmetric and antisymmetric bending of oxygen ion in M−Obond at octahedral voids (BO6). Furthermore, in the presentcase, T2g(1) mode is found to be at 276, 277, and 275 cm−1
along with one more additional peak which seems to bedoublet peak for S1, S2, and S3, respectively. The componentat ∼214 cm−1 is ascribed to the T2g mode of Fe3O4 NPs.
39 Theweak shoulder component, which is unassigned and located at123 and 132 cm−1 for S1 and S2 samples, is attributed todefect, surface disorder, or oxidation of metal cations.40 All theRaman modes are symmetric in nature; also, the modesexperience a shift toward lower wavenumber (Table 4) withdecreasing crystallite size from ∼15.4 to 8.94 nm for S1 and S2
samples. Crystalline disorder and grain boundaries, which arecommon in nanomaterials, account for such peak shift towardlower wavenumber. Full width at half-maximum (fwhm) isanother important characteristic parameter of Raman signal. Inthe present study, it is observed that broadening is moreintense for the S2 and S3 compared to S1. The peakbroadening and shift (lower wavenumber), which are typical inpolycrystalline materials, occur due to confinement of opticalphonons in a nanocrystallites.41,42 Furthermore, A1g, T2g(3),and Eg (for S3 only) modes represent the blue shift for S2 andS3 samples. Due to covalent bonding with the metal ions onthe surface, the OA capping layer may create lattice strain,which induces blue shift. Importantly, blue shift is moredominant for S3 compared to the S2 sample as theconcentration of OA is higher (0.1 M) for S3 samplecompared to S2. Evidently, compared to the rest of octahedraland tetrahedral Raman active modes, the T2g(1) mode is moreintense. This may be due to increased magnetic ordering atoctahedral site. However, while magnetic ordering alone is notthe principal cause, Raman mode is affected by several otherfactors such as crystalline disorder, defect density, etc.43
X-ray Photoelectron Spectroscopy. The XPS data of CFONPs are shown in Figure 9 and Figure S4 (SupportingInformation). The survey scans and core-level XPS data areshown. The XPS data of the S1, S2, and S3 samples (Figures 9and S4) exhibit O 1s, Fe 2p, Co 2p, and C 1s peaks and, thus,confirm the existence of the respective elements as expected.For S1 sample, the XPS of Fe 2p is presented in Figure 9b. Thebinding energy (BE) position of Fe 2p components, ΔE of Fe2p3/2 (712.51 eV) and 2p1/2 (725.91 eV), and the presence ofcorresponding shakeup satellites at 719.9 and 734.49 eV,respectively, characterize the Fe chemical valence as +3.44,45
Moreover, the BE for metallic state and Fe2+ is expected to bearound 707 and 709.9 eV, respectively, and could not bedetected in any of the samples. This observation rules out thepossibility of lower valence of Fe.46 For cobalt, Co2+ states areevident by the presence of characteristic 2p peaks at 782.96and 797.87 eV and with their respective satellite componentsat 787.97 and 804.95 eV.47,48 For all the samples, the O 1speak is located at BE of ∼523.49 eV, which characterizes theO2− ions in CFO.49 However, XPS of S1 sample indicates a
Table 4. Raman Vibrational Data along with the Assigned Modes for S1, S2, and S3 Samples
sample peak position (cm−1) fwhm (cm−1) area (cm−2) height (cm−1) Raman mode assigned polyhedra
S1 214.09 19.25 42020 1389.60 T2g(1) CoO6 or FeO6 octahedra276.12 42.91 88210 1308.67 T2g(1)381.24 63.54 33276 333.37 Eg
465.66 96.96 61039 400.75 T2g(2)586.26 94.40 73721.57 497.18 T2g(3)670.54 70.78 48109.69 432.69 Ag FeO4 tetrahedra
S2 213.76 19.58 23314.36 757.91 T2g(1) CoO6 or FeO6 octahedra277.04 46.17 65617.96 904.77 T2g(1)374.96 157.97 76088.74 306.62 Eg
463.51 98 73424.75 476.97 T2g(2)590.93 131.54 133453.44 645.87 T2g(3)672.47 71.71 63574.23 564.31 Ag FeO4 tetrahedra
S3 213.27 17.27 133427.09 4918.09 T2g(1) CoO6 or FeO6 octahedra275.43 37.22 254592.46 4354.17 T2g(1)385.31 36.03 47552.41 840.01 Eg
464.71 83.15 123774.48 947.63 T2g(2)587.65 86.80 185414.32 1359.75 T2g(3)670.48 50.46 91834.22 1158.47 Ag FeO4 tetrahedra
ACS Applied Nano Materials Article
DOI: 10.1021/acsanm.8b02009ACS Appl. Nano Mater. 2019, 2, 1828−1843
1836

Figure 9. continued
ACS Applied Nano Materials Article
DOI: 10.1021/acsanm.8b02009ACS Appl. Nano Mater. 2019, 2, 1828−1843
1837

peak at BE of ∼532.42 eV, which is due to the −COO−
carboxylate groups.50,51 Corroborating with IR analyses, thecarboxylate component in XPS validates the OA moleculesbonded to the CFO NPs in bidentate form.52 However, inCFO NPs, the minor contribution at BE of ∼532.1 eV is oftenformally described as O species, where oxygen is bonded to thesurface and near-surface defect sites.49 Furthermore, in all thesamples, we could verify the presence of OA capping on thesurface of the NPs by the presence of C peak which normallyoriginates at 285 eV. However, it must be emphasized that thecarbon peak in the XPS spectra may also be due toadventitious carbon from exposure of the samples to airfollowing synthesis, before being placed in the XPS system.Therefore, while C 1s peak in XPS alone cannot provide moredefinite information, the presence of OA capping on thesurface of the CFO NPs is validated more directly from FTIRresults, which corroborate with XPS to some extent.Remarkably, with an increase in OA concentration, the peakposition value of Co2+, Fe3+, O, and C is shifted toward thehigher binding energy from S1, S2 to S3, respectively. As theS3 sample exhibits multilayer coating of OA, the poor signal isoriginated for Fe3+ and strong signal is observed for C,compared to S1 and S2 samples.D. Magnetic Properties. The data shown in Figure 10a
indicate that the irreversibility between ZFC and FC curvesstart well above 395 K; thus, overcoming of superparamagneticlimit in all the samples is at >395 K. Moreover, with decreasingtemperature, it is seen that the bifurcation between the valuesof FC and ZFC magnetization increases which is indicative ofhigh anisotropic behavior. For S1 and S3, at low temperatures,
negative magnetization is measured at 100 Oe in ZFCcondition. The negative magnetization is also reported in theliterature.53−55 However, a number of reasons such asstructural phase transition, change in sign of f−d exchangeinteraction, spin reorientation, and negative coupling betweeninteractions were considered.55 The negative value of magnet-ization may be due to remnant magnetization, which is notcompensated by 100 Oe field. Spectroscopic analyses indicatethat the OA is well bonded for S1 and S3. Moreover, at lowertemperature, in ZFC condition, the OA capped magneticgrains are restrained and do not respond to the appliedmagnetic field due to OA diamagnetic susceptibility.56 Withincreasing temperature, for all the samples, the ZFC magnet-ization value remains constant up to ∼150 K and thenincreases to approach the FC value. CFO with differentcompositions and other ferrimagnetic samples were alsoreported to exhibit similar behavior.57 Furthermore, asubstantial change in the slope of ZFC magnetization(MZFC) curve noted near 200−316 K is more dominant forS2 and S3 samples. This behavior may be ascribed to chargeordering and metal−insulator transition.58,59 The MZFC valueincreases with temperature, then attains the maximum (Tmax)value at 384.9 K. Increased volume anisotropy and interparticleinteraction account for Tmax shift to higher temperatures.15 Toa first approximation, Tmax = ATB, where TB is the blockingtemperature and constant “A” takes values between 1 and 2.73.TB was estimated to be ∼395 K; large anisotropy of CFO maybe the reason for this relatively larger TB. Clearly, all the OAcoated CFO NPs exhibit the superparamagnetic characterabove 395 K. Presence of a frustrated surface spin layer can
Figure 9. XPS spectra displaying the binding energy and chemical states of (A) S1, (B) S2, and (C) S3 samples where Co 2p, Fe 2p, O 1s, and Cfor S1 (a−d), S2 (e−h), and S3 (i−l) are shown for all the samples.
ACS Applied Nano Materials Article
DOI: 10.1021/acsanm.8b02009ACS Appl. Nano Mater. 2019, 2, 1828−1843
1838
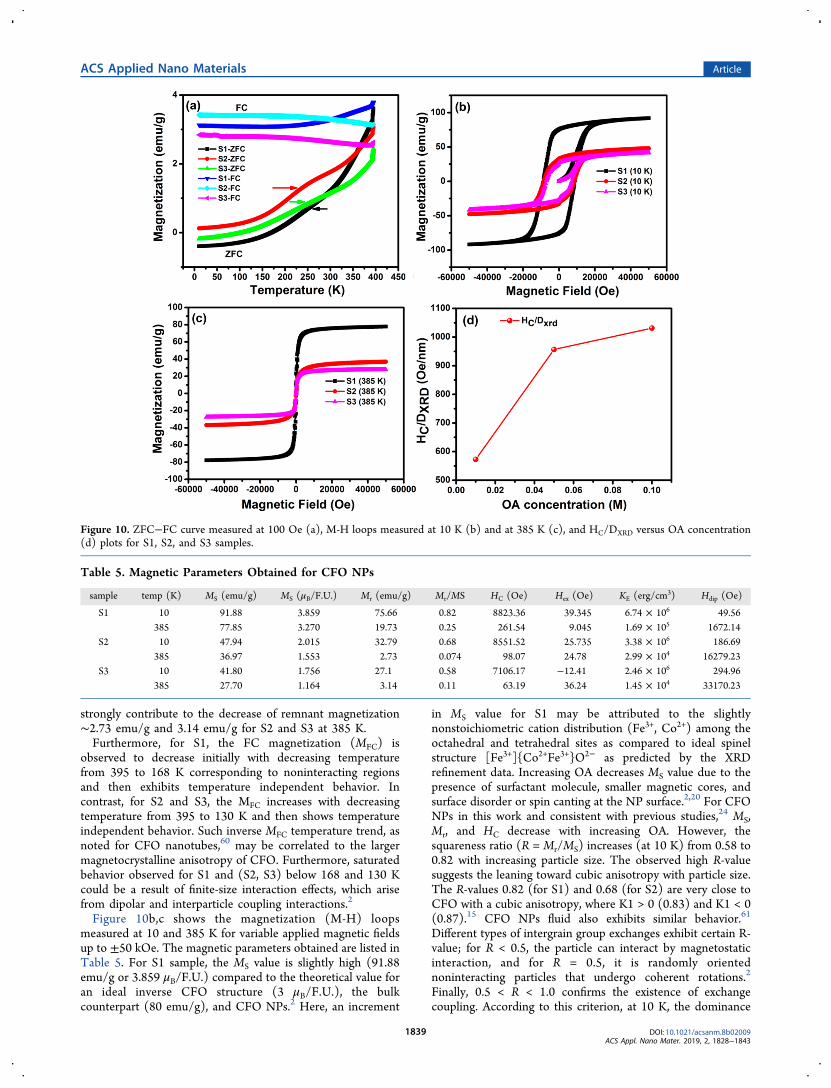
strongly contribute to the decrease of remnant magnetization∼2.73 emu/g and 3.14 emu/g for S2 and S3 at 385 K.Furthermore, for S1, the FC magnetization (MFC) is
observed to decrease initially with decreasing temperaturefrom 395 to 168 K corresponding to noninteracting regionsand then exhibits temperature independent behavior. Incontrast, for S2 and S3, the MFC increases with decreasingtemperature from 395 to 130 K and then shows temperatureindependent behavior. Such inverse MFC temperature trend, asnoted for CFO nanotubes,60 may be correlated to the largermagnetocrystalline anisotropy of CFO. Furthermore, saturatedbehavior observed for S1 and (S2, S3) below 168 and 130 Kcould be a result of finite-size interaction effects, which arisefrom dipolar and interparticle coupling interactions.2
Figure 10b,c shows the magnetization (M-H) loopsmeasured at 10 and 385 K for variable applied magnetic fieldsup to ±50 kOe. The magnetic parameters obtained are listed inTable 5. For S1 sample, the MS value is slightly high (91.88emu/g or 3.859 μB/F.U.) compared to the theoretical value foran ideal inverse CFO structure (3 μB/F.U.), the bulkcounterpart (80 emu/g), and CFO NPs.2 Here, an increment
in MS value for S1 may be attributed to the slightlynonstoichiometric cation distribution (Fe3+, Co2+) among theoctahedral and tetrahedral sites as compared to ideal spinelstructure [Fe3+]{Co2+Fe3+}O2− as predicted by the XRDrefinement data. Increasing OA decreases MS value due to thepresence of surfactant molecule, smaller magnetic cores, andsurface disorder or spin canting at the NP surface.2,20 For CFONPs in this work and consistent with previous studies,24 MS,Mr, and HC decrease with increasing OA. However, thesquareness ratio (R = Mr/MS) increases (at 10 K) from 0.58 to0.82 with increasing particle size. The observed high R-valuesuggests the leaning toward cubic anisotropy with particle size.The R-values 0.82 (for S1) and 0.68 (for S2) are very close toCFO with a cubic anisotropy, where K1 > 0 (0.83) and K1 < 0(0.87).15 CFO NPs fluid also exhibits similar behavior.61
Different types of intergrain group exchanges exhibit certain R-value; for R < 0.5, the particle can interact by magnetostaticinteraction, and for R = 0.5, it is randomly orientednoninteracting particles that undergo coherent rotations.2
Finally, 0.5 < R < 1.0 confirms the existence of exchangecoupling. According to this criterion, at 10 K, the dominance
Figure 10. ZFC−FC curve measured at 100 Oe (a), M-H loops measured at 10 K (b) and at 385 K (c), and HC/DXRD versus OA concentration(d) plots for S1, S2, and S3 samples.
Table 5. Magnetic Parameters Obtained for CFO NPs
sample temp (K) MS (emu/g) MS (μB/F.U.) Mr (emu/g) Mr/MS HC (Oe) Hex (Oe) KE (erg/cm3) Hdip (Oe)
S1 10 91.88 3.859 75.66 0.82 8823.36 39.345 6.74 × 10⁶ 49.56385 77.85 3.270 19.73 0.25 261.54 9.045 1.69 × 10⁵ 1672.14
S2 10 47.94 2.015 32.79 0.68 8551.52 25.735 3.38 × 10⁶ 186.69385 36.97 1.553 2.73 0.074 98.07 24.78 2.99 × 10⁴ 16279.23
S3 10 41.80 1.756 27.1 0.58 7106.17 −12.41 2.46 × 10⁶ 294.96385 27.70 1.164 3.14 0.11 63.19 36.24 1.45 × 10⁴ 33170.23
ACS Applied Nano Materials Article
DOI: 10.1021/acsanm.8b02009ACS Appl. Nano Mater. 2019, 2, 1828−1843
1839

of exchange coupling is clear, whereas at 385 K particles caninteract by magnetostatic interaction.Furthermore, coercivity (HC) values of S1, S2, and S3 at 10
K were observed as 8.82 kOe, 8.55 kOe, and 7.11 kOe whichare remarkably higher compared to bulk CFO (∼5 kOe at 5K).62 Also, increasing OA content decreases HC. Since thenanoparticle size monitors the coercivity, the HC/DXRD valueswere estimated as a function of OA concentration (Figure10d). The results follow the similar trends, with S3 presentingthe highest HC/DXRD values at 10 K, which verify that theparticle size can control HC. Moreover, HC is very sensitive tothe NP size, distribution characteristics, morphology, surfacespin, and interparticle interaction. In the present study, theeffective anisotropy, different exchange couple interaction, andinteractions between the nanostructure are the predominantfactors that influence HC. Also, HC = 0.64KE/MS, where KE isthe effective anisotropy constant, is valid for noninteracting,randomly oriented spherical NPs with cubic anisotropy. KEvalues (Table 5) calculated using this relation also increasewith particle size. Therefore, HC, MS, and KE indicate that theincreasing particle-size increases magnetic anisotropy, suggest-ing that the surface component of anisotropy plays a minorrole. For an ensemble of NPs, the arrangement of NPsinfluences the nature and strength of interparticle interactions.The strength of dipolar interparticle interactions is estimatedby the maximum dipolar field Hdip between nearest neighborparticles. Hdip = 2 μ/d3, where “μ” is the particle moment (μ =MS × Vm) and “d” is the distance between the centers of twoparticles.63 It is noted that with an increase in OAconcentration, the dipolar interparticle interaction alsoincreases (at 10 and 385 K). At 385 K, Hdip rapidly increasesas compared to 10 K because of the larger magnetic grain sizeat different OA concentrations. Finally, for sample S1, weprobed the evolution of dipolar interparticle interactions withthermal treatments to clarify the role of OA as a surfactant.The S1 sample is heated at 360 °C to decompose the OA fromCFO NPs, and the parameters obtained are presented in Table6.Figure 11 shows the M-H loops for S1 sample before and
after thermal treatment. For S1 sample before heating(S1before), Hdip is about 824.39 Oe (at 300 K) and 49.56 Oe(at 10 K), while for S1T360 the strength of dipolar interparticleinteractions decrease to 383.63 and 35.74 Oe at 300 and 10 K,respectively. As expected, the molecular coating plays a majorrole in tuning the dipolar interparticle interactions. Notice thatS1T360 sample shows the increase of Hdip from 35.74 Oe (10 K)to 383.63 Oe (300 K). The combined effect of particle-sizedecrease and enhanced dipolar interparticle interactions withOA induces a strong increase of the mean TB, as confirmed byZFC−FC measurements. Magnetic anisotropy of MNPs istypically related to surface component (KS). Generally, particlesize reduction enhances KS, which in turn increases magneticanisotropy. On the contrary, for the present case of OA-basedsolvothermally produced CFO NPs, anisotropy increases with
size indicating that the magnetocrystalline component playsthe key role. In fact, Fe3O4 and CFO NPs synthesized usingorganic precursors also exhibit the similar behavior.15,22 Inorder to understand the overall effect of OA concentration, theevolution of magnetic properties with thermal treatments forthe sample S1 appears extremely useful. The key role played bythe molecular coating is evident in S1 upon thermal treatment,which induces strong increase of surface component ofanisotropy due to OA decomposition. Also, MS decrease iscompatible with thermal treatment induced variation incationic distribution.63−65 Spin−orbit coupling governs themagnetic anisotropy; thus, the spin−orbit coupling becomessmaller when nanoparticle metal cations are coordinated withOA. The net result is the reduction in surface anisotropy andcoercivity of CFO NPs as evident from Tables 5 and 6. Despitethe fact that surface usually exhibits some degree of spindisorder, presence of covalent bonded OA coating influencesthe symmetry and crystal field of metal ion closely resemblingthat of the core.66,67 Therefore, in addition to reducing spindisorder, OA coating causes hindering of interface exchangecoupling between ordered core and magnetically disorderedshell.67
Table 6. Magnetic data for S1 sample before and after heating at 360 °C
temp (K) MS (emu/g) MS (μB/F.U.) Mr (emu/g) HC (Oe) Hex (Oe) KE (erg/cm3) Hdip (Oe)
S1before 10 91.88 3.86 75.66 8823.36 39.345 6.74 × 10⁶ 49.56300 87.37 3.67 27.27 530.49 6.335 3.86 × 10⁵ 824.39385 77.85 3.27 19.73 261.54 9.045 1.69 × 10⁵ 1672.14
S1T360 10 77.155 3.24 63.175 12236.07 13.955 7.85 × 10⁶ 35.74300 71.525 3.00 28.39 1140.025 43.935 6.78 × 10⁵ 383.63
Figure 11. M-H loops measured for S1 sample before and after heattreatment (360 °C) at 10 K (a) and 300 K (b).
ACS Applied Nano Materials Article
DOI: 10.1021/acsanm.8b02009ACS Appl. Nano Mater. 2019, 2, 1828−1843
1840

IV. CONCLUSIONSSurface functionalization of CFO nanoparticles with differentconcentration of oleic acid (OA) provides the ability to designnovel nanostructured magnetic materials. Fundamentally, asrevealed in these studies, OA helps to control the particle sizeof CFO NPs; particle-size reduction occurs with increasing OAconcentration. XPS and EDS data confirm that the synthesizedCFO NPs were chemically homogeneous with Fe and Co intheir chemical valence states of +3 (Fe3+) and +2 (Co2+),respectively. FTIR and Raman data further validate thechemical quality and bonding, in addition to surface OAinteraction, in CFO NPs. The interaction between OA andsurface atoms of CFO leads to a strong modification ofanisotropy and interparticle interactions. The magnetic studiesshowed a significant increase in magnetic anisotropy for CFONPs with a corresponding particle size reduction from 15 to 7nm. Magnetic studies further confirm that the magneticanisotropy is dominated by the magnetocrystalline componentover the surface component. Raman scattering also revealedblue shift and peak broadening, which are interlinked withsurface modification, enhanced magnetic ordering, and sizereduction of CFO NPs. Comparison of magnetic properties foras-synthesized and thermally treated CFO NPs provides thefundamental insights into the overall effect of OA concen-tration. Interparticle interactions are enhanced in thermallytreated CFO NPs due to the elimination of surfactant, whileparticle-size-increase effect is minimal. Presence of covalentbonded OA coating influences the symmetry and crystal fieldof metal ion closely resembling that of the core. In addition toreducing spin disorder, OA molecular coating causes hinderingof interface exchange coupling between ferromagneticallyordered core and magnetically disordered shell as is evidentin magnetic studies of thermally treated CFO NPs.
■ ASSOCIATED CONTENT*S Supporting InformationThe Supporting Information is available free of charge on theACS Publications website at DOI: 10.1021/acsanm.8b02009.
Additional details of the FESEM micrographs, funda-mental SAXS theory with equation, EDS data, XRDrefinement data, and structural information, FTIRabsorption bands, and XPS (PDF)
■ AUTHOR INFORMATIONCorresponding Authors*Y.D.K.: e-mail, [email protected].*C.V.R.: e-mail, [email protected] V. Ramana: 0000-0002-5286-3065NotesThe authors declare no competing financial interest.
■ ACKNOWLEDGMENTSS.M.A. is thankful to BARC for providing the financialassistance (Grant GOI-E-175) to carry out the researchwork. Also, we are thankful to Dr. R. S. Devan, MetallurgyEngineering and Materials Science, Indian Institute ofTechnology (IIT), Indore, for help with the FE-SEM images.The authors are also thankful to Vishal Zade, ResearchAssociate at the Center for Advanced Materials Research(CMR) at the University of Texas at El Paso, for his assistance
in designing a professional cover page illustration based on thedata presented in this paper. C.V.R. acknowledges withpleasure the support from the National Science Foundation(NSF), U.S., with NSF-PREM Grant DMR-1827745.
■ REFERENCES(1) Ansari, S. M.; Bhor, R. D.; Pai, K. R.; Mazumder, S.; Sen, D.;Kolekar, Y. D.; Ramana, C. V. Size and Chemistry Controlled Cobalt-Ferrite Nanoparticles and Their Anti-proliferative Effect against theMCF-7 Breast Cancer Cells. ACS Biomater. Sci. Eng. 2016, 2, 2139−2152.(2) Cai, B.; Zhao, M.; Ma, Y.; Ye, Z.; Huang, J. BioinspiredFormation of 3D Hierarchical CoFe2O4 Porous Microspheres forMagnetic-Controlled Drug Release. ACS Appl. Mater. Interfaces 2015,7, 1327−1333.(3) Ansari, S. M.; Suryawanshi, S. R.; More, M. A.; Sen, D.; Kolekar,Y. D.; Ramana, C. V. Field Emission Properties of Nano-structuredCobalt Ferrite (CoFe2O4) Synthesized by Low-temperature ChemicalMethod. Chem. Phys. Lett. 2018, 701, 151−156.(4) Georgiadou, V.; Makris, G.; Papagiannopoulou, D.; Vourlias, G.;Dendrinou-Samara, C. Octadecylamine Mediated Versatile Coating ofCoFe2O4NPs for the Sustained Release of Anti-inflammatory DrugNaproxen and in Vivo Target Selectivity. ACS Appl. Mater. Interfaces2016, 8, 9345−9360.(5) Kumar, P. A.; Ray, S.; Charkraverty, S.; Sarma, D. D. EngineeredSpin-Valve Type Magnetoresistance in Fe3O4-CoFe2O4 Core-ShellNanoparticles. Appl. Phys. Lett. 2013, 103, 102406.(6) Shenker, H. Magnetic Anisotropy of Cobalt Ferrite( C o 1 . 0 1 F e 2 . 0 0 O 3 . 6 2 ) a n d N i c k e l C o b a l t F e r r i t e(Ni0.72Fe0.20Co0.08Fe2O4). Phys. Rev. 1957, 107, 1246.(7) Liu, X. L.; Wang, Y. T.; Ng, C. T.; Wang, R.; Jing, G. Y.; Yi, J. B.;Yang, J.; Bay, B. H.; Yung, L. Y. L.; Fan, D. D.; Ding, J.; Fan, H. M.Coating Engineering of MnFe2O4Nanoparticles with Superhigh T2Relaxivity and Efficient Cellular Uptake for Highly Sensitive MagneticResonance Imaging. Adv. Mater. Interfaces 2014, 1 (1−12), 1300069.(8) Liu, X. L.; Fan, H. M.; Yi, J. B.; Yang, Y.; Choo, E. S. G.; Xue, J.M.; Fan, D. D.; Ding, J. Optimization of Surface Coating on Fe3O4
Nanoparticles for High Performance Magnetic Hyperthermia Agents.J. Mater. Chem. 2012, 22, 8235−8244.(9) Khanra, S.; Abdullah-Al Mamun, Md.; Ferreira, F. F.; Ghosh, K.;Guha, S. Functionalized Self-Assembled Peptide Nanotubes withCobalt Ferrite Nanoparticles for Applications in Organic Electronics.ACS Appl. Nano Mater. 2018, 1, 1175−1187.(10) Jung, J. H.; Kim, S.; Kim, H.; Park, J.; Oh, J. H. HighPerformance Flexible Organic Nano-Floating Gate Memory DevicesFunctionalized with Cobalt Ferrite Nanoparticles. Small 2015, 11,4976−4984.(11) Lu, Y.; Yin, Y.; Mayers, B. T.; Xia, Y. Modifying the SurfaceProperties of Superparamagnetic Iron Oxide Nanoparticles through ASol−Gel Approach. Nano Lett. 2002, 2, 183−186.(12) Davies, R.; Schurr, G. A.; Meenan, P.; Nelson, R. D.; Bergna, H.E.; Brevett, C. A.; Goldbaum, R. H. Engineered Particle Surfaces. Adv.Mater. 1998, 10, 1264−1270.(13) Mazario, E.; Sanchez-Marcos, J.; Menendez, N.; Canete, M.;Mayoral, A.; Rivera-Fernandez, S.; de la Fuente, J. M.; Herrasti, P.High Specific Absorption Rate and Transverse Relaxivity Effects inManganese Ferrite Nanoparticles Obtained by an ElectrochemicalRoute. J. Phys. Chem. C 2015, 119, 6828−6834.(14) Parker, D.; Dupuis, V.; Ladieu, F.; Bouchaud, J. P.; Dubois, E.;Perzynski, R.; Vincent, E. Spin-glass Behavior in an Interacting γ-Fe2O3 Nanoparticle System. Phys. Rev. B: Condens. Matter Mater. Phys.2008, 77, 104428−104429.(15) Peddis, D.; Orru, F.; Ardu, A.; Cannas, C.; Musinu, A.;Piccaluga, G. Interparticle Interactions and Magnetic Anisotropy inCobalt Ferrite Nanoparticles: Influence of Molecular Coating. Chem.Mater. 2012, 24, 1062−1071.
ACS Applied Nano Materials Article
DOI: 10.1021/acsanm.8b02009ACS Appl. Nano Mater. 2019, 2, 1828−1843
1841

(16) Berkowitz, A. E.; Lahut, J. A.; Jacobs, I. S.; Levinson, L. M.;Forester, D. W. Spin Pinning at Ferrite-Organic Interfaces. Phys. Rev.Lett. 1975, 34, 594−597.(17) Vestal, C. R.; Zhang, Z. J. Effects of Surface CoordinationChemistry on the Magnetic Properties of MnFe2O4 Spinel FerriteNanoparticles. J. Am. Chem. Soc. 2003, 125, 9828−9833.(18) Tanaka, Y.; Saita, S.; Maenosono, S. Influence of SurfaceLigands on Saturation Magnetization of FePt Nanoparticles. Appl.Phys. Lett. 2008, 92, 093117.(19) Bødker, F.; Mørup, S.; Linderoth, S. Surface Effects in Metalliciron Nanoparticles. Phys. Rev. Lett. 1994, 72, 282−285.(20) Ansari, S. M.; Bhor, R. D.; Pai, K. R.; Sen, D.; Mazumder, S.;Ghosh, K.; Kolekar, Y. D.; Ramana, C. V. Cobalt Nanoparticles forBiomedical Applications: Facile Synthesis, Physiochemical Character-ization, Cytotoxicity Behavior and Biocompatibility. Appl. Surf. Sci.2017, 414, 171−187.(21) Guardia, P.; Batlle-Brugal, B. B.; Roca, A. G.; Iglesias, O.;Morales, M. P.; Serna, C. J.; Labarta, A.; Batlle, X. Surfactant Effects inMagnetite Nanoparticles of Controlled Size. J. Magn. Magn. Mater.2007, 316, 756−759.(22) Roca, A. G.; Morales, M. P.; O’Grady, K.; Serna, C. Structuraland Magnetic Properties of Uniform Magnetite NanoparticlesPrepared by High Temperature Decomposition of OrganicPrecursors. Nanotechnology 2006, 17, 2783−2788.(23) Perez, N.; Guardia, P.; Roca, A. G.; Morales, M. P.; Serna, C. J.;Iglesias, O.; Bartolome, F.; Garcia, L. M.; Batlle, X.; Labarta, A.Surface Anisotropy Broadening of the Energy Barrier Distribution inMagnetic Nanoparticles. Nanotechnology 2008, 19, 475704.(24) Jovanovic, S.; Spreitzer, M.; Tramsek, K.; Trontelj, Z.; Suvorov,D. Effect of Oleic Acid Concentration on the PhysicochemicalProperties of Cobalt Ferrite Nanoparticles. J. Phys. Chem. C 2014,118, 13844−13856.(25) Gong, T.; Yang, D.; Hu, J.; Yang, W.; Wang, C.; Lu, J. Q.Preparation of Monodispersed Hybrid Nanospheres with HighMagnetite Content from Uniform Fe3O4 Clusters. Colloids Surf., A2009, 339, 232−239.(26) Limaye, M. V.; Singh, S. B.; Date, S. K.; Kothari, D.; Reddy, V.R.; Gupta, A.; Sathe, A. V.; Choudhary, R. J.; Kulkarni, S. K. HighCoercivity of Oleic Acid Capped CoFe2O4 Nanoparticles at RoomTemperature. J. Phys. Chem. B 2009, 113, 9070−9076.(27) Schmidt, P. W.; Hight, R., Jr. Slit height corrections in smallangle X-ray scattering. Acta Crystallogr. 1960, 13, 480.(28) Guinier, A.; Fournet, G.; Walker, B. C.; Yudowith, L. K. SmallAngle Scattering of X-rays; Wiley: New York, 1955.(29) Pedersen, J. S. Determination of Size Distribution From Small-angle Scattering Data for Systems with Effective Hard-sphereInteractions. J. Appl. Crystallogr. 1994, 27, 595−608.(30) Yanez-Vilar, S.; Sanchez-Andujar, M.; Gomez-Aguirre, C.; Mira,J.; Senaris-Rodriguez, M. A.; Castro-Garcia, S. A Simple SolvothermalSynthesis of MFe2O4 (M=Mn, Co and Ni) Nanoparticles. J. SolidState Chem. 2009, 182, 2685−2690.(31) Georgiadou, V.; Kokotidou, C.; Le Droumaguet, B.;Carbonnier, B.; Choli-Papadopoulou, T.; Dendrinou-Samara, C.Oleylamine as a Beneficial Agent for the Synthesis of CoFe2O4Nanoparticles with Potential Biomedical Uses. Dalton Trans. 2014,43, 6377−6388.(32) Ayyappan, S.; Mahadevan, S.; Chandramohan, P.; Srinivasan,M. P.; Philip, J.; Raj, B. Influence of Co2+ Ion Concentration on theSize, Magnetic Properties, and Purity of CoFe2O4Spinel FerriteNanoparticles. J. Phys. Chem. C 2010, 114, 6334−6341.(33) Ayyappan, S.; Gnanaprakash, G.; Panneerselvam, G.; Antony,M. P.; Philip, J. Effect of Surfactant Monolayer on Reduction of Fe3O4Nanoparticles under Vacuum. J. Phys. Chem. C 2008, 112, 18376−18383.(34) Wu, N.; Fu, L.; Su, M.; Aslam, M.; Wong, K. C.; Dravid, V. P.Interaction of Fatty Acid Monolayers with Cobalt Nanoparticles.Nano Lett. 2004, 4, 383−386.(35) Nakamoto, K. Infrared Spectra of Inorganic and CoordinationCompounds; Wiley: New York, 1963.
(36) Ayyappan, S.; Panneerselvam, G.; Antony, M. P.; Philip, J. HighTemperature Stability of Surfactant Capped CoFe2O4 Nanoparticles.Mater. Chem. Phys. 2011, 130, 1300−1306.(37) Lan, Q.; Chao, L.; Yang, F.; Liu, S.; Xu, J.; Sun, D. J. Synthesisof Bilayer Oleic Acid-Coated Fe3O4 Nanoparticles and TheirApplication in pH-responsive Pickering Emulsions. J. Colloid InterfaceSci. 2007, 310, 260−269.(38) Sharifi, I.; Shokrollahi, H.; Doroodmand, M. M.; Safi, R.Magnetic and Structural Studies on CoFe2O4 NanoparticlesSynthesized by Co-precipitation, Normal Micelles and ReverseMicelles Methods. J. Magn. Magn. Mater. 2012, 324, 1854−1861.(39) Laha, S. S.; Regmi, R.; Lawes, G. Structural Origin for Low-temperature Relaxation Features in Magnetic Nanoparticles. J. Phys.D: Appl. Phys. 2013, 46, 325004.(40) Datt, G.; Sen Bishwas, M.; Raja, M. M.; Abhyankar, A. C.Observation of Magnetic Anomalies in One-Step SolvothermallySynthesized Nickel-Cobalt Ferrite Nanoparticles. Nanoscale 2016, 8,5200−5213.(41) Macia, J.; Martin, E.; Perez-Rodriguez, A.; Jimenez, J.; Morante,J. R.; Aspar, B.; Margail, J. Raman Microstructural Analysis of Silicon-on-Insulator Formed by High Dose Oxygen Ion Implantation: As-implanted Structures, J. Margili. J. Appl. Phys. 1997, 82, 3730.(42) Singh, J. P.; Srivastava, R. C.; Agrawal, H. M.; Kumar, R. Micro-Raman Investigation of Nanosized Zinc Ferrite: Effect of Crystallitesize and Influence of Irradiation. J. Raman Spectrosc. 2011, 42, 1510−1517.(43) Wegener, W.; Scheerlinck, D.; Legrand, E.; Hautecler, S.;Brabers, V. Inelastic Neutron Scattering Study Of Acoustical MagnonsIn MnFe2O4. Solid State Commun. 1974, 15, 345.(44) Nappini, S.; Magnano, E.; Bondino, F.; Pís, I.; Barla, A.;Fantechi, E.; Pineider, F.; Sangregorio, C.; Vaccari, L.; Venturelli, L.;Baglioni, P. Surface Charge and Coating of CoFe2O4 Nanoparticles:Evidence of Preserved Magnetic and Electronic Properties. J. Phys.Chem. C 2015, 119, 25529−25541.(45) Li, M.; Mao, Y.; Yang, H.; Li, W.; Wang, C.; Liu, P.; Tog, Y.Controllable Electrochemical Synthesis of CoFe2O4 Nanostructureson FTO Substrate and their Magnetic Properties. New J. Chem. 2013,37, 3116−3120.(46) Ammar, S.; Helfen, A.; Jouini, N.; Fievet, F.; Rosenman, I.;Villain, F.; Molinie, P.; Danot, M. Magnetic Properties of UltrafineCobalt Ferrite Particles Synthesized by Hydrolysis in a PolyolMedium. J. Mater. Chem. 2001, 11, 186−192.(47) Jaffari, G. H.; Ceylan, A.; Bui, H. P.; Beebe, T. P.; Ozcan, S. J.;Shah, S. I. Non-equilibrium Cation Distribution and Enhanced SpinDisorder in Hollow CoFe2O4 Nanoparticles. J. Phys.: Condens. Matter2012, 24, 336004.(48) Zhou, Z.; Zhang, Y.; Wang, Z.; Wei, W.; Tang, W.; Shi, J.;Xiong, R. Electronic Structure Studies of the Spinel CoFe2O4 by X-Ray Photoelectron Spectroscopy. Appl. Surf. Sci. 2008, 254, 6972−6975.(49) Dupin, J. C.; Gonbeau, D.; Vinatier, P.; Levasseur, A.Systematic XPS Studies of Metal Oxides, Hydroxides and Peroxides.Phys. Chem. Chem. Phys. 2000, 2, 1319−1324.(50) Cossaro, A.; Puppin, M.; Cvetko, D.; Kladnik, G.; Verdini, A.;Coreno, M.; de Simone, M.; Floreano, L.; Morgante, A. TailoringSAM-on-SAM Formation. J. Phys. Chem. Lett. 2011, 2, 3124−3129.(51) Wu, N.; Fu, L.; Su, M.; Aslam, M.; Wong, K. C.; Dravid, V. P.Interaction of Fatty Acid Monolayers with Cobalt Nanoparticles.Nano Lett. 2004, 4, 383−386.(52) Wulser, K. W.; Langell, M. A. Carboxylic Acid Adsorption onNiO (100) Characterized by X-Ray Photoelectron and HighResolution Electron Energy Loss Spectroscopies. Catal. Lett. 1992,15, 39−50.(53) Bhowmik, R. N.; Kazhugasalamoorthy, S.; Ranganathan, R.;Sinha, A. K. Tuning of Composite Cubic Spinel Structure in Co1.75Fe1.25O 4 Spinel Oxide by Thermal Treatment and its Effects onModifying the Ferrimagnetic Properties. J. Alloys Compd. 2016, 680,315−327.
ACS Applied Nano Materials Article
DOI: 10.1021/acsanm.8b02009ACS Appl. Nano Mater. 2019, 2, 1828−1843
1842

(54) Sinha, A. K.; Singh, M. N.; Achary, S. N.; Sagdeo, A.; Shukla, D.K.; Phase, D. M. Crystal Field Splitting and Spin States of Co Ions inCobalt Ferrite with Composition Co1.5Fe1.5O4 using Magnetizationand X-ray Aabsorption Spectroscopy Measurements. J. Magn. Magn.Mater. 2017, 435, 87−95.(55) Khomchenko, V.; Troyanchuk, I.; Szymczak, R.; Szymczak, H.Negative Magnetization in La0.75Nd0.25CrO3 perovskite. J. Mater. Sci.2008, 43, 5662−5665.(56) CRC Handbook of Chemistry and Physics, 92nd ed.; CRC Press,2011; pp 3−579.(57) Bhowmik, R. N.; Panda, M. R.; Yusuf, S. M.; Mukadam, M. D.;Sinha, A. K. Structural Phase Change in Co2.25Fe0.75O4 Spinel Oxideby Vacuum Annealing and Role of Coexisting CoO Phase onMagnetic Properties. J. Alloys Compd. 2015, 646, 161−169.(58) Kumar, Y.; Yadav, K. L.; Manjusha, J.; Shah, R.; Kotnala, K.Study of Structural, Dielectric, Electric, Magnetic and MagnetoelectricProperties of K0.5Na0.5NbO3 -Ni0.2Co0.8Fe2O4 Composites. Ceram. Int.2017, 43, 13438−13446.(59) Delille, F.; Dieny, B.; Moussy, J. B.; Guittet, M. J.; Gota, S.;Gautier-Soyer, M. G.; Marin, C. Study of the Electronic Paraprocessand Antiphase Boundaries as Sources of the DemagnetisationPhenomenon in Magnetite. J. Magn. Magn. Mater. 2005, 294, 27−39.(60) Fu, J. C.; Zhang, J. L.; Peng, Y.; Zhao, J. G.; Tan, G. G.;Mellors, N. J.; Xie, E. Q.; Han, W. H. Unique Magnetic Propertiesand Magnetization Reversal Process of CoFe2O4 NanotubesFabricated by Electrospinning. Nanoscale 2012, 4, 3932−3936.(61) Moumen, N.; Bonville, P.; Pileni, M. P. Control of the Size ofCobalt Ferrite Magnetic Fluids: Mossbauer Spectroscopy. J. Phys.Chem. 1996, 100, 14410−14416.(62) Bhattacharyya, S.; Salvetat, J. P.; Fleurier, R.; Husmann, A.;Cacciaguerra, T.; Saboungi, M. L. One Step Synthesis of HighlyCrystalline and High Coercive Cobalt-ferrite Nanocrystals. Chem.Commun. 2005, 4818−4820.(63) Xu, S. T.; Ma, Y. Q.; Zheng, G. H.; Dai, Z. H. SimultaneousEffects of Surface Spins: Rarely Large Coercivity, High RemanenceMagnetization and Jumps in the Hysteresis Loops Observed inCoFe2O4 Nanoparticles. Nanoscale 2015, 7, 6520−6526.(64) Peddis, D.; Cannas, C.; Piccaluga, G.; Agostinelli, E.; Fiorani,D. Spin-glass-like Freezing and Enhanced Magnetization in Ultra-small CoFe2O4 Nanoparticles. Nanotechnology 2010, 21, 125705.(65) Cannas, C.; Musinu, A.; Piccaluga, G.; Fiorani, D.; Peddis, D.;Rasmussen, H. K.; Mørup, S. Magnetic Properties of Cobalt ferrite-silica Nanocomposites Prepared by a Sol-gel AutocombustionTechnique. J. Chem. Phys. 2006, 125, 164714.(66) Cannas, C.; Musinu, A.; Ardu, A.; Orru, F.; Peddis, D.; Casu,M.; Sanna, R.; Angius, F.; Diaz, G.; Piccaluga, G. CoFe2O4 andCoFe2O4/SiO2 Core/Shell Nanoparticles: Magnetic and Spectro-scopic Study. Chem. Mater. 2010, 22, 3353−3361.(67) Nogues, J.; Skumryev, V.; Sort, J.; Stoyanov, S.; Givord, D.Shell-Driven Magnetic Stability in Core-Shell Nanoparticles. Phys.Rev. Lett. 2006, 97, 157203−157204.
ACS Applied Nano Materials Article
DOI: 10.1021/acsanm.8b02009ACS Appl. Nano Mater. 2019, 2, 1828−1843
1843