MONTHLY STATISTICAL REPORT MINISTRY OF COAL JUNE 2020
138
MONTHLY STATISTICAL REPORT MINISTRY OF COAL JUNE 2020 O/o Deputy Director General A-Wing, 5 th Floor, Lok Nayak Bhavan, Lok Nayak Bhavan, New Delhi-110003.
Transcript of MONTHLY STATISTICAL REPORT MINISTRY OF COAL JUNE 2020

MONTHLY STATISTICAL REPORT
MINISTRY OF COAL
JUNE 2020
O/o Deputy Director General
A-Wing, 5th Floor, Lok Nayak Bhavan,
Lok Nayak Bhavan, New Delhi-110003.


MONTHLY STATISTICAL REPORT
MINISTRY OF COAL
JUNE 2020
O/o Deputy Director General
A-Wing, 5th Floor, Lok Nayak Bhavan

Preface
The Monthly Coal Statistics for the month of June 2020 is placed below.
Ministry of Coal gets various reports/returns from CIL along with its
Subsidiaries, SCCL and NLCIL, Monthly DO Letters from CMDs of all
Companies to the Secretary (Coal). Also the Captive Block Owners and Lignite
Block Owners provide information on monthly basis regarding production and
despatch. Based on these sources, compilation has been made for the use of
various stakeholders.
It is to disclose that all the in formations provided are of provisional in nature.


Table of Contents
Chapter Name Table Page
All India Summary
Summary of Coal Production 1
Summary of Coal Despatch 1
Summary of Lignite Production 1
Summary of Lignite Despatch 2
State-wise Coal Production 2
Sector-wise Coal Despatch 2
Coal Production By "Others" 3-6
Analysis of Big Mines of CIL
Production Analysis of Big Mines of CIL 7-22
OBR Analysis of Big Mines of CIL 23-38
Exploration Drilling Performance 39-41
Performance of Coal PSUs
Production Status 42-45
Productivity 46-47
OBR Status 48-49
HEMM Performance 50-52
Mode-Wise Coal Despatch 53-55
Detailed Sector-Wise Coal Despatch 55-58
Vendible Stock Position 59
Performance of NLCIL
Lignite Production Status 60
Status of Power Production 60
Productivity in Lignite Mining and Power 60
OBR Status 61
HEMM Performance 61
Power and Lignite Sales 61
Financial Performance
Capital Expenditure Status 62
Manpower Position 63
Sundry Debtors Status 63
Age-wise Debtors 63
Auction Status of Coal in CIL 65-69
Status of Electricity
Generation
Status of Electricity Generation 70-79
Projects of PSUs Status Of Major Ongoing Projects of CIL 80-86 Status of Major Ongoing Projects of NLCIL 87-96 Status of Major Ongoing Projects of SCCL 97-113


All India Summary


Table 1.1 : Summary of Coal Production All Production Figures in MT
FY 21 FY 20Growth M-O-M FY 21 FY 20
Growth Y-O-Y
1 ECL 55.02 3.24 3.59 -9.75 10.06 11.53 -12.752 BCCL 37.13 1.57 2.08 -24.66 4.83 6.47 -25.353 CCL 86.00 3.37 4.32 -21.99 8.54 11.64 -26.634 NCL 113.25 8.54 8.63 -1.04 26.47 26.22 0.955 WCL 62.00 3.02 3.58 -15.56 10.41 11.91 -12.596 SECL 183.00 8.93 11.33 -21.18 27.38 34.33 -20.247 MCL 173.00 10.56 11.40 -7.37 33.31 34.78 -4.238 NEC 0.60 0.00 0.02 -100.00 0.04 0.07 -42.86
710.00 39.23 44.95 -12.73 121.04 136.95 -11.629 SCCL 67.50 3.27 5.71 -42.73 9.50 17.08 -44.38
10 Others 83.00 4.82 5.10 -5.49 13.66 14.86 -8.08860.50 47.32 55.76 -15.14 144.20 168.89 -14.62
Table 1.2 : Summary of Coal Despatch
FY 21 FY 20Growth M-O-M FY 21 FY 20
Growth Y-O-Y
1 ECL 55.02 3.11 3.98 -21.72 10.15 12.84 -20.972 BCCL 37.13 1.52 2.35 -35.32 3.80 7.46 -49.053 CCL 86.00 4.41 5.53 -20.16 11.22 17.92 -37.404 NCL 113.25 7.81 8.12 -3.72 23.04 25.07 -8.095 WCL 62.00 3.48 4.62 -24.61 9.36 14.20 -34.056 SECL 183.00 10.34 11.74 -11.93 29.98 37.75 -20.607 MCL 173.00 10.85 12.49 -13.17 32.75 37.84 -13.448 NEC 0.60 0.01 0.03 -60.00 0.09 0.13 -32.58
710.00 41.54 48.85 -14.96 120.39 153.21 -21.429 SCCL 67.50 2.88 5.52 -47.83 8.48 16.84 -49.64
10 Captives 83.00 5.27 5.16 1.98 15.06 14.99 0.46860.50 49.69 59.53 -16.54 143.93 185.04 -22.22
Table 1.3: Summary of Lignite Production
FY 21 FY 20Growth M-O-M FY 21 FY 20
Growth Y-O-Y
1 NLCIL 25.22 1.80 1.79 0.56 4.72 4.40 7.272 GMDCL 7.10 0.34 0.64 -46.88 1.04 2.29 -54.593 GIPCL 0.00 0.36 0.31 16.13 1.34 1.25 7.204 RSMML 12.00 0.02 0.06 -66.67 0.10 0.26 -61.545 BLMCL 7.00 0.33 0.60 -45.00 1.05 1.32 -20.456 GHCL 0.40 0.00 0.01 -100.00 0.00 0.05 -100.007 VS Lignite 1.00 0.11 0.07 57.14 0.27 0.21 28.57
52.72 2.960 3.480 -14.94 8.520 9.780 -12.88
Sl No Subs Annual TargetProduction During June Progressive Production
CIL
Grand Total
Grand Total
Details of Coal Production from Others is in the Table 1.1 (A) in the Annex 1
Details of Coal Despatch from Others is in the Table 1.2 (A) in the Annex 1
CIL
All Despatch Figures in MT
Sl No Subs
Sl No Company Annual TargetProduction During June Progressive Production
Annual TargetDespatch During June Progressive Despatch
All Production Figures in MT
Grand Total
1
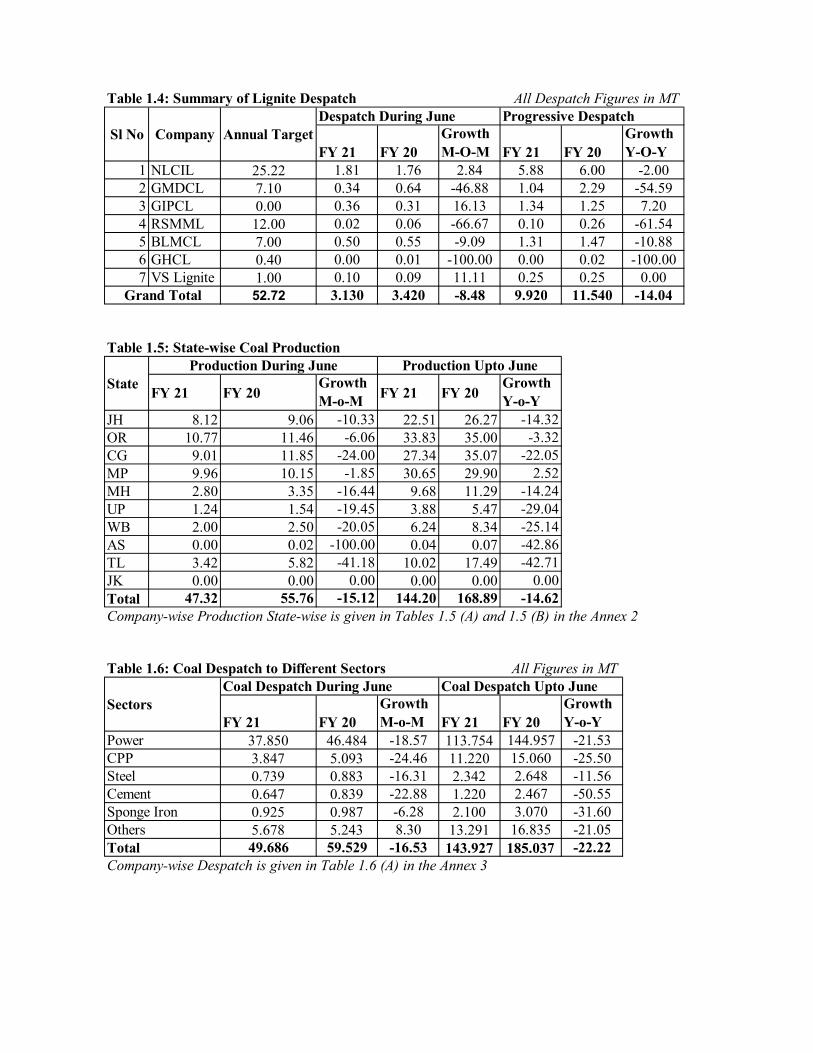
Table 1.4: Summary of Lignite Despatch
FY 21 FY 20Growth M-O-M FY 21 FY 20
Growth Y-O-Y
1 NLCIL 25.22 1.81 1.76 2.84 5.88 6.00 -2.002 GMDCL 7.10 0.34 0.64 -46.88 1.04 2.29 -54.593 GIPCL 0.00 0.36 0.31 16.13 1.34 1.25 7.204 RSMML 12.00 0.02 0.06 -66.67 0.10 0.26 -61.545 BLMCL 7.00 0.50 0.55 -9.09 1.31 1.47 -10.886 GHCL 0.40 0.00 0.01 -100.00 0.00 0.02 -100.007 VS Lignite 1.00 0.10 0.09 11.11 0.25 0.25 0.00
52.72 3.130 3.420 -8.48 9.920 11.540 -14.04
Table 1.5: State-wise Coal Production
FY 21 FY 20Growth M-o-M FY 21 FY 20
Growth Y-o-Y
JH 8.12 9.06 -10.33 22.51 26.27 -14.32OR 10.77 11.46 -6.06 33.83 35.00 -3.32CG 9.01 11.85 -24.00 27.34 35.07 -22.05MP 9.96 10.15 -1.85 30.65 29.90 2.52MH 2.80 3.35 -16.44 9.68 11.29 -14.24UP 1.24 1.54 -19.45 3.88 5.47 -29.04WB 2.00 2.50 -20.05 6.24 8.34 -25.14AS 0.00 0.02 -100.00 0.04 0.07 -42.86TL 3.42 5.82 -41.18 10.02 17.49 -42.71JK 0.00 0.00 0.00 0.00 0.00 0.00Total 47.32 55.76 -15.12 144.20 168.89 -14.62
Table 1.6: Coal Despatch to Different Sectors
FY 21 FY 20Growth M-o-M FY 21 FY 20
Growth Y-o-Y
37.850 46.484 -18.57 113.754 144.957 -21.533.847 5.093 -24.46 11.220 15.060 -25.500.739 0.883 -16.31 2.342 2.648 -11.560.647 0.839 -22.88 1.220 2.467 -50.550.925 0.987 -6.28 2.100 3.070 -31.605.678 5.243 8.30 13.291 16.835 -21.0549.686 59.529 -16.53 143.927 185.037 -22.22
OthersTotalCompany-wise Despatch is given in Table 1.6 (A) in the Annex 3
CPPSteelCementSponge Iron
Coal Despatch Upto June
Power
Company-wise Production State-wise is given in Tables 1.5 (A) and 1.5 (B) in the Annex 2
All Despatch Figures in MT
Sl No Company Annual TargetDespatch During June Progressive Despatch
StateProduction During June Production Upto June
Grand Total
All Figures in MT
SectorsCoal Despatch During June
2

Annex 1
Table 1.1 (A): Details of Coal Production By "Others"
FY 21 FY 20Growth M-o-M FY 21 FY 20
Growth Y-o-Y
0.001 0.001 0.00 0.003 0.003 0.000.021 0.035 -40.00 0.047 0.113 -58.410.005 0.032 -84.38 0.015 0.101 -85.150.024 0.000 #DIV/0! 0.059 0.031 90.320.501 0.546 -8.24 1.566 1.616 -3.090.901 0.660 36.52 2.441 2.126 14.820.174 0.157 10.83 0.532 0.579 -8.120.000 0.023 -100.00 0.000 0.099 -100.000.000 0.081 -100.00 0.002 0.187 -98.930.000 0.064 -100.00 0.034 0.192 -82.290.000 0.016 -100.00 0.000 0.048 -100.000.000 0.007 -100.00 0.018 0.016 12.501.346 1.691 -20.40 4.337 4.593 -5.570.806 1.203 -33.00 1.932 2.872 -32.730.265 0.197 34.52 0.749 1.009 -25.770.014 0.014 0.00 0.032 0.043 -25.580.016 0.030 -46.67 0.022 0.110 -80.000.006 0.070 -91.43 0.025 0.239 -89.540.148 0.106 39.62 0.516 0.404 27.720.000 0.019 -100.00 0.000 0.082 -100.000.065 0.034 91.18 0.117 0.115 1.740.159 0.065 144.62 0.446 0.221 101.810.048 0.048 0.00 0.119 0.065 83.080.039 0.0700.000 0.0560.269 0.5010.000 0.0000.011 0.0244.819 5.099 -5.49 13.663 14.864 -8.08
WBPDCL/Gangaramchak-Talabira II & IIITotal Production by Others
Name of Coal Block/Company
IISCOR
Ambuja Cement Ltd / GP IV/8NTPC / DulangaWBPDCL/Barjora NorthOCPL/ManoharpurNTPC/Talaipalli
SIL / BelgaonHIL/KathautiaSPL / Moher & Amlohori Extn.RRVUNL / PEKB
WBPDCL/Pachwara North
JPVL / Amelia (North)RCCPL/ Sial GhogriTUML / Marki Mangli - IWBPDCL/Barjora TSGENCO/Tadicherla-IOCL/Ardhagram Coal Mine
All Fig in MTProduction During June Production Upto June
JKMLIISCOCJ
JSMDCLTATA NTPC/Pakri BarwadihCESC / SarshataliHIL-Gare Palma IV/5BALCO / ChotiaHIL-Gare Palma IV/4
3

Annex 1
Table 1.1 (B): Details of Coal Despatch By "Others"
FY 21 FY 20Growth M-o-M FY 21 FY 20
Growth Y-o-Y
0.001 0.002 -50.00 0.003 0.008 -62.500.021 0.035 -40.00 0.047 0.113 -58.410.005 0.032 -84.38 0.015 0.101 -85.150.003 0.001 200.00 0.038 0.027 40.740.498 0.547 -8.96 1.571 1.619 -2.960.746 0.737 1.22 2.412 2.140 12.710.185 0.153 20.92 0.519 0.519 0.000.000 0.029 -100.00 0.000 0.086 -100.000.031 0.067 -53.73 0.215 0.186 15.590.009 0.044 -79.55 0.058 0.154 -62.340.000 0.014 -100.00 0.000 0.042 -100.000.000 0.048 -100.00 0.024 0.184 -86.961.577 1.689 -6.63 4.377 4.691 -6.690.806 1.203 -33.00 1.932 2.872 -32.730.230 0.130 76.92 0.647 0.896 -27.790.014 0.015 -6.67 0.032 0.044 -27.270.008 0.028 -71.43 0.014 0.105 -86.670.004 0.096 -95.83 0.022 0.292 -92.470.133 0.126 5.56 0.498 0.395 26.080.000 0.019 -100.00 0.000 0.082 -100.000.047 0.032 46.88 0.077 0.093 -17.200.180 0.098 83.67 0.854 0.320 166.880.058 0.018 222.22 0.135 0.018 650.000.152 0.3920.036 0.0720.331 0.5760.190 0.5260.000 0.0005.265 5.163 1.98 15.056 14.987 0.46
TATA
Name of Coal Block/Company
All Fig in MTDespatch During June Despatch Upto June
JKMLIISCOCJIISCORJSMDCL
TUML / Marki Mangli - I
NTPC/Pakri BarwadihCESC / SarshataliHIL-Gare Palma IV/5BALCO / ChotiaHIL-Gare Palma IV/4SIL / BelgaonHIL/KathautiaSPL / Moher & Amlohori Extn.RRVUNL / PEKBJPVL / Amelia (North)RCCPL/ Sial Ghogri
Total Despatch by Others
WBPDCL/Barjora TSGENCO/Tadicherla-IOCL/Ardhagram Coal MineAmbuja Cement Ltd / GP IV/8NTPC / DulangaWBPDCL/Barjora NorthOCPL/ManoharpurNTPC/TalaipalliWBPDCL/Pachwara NorthWBPDCL/Gangaramchak-Talabira II & III
4

Annex 2
Table 1.5 (A): Company-wise and State-wise Coal Production During June 20Subs / Com JH OR CG MP MH UP WB TL AS JK Total
ECL 1.47 1.77 3.24BCCL 1.57 1.57CCL 3.37 3.37NCL 7.30 1.24 8.54WCL 0.24 2.79 3.02SECL 8.14 0.79 8.93MCL 10.56 10.56NEC 0.00SCCL 3.27 3.27Others 1.72 0.21 0.87 1.63 0.02 0.23 0.15 0.00 4.82Total 8.12 10.77 9.01 9.96 2.80 1.24 2.00 3.42 0.00 0.00 47.32
Table 1.5 (B): Company-wise and State-wise Coal Production Upto June 20Subs / Com JH OR CG MP MH UP WB TL AS JK Total
ECL 4.512 5.552 10.06BCCL 4.825 4.83CCL 8.541 8.54NCL 22.596 3.879 26.47WCL 0.755 9.659 10.41SECL 25.196 2.183 27.38MCL 33.307 33.31NEC 0.040 0.04SCCL 9.502 9.50Others 4.631 0.528 2.141 5.118 0.022 0.691 0.517 0.003 13.65Total 22.51 33.83 27.34 30.65 9.68 3.88 6.24 10.02 0.04 0.00 144.20
Figures in MT
Figures in MT
5

Annex 3
Table 1.6 (A) : Sector-wise Despatch of Coal By CIL
FY 21 FY 20Growth M-o-M FY 21 FY 20
Growth Y-o-Y
30.94 37.51 -17.52 93.43 118.40 -21.093.60 4.77 -24.64 10.83 14.09 -23.140.18 0.14 23.08 0.48 0.40 20.000.45 0.55 -18.76 0.87 1.61 -45.960.93 0.98 -5.32 2.09 3.02 -30.795.45 4.89 11.47 12.69 15.69 -19.1241.54 48.85 -14.96 120.39 153.21 -21.42
Table 1.6 (A): Sector-wise Despatch of Coal By SCCL
FY 21 FY 20Growth M-o-M FY 21 FY 20
Growth Y-o-Y
2.27 4.600 -50.65 7.28 13.990 -47.960.250 0.320 -21.88 0.390 0.970 -59.79
0.14 0.240 -41.67 0.24 0.720 -66.670 0.010 -100.00 0.01 0.050 -80.00
0.22 0.350 -37.14 0.56 1.110 -49.552.88 5.520 -47.83 8.48 16.840 -49.64
Table 1.6 (A) : Sector-wise Coal Despatch by Others
FY 21 FY 20Growth M-o-M FY 21 FY 20
Growth Y-o-Y
4.638 4.370 6.13 13.044 12.567 3.80
0.563 0.740 -23.92 1.862 2.248 -17.170.061 0.050 22.00 0.110 0.137 -19.71
0.004 0 0.041 0.035 17.145.266 5.160 2.05 15.057 14.987 0.47
Coal Despatch Upto June
PowerCPPSteel
Total
SectorsCoal Despatch During June
SectorsCoal Despatch During June
CementSponge IronOthersTotal
OthersTotal
Sectors
Power
Figures in MT
Figures in MT
Figures in MT
CPPSteel
Coal Despatch During June Coal Despatch Upto June
Coal Despatch Upto June
PowerCPPSteelCementSponge Iron
CementSponge IronOthers
6

Analysis of Big Mines of CIL

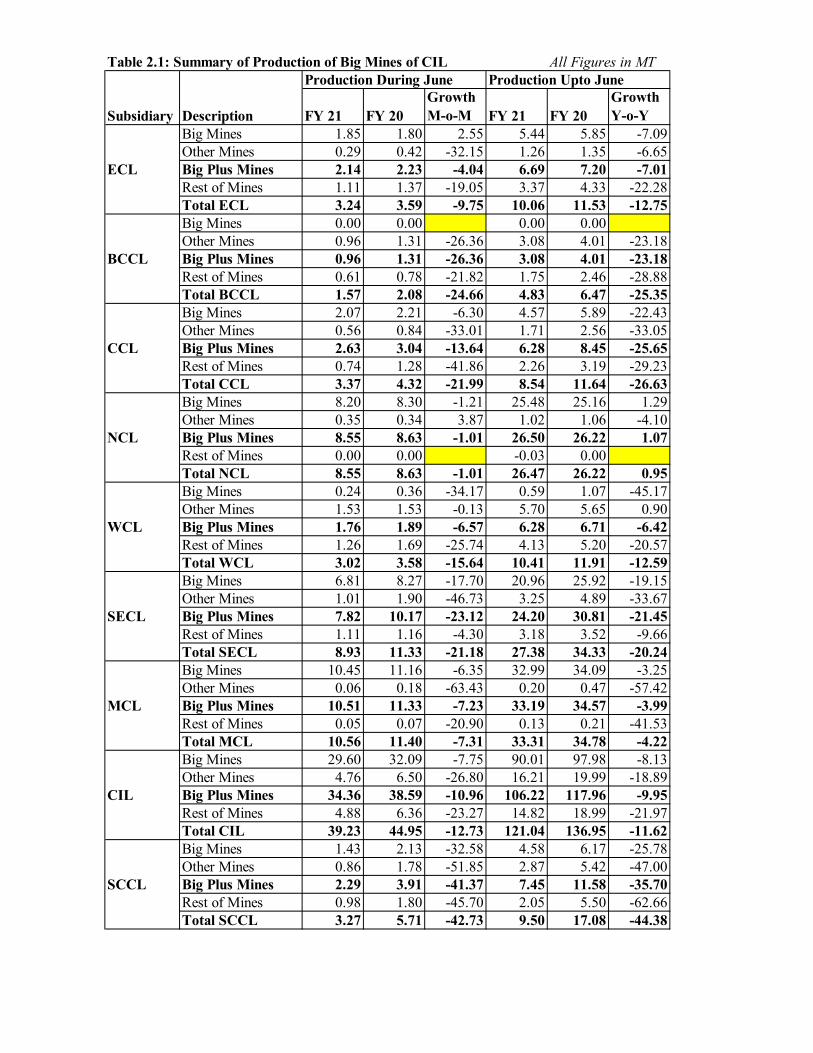
Table 2.1: Summary of Production of Big Mines of CIL All Figures in MT
FY 21 FY 20Growth M-o-M FY 21 FY 20
Growth Y-o-Y
1.85 1.80 2.55 5.44 5.85 -7.090.29 0.42 -32.15 1.26 1.35 -6.652.14 2.23 -4.04 6.69 7.20 -7.011.11 1.37 -19.05 3.37 4.33 -22.283.24 3.59 -9.75 10.06 11.53 -12.750.00 0.00 0.00 0.000.96 1.31 -26.36 3.08 4.01 -23.180.96 1.31 -26.36 3.08 4.01 -23.180.61 0.78 -21.82 1.75 2.46 -28.881.57 2.08 -24.66 4.83 6.47 -25.352.07 2.21 -6.30 4.57 5.89 -22.430.56 0.84 -33.01 1.71 2.56 -33.052.63 3.04 -13.64 6.28 8.45 -25.650.74 1.28 -41.86 2.26 3.19 -29.233.37 4.32 -21.99 8.54 11.64 -26.638.20 8.30 -1.21 25.48 25.16 1.290.35 0.34 3.87 1.02 1.06 -4.108.55 8.63 -1.01 26.50 26.22 1.070.00 0.00 -0.03 0.008.55 8.63 -1.01 26.47 26.22 0.950.24 0.36 -34.17 0.59 1.07 -45.171.53 1.53 -0.13 5.70 5.65 0.901.76 1.89 -6.57 6.28 6.71 -6.421.26 1.69 -25.74 4.13 5.20 -20.573.02 3.58 -15.64 10.41 11.91 -12.596.81 8.27 -17.70 20.96 25.92 -19.151.01 1.90 -46.73 3.25 4.89 -33.677.82 10.17 -23.12 24.20 30.81 -21.451.11 1.16 -4.30 3.18 3.52 -9.668.93 11.33 -21.18 27.38 34.33 -20.24
10.45 11.16 -6.35 32.99 34.09 -3.250.06 0.18 -63.43 0.20 0.47 -57.42
10.51 11.33 -7.23 33.19 34.57 -3.990.05 0.07 -20.90 0.13 0.21 -41.53
10.56 11.40 -7.31 33.31 34.78 -4.2229.60 32.09 -7.75 90.01 97.98 -8.134.76 6.50 -26.80 16.21 19.99 -18.89
34.36 38.59 -10.96 106.22 117.96 -9.954.88 6.36 -23.27 14.82 18.99 -21.97
39.23 44.95 -12.73 121.04 136.95 -11.621.43 2.13 -32.58 4.58 6.17 -25.780.86 1.78 -51.85 2.87 5.42 -47.002.29 3.91 -41.37 7.45 11.58 -35.700.98 1.80 -45.70 2.05 5.50 -62.663.27 5.71 -42.73 9.50 17.08 -44.38
CIL
Big MinesOther MinesBig Plus MinesRest of MinesTotal CIL
SCCL
Big Mines
MCL
Big MinesOther MinesBig Plus MinesRest of MinesTotal MCL
SECL
Big MinesOther MinesBig Plus MinesRest of MinesTotal SECL
WCL
Big MinesOther MinesBig Plus MinesRest of MinesTotal WCL
NCL
Big MinesOther MinesBig Plus MinesRest of MinesTotal NCL
Production Upto June
DescriptionSubsidiary
ECL
Big MinesOther MinesBig Plus MinesRest of MinesTotal ECL
Production During June
Other MinesBig Plus MinesRest of MinesTotal SCCL
BCCL
Big MinesOther MinesBig Plus MinesRest of MinesTotal BCCL
CCL
Big MinesOther MinesBig Plus MinesRest of MinesTotal CCL
7

FY 21 FY 20Growth M-o-M FY 21 FY 20
Growth Y-o-Y
Production Upto June
DescriptionSubsidiary
Production During June
4.61 4.67 -1.39 13.09 13.49 -2.920.22 0.43 -49.37 0.57 1.38 -58.434.82 5.10 -5.39 13.66 14.86 -8.07
41.26 47.17 -12.53 126.76 143.03 -11.376.08 8.59 -29.27 17.44 25.86 -32.56
47.33 55.76 -15.11 144.20 168.89 -14.62
Details of Subsidiary/Company-wise Production Status is given in subsequent Tables
All IndiaBig MinesOther MinesAll Mines
Captive & Others
Big MinesOther MinesTotal Others
8

Table 2.1.1 (A) : Departmental Coal Production ECL All Figures in MT
FY 21 FY 20 Growth M-o-M FY 21 FY 20 Growth
Y-o-YRajmahal Big 0.000 0.000 0.005 0.000Sonepur Bazari Big 0.177 0.258 -31.40 0.601 0.788 -23.70Jhajhra UG Others 0.214 0.268 -20.15 0.966 0.873 10.71Chitra East Others 0.073 0.155 -52.90 0.289 0.472 -38.76
0.177 0.258 -31.40 0.606 0.788 -23.120.287 0.423 -32.15 1.256 1.345 -6.650.464 0.681 -31.86 1.861 2.133 -12.740.756 0.789 -4.18 2.319 2.567 -9.671.220 1.470 -17.01 4.180 4.700 -11.06
Table 2.1.1 (B): Contractual Coal Production ECL
FY 21 FY 20 Growth M-o-M FY 21 FY 20 Growth
Y-o-YRajmahal Big 1.204 1.101 9.36 3.701 3.446 7.41Sonepur Bazari Big 0.467 0.443 5.42 1.129 1.617 -30.18Jhajhra UG Others 0.000 0.000 0.000 0.000Chitra East Others 0.000 0.000 0.000 0.000
1.671 1.544 8.23 4.830 5.063 -4.600.000 0.000 0.000 0.0001.671 1.544 8.23 4.830 5.063 -4.600.329 0.576 -42.88 1.050 1.767 -40.592.000 2.120 -5.66 5.880 6.830 -13.91
Table 2.1.1 (C) : Total Coal Production ECL
FY 21 FY 20 Growth M-o-M FY 21 FY 20 Growth
Y-o-YRajmahal Big 1.204 1.101 9.36 3.706 3.446 7.54Sonepur Bazari Big 0.644 0.701 -8.13 1.730 2.405 -28.06Jhajhra UG Others 0.214 0.268 -20.15 0.966 0.873 10.71Chitra East Others 0.073 0.155 -52.90 0.289 0.472 -38.76
1.848 1.802 2.55 5.436 5.851 -7.090.287 0.423 -32.15 1.256 1.345 -6.652.135 2.225 -4.04 6.692 7.196 -7.011.105 1.365 -19.05 3.368 4.334 -22.283.240 3.590 -9.75 10.060 11.530 -12.75
Production During June Production Upto June
Production During June Production Upto June
Mine
Mine
Production During June Production Upto June
Total Big MinesTotal OthersTotal Big Plus MinesTotal Rest of MinesTotal ECL
Total Big MinesTotal Others
Type
Type
Type
Total Big Plus MinesTotal Rest of MinesTotal ECL
Total Big Plus MinesTotal Rest of MinesTotal ECL
Total Big MinesTotal Others
Mine
9

Table 2.1.2 (A): Departmental Coal Production BCCL All Figures in MT
FY 21 FY 20 Growth M-o-M FY 21 FY 20 Growth
Y-o-YNT ST Je Others 0.005 0.038 -86.84 0.019 0.176 -89.22AKWMC Others 0.054 0.053 1.89 0.229 0.217 5.52Phularitand Others 0.005 0.003 66.67 0.009 0.008 16.15S Bansjora Others 0.000 0.000 0.000 0.000NGKAC Others 0.000 0.000 0.000 0.000ROCP Others 0.000 0.046 -100.00 0.000 0.160 -100.00KOCP Others 0.054 0.010 440.00 0.153 0.030 408.87ABOCP Others 0.085 0.116 -26.72 0.271 0.391 -30.70B Dahibari Others 0.050 0.061 -18.03 0.143 0.202 -29.12
0.000 0.000 0.000 0.0000.253 0.327 -22.63 0.824 1.184 -30.400.253 0.327 -22.63 0.824 1.184 -30.400.177 0.327 -45.87 0.596 1.086 -45.120.430 0.654 -34.25 1.420 2.270 -37.44
Table 2.1.2 (B)Contractual Coal Production BCCL
FY 21 FY 20 Growth M-o-M FY 21 FY 20 Growth
Y-o-YNT ST Je Others 0.060 0.043 39.53 0.288 0.232 24.28AKWMC Others 0.185 0.281 -34.16 0.402 0.670 -39.93Phularitand Others 0.182 0.258 -29.46 0.525 0.706 -25.65S Bansjora Others 0.074 0.074 0.00 0.295 0.244 20.82NGKAC Others 0.000 0.112 -100.00 0.116 0.202 -42.76ROCP Others 0.076 0.134 -43.28 0.205 0.431 -52.48KOCP Others 0.076 0.076 0.00 0.240 0.339 -29.12ABOCP Others 0.055 0.000 0.186 0.000B Dahibari Others 0.000 0.000 0.000 0.003 -100.00
0.000 0.000 0.000 0.0000.708 0.978 -27.61 2.257 2.827 -20.160.708 0.978 -27.61 2.257 2.827 -20.160.432 0.452 -4.42 1.153 1.373 -16.031.140 1.430 -20.28 3.410 4.200 -18.81
Mine
Production During June Production Upto June
Mine
Production During June Production Upto June
Total Big MinesTotal OthersTotal Big Plus MinesTotal Rest of MinesTotal BCCL
Total Big MinesTotal Others
Type
Type
Total Big Plus MinesTotal Rest of MinesTotal BCCL
10

Table 2.1.2 (C)Total Coal Production BCCL
FY 21 FY 20 Growth M-o-M FY 21 FY 20 Growth
Y-o-YNT ST Je Others 0.065 0.081 -19.75 0.307 0.408 -24.68AKWMC Others 0.239 0.334 -28.44 0.631 0.887 -28.82Phularitand Others 0.187 0.261 -28.35 0.534 0.714 -25.18S Bansjora Others 0.074 0.074 0.00 0.295 0.244 20.82NGKAC Others 0.000 0.112 -100.00 0.116 0.202 -42.76ROCP Others 0.076 0.180 -57.78 0.205 0.591 -65.35KOCP Others 0.130 0.086 51.16 0.393 0.369 6.49ABOCP Others 0.140 0.116 20.69 0.457 0.391 16.86B Dahibari Others 0.050 0.061 -18.03 0.143 0.205 -30.15
0.000 0.000 0.000 0.0000.961 1.305 -26.36 3.081 4.011 -23.180.961 1.305 -26.36 3.081 4.011 -23.180.609 0.779 -21.82 1.749 2.459 -28.881.570 2.084 -24.66 4.830 6.470 -25.35
Production During June Production Upto JuneType
Total Big Plus MinesTotal Rest of MinesTotal BCCL
Total Big MinesTotal Others
Mine
11

Table 2.1.3 (A): Departmental Coal Production CCL All Figures in MT
FY 21 FY 20 Growth M-o-M FY 21 FY 20 Growth
Y-o-YAshoka Big 0.003 0.062 -95.16 0.065 0.233 -72.10Piparwar Big 0.023 0.003 666.67 0.041 0.049 -16.33Amarpali Big 0.000 0.000 0.000 0.000AKK Big 0.000 0.153 -100.00 0.000 0.286 -100.00Govindpur Ph II Others 0.003 0.070 -95.71 0.004 0.182 -97.72Rohini Others 0.014 0.015 -6.67 0.023 0.041 -43.90Purnadih Others 0.043 0.056 -23.21 0.193 0.185 4.32Magadh Big 0.000 0.000 0.000 0.000Tapin North Others 0.030 0.045 -33.33 0.102 0.153 -33.33Birsa Project Others 0.000 0.022 -100.00 0.010 0.056 -82.14Karo Big 0.000 0.000 0.000 0.000Topa OC Others 0.060 0.097 -38.14 0.156 0.301 -48.05
0.026 0.218 -88.07 0.106 0.568 -81.340.150 0.305 -50.82 0.489 0.918 -46.780.176 0.523 -66.35 0.595 1.486 -59.990.424 0.777 -45.43 1.265 1.944 -34.900.600 1.300 -53.85 1.860 3.430 -45.77
Table 2.1.3 (B) Contractual Coal Production CCL
FY 21 FY 20 Growth M-o-M FY 21 FY 20 Growth
Y-o-YAshoka Big 0.811 0.854 -5.04 1.665 2.524 -34.03Piparwar Big 0.050 0.168 -70.24 0.477 0.588 -18.88Amarpali Big 0.601 0.482 24.69 1.078 1.098 -1.82AKK Big 0.195 0.231 -15.58 0.509 0.627 -18.82Govindpur Ph II Others 0.115 0.067 71.64 0.367 0.187 96.06Rohini Others 0.194 0.174 11.49 0.494 0.500 -1.20Purnadih Others 0.000 0.044 -100.00 0.000 0.170 -100.00Magadh Big 0.329 0.033 896.97 0.548 0.201 172.64Tapin North Others 0.000 0.000 0.000 0.000Birsa Project Others 0.101 0.246 -58.94 0.364 0.784 -53.57Karo Big 0.055 0.220 -75.00 0.185 0.283 -34.63Topa OC Others 0.000 0.000 0.000 0.000
2.041 1.988 2.67 4.462 5.321 -16.140.410 0.531 -22.79 1.225 1.641 -25.372.451 2.519 -2.70 5.687 6.962 -18.320.319 0.501 -36.33 0.993 1.248 -20.402.770 3.020 -8.28 6.680 8.210 -18.64
Mine
Production During June Production Upto June
Mine
Production During June Production Upto June
Total Big MinesTotal OthersTotal Big Plus MinesTotal Rest of MinesTotal CCL
Total Big MinesTotal Others
Type
Type
Total Big Plus MinesTotal Rest of MinesTotal CCL
12
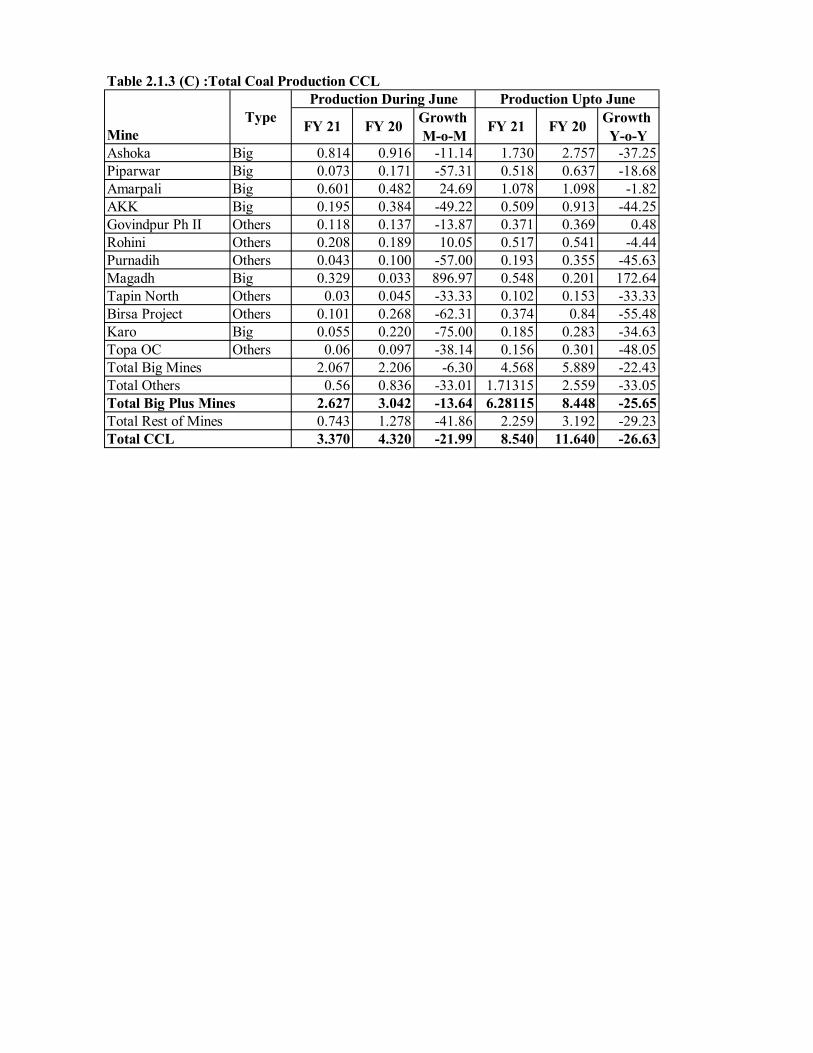
Table 2.1.3 (C) :Total Coal Production CCL
FY 21 FY 20 Growth M-o-M FY 21 FY 20 Growth
Y-o-YAshoka Big 0.814 0.916 -11.14 1.730 2.757 -37.25Piparwar Big 0.073 0.171 -57.31 0.518 0.637 -18.68Amarpali Big 0.601 0.482 24.69 1.078 1.098 -1.82AKK Big 0.195 0.384 -49.22 0.509 0.913 -44.25Govindpur Ph II Others 0.118 0.137 -13.87 0.371 0.369 0.48Rohini Others 0.208 0.189 10.05 0.517 0.541 -4.44Purnadih Others 0.043 0.100 -57.00 0.193 0.355 -45.63Magadh Big 0.329 0.033 896.97 0.548 0.201 172.64Tapin North Others 0.03 0.045 -33.33 0.102 0.153 -33.33Birsa Project Others 0.101 0.268 -62.31 0.374 0.84 -55.48Karo Big 0.055 0.220 -75.00 0.185 0.283 -34.63Topa OC Others 0.06 0.097 -38.14 0.156 0.301 -48.05
2.067 2.206 -6.30 4.568 5.889 -22.430.56 0.836 -33.01 1.71315 2.559 -33.05
2.627 3.042 -13.64 6.28115 8.448 -25.650.743 1.278 -41.86 2.259 3.192 -29.233.370 4.320 -21.99 8.540 11.640 -26.63
Production During June Production Upto JuneType
Total Big Plus MinesTotal Rest of MinesTotal CCL
Total Big MinesTotal Others
Mine
13

Table 2.1.4 (A): Departmental Coal Production NCL All Figures in MT
FY 21 FY 20 Growth M-o-M FY 21 FY 20 Growth
Y-o-YNigahi Big 1.548 1.614 -4.09 5.013 4.883 2.66Jayant Big 1.650 1.630 1.23 5.145 4.910 4.79Dudhichua Big 1.404 1.569 -10.52 4.607 4.768 -3.38Amlohri Big 0.751 0.632 18.83 2.213 2.088 6.00Khadia Big 1.036 1.103 -6.07 3.063 3.312 -7.52Bina Big 0.653 0.585 11.62 2.027 1.965 3.16Krishnashila Big 0.631 0.606 4.13 1.837 1.872 -1.87Block B Big 0.523 0.557 -6.10 1.576 1.359 15.93Jingurda Others 0.170 0.216 -21.30 0.505 0.643 -21.46Kakari Others 0.179 0.120 49.17 0.514 0.419 22.55
8.196 8.296 -1.21 25.481 25.157 1.290.349 0.336 3.87 1.019 1.062 -4.108.545 8.632 -1.01 26.469 26.219 0.950.000 0.000 0.000 0.0008.545 8.632 -1.01 26.469 26.219 0.95
Table 2.1.4 (B): Total Coal Production NCL
FY 21 FY 20 Growth M-o-M FY 21 FY 20 Growth
Y-o-YNigahi Big 1.548 1.614 -4.09 5.013 4.883 2.66Jayant Big 1.650 1.630 1.23 5.145 4.910 4.79Dudhichua Big 1.404 1.569 -10.52 4.607 4.768 -3.38Amlohri Big 0.751 0.632 18.83 2.213 2.088 6.00Khadia Big 1.036 1.103 -6.07 3.063 3.312 -7.52Bina Big 0.653 0.585 11.62 2.027 1.965 3.16Krishnashila Big 0.631 0.606 4.13 1.837 1.872 -1.87Block B Big 0.523 0.557 -6.10 1.576 1.359 15.93Jingurda Others 0.170 0.216 -21.30 0.505 0.643 -21.46Kakari Others 0.179 0.120 49.17 0.514 0.419 22.55
8.196 8.296 -1.21 25.481 25.157 1.290.349 0.336 3.87 1.019 1.062 -4.108.545 8.632 -1.01 26.469 26.219 0.950.000 0.000 0.000 0.0008.545 8.632 -1.01 26.469 26.219 0.95
Mine
Production During June Production Upto June
Mine
Production During June Production Upto June
Total Big MinesTotal OthersTotal Big Plus MinesTotal Rest of MinesTotal NCL
Type
Type
Total Big MinesTotal OthersTotal Big Plus MinesTotal Rest of MinesTotal NCL
14

Table 2.1.5 (A): Departmental Coal Production WCL All Figures in MT
FY 21 FY 20 Growth M-o-M FY 21 FY 20 Growth
Y-o-YDurgapur -(Sec.-V) Others 0.063 0.054 16.67 0.373 0.132 182.58Sasti Others 0.136 0.078 74.36 0.386 0.223 73.09NM-Sector-I & II (A) Others 0.046 0.013 253.85 0.156 0.385 -59.48Niljai Deep Others 0.192 0.174 10.34 0.832 0.574 44.95Mungoli Others 0.189 0.140 35.00 0.739 0.625 18.24Penganga Big 0.000 0.069 0.070 0.069Ukni Others 0.097 0.078 24.36 0.267 0.375 -28.80Gondegaon Others 0.115 0.127 -9.45 0.515 0.459 12.20Umrer Others 0.076 0.223 -65.92 0.186 0.610 -69.51Makardhokra-I Others 0.000 0.000 0.000 0.000Gokul Others 0.000 0.000 0.000 0.000MKD-III Others 0.000 0.000 0.000 0.000
0.000 0.069 0.070 0.0690.914 0.887 3.04 3.454 3.383 2.100.914 0.956 -4.39 3.524 3.452 2.090.956 1.204 -20.60 2.886 3.648 -20.891.870 2.160 -13.43 6.410 7.100 -9.72
Table 2.1.5 (B) Contractual Coal Production WCL
FY 21 FY 20 Growth M-o-M FY 21 FY 20 Growth
Y-o-YDurgapur -(Sec.-V) Others 0.000 0.000 0.000 0.000Sasti Others 0.000 0.000 0.000 0.000NM-Sector-I & II (A) Others 0.000 0.000 0.000 0.000Niljai Deep Others 0.000 0.000 0.000 0.000Mungoli Others 0.000 0.000 0.000 0.000Penganga Big 0.235 0.288 -18.40 0.515 0.998 -48.40Ukni Others 0.000 0.000 0.000 0.000Gondegaon Others 0.087 0.115 -24.35 0.377 0.352 7.10Umrer Others 0.104 0.135 -22.96 0.364 0.451 -19.29Makardhokra-I Others 0.104 0.057 82.46 0.524 0.212 147.17Gokul Others 0.233 0.187 24.60 0.613 0.723 -15.21MKD-III Others 0.085 0.148 -42.57 0.365 0.525 -30.48
0.235 0.288 -18.40 0.515 0.998 -48.400.613 0.642 -4.52 2.243 2.263 -0.880.848 0.930 -8.82 2.758 3.261 -15.420.312 0.490 -36.33 1.242 1.539 -19.301.160 1.420 -18.31 4.000 4.800 -16.67
Total OthersTotal Big Plus MinesTotal Rest of MinesTotal WCL
Total Big Mines
Type
Mine
Production During June Production Upto June
Total Big MinesTotal OthersTotal Big Plus Mines
Type
Total Rest of MinesTotal WCL
Mine
Production During June Production Upto June
15

Table 2.1.5 (C) :Total Coal Production WCL
FY 21 FY 20 Growth M-o-M FY 21 FY 20 Growth
Y-o-YDurgapur -(Sec.-V) Others 0.063 0.054 16.67 0.373 0.132 182.58Sasti Others 0.136 0.078 74.36 0.386 0.223 73.09NM-Sector-I & II (A) Others 0.046 0.013 253.85 0.156 0.385 -59.48Niljai Deep Others 0.192 0.174 10.34 0.832 0.574 44.95Mungoli Others 0.189 0.140 35.00 0.739 0.625 18.24Penganga Big 0.235 0.357 -34.17 0.585 1.067 -45.17Ukni Others 0.097 0.078 24.36 0.267 0.375 -28.80Gondegaon Others 0.202 0.242 -16.53 0.892 0.811 9.99Umrer Others 0.18 0.358 -49.72 0.55 1.061 -48.16Makardhokra-I Others 0.104 0.057 82.46 0.524 0.212 147.17Gokul Others 0.233 0.187 24.60 0.613 0.723 -15.21MKD-III Others 0.085 0.148 -42.57 0.365 0.525 -30.48
0.235 0.357 -34.17 0.585 1.067 -45.171.527 1.529 -0.13 5.697 5.646 0.901.762 1.886 -6.57 6.282 6.713 -6.421.258 1.694 -25.74 4.128 5.197 -20.573.020 3.580 -15.64 10.410 11.910 -12.59
Production Upto June
Total Big MinesTotal OthersTotal Big Plus MinesTotal Rest of Mines
Production During June
Total WCL
TypeMine
16
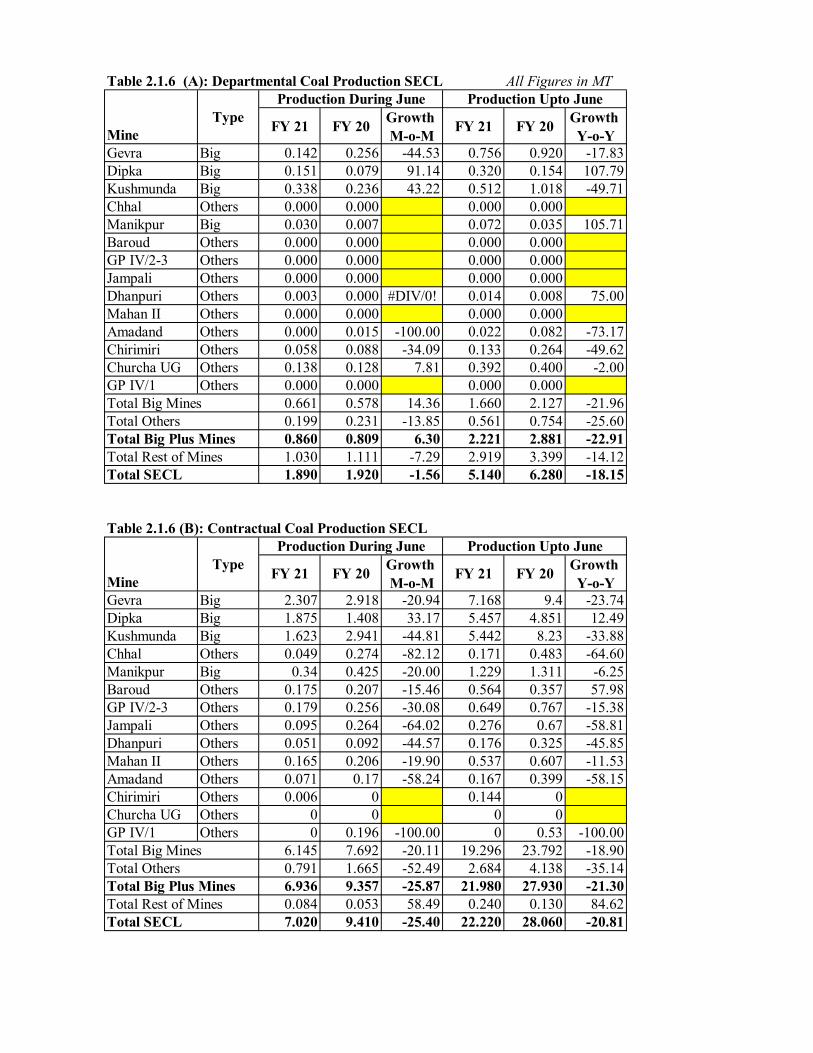
Table 2.1.6 (A): Departmental Coal Production SECL All Figures in MT
FY 21 FY 20 Growth M-o-M FY 21 FY 20 Growth
Y-o-YGevra Big 0.142 0.256 -44.53 0.756 0.920 -17.83Dipka Big 0.151 0.079 91.14 0.320 0.154 107.79Kushmunda Big 0.338 0.236 43.22 0.512 1.018 -49.71Chhal Others 0.000 0.000 0.000 0.000Manikpur Big 0.030 0.007 0.072 0.035 105.71Baroud Others 0.000 0.000 0.000 0.000GP IV/2-3 Others 0.000 0.000 0.000 0.000Jampali Others 0.000 0.000 0.000 0.000Dhanpuri Others 0.003 0.000 #DIV/0! 0.014 0.008 75.00Mahan II Others 0.000 0.000 0.000 0.000Amadand Others 0.000 0.015 -100.00 0.022 0.082 -73.17Chirimiri Others 0.058 0.088 -34.09 0.133 0.264 -49.62Churcha UG Others 0.138 0.128 7.81 0.392 0.400 -2.00GP IV/1 Others 0.000 0.000 0.000 0.000
0.661 0.578 14.36 1.660 2.127 -21.960.199 0.231 -13.85 0.561 0.754 -25.600.860 0.809 6.30 2.221 2.881 -22.911.030 1.111 -7.29 2.919 3.399 -14.121.890 1.920 -1.56 5.140 6.280 -18.15
Table 2.1.6 (B): Contractual Coal Production SECL
FY 21 FY 20 Growth M-o-M FY 21 FY 20 Growth
Y-o-YGevra Big 2.307 2.918 -20.94 7.168 9.4 -23.74Dipka Big 1.875 1.408 33.17 5.457 4.851 12.49Kushmunda Big 1.623 2.941 -44.81 5.442 8.23 -33.88Chhal Others 0.049 0.274 -82.12 0.171 0.483 -64.60Manikpur Big 0.34 0.425 -20.00 1.229 1.311 -6.25Baroud Others 0.175 0.207 -15.46 0.564 0.357 57.98GP IV/2-3 Others 0.179 0.256 -30.08 0.649 0.767 -15.38Jampali Others 0.095 0.264 -64.02 0.276 0.67 -58.81Dhanpuri Others 0.051 0.092 -44.57 0.176 0.325 -45.85Mahan II Others 0.165 0.206 -19.90 0.537 0.607 -11.53Amadand Others 0.071 0.17 -58.24 0.167 0.399 -58.15Chirimiri Others 0.006 0 0.144 0Churcha UG Others 0 0 0 0GP IV/1 Others 0 0.196 -100.00 0 0.53 -100.00
6.145 7.692 -20.11 19.296 23.792 -18.900.791 1.665 -52.49 2.684 4.138 -35.146.936 9.357 -25.87 21.980 27.930 -21.300.084 0.053 58.49 0.240 0.130 84.627.020 9.410 -25.40 22.220 28.060 -20.81
Mine
Production During June Production Upto June
Mine
Production During June Production Upto June
Total Big MinesTotal OthersTotal Big Plus MinesTotal Rest of MinesTotal SECL
Total Big MinesTotal Others
Type
Type
Total Big Plus MinesTotal Rest of MinesTotal SECL
17

Table 2.1.6 (C): Total Coal Production SECL
FY 21 FY 20 Growth M-o-M FY 21 FY 20 Growth
Y-o-YGevra Big 2.449 3.174 -22.84 7.924 10.32 -23.22Dipka Big 2.026 1.487 36.25 5.777 5.005 15.42Kushmunda Big 1.961 3.177 -38.28 5.954 9.248 -35.62Chhal Others 0.049 0.274 -82.12 0.171 0.483 -64.60Manikpur Big 0.37 0.432 -14.35 1.301 1.346 -3.34Baroud Others 0.175 0.207 -15.46 0.564 0.357 57.98GP IV/2-3 Others 0.179 0.256 -30.08 0.649 0.767 -15.38Jampali Others 0.095 0.264 -64.02 0.276 0.67 -58.81Dhanpuri Others 0.054 0.092 -41.30 0.19 0.333 -42.94Mahan II Others 0.165 0.206 -19.90 0.537 0.607 -11.53Amadand Others 0.071 0.185 -61.62 0.189 0.481 -60.71Chirimiri Others 0.064 0.088 -27.27 0.277 0.264 4.92Churcha UG Others 0.138 0.128 7.81 0.392 0.4 -2.00GP IV/1 Others 0 0.196 -100.00 0 0.53 -100.00
6.806 8.27 -17.7025 20.956 25.919 -19.14811.010 1.896 -46.73 3.245 4.892 -33.66727.816 10.166 -23.116 24.201 30.811 -21.4531.114 1.164 -4.296 3.179 3.519 -9.6628.930 11.330 -21.18 27.380 34.330 -20.24
Production During June Production Upto JuneType
Total Big Plus MinesTotal Rest of MinesTotal SECL
Total Big MinesTotal Others
Mine
18
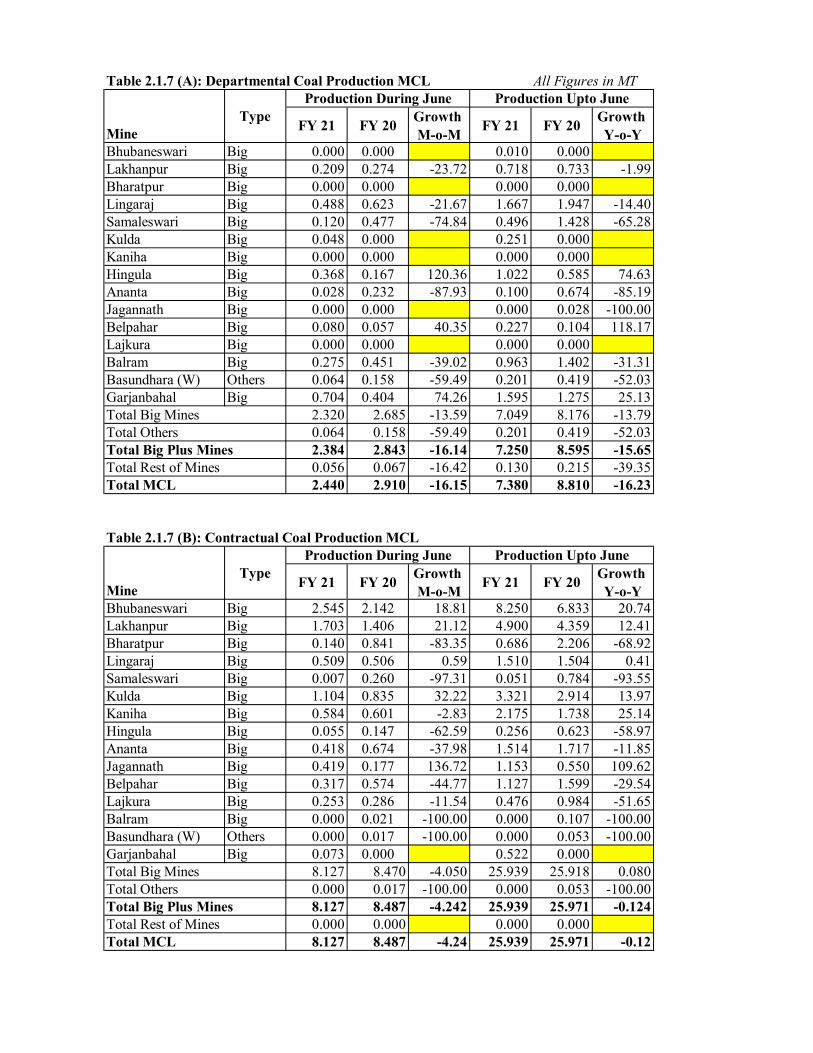
Table 2.1.7 (A): Departmental Coal Production MCL All Figures in MT
FY 21 FY 20 Growth M-o-M FY 21 FY 20 Growth
Y-o-YBhubaneswari Big 0.000 0.000 0.010 0.000Lakhanpur Big 0.209 0.274 -23.72 0.718 0.733 -1.99Bharatpur Big 0.000 0.000 0.000 0.000Lingaraj Big 0.488 0.623 -21.67 1.667 1.947 -14.40Samaleswari Big 0.120 0.477 -74.84 0.496 1.428 -65.28Kulda Big 0.048 0.000 0.251 0.000Kaniha Big 0.000 0.000 0.000 0.000Hingula Big 0.368 0.167 120.36 1.022 0.585 74.63Ananta Big 0.028 0.232 -87.93 0.100 0.674 -85.19Jagannath Big 0.000 0.000 0.000 0.028 -100.00Belpahar Big 0.080 0.057 40.35 0.227 0.104 118.17Lajkura Big 0.000 0.000 0.000 0.000Balram Big 0.275 0.451 -39.02 0.963 1.402 -31.31Basundhara (W) Others 0.064 0.158 -59.49 0.201 0.419 -52.03Garjanbahal Big 0.704 0.404 74.26 1.595 1.275 25.13
2.320 2.685 -13.59 7.049 8.176 -13.790.064 0.158 -59.49 0.201 0.419 -52.032.384 2.843 -16.14 7.250 8.595 -15.650.056 0.067 -16.42 0.130 0.215 -39.352.440 2.910 -16.15 7.380 8.810 -16.23
Table 2.1.7 (B): Contractual Coal Production MCL
FY 21 FY 20 Growth M-o-M FY 21 FY 20 Growth
Y-o-YBhubaneswari Big 2.545 2.142 18.81 8.250 6.833 20.74Lakhanpur Big 1.703 1.406 21.12 4.900 4.359 12.41Bharatpur Big 0.140 0.841 -83.35 0.686 2.206 -68.92Lingaraj Big 0.509 0.506 0.59 1.510 1.504 0.41Samaleswari Big 0.007 0.260 -97.31 0.051 0.784 -93.55Kulda Big 1.104 0.835 32.22 3.321 2.914 13.97Kaniha Big 0.584 0.601 -2.83 2.175 1.738 25.14Hingula Big 0.055 0.147 -62.59 0.256 0.623 -58.97Ananta Big 0.418 0.674 -37.98 1.514 1.717 -11.85Jagannath Big 0.419 0.177 136.72 1.153 0.550 109.62Belpahar Big 0.317 0.574 -44.77 1.127 1.599 -29.54Lajkura Big 0.253 0.286 -11.54 0.476 0.984 -51.65Balram Big 0.000 0.021 -100.00 0.000 0.107 -100.00Basundhara (W) Others 0.000 0.017 -100.00 0.000 0.053 -100.00Garjanbahal Big 0.073 0.000 0.522 0.000
8.127 8.470 -4.050 25.939 25.918 0.0800.000 0.017 -100.00 0.000 0.053 -100.008.127 8.487 -4.242 25.939 25.971 -0.1240.000 0.000 0.000 0.0008.127 8.487 -4.24 25.939 25.971 -0.12
Mine
Production During June Production Upto June
Mine
Production During June Production Upto June
Total Big MinesTotal OthersTotal Big Plus MinesTotal Rest of MinesTotal MCL
Total Big MinesTotal Others
Type
Type
Total Big Plus MinesTotal Rest of MinesTotal MCL
19

Table 2.1.7 (C): Total Coal Production MCL
FY 21 FY 20 Growth M-o-M FY 21 FY 20 Growth
Y-o-YBhubaneswari Big 2.545 2.142 18.81 8.260 6.833 20.88Lakhanpur Big 1.912 1.680 13.81 5.618 5.092 10.34Bharatpur Big 0.140 0.841 -83.35 0.686 2.206 -68.92Lingaraj Big 0.997 1.129 -11.69 3.177 3.451 -7.95Samaleswari Big 0.127 0.737 -82.77 0.546 2.212 -75.30Kulda Big 1.152 0.835 37.96 3.572 2.914 22.59Kaniha Big 0.584 0.601 -2.83 2.175 1.738 25.14Hingula Big 0.423 0.314 34.71 1.277 1.208 5.73Ananta Big 0.446 0.906 -50.77 1.613 2.391 -32.52Jagannath Big 0.419 0.177 136.72 1.153 0.578 99.46Belpahar Big 0.397 0.631 -37.08 1.354 1.703 -20.52Lajkura Big 0.253 0.286 -11.54 0.476 0.984 -51.65Balram Big 0.275 0.472 -41.74 0.963 1.509 -36.18Basundhara (W) Others 0.064 0.175 -63.43 0.201 0.472 -57.42Garjanbahal Big 0.777 0.404 92.33 2.117 1.275 66.04
10.447 11.155 -6.35 32.987 34.094 -3.250.064 0.175 -63.43 0.201 0.472 -57.42
10.511 11.330 -7.23 33.188 34.566 -3.990.053 0.067 -20.90 0.126 0.215 -41.53
10.564 11.397 -7.31 33.314 34.781 -4.22
Production During June Production Upto JuneType
Total Big Plus MinesTotal Rest of MinesTotal MCL
Total Big MinesTotal Others
Mine
20
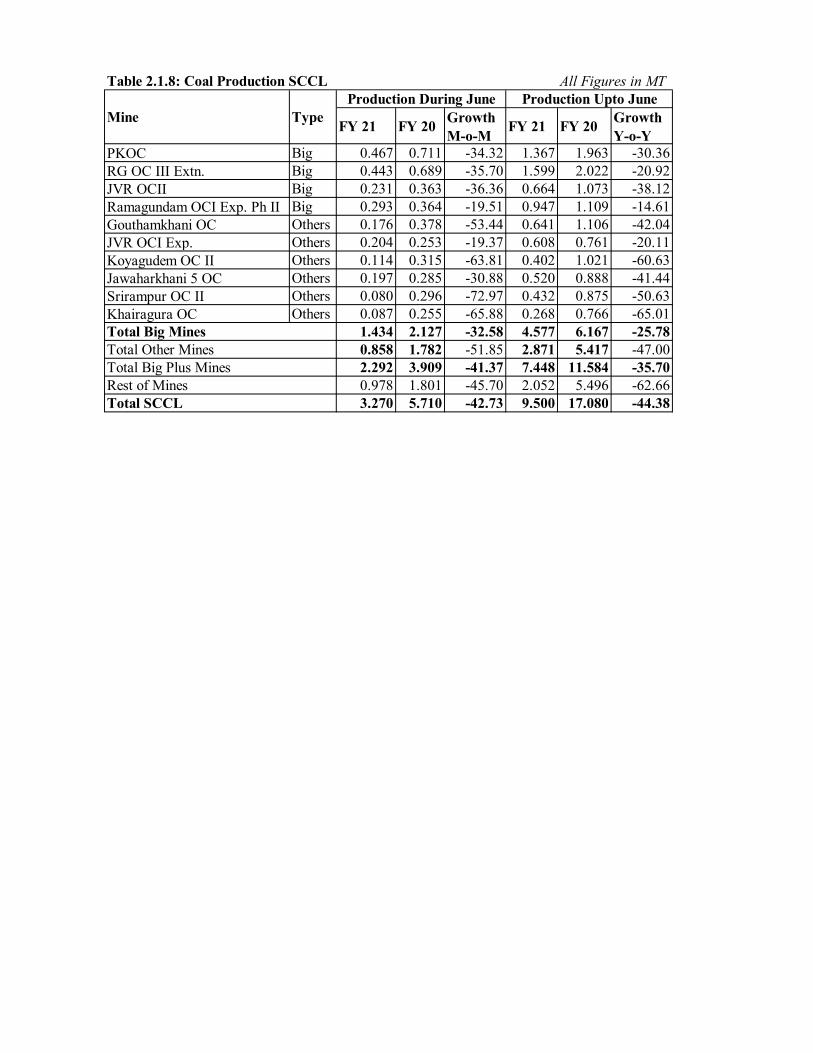
Table 2.1.8: Coal Production SCCL All Figures in MT
FY 21 FY 20 Growth M-o-M FY 21 FY 20 Growth
Y-o-YPKOC Big 0.467 0.711 -34.32 1.367 1.963 -30.36RG OC III Extn. Big 0.443 0.689 -35.70 1.599 2.022 -20.92JVR OCII Big 0.231 0.363 -36.36 0.664 1.073 -38.12Ramagundam OCI Exp. Ph II Big 0.293 0.364 -19.51 0.947 1.109 -14.61Gouthamkhani OC Others 0.176 0.378 -53.44 0.641 1.106 -42.04JVR OCI Exp. Others 0.204 0.253 -19.37 0.608 0.761 -20.11Koyagudem OC II Others 0.114 0.315 -63.81 0.402 1.021 -60.63Jawaharkhani 5 OC Others 0.197 0.285 -30.88 0.520 0.888 -41.44Srirampur OC II Others 0.080 0.296 -72.97 0.432 0.875 -50.63Khairagura OC Others 0.087 0.255 -65.88 0.268 0.766 -65.01
1.434 2.127 -32.58 4.577 6.167 -25.780.858 1.782 -51.85 2.871 5.417 -47.002.292 3.909 -41.37 7.448 11.584 -35.700.978 1.801 -45.70 2.052 5.496 -62.663.270 5.710 -42.73 9.500 17.080 -44.38
Production During June Production Upto June
Total Big Mines
Rest of MinesTotal SCCL
Total Other MinesTotal Big Plus Mines
Mine Type
21

Table 2.1.9: Coal Production Captive & Others All Figures in MT
FY 21 FY 20 Growth M-o-M FY 21 FY 20 Growth
Y-o-YMoher & Amlohori Extn. Big 1.346 1.691 -20.40 4.337 4.593 -5.58Parsa East & Kanta Basan Big 0.806 1.203 -32.98 1.932 2.872 -32.73Pakri Barwadih Big 0.901 0.660 36.55 2.441 2.126 14.83Jamadoba & WB Big 0.501 0.546 -8.17 1.566 1.616 -3.09Amelia (North) Big 0.265 0.197 34.61 0.749 1.009 -25.74Sarshatali Big 0.174 0.157 10.83 0.532 0.579 -8.12Tadicherla-I Big 0.148 0.106 39.31 0.516 0.404 27.81 Dulanga Big 0.159 0.065 145.26 0.446 0.221 101.68Manoharpur Big 0.039 0.048 -20.45 0.070 0.065 7.49Pachwara North Big 0.269 0.000 0.501 0.000
4.609 4.673 -1.39 13.091 13.485 -2.920.215 0.426 -49.37 0.573 1.379 -58.434.824 5.099 -5.39 13.664 14.864 -8.07Overall Captive & Othres
Production During June Production Upto JuneBlock Type
Total Big MinesRest of Mines
22

Table 2.2: Summary of OBR of Big Mines of CIL All Figures in MM3
FY 21 FY 20 Growth M-o-M FY 21 FY 20 Growth
Y-o-Y7.021 7.363 -4.64 25.556 22.215 15.040.196 0.424 -53.84 0.758 1.552 -51.137.217 7.787 -7.32 26.315 23.767 10.722.843 3.673 -22.60 9.145 11.393 -19.73
10.060 11.460 -12.22 35.460 35.160 0.850.000 0.000 0.000 0.0004.351 4.805 -9.45 14.198 15.170 -6.414.351 4.805 -9.45 14.198 15.170 -6.413.899 1.915 103.60 11.002 6.930 58.768.250 6.720 22.77 25.200 22.100 14.033.962 4.216 -6.02 13.503 12.175 10.911.637 1.966 -16.73 5.486 5.939 -7.635.599 6.182 -9.43 18.989 18.114 4.832.751 2.738 0.47 7.931 8.196 -3.238.350 8.920 -6.39 26.920 26.310 2.32
26.829 25.116 6.82 87.112 77.816 11.950.813 1.609 -49.45 3.244 5.114 -36.56
27.642 26.724 3.44 90.356 82.930 8.960.000 0.000 0.000 0.000
27.642 26.724 3.44 90.356 82.930 8.951.046 1.501 -30.31 3.562 4.138 -13.928.714 11.752 -25.85 37.991 39.230 -3.169.760 13.253 -26.35 41.553 43.368 -4.185.490 3.787 44.96 20.577 14.322 43.67
15.250 17.040 -10.50 62.130 57.690 7.709.384 9.387 -0.03 32.932 32.958 -0.082.966 3.292 -9.90 9.840 9.335 5.41
12.350 12.679 -2.59 42.772 42.293 1.131.730 0.981 76.35 5.358 3.407 57.26
14.080 13.660 3.07 48.130 45.700 5.3211.146 8.988 24.01 41.790 30.128 38.71
0.030 0.014 114.29 0.068 0.081 -16.1711.176 9.002 24.15 41.858 30.209 38.560.000 0.000 0.000 0.000
11.176 9.002 24.15 41.858 30.209 38.5659.388 56.571 4.98 204.456 179.430 13.9518.707 23.862 -21.60 71.585 76.421 -6.3378.095 80.432 -2.91 276.041 255.851 7.8916.705 13.088 27.63 54.019 44.249 22.0894.800 93.520 1.37 330.060 300.100 9.988.404 12.495 -32.74 28.522 39.785 -28.318.536 9.605 -11.13 25.302 31.928 -20.75
16.940 22.100 -23.35 53.824 71.713 -24.957.300 7.941 -8.07 43.166 9.237 367.32
24.240 30.041 -19.31 96.990 80.950 19.81
CIL
Big MinesOther MinesBig Plus MinesRest of MinesTotal CIL
MCL
Big MinesOther MinesBig Plus MinesRest of MinesTotal MCL
SECL
Big MinesOther MinesBig Plus MinesRest of MinesTotal SECL
WCL
Big MinesOther MinesBig Plus MinesRest of MinesTotal WCL
NCL
Big MinesOther MinesBig Plus MinesRest of MinesTotal NCL
CCL
Big MinesOther MinesBig Plus MinesRest of MinesTotal CCL
BCCL
Big MinesOther MinesBig Plus MinesRest of MinesTotal BCCL
Subsidiary Description
OBR During June OBR Upto June
ECL
Big MinesOther MinesBig Plus MinesRest of MinesTotal ECL
SCCL
Big MinesOther MinesBig Plus MinesRest of MinesTotal SCCL
23
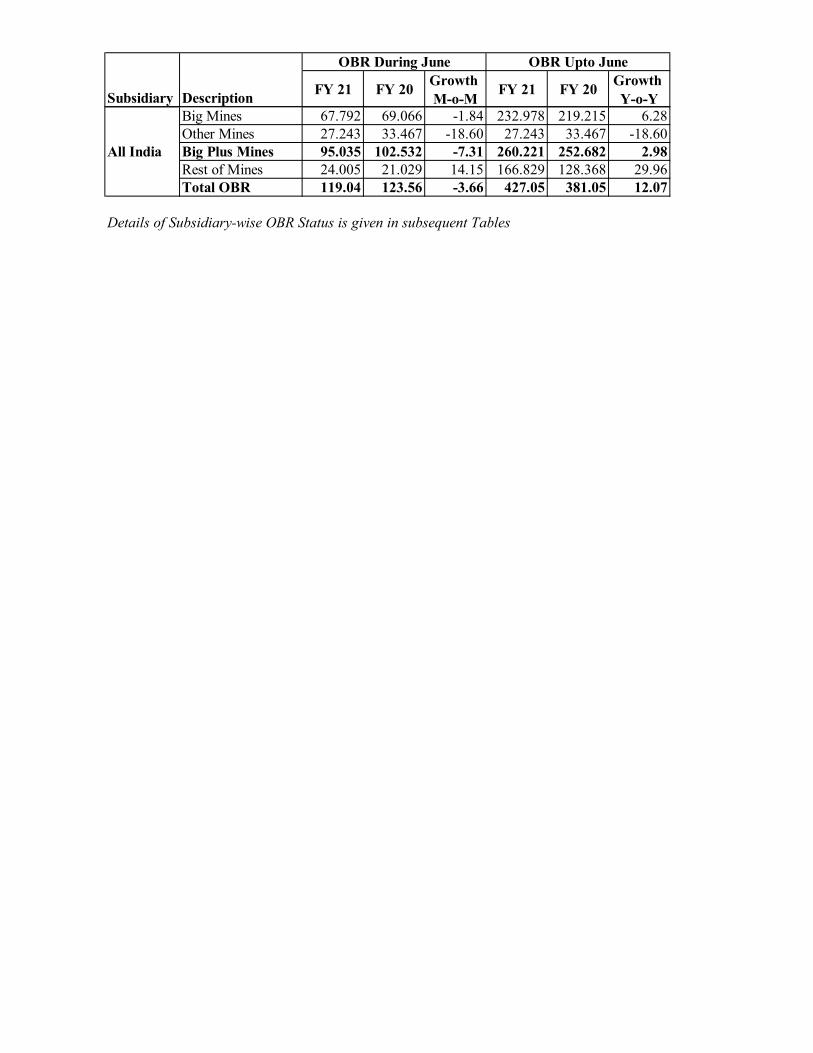
FY 21 FY 20 Growth M-o-M FY 21 FY 20 Growth
Y-o-YSubsidiary Description
OBR During June OBR Upto June
67.792 69.066 -1.84 232.978 219.215 6.2827.243 33.467 -18.60 27.243 33.467 -18.6095.035 102.532 -7.31 260.221 252.682 2.9824.005 21.029 14.15 166.829 128.368 29.96119.04 123.56 -3.66 427.05 381.05 12.07
Details of Subsidiary-wise OBR Status is given in subsequent Tables
Big MinesOther MinesBig Plus MinesAll IndiaRest of MinesTotal OBR
24

Table 2.2.1 (A) Departmental OBR ECL All Figurds in MM3
FY 21 FY 20 Growth M-o-M FY 21 FY 20 Growth
Y-o-YRajmahal Big 0.320 0.202 58.53 1.348 0.851 58.37Sonepur Bazari Big 0.837 0.793 5.56 2.671 2.491 7.21Chitra East Others 0.178 0.042 322.94 0.490 0.203 141.31
1.157 0.995 16.32 4.018 3.342 20.240.178 0.042 322.94 0.490 0.203 141.311.335 1.037 28.74 4.508 3.545 27.170.715 0.773 -7.50 2.282 2.275 0.302.050 1.810 13.26 6.790 5.820 16.67
Table 2.2.1 (B) Contractual OBR ECL
FY 21 FY 20 Growth M-o-M FY 21 FY 20 Growth
Y-o-YRajmahal Big 1.682 1.785 -5.74 6.769 5.412 25.07Sonepur Bazari Big 4.182 4.583 -8.76 14.769 13.461 9.72Chitra East Others 0.018 0.382 -95.27 0.269 1.349
5.864 6.368 -7.91 21.538 18.873 14.120.018 0.382 -95.27 0.269 1.349 -80.095.882 6.750 -12.86 21.807 20.222 7.842.128 2.900 -26.62 6.863 9.118 -24.738.010 9.650 -16.99 28.670 29.340 -2.28
Table 2.2.1 (C) Total OBR ECL
FY 21 FY 20 Growth M-o-M FY 21 FY 20 Growth
Y-o-YRajmahal Big 2.003 1.987 0.79 8.116 6.263 29.59Sonepur Bazari Big 5.019 5.376 -6.65 17.440 15.952 9.33Chitra East Others 0.196 0.424 -53.84 0.758 1.552 -51.13
7.021 7.363 -4.64 25.556 22.215 15.040.196 0.424 -53.84 0.758 1.552 -51.137.217 7.787 -7.32 26.315 23.767 10.722.843 3.673 -22.60 9.145 11.393 -19.7310.06 11.46 -12.22 35.46 35.16 0.85
Big Plus MinesRest of MinesTotal ECL
Other MinesBig Plus MinesRest of Mines
Big MinesOther Mines
Total ECL
Mine TypeOBR During June OBR Upto June
OBR During June OBR Upto JuneMine
MineOBR During June OBR Upto June
Big MinesOther MinesBig Plus MinesRest of MinesTotal ECL
Big Mines
Type
Type
25

Table 2.2.2 (A) Departmental OBR BCCL All Figurds in MM3
FY 21 FY 20 Growth M-o-M FY 21 FY 20 Growth
Y-o-YNT ST Je Others 0.143 0.112 27.66 0.481 0.309 55.67AKWMC Others 0.313 0.241 30.05 0.955 0.735 29.89Phularitand Others 0.000 0.000 0.000 0.000S Bansjora Others 0.000 0.000 0.000 0.000NGKAC Others 0.000 0.000 0.000 0.000ROCP Others 0.000 0.100 -100.00 0.000 0.351 -100.00KOCP Others 0.138 0.024 476.23 0.500 0.118 323.74ABOCP Others 0.279 0.210 32.91 0.839 0.545 53.99B Dahibari Others 0.131 0.113 15.75 0.367 0.310 18.49
0.000 0.000 0.000 0.0001.005 0.800 25.58 3.142 2.368 32.701.005 0.800 25.58 3.142 2.368 32.700.605 0.660 -8.28 1.518 1.942 -21.851.610 1.460 10.27 4.660 4.310 8.12
Table 2.2.2 (B) Contractual OBR BCCL
FY 21 FY 20 Growth M-o-M FY 21 FY 20 Growth
Y-o-YNT ST Je Others 0.827 0.542 52.63 2.611 1.639 59.29AKWMC Others 0.316 0.460 -31.31 1.257 1.415 -11.17Phularitand Others 0.272 0.638 -57.31 0.925 1.896 -51.20S Bansjora Others 0.244 0.408 -40.18 0.756 1.110 -31.86NGKAC Others 0.000 0.000 #DIV/0! 0.097 0.417 -76.79ROCP Others 0.687 1.176 -41.56 2.167 3.671 -40.98KOCP Others 0.482 0.781 -38.29 1.488 2.575 -42.21ABOCP Others 0.517 0.000 1.755 0.000B Dahibari Others 0.000 0.000 0.000 0.079 -100.00
0.000 0.000 0.000 0.0003.346 4.005 -16.446 11.056 12.802 -13.6413.346 4.005 -16.446 11.056 12.802 -13.6413.294 1.255 162.442 9.484 4.988 90.1426.640 5.260 26.24 20.540 17.790 15.46
MineOBR During June OBR Upto June
MineOBR During June OBR Upto June
Big MinesOther MinesBig Plus MinesRest of MinesTotal BCCL
Big MinesOther Mines
Type
Type
Big Plus MinesRest of MinesTotal BCCL
26

Table 2.2.2 (C) Total OBR BCCL
FY 21 FY 20 Growth M-o-M FY 21 FY 20 Growth
Y-o-YNT ST Je Others 0.970 0.654 48.35 3.092 1.948 58.71AKWMC Others 0.629 0.701 -10.22 2.212 2.150 2.87Phularitand Others 0.272 0.638 -57.31 0.925 1.896 -51.20S Bansjora Others 0.244 0.408 -40.18 0.756 1.110 -31.86NGKAC Others 0.000 0.000 #DIV/0! 0.097 0.417 -76.79ROCP Others 0.687 1.276 -46.14 2.167 4.022 -46.13KOCP Others 0.620 0.805 -22.95 1.988 2.693 -26.18ABOCP Others 0.797 0.210 279.32 2.594 0.545 376.04B Dahibari Others 0.131 0.113 15.75 0.367 0.389 -5.57
0.000 0.000 0.000 0.0004.351 4.805 -9.45 14.198 15.170 -6.414.351 4.805 -9.45 14.198 15.170 -6.413.899 1.915 103.605 11.002 6.930 58.7598.250 6.720 22.77 25.200 22.100 14.03
OBR During June OBR Upto JuneType
Big Plus MinesRest of MinesTotal BCCL
Big MinesOther Mines
Mine
27

Table 2.2.3 (A) Departmental OBR CCL All Figurds in MM3
FY 21 FY 20 Growth M-o-M FY 21 FY 20 Growth
Y-o-YAshoka Big 0.097 0.063 53.97 0.260 0.188 38.30Piparwar Big 0.133 0.037 259.46 0.406 0.260 56.15Amarpali Big 0.000 0.000 0.000 0.000AKK Big 0.248 0.151 64.24 0.721 0.491 46.84Govindpur Ph II Others 0.130 0.155 -16.13 0.418 0.446 -6.26Rohini Others 0.137 0.139 -1.44 0.444 0.411 8.03Purnadih Others 0.260 0.178 46.07 0.773 0.709 9.03Magadh Big 0.000 0.000 0.000 0.000Tapin North Others 0.184 0.178 3.37 0.548 0.493 11.16Birsa Project Others 0.111 0.100 11.00 0.330 0.278 18.71Karo Big 0.000 0.000 0.000 0.000Topa OC Others 0.000 0.000 0.000 0.000
0.478 0.251 90.44 1.387 0.939 47.710.822 0.750 9.60 2.513 2.337 7.541.300 1.001 29.87 3.900 3.276 19.052.320 1.919 20.90 6.780 5.874 15.423.620 2.920 23.97 10.680 9.150 16.72
Table 2.2.3 (B) Contractual OBR CCL
FY 21 FY 20 Growth M-o-M FY 21 FY 20 Growth
Y-o-YAshoka Big 1.121 1.448 -22.58 4.084 4.232 -3.50Piparwar Big 0.188 0.334 -43.71 0.834 0.595 40.17Amarpali Big 1.293 0.986 31.14 4.716 3.497 34.86AKK Big 0.066 0.389 -83.03 0.324 1.179 -72.52Govindpur Ph II Others 0.170 0.159 6.92 0.538 0.527 2.06Rohini Others 0.057 0.432 -86.81 0.640 1.175 -45.53Purnadih Others 0.000 0.000 0.000 0.000Magadh Big 0.757 0.751 0.80 1.911 1.600 19.44Tapin North Others 0.000 0.000 0.000 0.000Birsa Project Others 0.322 0.479 -32.78 1.020 1.502 -32.09Karo Big 0.059 0.057 0.247 0.133 85.71Topa OC Others 0.266 0.146 82.19 0.775 0.398 94.63
3.484 3.965 -12.13 12.116 11.236 7.830.815 1.216 -32.98 2.972 3.602 -17.484.299 5.181 -17.02 15.088 14.838 1.690.431 0.819 -47.37 1.152 2.322 -50.414.730 6.000 -21.17 16.240 17.160 -5.36
MineOBR During June OBR Upto June
MineOBR During June OBR Upto June
Big MinesOther MinesBig Plus MinesRest of MinesTotal CCL
Big MinesOther Mines
Type
Type
Big Plus MinesRest of MinesTotal CCL
28

Table 2.2.3 (C) Total OBR CCL
FY 21 FY 20 Growth M-o-M FY 21 FY 20 Growth
Y-o-YAshoka Big 1.218 1.511 -19.39 4.344 4.420 -1.72Piparwar Big 0.321 0.371 -13.48 1.240 0.855 45.03Amarpali Big 1.293 0.986 31.14 4.716 3.497 34.86AKK Big 0.314 0.540 -41.85 1.045 1.670 -37.43Govindpur Ph II Others 0.300 0.314 -4.46 0.956 0.973 -1.75Rohini Others 0.194 0.571 -66.02 1.084 1.586 -31.65Purnadih Others 0.260 0.178 46.07 0.773 0.709 9.03Magadh Big 0.757 0.751 0.80 1.911 1.600 19.44Tapin North Others 0.184 0.178 3.37 0.548 0.493 11.16Birsa Project Others 0.433 0.579 -25.22 1.350 1.780 -24.16Karo Big 0.059 0.057 0.247 0.133 85.71Topa OC Others 0.266 0.146 82.19 0.775 0.398 94.63
3.962 4.216 -6.02 13.503 12.175 10.911.637 1.966 -16.73 5.486 5.939 -7.635.599 6.182 -9.43 18.989 18.114 4.832.751 2.738 0.47 7.931 8.196 -3.238.350 8.920 -6.39 26.920 26.310 2.32
OBR During June OBR Upto JuneType
Big Plus MinesRest of MinesTotal CCL
Big MinesOther Mines
Mine
29

Table 2.2. 4 (A) Departmental OBR NCL All Figurds in MM3
FY 21 FY 20 Growth M-o-M FY 21 FY 20 Growth
Y-o-YNigahi Big 1.556 1.242 25.29 4.606 4.707 -2.16Jayant Big 1.235 1.341 -7.90 4.137 4.235 -2.31Dudhichua Big 0.882 1.189 -25.82 2.973 3.549 -16.23Amlohri Big 1.252 1.043 20.04 3.979 3.218 23.65Khadia Big 0.674 0.669 0.71 2.184 1.953 11.84Bina Big 0.607 0.680 -10.74 1.864 1.837 1.47Krishnashila Big 0.041 0.060 -32.45 0.107 0.107 -0.44Block B Big 0.000 0.000 0.000 0.000Jingurda Others 0.142 0.090 57.78 0.507 0.273 85.71Kakari Others 0.222 0.287 -22.65 0.731 0.872 -16.17
6.246 6.224 0.36 19.849 19.606 1.240.364 0.377 -3.45 1.238 1.145 8.126.610 6.601 0.14 21.087 20.751 1.620.000 0.000 0.000 0.0006.610 6.601 0.14 21.087 20.751 1.62
Table 2.2.4 (B) Contractual OBR NCL
FY 21 FY 20 Growth M-o-M FY 21 FY 20 Growth
Y-o-YNigahi Big 4.559 3.706 23.03 13.605 12.606 7.92Jayant Big 1.807 2.225 -18.79 6.809 7.706 -11.63Dudhichua Big 3.014 3.000 0.48 11.628 8.841 31.53Amlohri Big 3.607 3.723 -3.11 8.941 10.892 -17.91Khadia Big 3.013 2.248 34.03 11.037 6.036 82.84Bina Big 2.414 1.906 26.67 8.442 6.178 36.66Krishnashila Big 1.607 1.770 -9.22 5.642 5.552 1.62Block B Big 0.562 0.314 78.72 1.159 0.399 190.62Jingurda Others 0.449 0.707 -36.49 1.906 2.305 -17.32Kakari Others 0.000 0.524 -100.00 0.100 1.663 -93.99
20.583 18.891 8.95 67.263 58.210 15.550.449 1.232 -63.53 2.006 3.969 -49.45
21.032 20.123 4.52 69.269 62.179 11.400.000 0.000 0.000 0.000
21.032 20.123 4.52 69.269 62.179 11.40
MineOBR During June OBR Upto June
MineOBR During June OBR Upto June
Big MinesOther MinesBig Plus MinesRest of MinesTotal NCL
Big MinesOther Mines
Type
Type
Big Plus MinesRest of MinesTotal NCL
30

Table 2.2.4 (C) Total OBR NCLType
FY 21 FY 20Growth M-o-M FY 21 FY 20
Growth Y-o-Y
Nigahi Big 6.115 4.948 23.60 18.211 17.314 5.18Jayant Big 3.042 3.566 -14.70 10.946 11.941 -8.33Dudhichua Big 3.896 4.189 -6.98 14.601 12.390 17.85Amlohri Big 4.859 4.766 1.95 12.920 14.110 -8.43Khadia Big 3.687 2.917 26.39 13.221 7.989 65.48Bina Big 3.021 2.586 16.83 10.306 8.015 28.60Krishnashila Big 1.648 1.830 -9.98 5.749 5.659 1.58Block B Big 0.562 0.314 78.72 1.159 0.399 190.62Jingurda Others 0.591 0.797 -25.85 2.413 2.578 -6.41Kakari Others 0.222 0.811 -72.64 0.831 2.535 -67.22
26.829 25.116 6.82 87.112 77.816 11.950.813 1.609 -49.45 3.244 5.114 -36.56
27.642 26.724 3.44 90.356 82.930 8.960.000 0.000 0.000 0.000
27.642 26.724 3.44 90.356 82.930 8.95
Production During June Production During June
Big Plus MinesRest of MinesTotal NCL
Big MinesOther Mines
Mine
31

Table 2.2.5 (A) Departmental OBR WCL All Figurds in MM3
FY 21 FY 20 Growth M-o-M FY 21 FY 20 Growth
Y-o-YDurgapur -(Sec.-V) Others 0.231 0.000 #DIV/0! 0.660 0.881 -25.14Sasti Others 0.233 0.258 -9.70 1.076 1.162 -7.40NM-Sector-I & II (A) Others 0.043 0.428 0.481 0.493Niljai Deep Others 0.047 0.222 -78.62 0.191 0.803 -76.16Mungoli Others 0.363 0.221 64.29 1.129 1.375 -17.89Penganga Big 0.227 0.438 -48.21 0.903 0.656 37.63Ukni Others 0.272 0.135 101.11 1.469 0.712 106.25Gondegaon Others 0.293 0.229 1.076 1.227Umrer Others 0.328 0.367 -10.70 1.214 0.845 43.64Makardhokra-I Others 0.000 0.255 0.000 0.042 -100.00Gokul Others 0.000 0.000 0.000 0.000MKD-III Others 0.000 0.000 0.000 0.000
0.227 0.000 #DIV/0! 0.903 0.656 37.631.810 2.115 -14.44 7.296 7.540 -3.242.036 2.115 -3.72 8.198 8.196 0.031.464 1.675 -12.62 3.972 4.254 -6.643.500 3.790 -7.65 12.170 12.450 -2.25
Table 2.2.5 (B) Contractual OBR WCL
FY 21 FY 20 Growth M-o-M FY 21 FY 20 Growth
Y-o-YDurgapur -(Sec.-V) Others 0.819 0.140 485.10 3.101 2.342 32.41Sasti Others 0.553 0.739 -25.15 2.138 2.677 -20.13NM-Sector-I & II (A) Others 0.000 0.832 -100.00 0.386 2.760 -86.01Niljai Deep Others 1.540 0.888 73.39 6.365 5.634 12.97Mungoli Others 1.081 1.798 5.141 0.000 #DIV/0!Penganga Big 0.819 0.000 #DIV/0! 2.659 3.482 -23.63Ukni Others 0.504 1.101 2.180 0.359Gondegaon Others 0.299 0.359 -16.66 1.721 2.634 -34.65Umrer Others 0.000 0.814 -100.00 0.000 1.666Makardhokra-I Others 0.588 0.496 18.56 2.602 3.772 -31.02Gokul Others 0.765 1.079 -29.11 3.706 4.549 -18.53MKD-III Others 0.756 1.391 -45.66 3.356 5.297 -36.65
0.819 1.501 -45.42 2.659 3.482 -23.636.905 9.637 -28.35 30.696 31.690 -3.147.724 11.138 -30.65 33.355 35.172 -5.174.026 2.112 90.63 16.605 10.068 64.93
11.750 13.250 -11.32 49.960 45.240 10.43
Big Mines
MineOBR During June OBR Upto June
Big MinesOther MinesBig Plus MinesRest of MinesTotal WCL
MineOBR During June OBR Upto June
Type
Type
Other MinesBig Plus MinesRest of MinesTotal WCL
32

Table 2.2.5 (C) Total OBR WCL
FY 21 FY 20 Growth M-o-M FY 21 FY 20 Growth
Y-o-YDurgapur -(Sec.-V) Others 1.050 0.140 649.74 3.761 3.223 16.68Sasti Others 0.786 0.997 -21.15 3.214 3.839 -16.28NM-Sector-I & II (A) Others 0.043 1.260 -96.57 0.867 3.253 -73.34Niljai Deep Others 1.587 1.110 42.99 6.556 6.437 1.85Mungoli Others 1.444 2.019 -28.47 6.270 1.375 356.02Penganga Big 1.046 0.438 138.84 3.562 4.138 -13.92Ukni Others 0.775 1.236 -37.29 3.648 1.071 240.62Gondegaon Others 0.592 0.588 0.73 2.797 3.861 -27.55Umrer Others 0.328 1.181 -72.25 1.214 2.511 -51.66Makardhokra-I Others 0.588 0.751 -21.70 2.602 3.814 -31.78Gokul Others 0.765 1.079 -29.11 3.706 4.549 -18.53MKD-III Others 0.756 1.391 -45.66 3.356 5.297 -36.65
1.046 1.501 -30.31 3.562 4.138 -13.928.714 11.752 -25.85 37.991 39.230 -3.169.760 13.253 -26.35 41.553 43.368 -4.185.490 3.787 44.96 20.577 14.322 43.67
15.250 17.040 -10.50 62.130 57.690 7.70Total WCL
Mine TypeOBR Upto June
Big MinesOther MinesBig Plus MinesRest of Mines
OBR During June
33
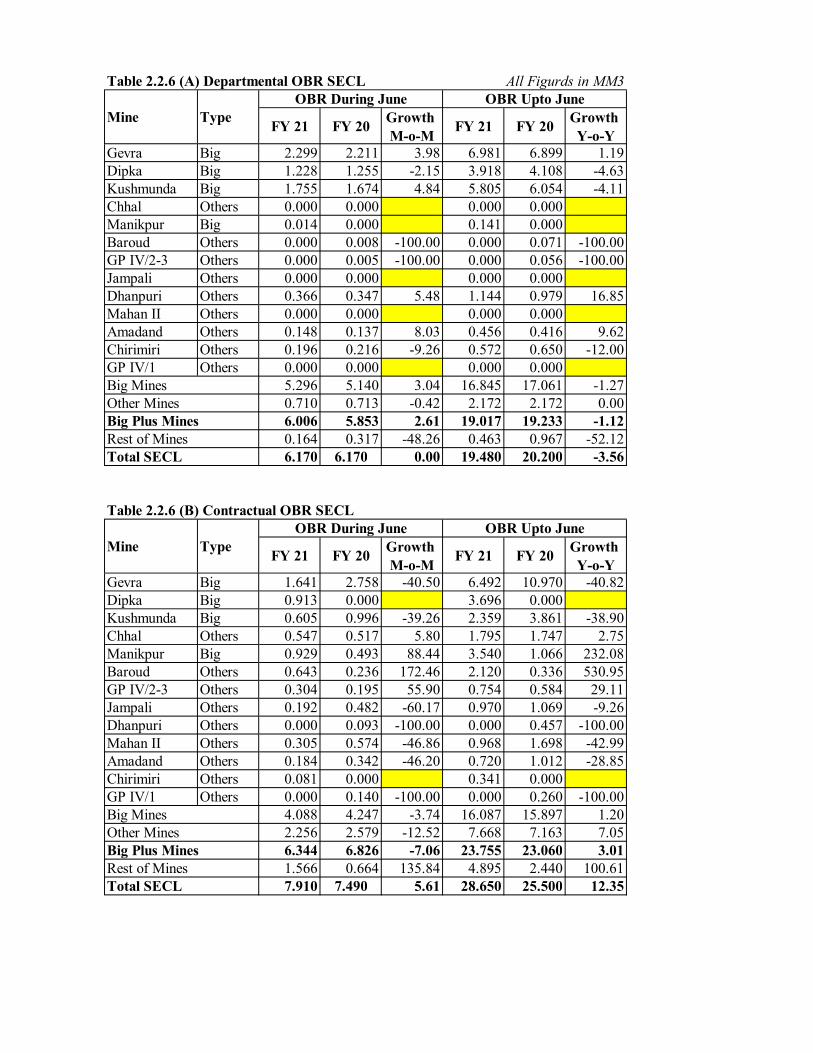
Table 2.2.6 (A) Departmental OBR SECL All Figurds in MM3
FY 21 FY 20 Growth M-o-M FY 21 FY 20 Growth
Y-o-YGevra Big 2.299 2.211 3.98 6.981 6.899 1.19Dipka Big 1.228 1.255 -2.15 3.918 4.108 -4.63Kushmunda Big 1.755 1.674 4.84 5.805 6.054 -4.11Chhal Others 0.000 0.000 0.000 0.000Manikpur Big 0.014 0.000 0.141 0.000Baroud Others 0.000 0.008 -100.00 0.000 0.071 -100.00GP IV/2-3 Others 0.000 0.005 -100.00 0.000 0.056 -100.00Jampali Others 0.000 0.000 0.000 0.000Dhanpuri Others 0.366 0.347 5.48 1.144 0.979 16.85Mahan II Others 0.000 0.000 0.000 0.000Amadand Others 0.148 0.137 8.03 0.456 0.416 9.62Chirimiri Others 0.196 0.216 -9.26 0.572 0.650 -12.00GP IV/1 Others 0.000 0.000 0.000 0.000
5.296 5.140 3.04 16.845 17.061 -1.270.710 0.713 -0.42 2.172 2.172 0.006.006 5.853 2.61 19.017 19.233 -1.120.164 0.317 -48.26 0.463 0.967 -52.126.170 6.170 0.00 19.480 20.200 -3.56
Table 2.2.6 (B) Contractual OBR SECL
FY 21 FY 20 Growth M-o-M FY 21 FY 20 Growth
Y-o-YGevra Big 1.641 2.758 -40.50 6.492 10.970 -40.82Dipka Big 0.913 0.000 3.696 0.000Kushmunda Big 0.605 0.996 -39.26 2.359 3.861 -38.90Chhal Others 0.547 0.517 5.80 1.795 1.747 2.75Manikpur Big 0.929 0.493 88.44 3.540 1.066 232.08Baroud Others 0.643 0.236 172.46 2.120 0.336 530.95GP IV/2-3 Others 0.304 0.195 55.90 0.754 0.584 29.11Jampali Others 0.192 0.482 -60.17 0.970 1.069 -9.26Dhanpuri Others 0.000 0.093 -100.00 0.000 0.457 -100.00Mahan II Others 0.305 0.574 -46.86 0.968 1.698 -42.99Amadand Others 0.184 0.342 -46.20 0.720 1.012 -28.85Chirimiri Others 0.081 0.000 0.341 0.000GP IV/1 Others 0.000 0.140 -100.00 0.000 0.260 -100.00
4.088 4.247 -3.74 16.087 15.897 1.202.256 2.579 -12.52 7.668 7.163 7.056.344 6.826 -7.06 23.755 23.060 3.011.566 0.664 135.84 4.895 2.440 100.617.910 7.490 5.61 28.650 25.500 12.35
MineOBR During June OBR Upto June
MineOBR During June OBR Upto June
Big MinesOther MinesBig Plus MinesRest of MinesTotal SECL
Big MinesOther Mines
Type
Type
Big Plus MinesRest of MinesTotal SECL
34

Table 2.2.6 (C) Total OBR SECL
FY 21 FY 20 Growth M-o-M FY 21 FY 20 Growth
Y-o-YGevra Big 3.940 4.969 -20.71 13.473 17.869 -24.60Dipka Big 2.141 1.255 70.60 7.614 4.108 85.35Kushmunda Big 2.360 2.670 -11.61 8.164 9.915 -17.66Chhal Others 0.547 0.517 5.80 1.795 1.747 2.75Manikpur Big 0.943 0.493 91.28 3.681 1.066 245.31Baroud Others 0.643 0.244 163.52 2.120 0.407 420.88GP IV/2-3 Others 0.304 0.200 52.00 0.754 0.640 17.81Jampali Others 0.192 0.482 -60.17 0.970 1.069 -9.26Dhanpuri Others 0.366 0.440 -16.82 1.144 1.436 -20.33Mahan II Others 0.305 0.574 -46.86 0.968 1.698 -42.99Amadand Others 0.332 0.479 -30.69 1.176 1.428 -17.65Chirimiri Others 0.277 0.216 28.24 0.913 0.650 40.46GP IV/1 Others 0.000 0.140 -100.00 0.000 0.260 -100.00
9.384 9.387 -0.03 32.932 32.958 -0.082.966 3.292 -9.90 9.840 9.335 5.41
12.350 12.679 -2.59 42.772 42.293 1.131.730 0.981 76.35 5.358 3.407 57.26
14.080 13.660 3.07 48.130 45.700 5.32
OBR During June OBR Upto JuneType
Big Plus MinesRest of MinesTotal SECL
Big MinesOther Mines
Mine
35

Table 2.2.7 (A) Departmental OBR MCL All Figurds in MM3
FY 21 FY 20 Growth M-o-M FY 21 FY 20 Growth
Y-o-YBhubaneswari Big 0.000 0.000 0.000 0.000Lakhanpur Big 0.131 0.262 -49.85 0.493 0.928 -46.93Bharatpur Big 0.269 0.150 0.862 0.499Lingaraj Big 0.140 0.185 -24.59 0.514 0.576 -10.71Samaleswari Big 0.058 0.135 -56.74 0.132 0.362 -63.54Kulda Big 0.006 0.000 0.028 0.000Kaniha Big 0.000 0.000 0.000 0.000Hingula Big 0.063 0.032 95.63 0.231 0.176 31.42Ananta Big 0.097 0.103 -5.63 0.390 0.345 13.16Jagannath Big 0.134 0.162 -17.16 0.485 0.503 -3.58Belpahar Big 0.078 0.078 -0.26 0.179 0.308 -42.01Lajkura Big 0.074 0.061 21.64 0.249 0.193 28.91Balram Big 0.125 0.174 -28.33 0.487 0.551 -11.63Basundhara (W) Others 0.030 0.014 114.29 0.068 0.081 -16.17Garjanbahal Big 0.156 0.085 83.65 0.513 0.336 52.65
1.331 1.427 -6.73 4.563 4.777 -4.480.030 0.014 114.29 0.068 0.081 -16.171.361 1.441 -5.55 4.631 4.858 -4.680.000 0.000 0.000 0.0001.361 1.441 -5.55 4.631 4.858 -4.67
Table 2.2.7 (B) Contractual OBR MCL
FY 21 FY 20 Growth M-o-M FY 21 FY 20 Growth
Y-o-YBhubaneswari Big 1.162 0.563 106.45 4.959 2.339 112.01Lakhanpur Big 2.353 1.457 61.52 10.088 5.517 82.84Bharatpur Big 0.029 0.660 -95.62 0.029 2.168 -98.67Lingaraj Big 0.959 0.836 14.71 3.288 2.510 31.01Samaleswari Big 0.660 0.152 334.14 2.307 0.897 157.20Kulda Big 1.249 0.529 136.12 4.496 1.826 146.20Kaniha Big 0.345 0.289 19.27 1.154 0.905 27.46Hingula Big 0.346 0.197 75.63 1.159 0.632 83.45Ananta Big 0.613 1.152 -46.83 2.336 3.449 -32.27Jagannath Big 0.220 0.000 0.671 0.000Belpahar Big 0.379 0.523 -27.59 1.287 1.470 -12.48Lajkura Big 0.422 0.610 -30.77 1.478 1.772 -16.59Balram Big 0.836 0.593 40.99 2.789 1.866 49.46Basundhara (W) Others 0.000 0.000 0.000 0.000Garjanbahal Big 0.242 0.000 1.187 0.000
9.815 7.561 29.81 37.227 25.351 46.850.000 0.000 0.000 0.0009.815 7.561 29.81 37.227 25.351 46.850.000 0.000 0.000 0.0009.815 7.561 29.81 37.227 25.351 46.85
MineOBR During June OBR Upto June
MineOBR During June OBR Upto June
Big MinesOther MinesBig Plus MinesRest of MinesTotal MCL
Big MinesOther Mines
Type
Type
Big Plus MinesRest of MinesTotal MCL
36
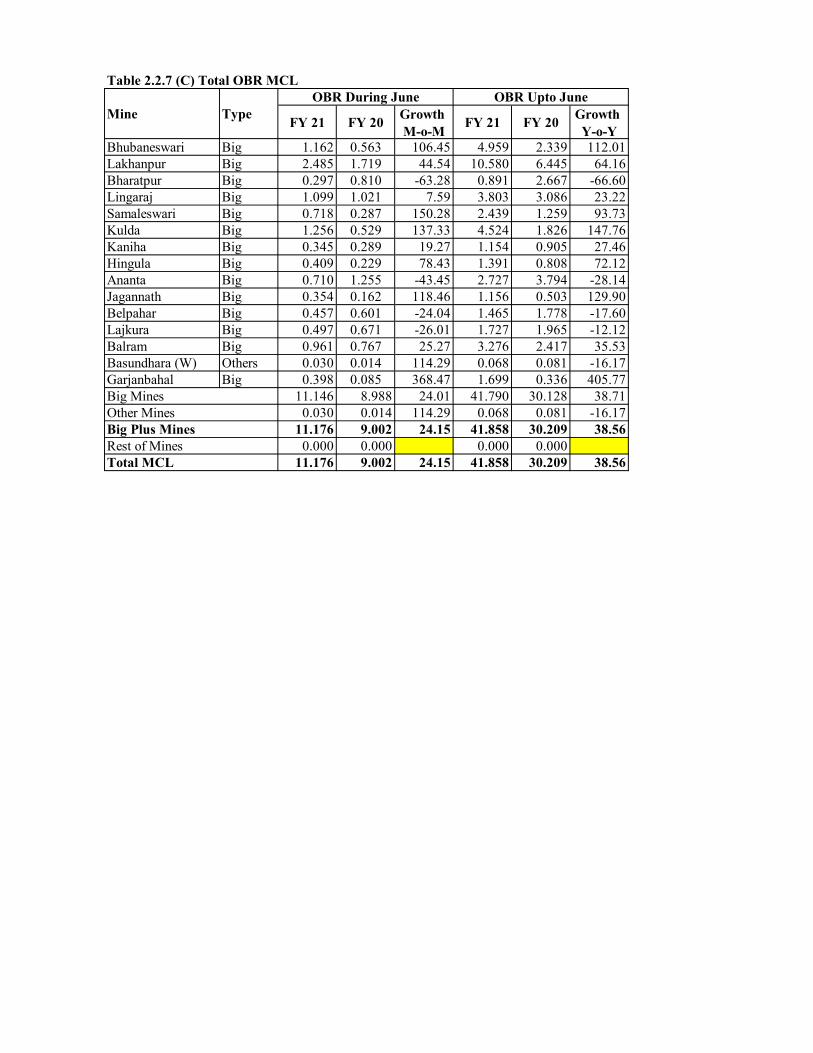
Table 2.2.7 (C) Total OBR MCL
FY 21 FY 20 Growth M-o-M FY 21 FY 20 Growth
Y-o-YBhubaneswari Big 1.162 0.563 106.45 4.959 2.339 112.01Lakhanpur Big 2.485 1.719 44.54 10.580 6.445 64.16Bharatpur Big 0.297 0.810 -63.28 0.891 2.667 -66.60Lingaraj Big 1.099 1.021 7.59 3.803 3.086 23.22Samaleswari Big 0.718 0.287 150.28 2.439 1.259 93.73Kulda Big 1.256 0.529 137.33 4.524 1.826 147.76Kaniha Big 0.345 0.289 19.27 1.154 0.905 27.46Hingula Big 0.409 0.229 78.43 1.391 0.808 72.12Ananta Big 0.710 1.255 -43.45 2.727 3.794 -28.14Jagannath Big 0.354 0.162 118.46 1.156 0.503 129.90Belpahar Big 0.457 0.601 -24.04 1.465 1.778 -17.60Lajkura Big 0.497 0.671 -26.01 1.727 1.965 -12.12Balram Big 0.961 0.767 25.27 3.276 2.417 35.53Basundhara (W) Others 0.030 0.014 114.29 0.068 0.081 -16.17Garjanbahal Big 0.398 0.085 368.47 1.699 0.336 405.77
11.146 8.988 24.01 41.790 30.128 38.710.030 0.014 114.29 0.068 0.081 -16.17
11.176 9.002 24.15 41.858 30.209 38.560.000 0.000 0.000 0.000
11.176 9.002 24.15 41.858 30.209 38.56
OBR During June OBR Upto JuneType
Big Plus MinesRest of MinesTotal MCL
Big MinesOther Mines
Mine
37
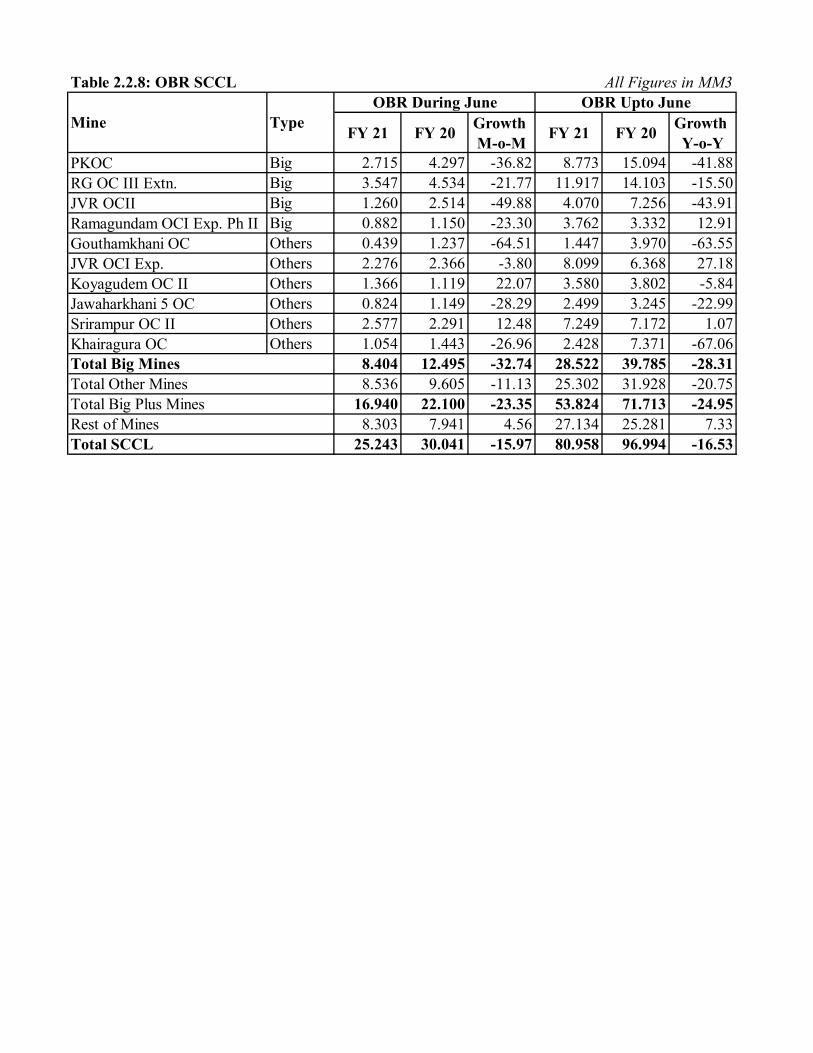
Table 2.2.8: OBR SCCL All Figures in MM3
FY 21 FY 20 Growth M-o-M FY 21 FY 20 Growth
Y-o-YPKOC Big 2.715 4.297 -36.82 8.773 15.094 -41.88RG OC III Extn. Big 3.547 4.534 -21.77 11.917 14.103 -15.50JVR OCII Big 1.260 2.514 -49.88 4.070 7.256 -43.91Ramagundam OCI Exp. Ph II Big 0.882 1.150 -23.30 3.762 3.332 12.91Gouthamkhani OC Others 0.439 1.237 -64.51 1.447 3.970 -63.55JVR OCI Exp. Others 2.276 2.366 -3.80 8.099 6.368 27.18Koyagudem OC II Others 1.366 1.119 22.07 3.580 3.802 -5.84Jawaharkhani 5 OC Others 0.824 1.149 -28.29 2.499 3.245 -22.99Srirampur OC II Others 2.577 2.291 12.48 7.249 7.172 1.07Khairagura OC Others 1.054 1.443 -26.96 2.428 7.371 -67.06
8.404 12.495 -32.74 28.522 39.785 -28.318.536 9.605 -11.13 25.302 31.928 -20.75
16.940 22.100 -23.35 53.824 71.713 -24.958.303 7.941 4.56 27.134 25.281 7.33
25.243 30.041 -15.97 80.958 96.994 -16.53Total SCCL
Mine TypeOBR During June OBR Upto June
Total Big MinesTotal Other MinesTotal Big Plus MinesRest of Mines
38

Exploration

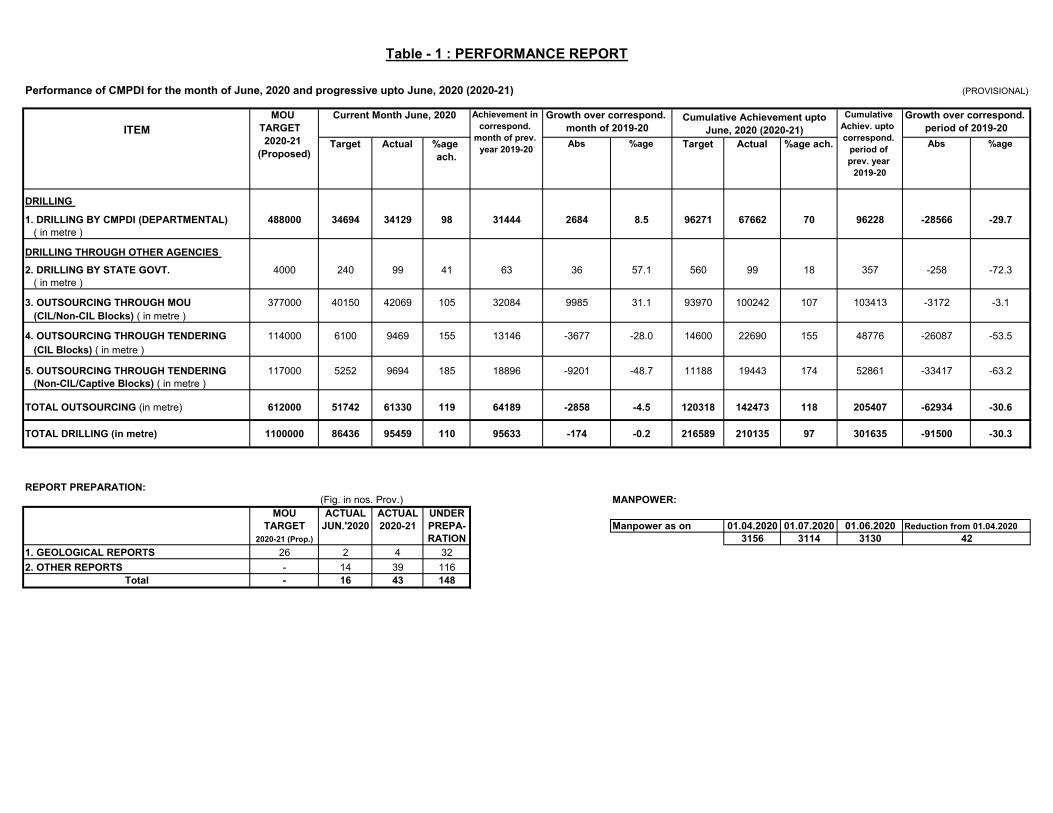
Table - 1 : PERFORMANCE REPORT
Performance of CMPDI for the month of June, 2020 and progressive upto June, 2020 (2020-21) (PROVISIONAL)
ITEM
DRILLING
1. DRILLING BY CMPDI (DEPARTMENTAL) 488000 34694 34129 98 31444 2684 8.5 96271 67662 70 96228 -28566 -29.7 ( in metre )
DRILLING THROUGH OTHER AGENCIES 2. DRILLING BY STATE GOVT. 4000 240 99 41 63 36 57.1 560 99 18 357 -258 -72.3 ( in metre )
3. OUTSOURCING THROUGH MOU 377000 40150 42069 105 32084 9985 31.1 93970 100242 107 103413 -3172 -3.1 (CIL/Non-CIL Blocks) ( in metre )
4. OUTSOURCING THROUGH TENDERING 114000 6100 9469 155 13146 -3677 -28.0 14600 22690 155 48776 -26087 -53.5 (CIL Blocks) ( in metre )
5. OUTSOURCING THROUGH TENDERING 117000 5252 9694 185 18896 -9201 -48.7 11188 19443 174 52861 -33417 -63.2 (Non-CIL/Captive Blocks) ( in metre )
TOTAL OUTSOURCING (in metre) 612000 51742 61330 119 64189 -2858 -4.5 120318 142473 118 205407 -62934 -30.6
TOTAL DRILLING (in metre) 1100000 86436 95459 110 95633 -174 -0.2 216589 210135 97 301635 -91500 -30.3
REPORT PREPARATION:(Fig. in nos. Prov.) MANPOWER:
MOU ACTUAL ACTUAL UNDERTARGET JUN.'2020 2020-21 PREPA- Manpower as on 01.04.2020 01.07.2020 01.06.2020 Reduction from 01.04.2020
2020-21 (Prop.) RATION 3156 3114 31301. GEOLOGICAL REPORTS 26 2 4 322. OTHER REPORTS - 14 39 116101Total - 16 43 148
42
%age ach.Target ActualAbs %age
MOU TARGET 2020-21
(Proposed)
Cumulative Achievement upto June, 2020 (2020-21)
Cumulative Achiev. upto correspond.
period of prev. year
2019-20
Growth over correspond. period of 2019-20Abs %age
Current Month June, 2020 Achievement in correspond.
month of prev. year 2019-20
Growth over correspond. month of 2019-20
Target Actual %age ach.
39

3.3 Status of 2D/3D Seismic Survey:
CMPDI has taken up 2D seismic survey on large scale and data acquisition with depth
range about 1000 metre. Data acquisition for North of Piparwar PH-II block (20.68 sq
km), NKCF with Paradigm Software (High speed seismic data processing) has been
completed and Interim Report submitted. In addition to this, data acquisition in 2 blocks
i.e. Northern Part of North of Arkhapal, Talcher CF & Nigwani-Bakeli-A, Sohagpur CF
was taken up during 2019-20, but could not be completed due to COVID-19 lock down.
As per Directives of Ministry of Coal dated 14.05.2020, all tenders published earlier for
G1 level exploration was withdrawn. Fresh tenders, on the basis of 2 boreholes per sq km
for G2 level exploration, are re-assessed for re-tendering. Revised Timelines for tender
publication are as given below:
Phase-I: 2 Blocks (2D Seismic) - By 04.06.2020 (Tender uploaded)
Phase-II: 2 Blocks (2D/3D Seismic) - By 08.06.2020 (Tender uploaded)
Phase-III: 2 Blocks (3D Seismic) - By 11.06.2020 (Tender uploaded)
Phase-IV: 2 Blocks (3D Seismic) - By 16.06.2020 (Tender uploaded)
Phase-V: 2 Blocks (3D Seismic) - By 31.08.2020
Phase-VI: 2 Blocks (3D Seismic) - By 15.09.2020
3.4: Performance of CBM Projects
Commercial Development of CBM in CIL Area:Govt. of India, MoP&NG, vide
notification dated 8th May, 2018 has issued modified guidelines for exploration and
exploitation of CBM by CIL and its subsidiaries from coal bearing areas for which
they poses mining lease which is the partial modification of CBM Policy, 1997 and
earlier guidelines issued in Nov, 2015 by MoP&NG.
Model Global Bid Document {Notice Inviting Offer (NIO) & Model Revenue
Sharing Contract (MRSC)} for selection of CBM Developer through Global Bidding
has also been approved by the CIL Board on 16th Apr’20.
Memorandum of Agreement (MoA) on Operationalization of CBM Project(s) has
been approved by ECL, BCCL & CMPDI Boards. Accordingly, CMPDI is the
Principal Implementing Agency (PIA) for ECL and BCCL for Development of CBM
in their Leasehold areas.
MoA has been signed between ECL & CMPDI on 8th May’20 and with BCCL &
CMPDI on 9th May’20. Work Order has also been issued to CMPDI by BCCL for
Jharia CBM Block – I on 13th May’20 and by ECL for Raniganj CBM Block on 14th
May’20 for Selection of CBM Developer and all related activities.
NIT has been published by CMPDI on 15th May, 2020 for Selection of CBM
Developer (CBMD) through Global tendering for (i) Jharia CBM Block I (BCCL
Leasehold) and (ii) Raniganj CBM Block (ECL Leasehold). Last date for Bid
40

Submission in 20th July’20. Pre-BID Meeting was held on 1st June’20 through VC in
which potential bidders from India and abroad participated in good number.
CIL has envisaged to produce CBM of ~1 MMSCMD in 2023-24 from following
three CIL CBM blocks:
Steps have also been taken up by CMPDI for identification of additional CBM blocks
within CIL leasehold of CCL and BCCL command areas.
Sl. Block Subsidiary CBM
Resource
(BCM)
Present Status
1. Jharia CBM Block -
I
BCCL 25.22 BCM NIT has been published on 15th
May’2020 for Selection of CBM
Developer (CBMD) through Global
tendering for the development of
delineated CBM blocks. Due date
for submission of offer is 20th
July’2020.
2. Raniganj CBM
Block
ECL 3.93 BCM
3. Shohagpur CBM
Block
SECL 1.07 BCM PFR is under preparation.
41

Performance of Coal PSUs


Summary of Performance of Coal Companies Month June'2020Table 4.1: Production Status (i) Underground Production All figures in MTSubs Historical Production Status Growth
Target Actual Achievement June'2019 Upto June'2019 Upto June'2020 M-O-M Y-O-YECL 0.68 0.71 103.68 0.74 2.34 2.48 -4.86 5.98BCCL 0.10 0.04 37.00 0.08 0.26 0.12 -54.32 -53.85CCL 0.04 0.07 162.50 0.05 0.13 0.18 27.45 38.46NCLWCL 0.36 0.31 87.22 0.33 1.05 0.93 -5.99 -11.43SECL 1.11 0.98 88.56 1.16 3.53 2.92 -15.04 -17.28MCL 0.07 0.05 75.71 0.07 0.21 0.13 -22.06 -38.10NECCIL 2.36 2.16 91.40 2.43 7.52 6.76 -11.31 -10.11SCCL 0.643 0.447 69.51 0.682 2.111 0.696 -34.47 -67.05Total 3.00 2.60 86.71 3.11 9.63 7.46 -16.38 -22.59
(iia) Open Cast Production- Departmental All figures in MTSubs Historical Production Status Growth
Target Actual Achievement June'2019 Upto June'2019 Upto June'2020 M-O-M Y-O-YECL 0.61 0.51 83.61 0.73 2.37 1.70 -30.14 -28.27BCCL 0.55 0.39 70.91 0.57 2.01 1.29 -31.58 -35.82CCL 0.82 0.54 65.85 1.25 3.29 1.68 -56.80 -48.94NCL 9.06 8.55 94.37 8.63 26.22 26.48 -0.93 0.99WCL 1.85 1.55 83.78 1.83 6.06 5.48 -15.30 -9.57SECL 0.91 0.76 2.75 2.22 19.74 -19.27MCL 3.04 2.38 78.29 2.84 8.59 7.25 -16.20 -15.60NECCIL 15.93 14.83 93.09 16.61 51.29 46.10 -10.72 -10.12SCCL 4.507 2.281 50.60 4.496 13.172 7.015 -49.27 -46.74Total 20.44 17.11 83.72 21.11 64.46 53.12 -18.93 -17.60
Production During June 2020
Production During June 2020
42

(iib) Open Cast Production - Contractual All figures in MTSubs Historical Production Status Growth
Target Actual Achievement June'2019 Upto June'2019 Upto June'2020 M-O-M Y-O-YECL 2.31 2.00 86.58 2.12 6.83 5.88 -5.66 -13.91BCCL 1.45 1.14 78.62 1.43 4.21 3.41 -20.28 -19.00CCL 3.34 2.77 82.93 3.01 8.21 6.68 -7.97 -18.64NCLWCL 1.38 1.16 68.62 1.42 4.80 4.00 -18.31 -16.67SECL 10.23 7.02 91.55 9.41 28.06 22.22 -25.40 -20.81MCL 8.88 8.13 91.55 8.49 25.97 25.93 -4.24 -0.15NECCIL 27.59 22.22 80.54 25.88 78.08 68.12 -14.14 -12.76SCCL 0.000 0.546 0.534 1.803 1.791 2.31 -0.66Total 27.59 22.77 82.52 26.41 79.88 69.91 -13.81 -12.48
(ii) Open Cast Production All figures in MTSubs Historical Production Status Growth
Target Actual Achievement June'2019 Upto June'2019 Upto June'2020 M-O-M Y-O-YECL 2.92 2.51 85.96 2.85 9.20 7.58 -11.93 -17.61BCCL 2.00 1.53 76.50 2.00 6.22 4.70 -23.50 -24.44CCL 4.16 3.31 79.57 4.26 11.50 8.36 -22.30 -27.30NCL 9.06 8.55 94.37 8.63 26.22 26.48 -0.93 0.99WCL 3.23 2.71 83.90 3.25 10.86 9.48 -16.62 -12.71SECL 10.23 7.93 77.52 10.17 30.81 24.44 -22.03 -20.68MCL 11.92 10.51 88.17 11.33 34.56 33.18 -7.24 -3.99NECCIL 43.52 37.05 85.13 42.49 129.37 114.22 -12.80 -11.71SCCL 4.51 2.83 62.73 5.03 14.97 8.81 -43.79 -41.19Total 48.03 39.88 83.03 47.52 144.34 123.03 -16.08 -14.77
Production During June 2020
Production During June 2020
43

(iii) Total Coal Production All figures in MTSubs Historical Production Status Growth
Target Actual Achievement June'2019 Upto June'2019 Upto June'2020 M-O-M Y-O-YECL 3.60 3.24 89.86 3.59 11.53 10.06 -9.91 -12.75BCCL 2.10 1.57 74.62 2.08 6.47 4.83 -24.70 -25.35CCL 4.20 3.37 80.12 4.32 11.64 8.54 -22.12 -26.63NCL 9.06 8.54 94.26 8.63 26.22 26.47 -1.04 0.95WCL 3.59 3.02 84.23 3.58 11.91 10.41 -15.63 -12.59SECL 11.34 8.93 78.77 11.33 34.33 27.38 -21.14 -20.24MCL 11.99 10.56 88.10 11.40 34.78 33.31 -7.33 -4.23NEC 0.00 0.02 0.07 0.04CIL 45.88 39.23 85.50 44.95 136.95 121.04 -12.74 -11.62SCCL 5.15 3.27 63.57 5.71 17.08 9.50 -42.68 -44.35Total 51.03 42.50 83.29 50.66 154.03 130.54 -16.11 -15.25
Production During June 2020
44
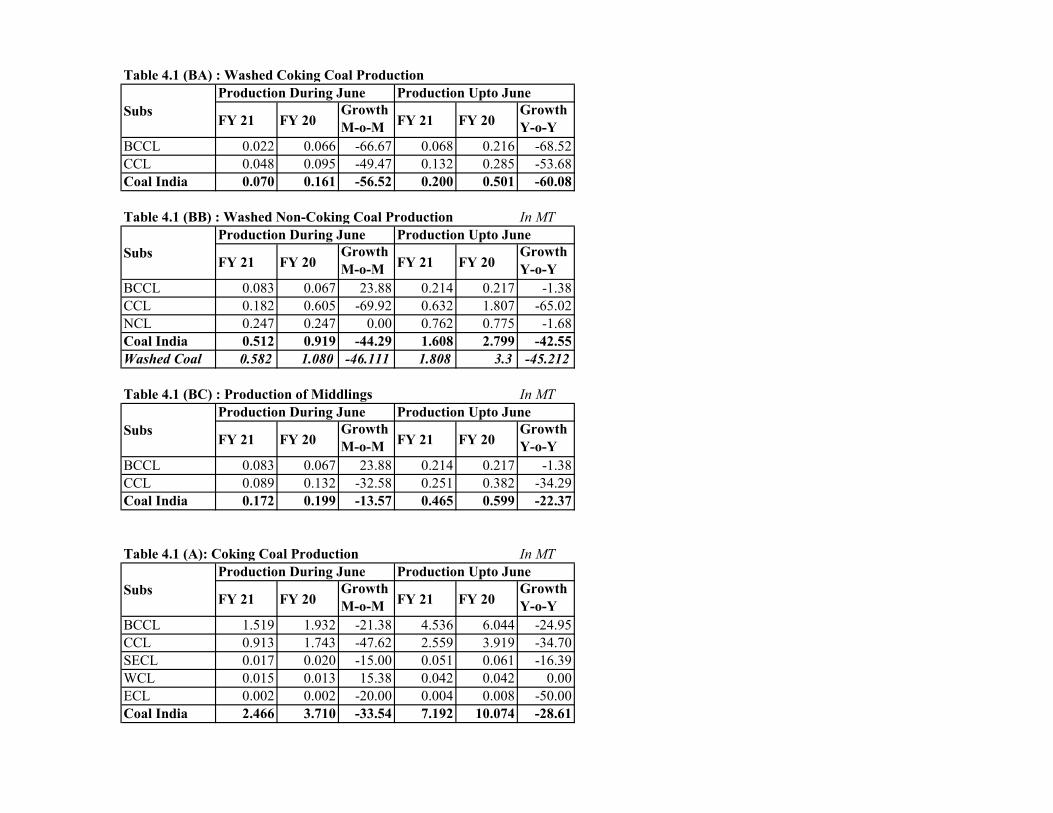
Table 4.1 (BA) : Washed Coking Coal Production
FY 21 FY 20Growth M-o-M FY 21 FY 20
Growth Y-o-Y
BCCL 0.022 0.066 -66.67 0.068 0.216 -68.52CCL 0.048 0.095 -49.47 0.132 0.285 -53.68Coal India 0.070 0.161 -56.52 0.200 0.501 -60.08
Table 4.1 (BB) : Washed Non-Coking Coal Production In MT
FY 21 FY 20Growth M-o-M FY 21 FY 20
Growth Y-o-Y
BCCL 0.083 0.067 23.88 0.214 0.217 -1.38CCL 0.182 0.605 -69.92 0.632 1.807 -65.02NCL 0.247 0.247 0.00 0.762 0.775 -1.68Coal India 0.512 0.919 -44.29 1.608 2.799 -42.55Washed Coal 0.582 1.080 -46.111 1.808 3.3 -45.212
Table 4.1 (BC) : Production of Middlings In MT
FY 21 FY 20Growth M-o-M FY 21 FY 20
Growth Y-o-Y
BCCL 0.083 0.067 23.88 0.214 0.217 -1.38CCL 0.089 0.132 -32.58 0.251 0.382 -34.29Coal India 0.172 0.199 -13.57 0.465 0.599 -22.37
Table 4.1 (A): Coking Coal Production In MT
FY 21 FY 20Growth M-o-M FY 21 FY 20
Growth Y-o-Y
BCCL 1.519 1.932 -21.38 4.536 6.044 -24.95CCL 0.913 1.743 -47.62 2.559 3.919 -34.70SECL 0.017 0.020 -15.00 0.051 0.061 -16.39WCL 0.015 0.013 15.38 0.042 0.042 0.00ECL 0.002 0.002 -20.00 0.004 0.008 -50.00Coal India 2.466 3.710 -33.54 7.192 10.074 -28.61
SubsProduction During June Production Upto June
SubsProduction During June Production Upto June
SubsProduction During June Production Upto June
SubsProduction During June Production Upto June
45

Table 4.2: Productivity(OMS) in Te (i) Underground Mines
Target Actual Achievement June'2019 Upto June'2019 Upto June'2020 M-O-M Y-O-YECL 0.79 0.75 95.43 0.80 0.83 0.87 -6.35 4.09BCCL 0.33 0.10 30.30 0.23 0.23 0.11 -56.52 -52.17CCL 0.46 0.65 141.30 0.50 0.43 0.60 30.00 39.53NCLWCL 1.03 0.96 93.20 0.95 0.95 0.94 1.05 -1.05SECL 1.77 1.51 85.31 1.78 1.65 1.41 -15.17 -14.55MCL 0.72 0.77 106.94 0.83 0.84 0.59 -7.23 -29.76NECSCCL 1.21 0.96 79.34 1.35 1.37 0.81 -28.89 -40.88
(ii) Open Cast Mines
Target Actual Achievement June'2019 Upto June'2019 Upto June'2020 M-O-M Y-O-YECL 15.52 13.29 85.63 14.83 15.63 12.96 -10.42 -17.11BCCL 7.79 7.39 94.87 5.09 6.58 7.10 45.19 7.90CCL 8.44 7.07 83.77 8.32 8.22 6.21 -15.02 -24.45NCL 0.00 22.25 25.27 25.02 24.97 -11.95 -0.20WCL 2.77 2.36 85.20 3.69 4.06 3.05 -36.04 -24.88SECL 37.25 27.88 74.85 26.02 29.12 33.78 7.15 16.00MCL 36.56 33.51 91.66 26.16 27.08 31.05 28.10 14.66NECSCCL 15.91 10.87 68.32 18.35 18.58 11.58 -40.76 -37.67
Subs
Subs
OMS During June 2020
OMS During June 2020 Historical OMS Status Growth
Historical OMS Status Growth
46
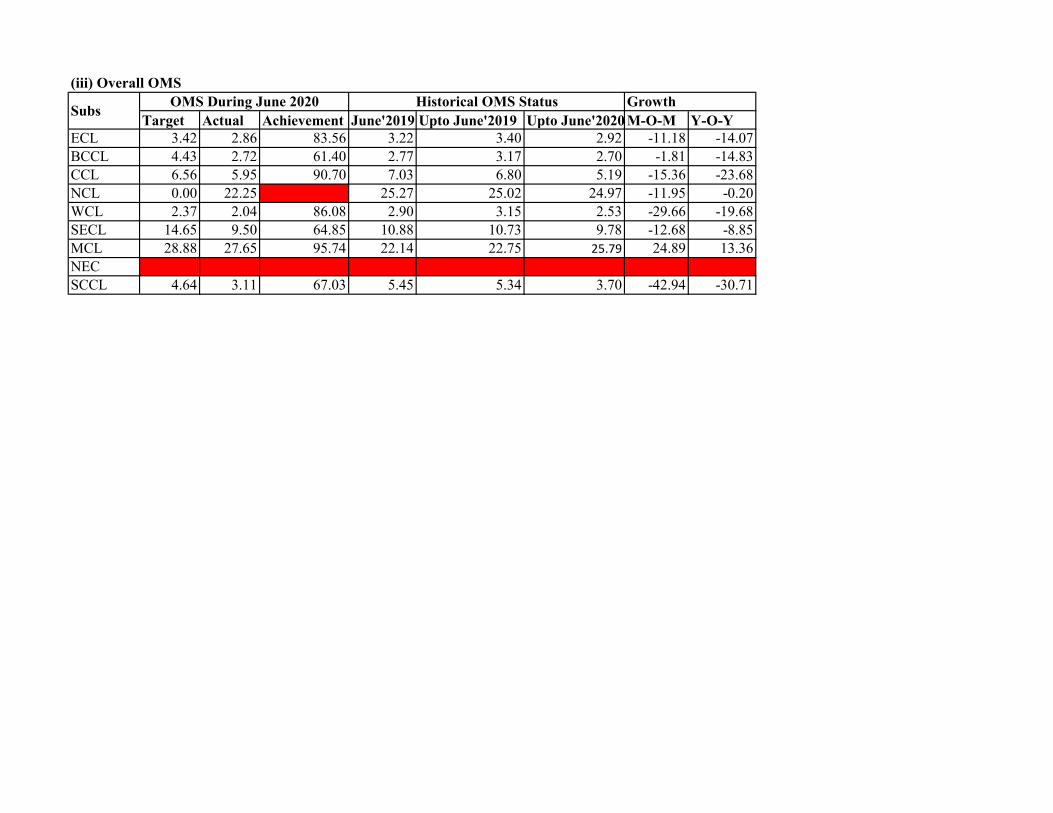
(iii) Overall OMS
Target Actual Achievement June'2019 Upto June'2019 Upto June'2020 M-O-M Y-O-YECL 3.42 2.86 83.56 3.22 3.40 2.92 -11.18 -14.07BCCL 4.43 2.72 61.40 2.77 3.17 2.70 -1.81 -14.83CCL 6.56 5.95 90.70 7.03 6.80 5.19 -15.36 -23.68NCL 0.00 22.25 25.27 25.02 24.97 -11.95 -0.20WCL 2.37 2.04 86.08 2.90 3.15 2.53 -29.66 -19.68SECL 14.65 9.50 64.85 10.88 10.73 9.78 -12.68 -8.85MCL 28.88 27.65 95.74 22.14 22.75 25.79 24.89 13.36NECSCCL 4.64 3.11 67.03 5.45 5.34 3.70 -42.94 -30.71
Subs OMS During June 2020 Historical OMS Status Growth
47

Table 4.3: OBR (i) Departmental OBR
Target Actual Achievement June'2019 Upto June'2019 Upto June'2020 M-O-M Y-O-YECL 2.22 2.05 92.34 1.81 5.82 6.79 13.26 16.67BCCL 2.11 1.61 76.30 1.46 4.31 4.66 10.27 8.12CCL 3.20 3.62 113.13 2.92 9.15 10.68 23.97 16.72NCL 7.05 6.61 93.76 6.60 20.75 21.05 0.15 1.45WCL 3.48 3.50 100.57 3.79 12.45 12.17 -7.65 -2.25SECL 8.55 6.17 72.16 6.17 20.20 19.48 0.00 -3.56MCL 2.93 1.36 46.42 1.44 4.86 4.63 -5.56 -4.73NECCIL 29.54 24.92 84.36 24.19 77.54 79.46 3.02 2.48SCCL 5.655 4.126 72.95 5.742 17.539 14.463 -28.15 -17.54Total 35.20 29.05 82.53 29.93 95.08 93.92 -2.96 -1.22
(ii) Contractual OBR
Target Actual Achievement June'2019 Upto June'2019 Upto June'2020 M-O-M Y-O-YECL 8.93 8.01 89.70 9.65 29.34 28.67 -16.99 -2.28BCCL 9.79 6.64 67.82 5.26 17.79 20.54 26.24 15.46CCL 6.80 4.73 69.56 6.00 17.16 16.24 -21.17 -5.36NCL 23.45 21.03 89.68 20.12 62.18 69.27 4.52 11.40WCL 16.48 11.75 71.30 13.25 45.24 49.96 -11.32 10.43SECL 15.70 7.91 50.38 7.49 25.50 28.65 5.61 12.35MCL 10.61 9.81 92.46 7.56 25.35 37.21 29.76 46.79NECCIL 91.76 69.88 76.16 69.33 222.56 250.54 0.79 12.57SCCL 28.850 20.869 72.34 24.136 78.074 66.247 -13.53 -15.15Total 120.61 90.75 75.24 93.47 300.63 316.79 -2.91 5.37
All figures in MM3
Subs OBR During June 2020 Historical OBR Status Growth
All figures in MM3
Subs OBR During June 2020 Historical OBR Status Growth
48
(iii) Total OBR
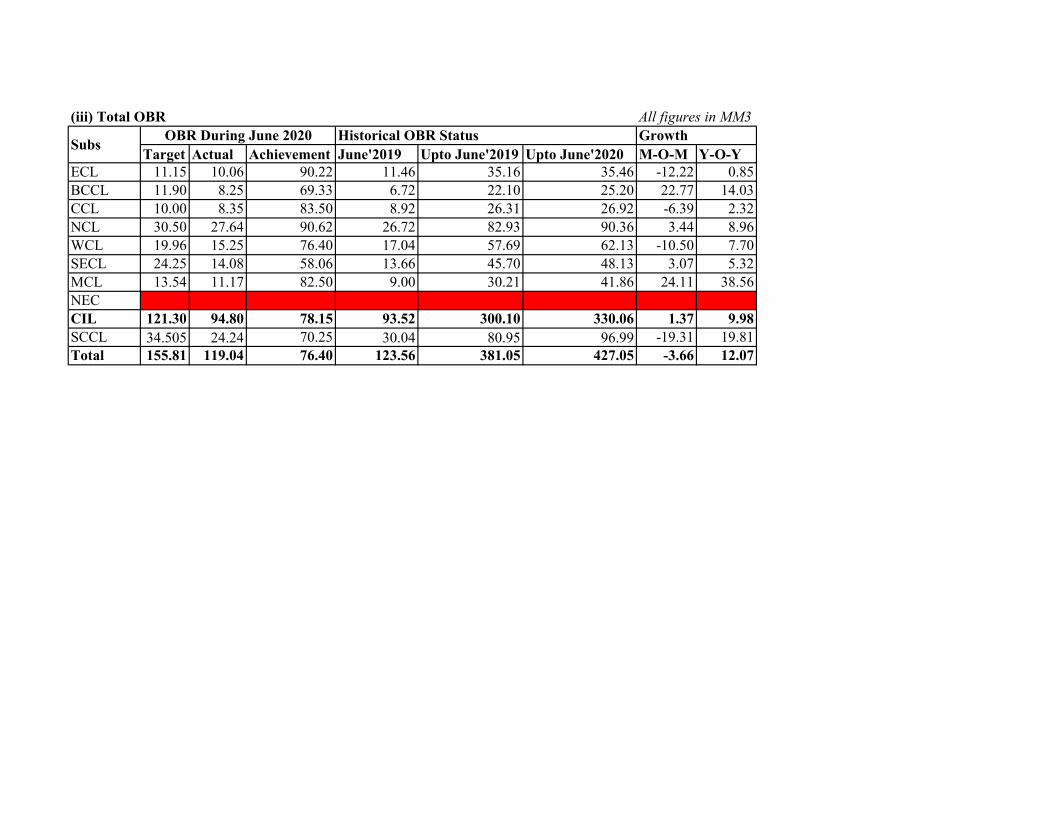
Target Actual Achievement June'2019 Upto June'2019 Upto June'2020 M-O-M Y-O-YECL 11.15 10.06 90.22 11.46 35.16 35.46 -12.22 0.85BCCL 11.90 8.25 69.33 6.72 22.10 25.20 22.77 14.03CCL 10.00 8.35 83.50 8.92 26.31 26.92 -6.39 2.32NCL 30.50 27.64 90.62 26.72 82.93 90.36 3.44 8.96WCL 19.96 15.25 76.40 17.04 57.69 62.13 -10.50 7.70SECL 24.25 14.08 58.06 13.66 45.70 48.13 3.07 5.32MCL 13.54 11.17 82.50 9.00 30.21 41.86 24.11 38.56NECCIL 121.30 94.80 78.15 93.52 300.10 330.06 1.37 9.98SCCL 34.505 24.24 70.25 30.04 80.95 96.99 -19.31 19.81Total 155.81 119.04 76.40 123.56 381.05 427.05 -3.66 12.07
Historical OBR Status GrowthAll figures in MM3
Subs OBR During June 2020
49

Table 4.4 : Subsidiary-wise HEMM Utilisation
Availability Utilisation Availability Utilisation Availability Utilisation Availability Utilisation Availability Utilisation
ECL 1 92.07 85.08 76.48 71.91 81.27 75.50 91.94 84.10 10.67 8.6BCCL 2 57 7 84 22 84 21 50 1 -34 -20CCLNCL 23 79.26 71.09 81.08 67.73 80.27 70.2 80.78 73.34 0.51 3.14WCL 2 66.1 47.5 84.8 75.8 85.2 69.8 79.4 55.4 -5.8 -14.4SECL 4 61 57 67 54 76 64 70 63 -6 -1MCL 1 0 0 100 0 100 0 0 0 -100 0SCCL 1 85 75 76 62 70 51 69 53 -100 0
Availability Utilisation Availability Utilisation Availability Utilisation Availability Utilisation Availability UtilisationECL 61 81.18 44.24 79.56 45.36 80.88 45.96 80.20 43.15 -0.68 -2.81BCCL 103 75 45 68 38 72 40 73 45 1 5CCL 95 79 49 77 44 76 41 76 46 0 5NCL 116 73.1 40.7 74.94 40.09 73.71 39.82 72.65 42.05 -1.06 2.23WCL 141 78.6 38.5 79.5 40.9 78.7 41.8 76.4 39.7 -2.3 -2.1SECL 81 74 41 74 39 75 40 70 41 -5 1MCL 61 69 29 70 25 68 27 73 31 5 4SCCL 67 83 51 86 59 87 59 84 53 -3 -6
(i) Dragline
SubsNo of Units
Actual Status during June 2020 (in % )
Actual Status during June 2019 (in % )
Actual Status upto June 2019 (in % )
Actual Status upto June 2020 (in % ) Progressive Growth
(ii) Shovel
Subs No of Units
Actual Status during June 2020 (in % )
Actual Status during June 2019 (in % ) Progressive GrowthActual Status upto June
2019 (in % )Actual Status upto June 2020 (in % )
50

Availability Utilisation Availability Utilisation Availability Utilisation Availability Utilisation Availability UtilisationECLBCCLCCLNCL 4 92.75 57.5 94.96 66.48 94.1 61.31 93.43 57.94 -0.67 -3.37WCLSECLMCL 17 86 46 87 41 83 41 87 46 4 5SCCL
Availability Utilisation Availability Utilisation Availability Utilisation Availability Utilisation Availability UtilisationECL 236 76.48 36.19 74.45 30.60 75.52 31.67 75.17 38.84 -0.35 7.17BCCL 448 67 27 69 28 69 27 65 27 -4 0CCL 356 73 40 71 37 71 34 73 38 2 4NCL 543 68.45 47.49 70.89 44.19 70.39 43.12 69.1 48.45 -1.29 5.33WCL 402 75.5 35.5 75.3 36.4 77.5 38 75.7 38.8 -1.8 0.8SECL 438 85 32 82 38 82 36 84 34 2 -2MCL 257 82 23 74 20 75 20 81 24 6 4SCCL 502 84 31 83 37 84 39 84 34 0 -5
Availability Utilisation Availability Utilisation Availability Utilisation Availability Utilisation Availability UtilisationECL 81 79.35 25.08 78.85 19.83 76.03 20.06 77.52 24.43 1.49 4.37BCCL 108 68 14 61 15 60 16 67 15 7 -1CCL 165 76 19 77 20 80 19 77 18 -3 -1NCL 173 68.34 30.5 67.15 23.15 69.25 22.39 64 28.71 -5.25 6.32WCL 152 76.7 26 74.1 26.4 74.3 26 76.8 26.1 2.5 0.1SECL 163 62 31 72 31 72 30 66 32 -6 2MCL 135 75 23 71 26 70 26 73 24 3 -2SCCL 113 75 26 79 27 77 26 75 28 -2 2
(iii) Surface Miner
Subs No of Units
Actual Status during June 2020 (in % )
Actual Status during June 2019 (in % )
Actual Status upto June 2019 (in % )
Actual Status upto June 2020 (in % ) Progressive Growth
(iv) Dumper
SubsActual Status during June 2020 (in % )
Actual Status during June 2019 (in % )
Actual Status upto June 2019 (in % )
Actual Status upto June 2020 (in % ) Progressive Growth
No of Units
Actual Status upto June 2020 (in % ) Progressive GrowthActual Status upto June
2019 (in % )
(v) Dozer
Subs No of Units
Actual Status during June 2020 (in % )
Actual Status during June 2019 (in % )
51

Availability Utilisation Availability Utilisation Availability Utilisation Availability Utilisation Availability UtilisationECL 50 86.80 19.48 82.06 18.47 84.71 17.98 83.53 19.75 -1.18 1.77BCCL 82 63 25 66 15 65 15 63 24 -2 9CCL 118 89 22 87 18 88 19 86 22 -2 3NCL 138 85.09 17.67 82.96 17.86 84.64 18.32 84.72 18.29 0.08 -0.03WCL 78 88.4 16.7 90.3 17.3 90 17.9 88.5 17.8 -1.5 -0.1SECL 112 89 23 90 24 89 23 89 24 0 1MCL 81 79 14 75 15 80 16 79 15 -1 -1SCCL 61 76 23 81 27 80 28 76 25 -4 -3
(vi) Drill
Subs No of Units
Actual Status during June 2020 (in % )
Actual Status during June 2019 (in % )
Actual Status upto June 2019 (in % )
Actual Status upto June 2020 (in % ) Progressive Growth
52
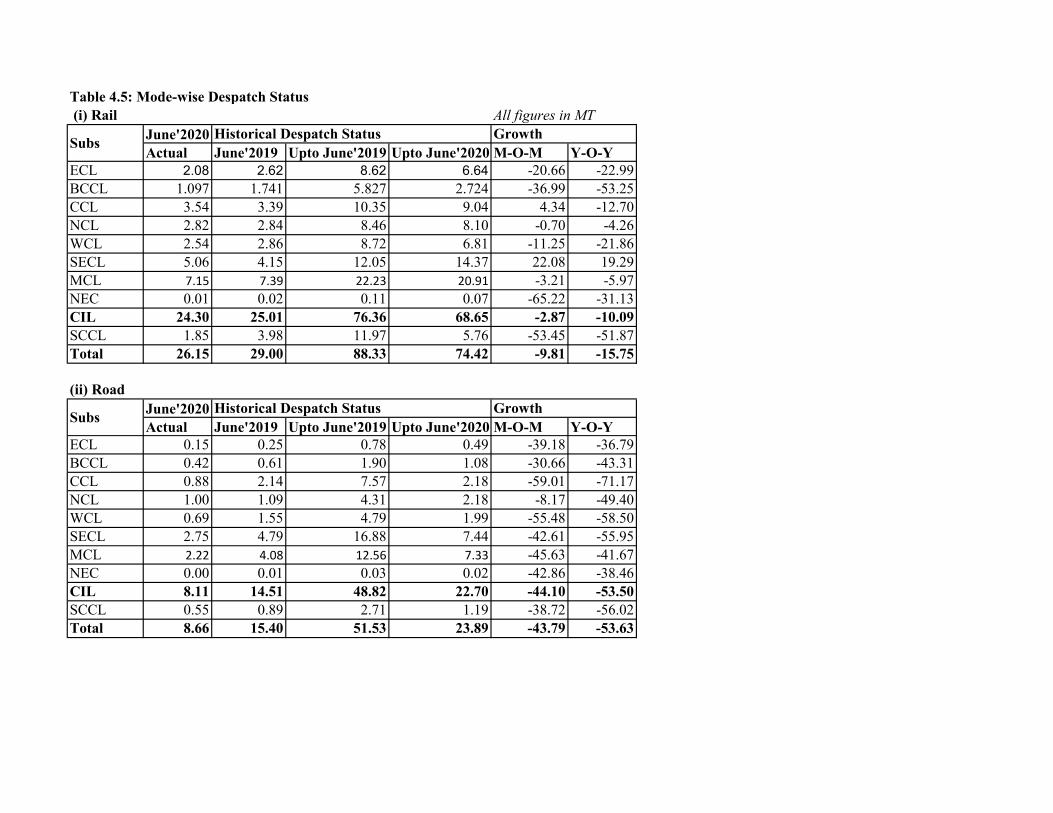
Table 4.5: Mode-wise Despatch Status (i) Rail
June'2020Actual June'2019 Upto June'2019 Upto June'2020 M-O-M Y-O-Y
ECL 2.08 2.62 8.62 6.64 -20.66 -22.99BCCL 1.097 1.741 5.827 2.724 -36.99 -53.25CCL 3.54 3.39 10.35 9.04 4.34 -12.70NCL 2.82 2.84 8.46 8.10 -0.70 -4.26WCL 2.54 2.86 8.72 6.81 -11.25 -21.86SECL 5.06 4.15 12.05 14.37 22.08 19.29MCL 7.15 7.39 22.23 20.91 -3.21 -5.97NEC 0.01 0.02 0.11 0.07 -65.22 -31.13CIL 24.30 25.01 76.36 68.65 -2.87 -10.09SCCL 1.85 3.98 11.97 5.76 -53.45 -51.87Total 26.15 29.00 88.33 74.42 -9.81 -15.75
(ii) RoadJune'2020Actual June'2019 Upto June'2019 Upto June'2020 M-O-M Y-O-Y
ECL 0.15 0.25 0.78 0.49 -39.18 -36.79BCCL 0.42 0.61 1.90 1.08 -30.66 -43.31CCL 0.88 2.14 7.57 2.18 -59.01 -71.17NCL 1.00 1.09 4.31 2.18 -8.17 -49.40WCL 0.69 1.55 4.79 1.99 -55.48 -58.50SECL 2.75 4.79 16.88 7.44 -42.61 -55.95MCL 2.22 4.08 12.56 7.33 -45.63 -41.67NEC 0.00 0.01 0.03 0.02 -42.86 -38.46CIL 8.11 14.51 48.82 22.70 -44.10 -53.50SCCL 0.55 0.89 2.71 1.19 -38.72 -56.02Total 8.66 15.40 51.53 23.89 -43.79 -53.63
All figures in MT
Subs Historical Despatch Status Growth
Subs Historical Despatch Status Growth
53
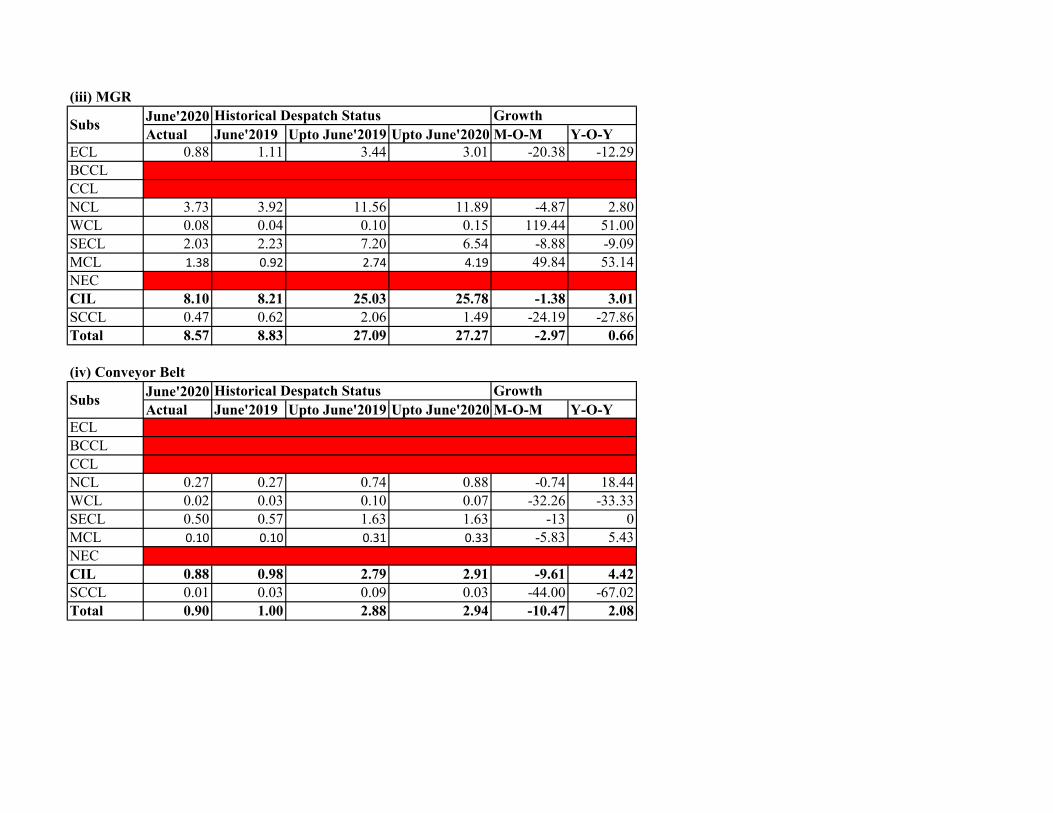
(iii) MGRJune'2020Actual June'2019 Upto June'2019 Upto June'2020 M-O-M Y-O-Y
ECL 0.88 1.11 3.44 3.01 -20.38 -12.29BCCLCCLNCL 3.73 3.92 11.56 11.89 -4.87 2.80WCL 0.08 0.04 0.10 0.15 119.44 51.00SECL 2.03 2.23 7.20 6.54 -8.88 -9.09MCL 1.38 0.92 2.74 4.19 49.84 53.14NECCIL 8.10 8.21 25.03 25.78 -1.38 3.01SCCL 0.47 0.62 2.06 1.49 -24.19 -27.86Total 8.57 8.83 27.09 27.27 -2.97 0.66
(iv) Conveyor BeltJune'2020Actual June'2019 Upto June'2019 Upto June'2020 M-O-M Y-O-Y
ECLBCCLCCLNCL 0.27 0.27 0.74 0.88 -0.74 18.44WCL 0.02 0.03 0.10 0.07 -32.26 -33.33SECL 0.50 0.57 1.63 1.63 -13 0MCL 0.10 0.10 0.31 0.33 -5.83 5.43NECCIL 0.88 0.98 2.79 2.91 -9.61 4.42SCCL 0.01 0.03 0.09 0.03 -44.00 -67.02Total 0.90 1.00 2.88 2.94 -10.47 2.08
Subs Historical Despatch Status Growth
Subs GrowthHistorical Despatch Status
54
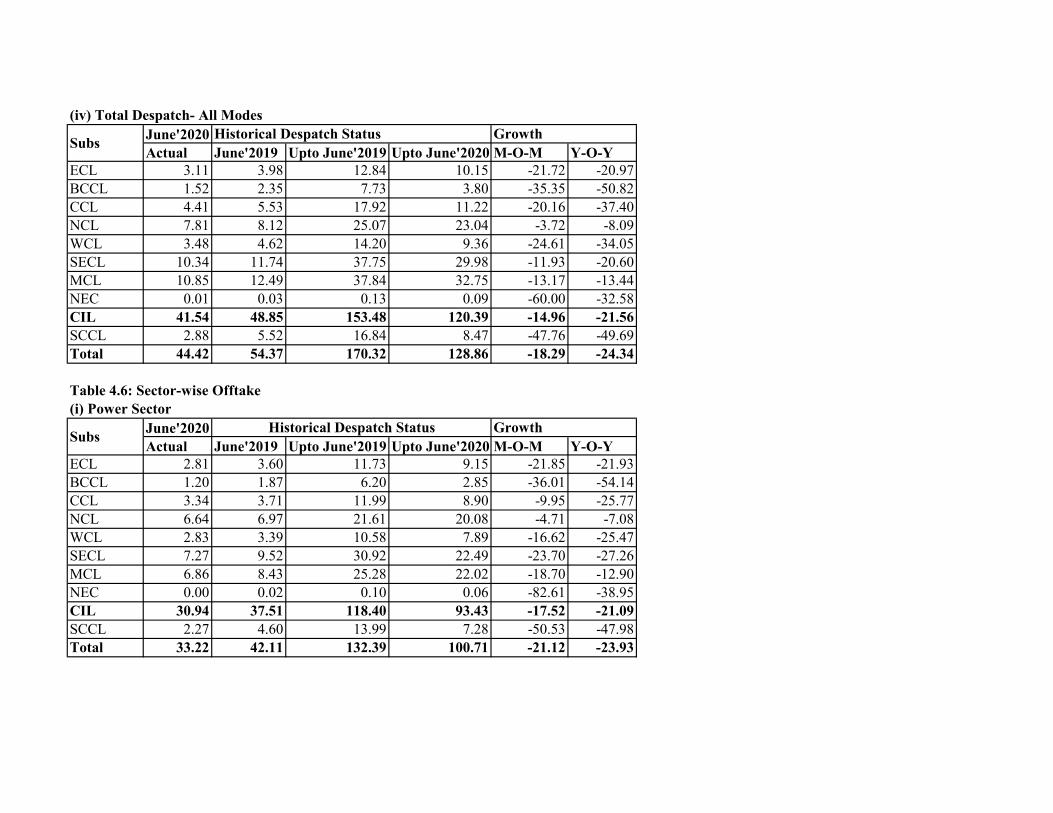
(iv) Total Despatch- All ModesJune'2020Actual June'2019 Upto June'2019 Upto June'2020 M-O-M Y-O-Y
ECL 3.11 3.98 12.84 10.15 -21.72 -20.97BCCL 1.52 2.35 7.73 3.80 -35.35 -50.82CCL 4.41 5.53 17.92 11.22 -20.16 -37.40NCL 7.81 8.12 25.07 23.04 -3.72 -8.09WCL 3.48 4.62 14.20 9.36 -24.61 -34.05SECL 10.34 11.74 37.75 29.98 -11.93 -20.60MCL 10.85 12.49 37.84 32.75 -13.17 -13.44NEC 0.01 0.03 0.13 0.09 -60.00 -32.58CIL 41.54 48.85 153.48 120.39 -14.96 -21.56SCCL 2.88 5.52 16.84 8.47 -47.76 -49.69Total 44.42 54.37 170.32 128.86 -18.29 -24.34
Table 4.6: Sector-wise Offtake(i) Power Sector
June'2020Actual June'2019 Upto June'2019 Upto June'2020 M-O-M Y-O-Y
ECL 2.81 3.60 11.73 9.15 -21.85 -21.93BCCL 1.20 1.87 6.20 2.85 -36.01 -54.14CCL 3.34 3.71 11.99 8.90 -9.95 -25.77NCL 6.64 6.97 21.61 20.08 -4.71 -7.08WCL 2.83 3.39 10.58 7.89 -16.62 -25.47SECL 7.27 9.52 30.92 22.49 -23.70 -27.26MCL 6.86 8.43 25.28 22.02 -18.70 -12.90NEC 0.00 0.02 0.10 0.06 -82.61 -38.95CIL 30.94 37.51 118.40 93.43 -17.52 -21.09SCCL 2.27 4.60 13.99 7.28 -50.53 -47.98Total 33.22 42.11 132.39 100.71 -21.12 -23.93
Historical Despatch Status GrowthSubs
Subs Historical Despatch Status Growth
55

(ii) CPPJune'2020Actual June'2019 Upto June'2019 Upto June'2020 M-O-M Y-O-Y
ECL 0.004 0.03 0.10 0.01 -84.00 -87.37BCCL 0 0.01 0.01 0.00 -100.00 -100.00CCL 0.247 0.68 1.79 0.51 -63.68 -71.79NCL 0.58 0.57 1.70 1.84 1.05 8.31WCL 0.057 0.19 0.51 0.12 -70.47 -75.45SECL 1.252 1.17 3.49 2.97 6.83 -14.89MCL 1.456 2.12 6.50 5.39 -31.29 -17.20NEC 0.001 0.00 0.01 0.00 -66.67 -62.50CIL 3.60 4.77 14.09 10.83 -24.64 -23.12SCCL 0.25 0.27 0.82 0.39 -6.74 -52.55Total 3.85 5.04 14.91 11.22 -23.69 -24.74
(ii) Steel SectorJune'2020Actual June'2019 Upto June'2019 Upto June'2020 M-O-M Y-O-Y
ECL 0.02 0.015 0.046 0.055 26.67 19.57BCCL 0.09 0.04 0.06 0.28 126.32 363.33CCL 0.06 0.09 0.29 0.13 -38.89 -54.79NCLWCLSECL 0.016 0.02 #DIV/0! #DIV/0!MCLNECCIL 0.18 0.14 0.40 0.48 23.08 20.85SCCLTotal 0.18 0.14 0.40 0.48 23.08 20.85
Subs Historical Despatch Status Growth
Subs Historical Despatch Status Growth
56

(iii) Cement SectorJune'2020Actual June'2019 Upto June'2019 Upto June'2020 M-O-M Y-O-Y
ECL 0.00 0.004 0.02 0.01 0.00 -38.89BCCLCCL 0.017NCL 0.03 0.04 0.10 0.05 -34.21 -50.50WCL 0.19 0.19 0.58 0.30 -1.04 -47.49SECL 0.20 0.29 0.82 0.46 -29.12 -44.04MCL 0.02 0.03 0.06 0.03 -30.77 -47.37NEC 0.01 0.00 0.02 0.02 100.00 0.00CIL 0.45 0.55 1.61 0.87 -18.76 -45.78SCCL 0.14 0.24 0.70 0.24 -40.93 -65.85Total 0.59 0.79 2.31 1.11 -25.45 -51.84
(iv) Sponge Iron SectorJune'2020Actual June'2019 Upto June'2019 Upto June'2020 M-O-M Y-O-Y
ECL 0.02 0.02 0.07 0.04 -21.05 -47.95BCCLCCL 0.07 0.11 0.25 0.16 -34.55 -38.74NCL 0.02 0.02 0.06 0.04 10.53 -37.50WCL 0.01 0.04 0.12 0.02 -68.42 -85.71SECL 0.61 0.50 1.70 1.35 22.16 -20.85MCL 0.19 0.29 0.81 0.50 -33.45 -38.72NECCIL 0.93 0.98 3.02 2.09 -5.32 -30.68SCCL 0.003 0.005 0.038 0.008 -40.00 -78.95Total 0.93 0.98 3.05 2.10 -5.50 -31.28
Subs Historical Despatch Status Growth
Subs Historical Despatch Status Growth
57

(iv) Total Offtake-All SectorsJune'2020Actual June'2019 Upto June'2019 Upto June'2020 M-O-M Y-O-Y
ECL 3.11 3.98 12.84 10.15 -21.72 -20.97BCCL 1.52 2.35 7.46 3.80 -35.32 -49.05CCL 4.41 5.53 17.92 11.22 -20.16 -37.40NCL 7.81 8.12 25.07 23.04 -3.72 -8.09WCL 3.48 4.62 14.20 9.36 -24.61 -34.05SECL 10.34 11.74 37.75 29.98 -11.93 -20.60MCL 10.85 12.49 37.84 32.75 -13.17 -13.44NEC 0.01 0.03 0.13 0.09 -60.00 -32.58 CIL 41.54 48.85 153.21 120.39 -14.96 -21.42SCCL 2.88 5.52 16.84 8.48 -47.76 -49.64Total 44.42 54.36 170.05 128.87 -18.29 -24.22
Subs Historical Despatch Status Growth
58

Table 4.7: Vendible Coal Stock
July'1 2020 July'1 2019 June' 2020 June'2019 June' 2020 June'2019ECL 3.21 0.91 10.06 11.54 31.88 7.86BCCL 3.34 2.09 4.82 6.48 69.36 32.25CCL 10.52 7.61 8.54 11.63 123.23 65.46NCL 7.28 4.42 26.48 26.22 27.50 16.84WCL 15.35 6.94 10.41 11.91 147.42 58.30SECL 15.26 5.75 27.36 34.34 55.77 16.75MCL 20.83 9.85 33.31 34.77 62.54 28.31NECCIL 75.79 37.57 120.98 136.89 62.65 27.44SCCL 3.51 1.07 9.50 17.09 36.95 6.28Total 79.30 38.64 130.48 153.98 60.78 25.09
`
All Figures in MT
SubsVendible Coal Stock as on different dates
Production of Coal Upto
Coal Stock in % of Production
59

Performance of NLCIL


Summary of Performance of NLCILTable 5.1: Lignite Production (in MT)
Historical Production StatusTarget Actual Achievement June'2019 Upto June'2019 Upto June'2020 M-O-M Y-O-Y
Departmental 1.55 1.65 106.32 1.72 4.17 4.37 -4.02 4.72Outsourced 0.08 0.14 184.21 0.07 0.21 0.33 112.12 60.19Total` 1.63 1.79 109.96 1.78 4.38 4.70 0.28 7.33
Table 5.2: Production of Power (MU)Historical Production Status
Target Actual Achievement June'2019 Upto June'2019 Upto June'2020 M-O-M Y-O-YNLCIL 1425.91 1425.87 100.00 1226.28 4304.54 4385.67 16.28 1.88NTPL 670.00 486.48 72.61 251.98 754.57 1312.93 93.06 74.00Total 2095.91 1912.35 91.24 1478.26 5059.11 5698.60 29.36 12.64
Table 5.3: Power from Renewable Sources (MU)Historical Production Status
Target Actual Achievement June'2019 Upto June'2019 Upto June'2020 M-O-M Y-O-YWind Power 23.52 18.11 77.00 15.59 27.18 28.24 16.16 3.90Solar Power 178.39 166.68 93.44 83.05 246.04 502.45 100.70 104.21Total 201.91 184.79 91.52 98.64 273.22 530.69 87.34 94.24
Table 5.4: ProductivityHistorical OMS Status
Target Actual Achievement June'2019 Upto June'2019 Upto June'2020 M-O-M Y-O-YMines (in te) 22.66 14.12 62.31 14.18 11.03 14 -0.42 26.93TPP (Kwhr) 31946 26154 81.87 24068 27009 28794 8.67 6.61
Mode of Production
Production During June 2020 Growth
CompanyProduction During June 2020 Growth
SourcesProduction During June 2020 Growth
Mode of Production
OMS During June 2020 Growth
60

Table 5.5: OBR (in MM3)
Target Actual Achievement June'2019 Upto June'2019 Upto June'2020 M-O-M Y-O-YDepartmental 15.03 11.89 79.10 14.63 40.84 28.85 -18.76 -29.36Outsourced 0.59 0.93 157.65 0.27 1.04 2.53 238.32 142.09Total 15.62 12.82 82.05 14.91 41.89 31.38 -14.04 -25.09
Table 5.6: Mine-wise HEMM Utilisation
Availability Utilisation Availability Utilisation Availability Utilisation Availability Utilisation Availability Utilisation
Mine-1 64 96.63 56.02 91.36 57.86 89.94 55.41 95.65 -2.45 5.71Mine 1A 49.93 94.48 65.09 89.86 67.42 92.39 43.12 96.14 -24.3 3.75Mine 2 51.86 97.56 57.27 99.14 51.38 98.92 36.47 98.62 -14.91 -0.3
Table 5.7: Sales Power Exports
Target Actual June'2019 Upto June'2019 Upto June'2020 M-O-M Y-O-YNLCIL (MU) 1242.77 1210.08 1013.08 3785.79 3746.83 19.45 -1.03NTPL (MU) 632 451.96 232.62 520.08 1215.84 94.29 133.78Total Exp (MU) 1874.77 1662.04 1245.7 4305.87 4962.67 33.42 15.25Lignite SalesM/s TAQA (LT) 0.85 0.52 1.57 4.12 2.88 -66.88 -30.10Direct Sales (LT) 0.9 0.56 0.61 2.89 1.58 -8.20 -45.33Total Sales (LT) 1.75 1.08 2.18 7.01 4.46 -50.46 -36.38
Mode Production During June 2020 Historical OBR Status Growth
Mine
Actual Status during June 2020 (in % )
Actual Status during June 2019 (in % )
Actual Status upto June 2019 (in % )
Actual Status upto June 2020 (in % ) Progressive Growth
SubsDespatch During June 2020 Historical Despatch Status Growth
61

Financial Performance


Table 6.1: Captial Expenditure Rs Cr
FY 21 FY 20 Growth M-o-M FY 21 FY 20 Growth
Y-o-YECL 1150 23.07 42.33 -45.50 42.35 76.84 -44.89BCCL 650 18.54 2.03 813.30 27.74 7.88 252.03CCL 900 99.69 48.07 107.39 101.51 98.47 3.09NCL 1250 50.6 14.1 258.87 148.75 53.44 178.35WCL 650 12.24 39.33 -68.88 17.59 75.85 -76.81SECL 3200 402.42 53.3 655.01 435.29 103.36 321.14MCL 1750 54.8 15.3 258.17 65.08 32.62 99.51CIL and others 450 4.05 1.38 193.48 5.8 4.08 42.16CIL 10000 665.42 215.84 208.29 844.11 452.54 86.53SCCL 2300 133.99 176.9 -24.26 193.57 224.75 -13.87NLCIL Stand Alone 4667 32.18 350.38 -90.82 107.3 929.43 -88.46NLCIL JVs 2000 147.38 320.07 -53.95 353.1 860.2 -58.95NLCIL 6667 179.56 670.45 -73.22 460.4 1789.63 -74.27Total 18967 978.97 1063.19 -7.92 1498.08 2466.92 -39.27
Table 6.2: Head-wise Captital Expenditure Rs Cr
Jun'20 Upto Jun'20Plant & Machinery 4725.5 296.72 420.28 8.89Safety Plant & Machinery 2788.01 91.24 200.34 7.19Development 1018.14 93.77 141.06 13.85Buidling (Factory) 442.93 20.36 22.97 5.19Buidling (Others) 337.73 11.28 13.63 4.04Furniture & Fixtures 141.26 3.47 3.69 2.61Lands 2623.87 36.8 64.29 2.45Vehicles 73.62 1.61 2.02 2.74Railway Sidings 867.8 166.47 167.85 19.34Environemt 185.91 2.26 5.31 2.86Solar Power 549.36 81.35 97.17 17.69TPP 185.51 2.44 3.06 1.65Others 5027.36 171.2 356.41 7.09Total 18967 978.97 1498.08 7.90Note: Compny-wise Details are given in Tables in Annex
Subs/Com Budget Estimate
Actual Exp During Jun Actual Exp Upto Jun
Head of Expenditure Budget Estimate
Actual Exp % Exp
62

Table 6.3: Total Manpower
1st April'20 1st June'20 ChangeECL 57153 56917 -236BCCL 43425 43090 -335CCL 38168 37953 -215NCL 14382 14252 -130WCL 40401 40236 -165SECL 51426 50763 -663MCL 21991 21928 -63NEC 1213 1198 -15CMPDI 3156 3130 -26DCC 249 248 -1CIL HQ 881 876 -5Total CIL 272445 270591 -1854SCCL 46021 45388 -633NLCIL 12486 12133 -353Total Manpower 330952 328112 -2840
Table 6.4: Debtors Due as on 30th June'20 Rs Cr
Jun'20 Jun'19 ChangeECL 4472.23 3699.63 772.6BCCL 3164.33 3159.62 4.71CCL 4186.2 3616.63 569.57NCL 3373.19 2053.99 1319.2WCL 2566.22 1672.22 894SECL 2506.18 2140.26 365.92MCL 2279.24 1530.97 748.27Total CIL 22547.59 17873.32 4674.27SCCL 3846.53 3686.28 160.25NLCIL 8669.38 4519.48 4149.9NTPL 2394.51 1169.4 1225.11Total NLCIL 11063.89 5688.88 5375.01Total Debtors Due 37458.01 27248.48 10209.53
Table 6.5: Age-wise Debtors Dues as on June'20 Rs Cr
0-3 3-6 6-9 9-12 12+ TotalECL 1590.34 1388.46 590.96 65.97 836.5 4472.23BCCL 1002.76 1519.8 12.22 4.26 625.29 3164.33CCL 875.2 1354.4 742.65 742.65 471.3 4186.2NCL 2174.23 588.78 96.08 16.61 497.49 3373.19WCL 1595.66 919.39 0 0 51.17 2566.22SECL 591.07 269.11 375.76 149.68 1120.6 2506.18MCL 1232.54 832.01 113.92 34.85 65.92 2279.24Total CIL 9061.8 6871.95 1931.59 1014.02 3668.2 22547.59Percentage Share 40.19 30.48 8.57 4.50 16.27 100.00
Subsidiary/Company Manpower As on the 1st Day of
Subsidiary/Company Due As on the last Day of
Age-wise Debtors in MonthsSubsidiary
63

AnnexTable 6.2 A : Statement of Head-wise Capital Expensiture of CIL Rs CR
Jun'20 Upto Jun'201 Plant & Machinery 3566.93 290.18 392.43 11.002 Safety Plant & Machinery 206.51 0 0 0.003 Development 830.98 62.72 80 9.634 Buidling (Factory) 258.86 7.96 8.31 3.215 Buidling (Others) 218.71 7.35 7.52 3.446 Furniture & Fixtures 138.55 3.43 3.65 2.637 Lands 1908.77 23.1 32.43 1.708 Vehicles 57.39 0.46 0.46 0.809 Railway Sidings 359.26 156.23 156.23 43.49
10 Environemt 185.91 2.26 5.31 2.8611 Solar Power 88.46 2.03 2.07 2.3412 TPP 013 Others 2179.67 109.7 155.7 7.14
10000 665.42 844.11 8.44
Table 6.2 B : Statement of Head-wise Capital Expensiture of SCCL Rs CR
Jun'20 Upto Jun'201 Plant & Machinery 656.85 6.39 8.83 1.342 Safety Plant & Machinery 20.08 0.03 0.03 0.153 Development 126.15 30.45 58.21 46.144 Buidling (Factory) 24.86 0.08 0.6 2.415 Buidling (Others) 119.02 3.93 6.11 5.136 Furniture & Fixtures 2.71 0.04 0.04 1.487 Lands 322.69 10.16 18.65 5.788 Vehicles 16.23 1.15 1.56 9.619 Railway Sidings 310 0 1.38 0.45
10 Environemt 011 Solar Power 460.9 79.32 95.1 20.6312 TPP 185.51 2.44 3.06 1.6513 Others 55 0 0 0.00
2300 133.99 193.57 8.42
Table 6.2 C : Statement of Head-wise Capital Expensiture of NLCIL Rs CR
Jun'20 Upto Jun'201 Plant & Machinery 501.72 0.15 19.02 3.792 Safety Plant & Machinery 2561.42 91.21 200.31 7.823 Development 61.01 0.6 2.85 4.674 Buidling (Factory) 159.21 12.32 14.06 8.835 Buidling (Others)6 Furniture & Fixtures7 Lands 392.41 3.54 13.21 3.378 Vehicles9 Railway Sidings 198.54 10.24 10.24 5.16
10 Environemt11 Solar Power12 TPP13 Others 2792.69 61.5 200.71 7.19
6667 179.56 460.4 6.91
Sl No Head of Expenditure Budget Estimate
Actual Exp % Expenditure
Total
% Expenditure
Total
Sl No Head of Expenditure Budget Estimate
Actual Exp
Sl No Head of Expenditure Budget Estimate
Actual Exp
% Expenditure
Total
64

Annex
Table 6.6 A1: Coal Auction through Exclusive Scheme
Qty Booked (L Te)
Bid Value (Rs Lakh)
Unit Value (Rs/te)
Qty Booked (L Te)
Bid Value (Rs Lakh)
Unit Value (Rs/te)
ECL 1.090 3565.74 3270BCCL 0.639 3188.78 4990CCLNCLWCLSECL 3.855 4414.04 1145MCLNECTotal 4.945 7979.78 1614 0.639 3188.78 4990
Table 6.6 A2: Coal Auction through Exclusive Scheme
Qty Booked (L Te)
Bid Value (Rs Lakh)
Unit Value (Rs)
Qty Booked (L Te)
Bid Value (Rs Lakh)
Unit Value (Rs)
ECL 2.765 9041.09 3270BCCL 0.00 1.775 9019.16 5081CCL 0.00 1.985 3301.78 1664NCL 0.00 10.000 21450.87 2145WCL 0.00SECL 7.476 8560.57 1145MCL 26.160 24163.40 924 16.387 14160.80 864NEC 0.00Total 36.401 41765.06 1147 30.146 47932.61 1590
Table 665 B1: Coal Auction through Special Forward Scheme
Qty Booked (L Te)
Bid Value (Rs Lakh)
Unit Value (Rs/te)
Qty Booked (L Te)
Bid Value (Rs Lakh)
Unit Value (Rs/te)
ECLBCCLCCLNCL 6.44 7081.16 1100WCLSECLMCLNECTotal 0.000 0.00 6.44 7081.16 1100
During June'20
Subs
Rail Mode Road Mode
Upto June'20
Subs
Rail Mode Road Mode
During June'20
Subs
Rail Mode Road Mode
65

Annex
Table 6.6 B2: Coal Auction through Sp[ecial Forward Scheme
Qty Booked (L Te)
Bid Value (Rs Lakh)
Unit Value (Rs)
Qty Booked (L Te)
Bid Value (Rs Lakh)
Unit Value (Rs)
ECLBCCLCCL 0.480 463.92 967NCL 11.440 12201.16 1067WCL 1.000 1678.00 1678 2.280 3903.08 1712SECL 9.385 8962.24 8962MCL 8.200 6630.40 6630 14.600 11155.12 764NECTotal 18.585 17270.64 929 28.800 27723.28 963
Table 6.6 C1: Coal Auction through Special Spot Scheme
Qty Booked (L Te)
Bid Value (Rs Lakh)
Unit Value (Rs/te)
Qty Booked (L Te)
Bid Value (Rs Lakh)
Unit Value (Rs/te)
ECLBCCLCCL 1.080 1237.00 1145 8.227 19471.36 2367NCLWCLSECLMCLNECTotal 1.080 1237.00 1145 8.227 19471.36 2367
Table 6.6 C2: Coal Auction through Special Spot Scheme
Qty Booked (L Te)
Bid Value (Rs Lakh)
Unit Value (Rs)
Qty Booked (L Te)
Bid Value (Rs Lakh)
Unit Value (Rs)
ECLBCCLCCL 1.800 2218.92 1233 8.970 20292.70 2262NCLWCL 3.807 8420.76 2212SECLMCLNECTotal 1.800 2218.92 1233 12.776 28713.46 2247
Subs
Rail Mode Road ModeUpto June'20
During June'20
Subs
Rail Mode Road Mode
Upto June'20
Subs
Rail Mode Road Mode
66

Annex
Table 6.6 D1: Coal Auction through Spot Scheme
Qty Booked (L Te)
Bid Value (Rs Lakh)
Unit Value (Rs/te)
Qty Booked (L Te)
Bid Value (Rs Lakh)
Unit Value (Rs/te)
ECL 0.779 2663.49 3420 1.995 8824.91 4423BCCL 0.960 2246.40 2340 0.040 93.60 2340CCL 0.160 183.20 1145 5.571 12157.92 2182NCL 0.993 1946.87 1961WCL 2.069 4809.20 2324SECL 1.986 1896.57 955 11.674 16548.86 1418MCL 7.040 7153.52 1016 3.527 3316.58 940NECTotal 10.925 14143.19 1295 25.870 47697.93 1844
Table 6.5 D2: Coal Auction through Spot Scheme
Qty Booked (L Te)
Bid Value (Rs Lakh)
Unit Value (Rs)
Qty Booked (L Te)
Bid Value (Rs Lakh)
Unit Value (Rs)
ECL 3.349 13229.47 3950 5.935 26050.15 4389BCCL 1.040 2465.36 2371 1.169 3708.01 3173CCL 0.160 183.20 1145 12.867 26548.62 2063NCL 2.297 3013.53 1312 3.613 6447.85 1785WCL 4.948 11546.68 2333SECL 2.220 2164.09 975 17.287 23360.08 1351MCL 8.320 8313.12 999 5.588 5148.42 921NEC 0.059 385.59 6580Total 17.386 29368.77 1689 51.464 103195.39 2005
Subs
Rail Mode Road Mode
During June'20
Subs
Rail Mode Road Mode
Upto June'20
67

Annex
Table 6.6 E1: Summary of Auction During the Month of June'20 in Rail ModeQ
ty
Boo
ked
(L
Te)
Bid
Val
ue
(Rs L
akh)
Uni
t Val
ue
(Rs/
te)
Qty
B
ooke
d (L
T
e)
Bid
Val
ue
(Rs L
akh)
Uni
t Val
ue
(Rs/
te)
Qty
B
ooke
d (L
T
e)
Bid
Val
ue
(Rs L
akh)
Uni
t Val
ue
(Rs/
te)
Qty
B
ooke
d (L
T
e)
Bid
Val
ue
(Rs L
akh)
Uni
t Val
ue
(Rs/
te)
ECL 1.09 3565.74 3270 0.78 2663.49 3420BCCL 0.96 2246.40 2340CCL 1.08 1237.00 1145 0.16 183.20 1145NCLWCLSECL 3.86 4414.04 1145 1.99 1896.57 955MCL 7.04 7153.52 1016NECTotal 4.95 7979.78 1614 0.00 0.00 1.08 1237.00 1145 10.92 14143.19 1295
Table 6.6 E2: Summary of Auction During the Month of June'20 in Road Mode
Qty
B
ooke
d (L
T
e)
Bid
Val
ue
(Rs L
akh)
Uni
t Val
ue
(Rs/
te)
Qty
B
ooke
d (L
T
e)
Bid
Val
ue
(Rs L
akh)
Uni
t Val
ue
(Rs/
te)
Qty
B
ooke
d (L
T
e)
Bid
Val
ue
(Rs L
akh)
Uni
t Val
ue
(Rs/
te)
Qty
B
ooke
d (L
T
e)
Bid
Val
ue
(Rs L
akh)
Uni
t Val
ue
(Rs/
te)
ECL 2.00 8824.91 4423BCCL 0.64 3188.78 4990 0.04 93.60 2340CCL 8.23 19471.36 2367 5.57 12157.92 2182NCL 6.44 7081.16 1100 0.99 1946.87 1961WCL 2.07 4809.20 2324SECL 11.67 16548.86 1418MCL 3.53 3316.58 940NECTotal 0.64 3188.78 4990 6.44 7081.16 1100 8.227 19471.36 2367 25.87 47697.93 1844
Subs
Exclusive Scheme Special Forward Scheme Special Spot Scheme Spot Scheme
Subs
Exclusive Scheme Special Forward Scheme Special Spot Scheme Spot Scheme
68

Annex
Table 6.5 F1: Summary of Auction Upto the Month of June'20 in Rail ModeQ
ty
Boo
ked
(L
Te)
Bid
Val
ue
(Rs L
akh)
Uni
t Val
ue
(Rs/
te)
Qty
B
ooke
d (L
T
e)
Bid
Val
ue
(Rs L
akh)
Uni
t Val
ue
(Rs/
te)
Qty
B
ooke
d (L
T
e)
Bid
Val
ue
(Rs L
akh)
Uni
t Val
ue
(Rs/
te)
Qty
B
ooke
d (L
T
e)
Bid
Val
ue
(Rs L
akh)
Uni
t Val
ue
(Rs/
te)
ECL 2.76 9041.09 3270 3.35 13229.47 3950BCCL 1.04 2465.36 2371CCL 1.80 2218.92 1233 0.16 183.20 1145NCL 2.30 3013.53 1312WCL 1.00 1678.00 1678SECL 7.48 8560.57 1145 9.38 8962.24 955 2.22 2164.09 975MCL 26.16 24163.40 924 8.20 6630.40 809 8.32 8313.12 999NECTotal 36.40 41765.06 1147 18.58 17270.64 929 1.8 2218.92 1233 17.39 29368.77 1689
Table 6.5 F2: Summary of Auction Upto the Month of June'20 in Road Mode
Qty
B
ooke
d (L
T
e)
Bid
Val
ue
(Rs L
akh)
Uni
t Val
ue
(Rs/
te)
Qty
B
ooke
d (L
T
e)
Bid
Val
ue
(Rs L
akh)
Uni
t Val
ue
(Rs/
te)
Qty
B
ooke
d (L
T
e)
Bid
Val
ue
(Rs L
akh)
Uni
t Val
ue
(Rs/
te)
Qty
B
ooke
d (L
T
e)
Bid
Val
ue
(Rs L
akh)
Uni
t Val
ue
(Rs/
te)
ECL 5.93 26050.15 4389BCCL 1.78 9019.16 5081 1.17 3708.01 3173CCL 1.98 3301.78 1664 0.48 463.92 967 8.97 20292.70 2262 12.87 26548.62 2063NCL 10.00 21450.87 2145 11.44 12201.16 1067 3.61 6447.85 1785WCL 2.28 3903.08 1712 3.81 8420.76 2212 4.95 11546.68 2333SECL 17.29 23360.08 1351MCL 16.39 14160.80 864 14.60 11155.12 764 5.59 5148.42 921NEC 0.06 385.59 6580Total 30.15 47932.61 1590 28.80 27723.28 963 12.78 28713.46 2247 51.46 103195.39 2005
Subs
Exclusive Scheme Special Forward Scheme Special Spot Scheme Spot Scheme
Subs
Exclusive Scheme Special Forward Scheme Special Spot Scheme Spot Scheme
69

Status of Electricity Generation


Table 7.1: Statement of Electricity Generation from different Sources In MU
FY 21 FY 20Growth M-o-M FY 21 FY 20
Growth Y-o-Y
Thermal 78147.17 94218.02 -17.06 222846.64 287720.46 -22.55Nuclear 3764.73 4052.02 -7.09 11422.35 11121.64 2.70Hydro 17015.82 14343.90 18.63 41163.37 39497.74 4.22Bhutam Imp 1214.5 332.90 264.82 2256.50 917.40 145.97Total Conventional 100142.22 112946.84 -11.34 277688.86 339257.24 -18.15Wind 7895.79 8781.15 -10.08 17607.54 19092.38 -7.78Solar 4706.21 3931.59 19.70 15666.54 12455.39 25.78Biomass 298.11 202.27 47.38 880.05 666.31 32.08Bagasse 181.33 313.76 -42.21 1681.06 2147.82 -21.73Small Hydro 817.3 665.56 22.80 2280.03 1776.06 28.38Others 123.46 38.23 222.94 193.19 106.38 81.60Total Renewable 14022.20 13932.56 0.64 38308.41 36244.34 5.69Total Generation 114164.42 126879.4 -10.02 315997.27 375501.58 -15.85% Share of RE 12.28 10.98 1.30 12.12 9.65 2.47
Table 7.1 A: Fuel-wise Electricity Generation in Thermal Sector In MU
FY 21 FY 20Growth M-o-M FY 21 FY 20
Growth Y-o-Y
Coal 70142.52 87387.03 -19.733 198928.93 266602.79 -25.384Lignite 2912.79 2495.51 16.7212 8718.61 8094.73 7.70724Gas 5081.06 4328.38 17.3894 15166.34 12987 16.7809Diesel 10.8 7.1 52.1127 32.76 35.93 -8.8227Total Thermal 78147.17 94218.02 -17.057 222846.64 287720.45 -22.548
Table 7.2: Coal Consumption and Electricity Generation In MU
FY 21 FY 20Growth M-o-M FY 21 FY 20
Growth Y-o-Y
Coal Consumption (MT) 45.08 56.48 -20.18 128.01 169.98 -24.69Electricity From Coal (MU) 70142.52 87387.03 -19.73 198928.93 266602.79 -25.38Average PLF 49.54 62.63 -20.90 46.3 63.18 -26.72Specific Coal Consumption* 0.643 0.646 -0.56 0.643 0.638 0.93* Kg of Coal required to produce 1 Unit of Electricity
Table 7.3 Coal Imports (Provisional) In MT
FY 21 FY 20Growth M-o-M FY 21 FY 20
Growth Y-o-Y
Non Coking * 7.75 12.49 -37.95 38.84 60.44 -35.74Coking 1.8 4.82 -62.66 10.67 17.73 -39.83Anthracite 0.16 0.22 -27.27 0.51 0.78 -34.10Total 9.71 17.53 -44.61 50.02 78.95 -36.64* Non-Coking Coal means Bituminous and Steam Coal
During July Upto JulyType of Coal
Statement on the Status of Electricity Generation During June 2020
Generation During June Generation Upto JuneSource
During June Upto JuneItems of Information
Generation During June Generation Upto JuneFuel
70

Note: Detailed Analysis of Imports of June'20 is given in Tables in AnnexTable 7.4: Non-Coking Coal Consumption by Cement and DRI Sectors(i) Cement Sector In MT
FY 21 FY 20Growth M-o-M FY 21 FY 20
Growth Y-o-Y
Cement Production 26.337 28.282 -6.88 52.845 86.004 -38.56Coal Consumption 4.477 4.808 -6.88 8.984 14.621 -38.56Domestic Coal Supply 0.647 0.839 -22.88 1.220 2.467 -50.55Coal Import 0.422 1.897Balance of Coal -3.408 -5.867
(ii) DRI Sector In MT
FY 21 FY 20Growth M-o-M FY 21 FY 20
Growth Y-o-Y
DRI Production 2.386 3.213 -25.74 4.823 9.569 -49.598Coal Consumption 3.307 4.453 -25.74 6.685 13.263 -49.598Domestic Coal Supply 0.925 0.987 -6.28 2.100 3.070 -31.596Coal Import 0.034 0.112Balance of Coal -2.348 -4.473
Table 7.5: Coking Coal Consumption by Steel Sector In MT
FY 21 FY 20Growth M-o-M FY 21 FY 20
Growth Y-o-Y
Hot Metal Production 4.887 6.328 -22.77 12.513 18.762 -33.31Coal Consumption 3.910 5.062 -22.77 10.0104 15.0096 -33.31Domestic Coal Supply 0.739 0.883 -16.31 2.342 2.648 -11.56Coal Import 2.184 7.672Balance of Coal -0.987 0.004
Table 7.6: Summary of Coal Consumption in Major Sectors In MT
FY 21 FY 20Growth M-o-M FY 21 FY 20
Growth Y-o-Y
Power Utilities 45.080 56.480 -20.18 128.010 169.980 -24.69Cement 4.477 4.808 -6.88 8.984 14.621 -38.56DRI 3.307 4.453 -25.74 6.685 13.263 -49.60Total Non-Coking 52.864 65.741 -19.59 143.678 197.863 -27.39Steel 3.910 5.062 -22.77 10.010 15.010 -33.31Total Coking 3.910 5.062 -22.77 10.010 15.010 -33.31Total Coal 56.774 70.804 -19.81 153.689 212.873 -27.80
ItemsDuring June Upto June
SectorsDuring June Upto June
Note: Coal Consumption is estimated on the basis of Specific Coal Consumption in different Sectors
ItemsDuring June Upto June
ItemsDuring June Upto June
71

Table 7.7: Statement of Coal Supply to Other Sectors
FY 21 FY 20Growth M-o-M FY 21 FY 20
Growth Y-o-Y
Domestic Supply 5.678 5.243 8.30 13.291 16.835 -21.05Import 5.294 20.141Total 10.972 33.432
Source of SuppyDuring June Upto June
72

AnnexTable 7.3 A: Total Coal Imports Including Coke (Provisional) In MT
FY 21 FY 20Growth M-
o-M FY 21 FY 20Growth Y-
o-YNon Coking 8.275 13.136 -37.00 31.09 47.948 -35.15Coking 2.457 4.134 -40.56 8.87 12.908 -31.28Anthracite 0.104 0.190 -45.35 0.35 0.561 -37.34PCI Coal 0.771 1.117 -30.98 2.41 3.454 -30.28Pet Coke 0.115 0.217 -47.20 0.37 0.849 -56.19Met Coke 0.790 0.846 -6.64 3.05 3.290 -7.40Total 12.51 19.640 -36.29 46.14 69.010 -33.14
Table 7.3 B: State-wise Import of Coal and Coke In L Te
June'20 June'19Growth M-
o-M June'20 June'19Growth Y-
o-YGujarat 37.882 86.25 -56.08 156.71 256.48 -38.90Maharashtra 7.735 16.81 -53.97 27.30 52.89 -48.39Goa 4.266 8.92 -52.17 20.42 28.22 -27.65Karnataka 4.866 4.44 9.57 9.43 17.74 -46.84Tamil Nadu 12.157 16.30 -25.40 26.59 52.01 -48.87Puducherry 1.323 3.07 -56.95 10.79 13.62 -20.80Andhra Pradesh 33.039 0.00 118.85 130.09 -8.64Odisha 16.163 24.80 -34.83 57.89 76.77 -24.59West Bengal 7.678 12.10 -36.55 21.43 38.49 -44.34Punjab 0.000 0.00 -100.00 0.005 0.00 51.62Delhi 0.00 0.000 0.00 -99.47Haryana 0.00 -100.00 0.000 0.00 -100.00Chhattisgarh 0.00 0.001 0.00 -30.14Madhya Pradesh 0.03 0.010 0.11 -90.87others - 23.684 12.000 23.684 -49.33Total 125.12 196.40 -36.29 461.41 690.10 -33.14Note: Import is for major States. Total figures may not match with total importTable 7.3 C: Sector Wise Import of Coal and Coke during June 2020 In MT
Sector Non CokingCoking Anthr PCI Met Coke Pet Coke TotalAluminium 0.060 0.000 0.000 0.000 0.000 0.020 0.080Auto 0.037 0.000 0.000 0.000 0.000 0.000 0.037Cement 0.422 0.000 0.000 0.000 0.000 0.442 0.864Chemical & Petrochem 0.588 0.000 0.003 0.000 0.006 0.249 0.846DRI 0.034 0.000 0.000 0.000 0.000 0.000 0.034Power 2.150 0.027 0.000 0.000 0.000 0.001 2.178Ferro Alloy 0.020 0.000 0.000 0.000 0.000 0.000 0.020Iron & Steel 0.602 2.184 0.100 0.725 0.106 0.003 3.720Logistics 0.025 0.000 0.000 0.000 0.000 0.000 0.025Paper & Plywood 0.000 0.000 0.000 0.000 0.000 0.000 0.000Pharma 0.000 0.000 0.000 0.000 0.000 0.000 0.000Sugar 0.000 0.000 0.000 0.000 0.000 0.000 0.000Textile 0.117 0.000 0.000 0.000 0.000 0.000 0.117Traders 3.146 0.246 0.000 0.046 0.003 0.073 3.514Foundry 0.000 0.000 0.000 0.000 0.000 0.000 0.000Tyres 0.000 0.000 0.000 0.000 0.000 0.000 0.000Others 1.055 0.000 0.000 0.000 0.000 0.000 1.055Total 8.256 2.457 0.103 0.771 0.115 0.788 12.510
Type of CoalDuring June Upto june
Import During the month of Progressive Import uptoState
73

AnnexTable 7.3 D: Non-Coking Coal Import during the month of June 2020 Grade-wise In Lakh Te
Port G1 G2 G3 G4 G5 G6 G7 G8 G9 G11 G12 G14
Not Known Total
Mundra 1.23 1.67 0.78 1.59 5.28Krishnapatnam 0.78 0.74 3.73 2.65 7.90Kandla 2.63 0.54 0.31 0.11 1.31 1.25 1.68 0.55 0.74 9.13Gangavaram 2.07 1.32 0.27 0.51 1.26 5.43Tuticorin / Voc 5.64 5.64Others 0.18 0.38 3.30 3.86Karaikal 1.32 1.32Navlakhi 3.58 3.58Hazira 4.26 4.26Magdalla 1.99 1.99Vizag 0.68 0.39 0.25 1.64 0.22 0.50 1.01 0.34 5.02Jaigad 1.14 1.65 2.79Paradip 1.31 1.31New Mangalore 1.14 0.53 1.34 0.52 0.22 0.25 0.88 4.88Kolkata 0.04 1.03 0.51 1.71 3.29Marmagoa 2.05 2.05Dahej 3.01 3.01Okha 1.12 1.12Mumbai & Jnpt 0.51 0.51Pipavav 0.20 0.20Jakhau 0.44 0.44Bhavnagar 0.98 0.98Bedi 0.22 0.22Dhamra 1.64 1.64Porbandar 0.19 0.19Muldwarka 0.07 0.07Kakinada 0.77 0.77Sikka 0.06 0.06Jafrabad 0.04 0.04Ennor 5.78 5.78Total 1.23 3.31 0.00 0.54 4.92 2.16 3.15 3.91 4.19 3.64 4.23 2.20 49.30 82.75
Table 7.3 D 1 : Country-wise Non-coking Coal Import durng June 2020 In Lakh Te
County G1 G2 G3 G4 G5 G6 G7 G8 G9 G11 G12 G14
Not Known Total
Indonesia 0.38 0.75 3.09 1.63 3.64 4.23 2.20 31.15 47.07South Africa 2.11 2.16 2.39 0.82 2.56 14.32 24.35United States 1.23 3.31 0.10 1.71 6.35Colombia 0.44 1.674 0.20 2.31Others 1.91 1.91Australia 0.756 0.76Mozambique 0.00Russia 0.00Total 1.23 3.31 0.00 0.54 4.92 2.16 3.14 3.91 4.19 3.64 4.23 2.20 49.30 82.75
74

Annex
Table 7.3 E: Port and Country-wise Import of Non-Coking Coal during June 2020 (L Te)
Port
Aus
tral
ia
Col
ombi
a
Indo
nesi
a
Moz
ambi
que
Rus
sia
Sout
h A
fric
a
Uni
ted
Stat
es
Oth
ers
Tot
al
Mundra 1.674 2.37616 1.2275 5.28Krishnapatnam 5.01295 2.8853 7.90Kandla 0.6374 5.16023 0.6065 2.73411 9.14Gangavaram 4.1736 1.26048 5.43Tuticorin / Voc 5.19384 0.44983 5.64Others 3.86105 3.86Karaikal 1.32348 1.32Navlakhi 3.58385 3.58Hazira 4.25582 4.26Magdalla 0.276 1.7183 1.99Vizag 2.11858 2.2308 0.677 5.03Jaigad 1.14 1.65 2.79Paradip 1.3064 1.31New Mangalore 0.7556 1.3767 2.7333 4.87Kolkata 1.3139 1.9739 3.29Marmagoa 0.75979 1.2875 2.05Dahej 1.59075 1.4159 3.01Okha 1.11923 1.12Mumbai & Jnpt 0.51343 0.51Pipavav 0.2 0.20Jakhau 0.43603 0.44Bhavnagar 0.47176 0.5126 0.98Bedi 0.22 0.22Dhamra 1.6385 1.64Porbandar 0.19045 0.19Muldwarka 0.06739 0.07Kakinada 0.768 0.77Sikka 0.05521 0.06Jafrabad 0.04458 0.04Ennor 5.775 5.78Total 0.76 2.31 47.07 0.00 0.00 24.35 6.35 1.91 82.75
75

Annex
Port
Aus
tral
ia
Col
ombi
a
Indo
nesi
a
Moz
ambi
que
Rus
sia
Sout
h A
fric
a
Uni
ted
Stat
es
Ave
rage
Pri
ce
Bedi 42.74 42.74Bhavnagar 37.53 49.38 42.27Dahej 33.27 51.29 43.78Dhamra 41.65 41.65Ennore 36.28 36.28Gangavaram 59.16 81.48 60.40Hazira 35.62 35.62Jaigad 55.79 54.93 55.67Kakinada 30.95 30.95Kandla 69.82 41.54 67.68 74.84 52.78Karaikal 46.65 46.65Kolkata 45.08 43.67 44.55Krishnapatnam 34.79 48.99 41.89Magdalla 46.13 63.65 54.89Marmagoa 45.84 60.84 57.09Mumbai & Jnpt 58.12 58.12Mundra 66.78 41.81 69.12 55.44Navlakhi 37.76 37.76New Mangalore 75.99 35.13 53.32 47.56Others 44.65 44.65Paradip 41.26 41.26Pipavav 34.52 34.52Tuticorin / Voc 38.06 90.25 48.00Vizag 28.50 38.95 94.92 34.03Average Price 75.99 68.16 39.29 51.91 81.73 45.11
Table 7.3 F 1: Port and Country-wise Average Unit Value of Non-Coking Coal Imports during June 2020 (US$/te)
76

Annex
Port Aus
tral
ia
Col
ombi
a
Indo
nesi
a
Moz
ambi
que
Rus
sia
Sout
h A
fric
a
Uni
ted
Stat
es
Ave
rage
Pri
ce
Bedi 3267.27 3267.27Bhavnagar 2869.13 3805.00 3243.48Dahej 2548.07 3924.02 3350.71Dhamra 3183.99 3183.99Ennore 2779.98 2779.98Gangavaram 4526.36 6241.37 4621.64Hazira 2739.12 2739.12Jaigad 4272.57 4232.17 4267.19Kakinada 2371.34 2371.34Kandla 5350.31 3186.75 5214.38 5734.40 4051.47Karaikal 3566.14 3566.14Kolkata 3464.50 3353.93 3423.04Krishnapatnam 2676.00 3754.86 3215.43Magdalla 3543.95 4904.58 4224.26Marmagoa 3504.47 4655.56 4367.79Mumbai & Jnpt 4443.44 4443.44Mundra 5115.46 3205.64 5284.22 4246.99Navlakhi 2902.62 2902.62New Mangalore 5809.08 2697.04 4096.47 3650.87Others 3429.18 3429.18Paradip 3164.07 3164.07Pipavav 2644.23 2644.23Tuticorin / Voc 2925.44 6899.58 3682.42Vizag 2179.02 3000.87 7257.00 2609.18Average Price 5809.08 5222.21 3014.29 3982.96 6254.41 3460.28
Table 7.3 F 2: Port and Country-wise Average Value of Non-Coking Coal Imports during June 2020 (Rs/te)
77

Annex
Table 7.3 G 1: Coking Coal Import during June 2020 In L Te
Port Aus
tral
ia
Can
ada
Indo
nesi
a
Moz
ambi
que
Om
an
Rus
sia
Uni
ted
Kin
gdom
Uni
ted
Stat
es
Tot
al
Dhamra 2.0 1.2 0.3 1.3 4.9Ennore 0.6 0.6Gangavaram 0.8 0.5 1.3Jaigad 1.3 0.7 2.0Kandla 0.2 0.1 0.2Kolkata 1.4 0.3 0.3 1.5 3.5Krishnapatnam 1.8 1.8Marmagoa 1.3 1.3Mundra 1.6 1.6Others 0.0Paradip 3.5 0.2 0.6 0.7 5.0Vizag 0.5 0.5 0.5 0.0 0.9 2.4Total 14.9 1.4 1.5 1.1 0.3 1.0 0.0 4.3 24.6
Port Aus
tral
ia
Can
ada
Indo
nesi
a
Moz
ambi
que
Om
an
Rus
sia
Uni
ted
Kin
gdom
Uni
ted
Stat
es
Ave
rage
Pri
ce
Dhamra 118 90 97 120 107Ennore 121 121Gangavaram 146 108 121Jaigad 117 117 117Kandla 143 177 160Kolkata 145 87 82 114 125Krishnapatnam 103 103Marmagoa 94 94Mundra 156 156Others 242 242Paradip 117 113 115 110 116Vizag 138 143 101 122 124Average Price 122 122 111 108 97 99 121 119
Table 7.3 G 2: Average Price of Imported Coking Coal during June 2020 (US$/te)
78

Annex
Port Aus
tral
ia
Can
ada
Indo
nesi
a
Moz
ambi
que
Om
an
Rus
sia
Uni
ted
Kin
gdom
Uni
ted
Stat
es
Ave
rage
Pri
ce
Dhamra 9057 6925 7429 9185 8207Ennore 9319 9319Gangavaram 11196 8242 9227Jaigad 9021 8986 9011Kandla 10948 13537 12242Kolkata 11110 6701 6269 8784 9597Krishnapatnam 7916 7916Marmagoa 7193 7193Mundra 12041 12041Others 18520 18520Paradip 9006 8686 8767 8404 8890Vizag 10587 10903 7778 9388 9538Average Price 9373 9353 8549 8273 7429 7550 9270 9142 9142
Table 7.3 G 3: Average Price of Imported Coking Coal during June 2020 (Rs/te)
79

Projects of PSUs


1
Statement 8.1: Status of On-going Projects of CIL
S
N
Sub
Project
TYPE
Cap
(MTY)
Sanctioned
Cost
(Rs. Cr)
Sch. as
per FR/
RCE/PR
Ant. date of
Completion
Capital
Expenditure
till May20
(Prov.)( Cr)
Status (Jun’2020 )
1
ECL
SONEPUR-
BAZARI COMB.
OC
8.00
1055.05
Mar-18
Oct-20
592.49
Delayed.
Delayed due toR&R,
Construction of Railway siding & CHP resumed
after Covid19.
Tree felling over 32.65 Ha forest land to be
expedited by DFO, Durgapur, Govt. of West Bengal. The matter has been placed atPMG
Portal (Project Monitoring Group), Govt. of
India.
2 ECL HURA –C OC 3.00 359.69 Mar-22 Mar-22 119.06 On Schedule.
3 ECL JHANJRA
COMBINED UG 5
1210.12 Mar-25 Mar-25 0 On Schedule.
4 ECL CHITRA EAST RCE
OC 2.50 513.99 Mar-23 Mar-23 95.22 On Schedule.
5 ECL SIDULI UG+O
C 2.32 535.18 Mar-25 Mar-25 0.43 On Schedule.
6 ECL NAKRAKONDA KUMARDI B
OC 3.00 502.68 Mar-28 Mar-28 0.00 On Schedule.
7 ECL TILABONI UG 1.86 916.12 Mar-27 Mar-27 0.12 On Schedule.
8 ECL PARASEA
BELBAID UG 2.07 826.42 Mar-26 Mar-26 0.00 On Schedule.
80

2
S
N
Sub
Project
TYPE
Cap
(MTY)
Sanctioned
Cost
(Rs. Cr)
Sch. as
per FR/
RCE/PR
Ant. date
of
Completion
Capital
Expenditur
e till May20
(Prov.)( Cr)
Status
(Jun’2020
)
9
BCCL
MOONIDIH XV
SEAM
UG
2.50
1230.27
Apr-19
Mar-22
425.42
Delayed
Shaft sinking and in seam drift drivage (from XV to XVI top seam)completed.
Both Bolter Miners have been lowered and
Development work in XV Seam has commenced.
Progress till 31.12.2019 incline No.-1: 1399.00 m.; Incline No.-2:1 4 4 5 . 2 0 m .
10 BCCL NORTH TISRA & SOUTH TISRA
OC 6.00 555.52 Mar-21 Mar-21 5.27 On Schedule.
11
BCCL
MADHUBAND
WASHERY
WSR
Y
5.00
289.45
May-14
Sep’20
269.786 Delayed.
Issue: Due to Slow Progress of work by M/s
HEC.Status- Around 94% Construction work completed
12
BCCL
PATHERDIH WASHERY
WSR
Y
5.00
269.82
Apr-14
Apr’20
182.14
Delayed
PG test was completed on 28.03.2020. PG Test report was by M/s MIEL and accepted by BCCL.
Washery was handed over to M/s MIEL for
commercial operation on 07.04.2020
BOBR Unloading: #Legal Notice being served to M/S MIEL for
construction of BOBR system at their Risk & Cost.
13 CCL NORTH URIMARI EXPN.
OC 7.50 1468.72 Mar-24 Mar-24 204.37 On Schedule.
81

3
S
N
Sub
Project
TYPE
Cap
(MTY)
Sanctioned
Cost
(Rs. Cr)
Sch. as
per FR/
RCE/PR
Ant. date
of
Completion
Capital
Expenditur
e till May20
(Prov.)( Cr)
Status
(Jun’2020
)
14
CCL
RAJRAPPA (RCE)
OC
3.00
510.85
Mar-16
Mar-21
400.98
Delayed
Issue:
Delayinpossession of Non forestland(745.95 ha)
DelayinFC and permission for Forestlanddiversion.
Status:
FC(277.15Ha):State Govt forwarded proposal to
MoEF&CC on 09.06.2020 FAC awaited.
Land Auth.—Total Non Forest land=760.12Ha
After spot inspection, claimof582.14Ha (189
applications) out of 760.12Ha was
rejectedvideletterissuedon 21.08.18 and 103noof
applications(163.58 Ha)isunder process under section 4H of BLR Act1950.
A meeting was held between district
administration and villagers for
redressalofgrievance on12/10/2018.
On 15.06.2020 meetingofCMD CCL with Honorable Member of Parliament Giridih and
MLA Gomia held at CCL HQ in presence of
villagers and GM Rajrappa for creating a common consensus for commencing mining
operation atDhawaiya
Village
15 CCL AMRAPALI OC 25.00 4983.58 Mar-24 Mar-24 192.40 On Schedule.
16 CCL MAGADH EXPN. OC 51.00 6964.33 Mar’25 Mar’25 501.08 On Schedule
82

4
S
N
Sub
Project
TYPE
Cap
(MTY)
Sanctioned
Cost
(Rs. Cr)
Sch. as
per FR/
RCE/PR
Ant. date
of
Completion
Capital
Expenditur
e till May20
(Prov.)( Cr)
Status
(Jun’2020
)
17
CCL
KOTRE BASANtPUR PACHMO OCP
OC
5.00
861.06
Mar’28
Mar’28
0.00
On Schedule
18 CCL CHANDRAGUPTA OC 15.00 973.5 Mar-25 Mar-25 0.00 On Schedule
19 CCL SANGAMITRA OC 20.00 1694.74 Mar-25 Mar-25 0.00 On Schedule
20
NCL
JAYANT EXPN. (20 MTY,10 MTY INCR)
OC
20.00
1783.09
Mar’ 21
Mar-21
317.47
On Schedule
21
NCL
DUDHICHUA EXPN (20MTY, 10 MTYINCR)
OC
20.00
1255.17
Mar-22
Mar-23
123.17
On Schedule
22 NCL BLOCK-B EXPN. OC 8.00 998.71 Mar-23 Mar-23 0.00 On Schedule.
23 WCL DINESH (MKD- III)
OC 8.00 822.89 Mar-27 Mar-27 415.46 On Schedule
24
WCL
PENGANGA
OC
4.00
441.82
Sep-20
Sep’20
228.22
Delayed The projects have achieved its Production
capacity as per PR. The completion report is being
prepared after Finance-Audit and shall be put up for approval of WCL Board.
25 WCL YEKONA-I & II AMALGAMATED
OC 2.75 745.83 Mar-25 Mar-25 263.81 On Schedule
26 WCL PAUNI II Exp. OC 3.25 499.00 Mar-21 Mar-21 230.99 On Schedule
27
WCL
MUNGOLI
NIRGUDA EXT
DEEP
OC
3.50
498.42
Sep’20
Sep’20
219.61
Delayed The projects have achieved its Production capacity
as per PR. However , RPR is under formulation for accommodating funds forrailway siding
S
N
Sub
Project
TYPE
Cap
(MTY)
Sanctioned
Cost (Rs. Cr)
Sch. as
per FR/
RCE/PR
Ant. date
of
Completion
Capital
Expenditur
e till May20
(Prov.)( Cr)
Status
(Jun’2020
)
83

5
28 WCL DURGAPUR EXTNDEEP
OC 3.00 378.87 Mar-21 Mar-21 210.61 On Schedule
29 WCL NILJAI EXPN DEEP OC 3.50 404.45 Mar-21 Mar-21 201.55 On Schedule
30
WCL
GONDEGAON
GHATROHAN AMAL. RPR
OC
3.5
191.78
Mar-22
Mar-22
206.36
On Schedule
31 WCL AMAL. INDER KAMPTEE DEEP
OC 3.2 235.9 Mar-24 Mar-24 123.30 On Schedule
32 SECL BAROUD EXPN RCE
OC 10.00 2103.21 Mar-28 Mar-28 182.45 On Schedule
33
SECL JAGNNATHPUR
RCE
OC
3.00
459.49
Mar-20
Mar-22
197.114
Delayed
work started. R&R activities are also under
implementation.
34
SECL
MANIKPUR
EXPN.
OC
3.50
321.50
Mar-14
Mar-21
198.36
Delayed
Initially project delayed due to delay in EC
because of CEPI moratorium; EC obtainedfor 3.50 MTY on 22.8.14. Enhanced EC for 4.90 MTY obtained in Dec. 2018.
Project construction activities like in-pit
crushingandtransporting by belt conveyor etc got
delayed due to delay in getting possession of forestland.
NIT floated on 15.05.20. Pre bid held on
26.05.2020.
35 SECL MADANNAGAR OC 12.00 1875.32 Mar-24 Mar-24 0.00 On Schedule
36 SECL AMADAND RPR OC 4.00 869.44 Mar-21 Mar-21 120.69 On Schedule
37 SECL CHAAL -SEAM-III OC 6.00 610.63 Mar-22 Mar-22 116.04 On Schedule
38 SECL PELMA OC 15.00 1624.59 Mar-23 Mar-23 6.58 On Schedule
S
N
Sub
Project
TYPE
Cap
(MTY)
Sanctioned
Cost (Rs. Cr)
Sch. as
per FR/
RCE/PR
Ant. date
of
Completion
Capital
Expenditur
e till May20
(Prov.)( Cr)
Status
(Jun’2020
)
39 SECL GEVRA EXPN (35-70 MTY)
OC 70.00 11816.40 Mar-23 Mar-23 2928.66 On Schedule
84

6
40 SECL KUSMUNDA EXPN
OC 50.00 7612.33 Mar-23 Mar-23 2321.33 On Schedule
41 SECL DURGAPUR
OC 6.00 916.24 Mar-23 Mar-23 4.94 On Schedule
42 SECL VIJAY WEST
OC 3.00 976.95 Mar-26 Mar-26 75.96 On Schedule
43 SECL RAMPUR BATURA
OC 4.00 1248.93 Mar-25 Mar-25 127.06 On Schedule
44
MCL
ANANTA EXPN.PH-III
(12 MTY +3 MTY - INCR)
OC
15.00
207.28
Mar-12
Mar-22
319.26
Delayed. Delay in Grant of FC due to NoC under FRA. Delay
in construction of SILO. Not achieved 80%
production of its rated capacity.
45 MCL BHARATPUR RO OC 20 1928.29 Mar-21 Mar-21 1185.13 On Schedule
46
MCL
JAGANNATH RO
OC
6.00
337.66
Mar-19
Mar-21
301.35
Delayed Delayed due to R&R of Rakas Village and
development works of Boulpur R&R site. Project
could not be completed due to not achieving 90% expenditure criteria.
47
MCL BASUNDHARA
(WEST) EXTN.
OC
7.00
479.15
Mar-17
Mar-24
329.33
Delayed.
Project could not be started as the diversion of forest
land & EC is in progress.
48
MCL
HINGULAEXPN.PH-
III (8 MTY+7 MTY–
INCR)
OC
15.00
479.53
Mar-13
Mar-21
570..52
Delayed. Delay in grant of EC for 15Mty, Delay in grant of
FC & possession of forest land, Delay in shifting of
village Bhalugadia due to delay in development of Kochianali R&R site,Delayin Construction of SILO.
Not achieved 80% production of itsrated
capacity.
S
N
Sub
Project
TYPE
Cap
(MTY)
Sanctioned
Cost (Rs. Cr)
Sch. as
per FR/
RCE/PR
Ant. date
of
Completion
Capital
Expenditur
e till May20
(Prov.)( Cr)
Status
(Jun’2020
)
85

7
49
MCL
BALARAM EXTN.
OC
15
3504.21
Mar-26
Mar-26
414.35
On Schedule
50
MCL
KULDA EXPN
OC
5.0
289.03
Mar-18
Mar-21
111.00
Delayed. Delayed due to delay in grant of EC for 15MTY.
Project could not be completed due to not achieving
90% expenditure criteria.
51 MCL KANIHA OC 10.00 457.77 Mar-13 Mar-20 650.16 Delayed.
Delayed - Delay in FC for want of NoC under
FRA of village Jarada for want of R&R site for
villageJarada
Expansion PR of Gopalji - KanihaO C P
(30Mty) dovetailing Kaniha 10Mty will beput up
to MCL Board forapproval.
52 MCL GARJANBAHAL OC 10.00 1375.38 Mar-21 Mar-21 465.65 On Schedule
53 MCL SIARMAL OC 40.00 3756.36 Mar-26 Mar-26 1375.41 On Schedule
54
MCL
INTEGRATED
LAKHANPUR-
BELPAHAR-
LILARI OCP
OC
30.00
2434.75
Mar-27
Mar-27
125.96
On Schedule
55
MCL
IB VALLEY
Washery
WSR
Y
10.00
396.17
Mar-20
May-21
130.00
Delayed
Delay in Handing over Balance Site to BOM Operator and extended rainy season. Construction is
45% complete.
Due to lockdown the Project is further delayed.
Proposal to extend the date of completion to May-
2021 is in process.
Total 624.95 80057.63 17216.1
86

Statement 8.2: Ongoing Projects of NLCIL
Date of approval
Sanctioned Cost
Rs. Crore
Scheduled date of completion
Anticipated Cost Rs.
Crore
Anticipated date of
completion
Cumulative Expenditure upto31.03.2020Rs. Crore
Capex 2020-21
Rs. Crore Cumulative upto30.06.20
20 Rs. Crore
Cumulative Progress (%)upto30.06.2020
Remarks
Physical Financial
Target
ActualProvl
(upto30.06.2020)
Target /Schedule
Actual Target
/Schedule Actual
NEYVELI NEW THERMAL POWER PROJECT (2X500 MW): (NNTPP)
09.06.2011 5907.11
(Oct- 2010) U-I: Oct 2017
U-II: May 2018
5907.11 (Oct-2010) 7080.41
(RCE-1) * 7980.79
(RCE-2)**
U-1- # U-II- Aug 2020
7185.39 500.00 69.11 7254.50 100.00 99.43 84.50 90.90
(RCE2) --
*- RCE 1 cost Rs.7080.41 Crore. # - commercial operation from 28.12.2019. **- RCE-2cost Rs.7980.79Crore.
NTA-1: Unit-1 full load operation for 72hrs commenced on 17th December 19 and completed on 20th December 19. Unit-1 Commercial operation commenced successfully from 00:00 hrs on 28th December 19. Unit-2 Synchronised with grid on 26th February 2020.Unit-2 Mill Trial run completed on 01st June 2020.Unit-2 Right Hand Side, Long Retractable Soot Blower (LRSB) 14 nos commissioned as on 30th June 2020.
CERC has issued an interim tariff order on 29th January 2020 for the period from Commercial Operation Declaration (COD) of Unit-I and anticipated COD of Unit-II till 31st March 2021 based on the petition no. 219/GT/2019 filed by NLCIL.
CERC and SRLDC has accorded approval on 17th June 2020 for Unit-2 Start-up Power up to 30thSeptember 2020.
Date of approval
Sanctioned Cost
Rs. Crore
Scheduled date of
completion
Anticipated Cost Rs.
Crore
Anticipated date of
completion
Cumulative Expenditure upto31.03.2020 Rs. Crore
Capex 2020-21
Rs. Crore
Cumulative
upto30.06.
2020 Rs. Crore
Cumulative Progress (%)upto30.06.2020
Remarks
Physical Financial
Target
ActualProvl
(upto 30.06.2020)
Target /Schedule
Actual Target
/Schedule Actual
EXPANSION OF MINE-I 10.50 MTPA (AREA EXPANSION) & EXPANSION OF MINE-IA (FROM 3.0 MTPA TO 7.0 MTPA)
30.04.2013
1458.17 Original
709.06 RCE (12.09.2016)
June 2015 / June2018
709.06 Put on Hold 468.21 0.00 1.13 469.34 65.89 65.89 86.96 66.20 -
Due to Non availability of land, it was not possible to increase over burden removal to extent of 47.50 MM3 per annum as envisaged in mine planning to get 7.0 MTPA lignite exposure, hence it is required to keep Mine 1A Expansion to 7.0 MTPA on hold till land is acquired. In future when land is available and lignite demand increases, appropriate steps for Mine 1A expansion will be taken. Till then it is proposed to keep Mine 1A Expansion on hold and the same was approved by NLClL’s Board in its492ndmeeting held on 26th June 2019.
87

Date of approval
Sanctioned Cost
Rs. Crore
Scheduled date of
completion
Anticipated Cost Rs.
Crore
Anticipated date of
completion
Cumulative Expenditure upto31.03.2020 Rs. Crore
Capex 2020-21
RsCrore Cumulative upto
30.06.2020Rs. Crore
Cumulative Progress (%)upto30.06.2020
Remarks Physical Financial
Target ActualProvl
(upto30.06.2020) Target
/Schedule Actual Target
Actual (upto30.06.20
20)
RAJASTHAN MINE AND POWER PROJECTS HADLA LIGNITE MINE (1.9 MTPA)
23.03.2015 522.45 Sept 2019 522.45 Put on hold 9.88 0.00 0.00 9.88 99.99 0.48 28.60 1.89 *
BARSINGSAR TPS EXTENSION (1X250 MW) 23.03.2015 2112.59 Aug 2020 2112.59 Put on hold 158.25 0.00 0.00 158.25 98.86 0.01 25.81 7.49 *
BITHNOK LIGNITE MINE (2.25 MTPA) 23.03.2015 513.63 Dec 2019 513.63 Put on hold 175.30 0.00 0.00 175.30 99.99 31.14 17.92 34.13 *
BITHNOK THERMAL POWER PROJECT (1X250 MW)
23.03.2015 2196.30 Aug 2020 2196.30 Put on hold 173.83 0.00 0.00 173.83 98.86 1.77 24.37 7.92 * * Rajasthan Projects are now on hold since June2017.
CMD /NLCIL, Director(Power)/NLCIL along with Additional Secretary(Coal),MoC had review meeting with Chief Secretary, GoR, Principal Secretary (Energy), GoR& MD/RVUNL On 25th November 2019, at Jaipur and discussed the way forward.
NLCIL has written to M/s.RVUNL vide Lr. dt. 27th November 2019 that the tentative tariff of this project at present will be not less than Rs.5 per unit and to give their consent for considering the applicability of CERC regulation on the above tentative tariff level arrived.Deputy Secretary, Energy Department, GoR vide letter dated 31st January 2020 furnished the reply of M/s. RVUNL wherein the following has been stated.
“RVUNL Board was of the view that average power purchase cost of the Discoms is around Rs.4.53 per unit and it will not be in the interest of Discomsto purchase power at the tariff more than Rs.5 per unit. RUVNL board decided to apprise the same to State Government to take up the matter with NLCILfor utilization of Lignite available”.
In response to NLCIL's letter dated 03rd Dec 2019, M/s.RIL vide letter dated 09th December 2019 replied the following and the reply to M/s.RIL's letter is being sent: a) Their claims of Rs.737.90 Crores after factoring in the Mobilisation advance of Rs.261.21 Crores is justifiable. b) M/s.RIL continues to incur huge Bank Guarantee charges in respect of the PBGs retained by NLCIL. c) Requested NLCIL to release the PBGs as their retention by NLCIL is unnecessarily blocking the non-fund based bank limits of M/s.RIL due to which M/s.RIL is unable to participate in other bids. NLCIL vide letter dated 15th February 2020 informed M/s.RIL that the replies furnished earlier by NLCIL holds good. M/s.RIL has submitted 12 Nos. of APGs for the said Projects from 3 Banks SBI, Mumbai (for 4 APGs), IDBI, Mumbai (for 6 APGs) and Canara Bank, Mumbai (for 2 APGs). All the 12 BGs which were valid up to 21.05.2020 have been extended up to 31.12.2020 and scanned copies of the amended BGs have been received from respective banks through mail. Original BGs are not yet received. M/s.RIL vide letter dated 27.05.2020 has requested NLCIL to release the Contract Performance Bank Guarantees furnished by them as per the guidelines provided in the Office Memorandum No.F.18/4/2020-PPD dated 13.05.2020 issued by Ministry of Finance, Government of India (citing the Rule 171 of General Financial Rules, 2017) to enable them to refuel their economic activities at other fronts.
NLCIL vide letter dt.09.06.2020 requested M/s. RIL to expedite the process for sending all original amended Bank Guarantees (12 Nos of APGs). In response, M/s. RIL, vide letter dated 12.06.2020 stated that they requested their bankers to send the original hard copies, directly to our office.
Hon’ble Minister of Parliamentary Affairs, Coal& Mines and Minister of State for Heavy Industries and Public Enterprises have taken a meeting on 25th January 2020 and directed NLCIL to submit details on status of Rajasthan Mine and Thermal Power projects.Details of the Projects put on hold was submitted to the office of Hon’ble Minister through Administrative Ministry.
Hon’ble Minister Parliamentary Affairs, Coal and Mines, GoI has addressed a DO letter to Hon’ble Chief Minister of Rajasthan requesting kind intervention to resume the project as PPA has already been signed for mutual benefit of two government agencies – One at the Center and other at the State of Rajsathan vide letter dated 04th May 2020.
88

Date of approval
Sanctioned Cost
Rs. Crore
Scheduled date of completion
Anticipated Cost Rs.
Crore
Anticipated date of
completion
Cumulative Expenditure upto31.03.2020Rs.Crore
Capex 2020-21 Rs. Crore Cumulative
upto30.06.20
20 Rs. Crore
Cumulative Progress (%)upto30.06.2020
Remarks
Physical Financial
Target
ActualProvl
(upto30.06.2
020)
Target /Schedule
Actual Target
/Schedule Actual
GHATAMPUR THERMAL POWER PROJECT (3X660 MW), U.P
27.07.2016 17237.80 U-I: Nov2020 U-II: May2021 U-III: Nov 2021
17237.80
U -I: Dec 20 U -II: Jun 21
U -III: Dec 21 9,199.20 2,000.0 349.91 9,549.11 65.63 59.14 60.82 55.40
PPA has been already signed with UPPCL and MoP has allocated 1599.85 MW for UPPCL. For balance power, unwillingness from all concerned received by MoP. (Latest letter from J&K Power Corporation Ltd dated 30th December 2019). Final allocation letter for the remaining power 243.83 MW to U.P. was issued by MoP on 02nd January 2020.136.32 MW shall remain unallocated.
GA1: Unit-I, II &III Boiler erection activities are in progress. Coal Silo fabrication works in progress. ESP structure erection work is in progress. GA2: Unit-I, II&III Main Power House foundation work is in progress. Unit- I, II & III TG columns casting completed and TG Deck work under progress.De-aerator –
Hydro-test completed on 20th March 2020. GA3: Construction activities in respect of switchyard, raw water reservoir, DM plant, NDCT, Fore Bay, CWPH CW channel sidewall, Coal Handling Plant, Ash Handling
Plant, ESP and Chimney is in progress. GA4: Price cover along with addendum price cover opened on 22nd August 2019. Reverse Auction conducted on 27th August 2019. Meeting was conducted with four
bidders on 6th September 2019 to explain the connectivity problem in the system of MSTC Portal. After the approval of Competent Authority Legal opinion from ASG was sought and the ASG’s legal opinion dt. 19th September 2019 was received on 21st September 2019.Details furnished to IEM as requested by them. Tender Committee met on 18th November 2019. Observation from one IEM member received on 22nd November 2019.TC met on 29th November 2019and recommended to cancel the tender.
Flue Gas Desulphurization: 11th PC Committee dated 11.02.2020 has approved for re-tendering with base value of Rs. 689.39 Crore during the 48th Board Meeting on 29th March 2020. PC committee held on 27th June 2020 accorded approval for change in the tender specifications. Bid opening scheduled on 16th July 2020.
Bridge linkage: Ministry of Coal (MoC) has granted the bridge linkage of 0.5 MT for the year 2020-21 for GTPP. Erection activities for the project werehampered due to restrictions imposed owing to COVID-19.
Date of Sanctioned Scheduled Anticipated Anticipated Cumulative Cumulative Cumulative Progress (%)upto30.06.2020 Remarks
89

approval Cost Rs. Crore
date of completion
Cost Rs. Crore
date of completion
Expenditure upto
31.03.2020Rs.Crore
Capex 2020-21 Rs. Crore
upto30.06.2
020 Rs. Crore
Physical Financial
Target
ActualProvl
(upto30.06.20
20)
Target /Schedule
Actual Target
/Schedule Actual
PACHWARA SOUTH COAL OCP (9.0 MTPA), JHARKHAND
04.05.2018 1,795.01 March 2020* 1,795.01 Sept 2022 29.02 0.00 0.96 29.98 @ @ 1.67
*- As per corporate plan. @ Project under MDO mode work under progress.
Final Geological Report (FGR) has been submitted to MoC in Soft form for approval on 13th April 2020.Hard copies of GR has been submitted to CMPDIL, RI-1, Asansol,West Bengal as per the instruction of Deputy Secretary,MoC on 04.06.2020 for vetting.
DGPS and Civil Survey completed in December 2019. Topography and Contour Survey work was completed in January 2020.
AAP for Pachwara South Coal Block:Proposal was taken up by the Revised Cost Committee on 03.03.2020.The second Revised Cost Estimates Committee meeting with Joint secretary and Financial Adviser, MoC and Adviser (Costs), MoF and Adviser (Projects), MoC was held on 24 th April 2020 through Video Conferencing. The estimates are modified to 3949.91 lakhs and resubmitted as per the guidelines of the committee.Revised estimate of AAP has been submitted to MoC on 20.06.2020 for approval.
Mining Plan & Mine Closure Plan:Mining Plan & Mine Closure Plan has been submitted to MoC on 19th June 2020 for approval. Preliminary project activities are hampered due to restrictions imposed owing to COVID-19.
90

Date of approval
Sanctioned Cost
Rs. Crore
Scheduled date of
completion
Anticipated Cost Rs.
Crore
Date of completion
Cumulative Expenditure
upto31.03.2020Rs. Crore
Capex 2020-21
Rs. Crore Cumulative upto30.06.2
020 Rs.Crore
Cumulative Progress (%)upto30.06.2020
Remarks
Physical Financial
Target Actual
(upto30.06.
2020)
Target /Schedule
Actual
Target
Actual (upto30.06.2
020)
TAMILNADU SOLAR PROJECT (709 MW):
17.10.2017 (In principle approval)
3190Cr.
22.04.2019 /23.04.2019
3,035.93 Sept 2019
2927.81 19.00 1.96 2929.77 100.0 99.71 100.0 96.44 -- 23.01.2018 (Investment
and Placement of
orders)
3172.98Cr.
The entire 709 MW Capacity of the projects was commissioned by 24th September 2019 and COD for the entire projects were declared as 24th October 2019. Balance peripheral works like Road, Drainage, fencing and Module cleaning system are in progress and expected to be completed by September 2020.
Project Commissioning Date PAC Date PG Date Total Generation (2020 – 21) in MU
100 MW Maranthai 05.07.2019 05.03.20 01.04.20 43.02
100 MW Kamuthi 29.04.2019 01.01.20 23.03.20 42.35
109 MW Avathadai 06.08.2019 (95 MW) 23.09.2019(14 MW)
-
Yet to Start
42.70
100 MW Pulangal 21.09.2019 - 29.74
100 MW Onamakulam 24.09.2019 - 34.50
100 MW Pudur 09.09.2019 - 38.88
100 MW Therkkupatti 07.06.2019 (63 MW) 24.09.2019 (37 MW)
- 18.48
Total 249.68
91

Date of approval
Sanctioned Cost
Rs. Crore
Scheduled date of
completion
Anticipated Cost Rs.
Crore
Anticipated date of
completion
Cumulative Expenditure
upto31.03.2020 Rs. Crore
Capex 2020-21
Rs. Crore
Cumulative upto30.06.202
0 Rs. Crore
Cumulative Progress (%)upto30.06.2020
Physical Financial
Target /Schedule
Actual Target /Schedule
Actual Target ActualPro
vl(upto30.0
6.2020
TALABIRA II & III COAL OC MINE (20.0 MTPA), ODISHA:
20.07.2017 2,401.07 18 months from date of LOA –
06.02.18 2,401.07 Jan 2027 * 712.91 364.00 7.90 720.81 87.00 30.02
* Coal Production commenced on 26th April 2020. Government Non Forest Land:-Jharsuguda Tehsil: Out of 196.260 Ha Jharsuguda Tehsil has handed over 155.070 Ha of Land in the name of NLCIL. Possession
of balance 41.189 Ha. Land yet to be obtained as the land is recorded as Jalbhandar in the name of Irrigation and Power Department, Government of Odisha. Rengali Tehsil: Out of 227.786 Ha Rengali Tehsil has handed over 225.233 Ha of land in the name of NLCIL.
Tenancy Land: R& R Policy approved by RPDAC on 7th April 2018.Jharsuguda District: The market value of tenancy land for Malda, Patrapali, and Rampur has been determined and communicated by the collector, Jharsuguda on 6th February 2019. The request for reviews the market value of tenancy land for Malda, Patrapali, and Rampur has been submitted to the Collector, Jharsuguda on 18th June 2019.The Market value of tenancy land for Malda, Rampur &Patrapali has been revised & communicated by District Collector, Jharsuguda on 30th December 2019. The radial distance for Malda, Rampur &Patrapali villages of Jharsuguda district from nearest Urban/Municipality has been communicated by Addl. District Magistrate,Jharsuguda on 29th February 2020.
District Compensatory Advisory Committee(DCAC) meeting to be conducted by the office of the Collector Sambalpur for direct purchase of 16.29 Ac. (Thelkoli 5.22 Ac., Khinda 11.07 Ac.) land for approach road to mines. A meeting was held with the Collector, Sambalpur on 1 stJune 2019, Dy. Collector, Sambalpur on 14th June 2019 & ADM/Sambalpur on 21st June 2019 to follow-up the DCAC meeting and other project related issues. Consent of 23 nos. land owners obtained out of total 24 nos. of land owners.
DCAC meeting for direct purchase of private land of Ac 7.05 Ac in Khinda village and 6.01 Ac in Telkoloi village for construction of approach road to mines was successfully conducted on 02nd January 2020.
EC (Encumbrance Certificate) has been obtained for all khata holders on 24 th January 2020.MoM proceedings issued on 14th February 2020.Tender opened for Construction of Coal Transportation Road on 18th February 2020. LOA Issued on 17th March 2020.Registration and disbursement of payment of approach road land for 9 khatas has been completed. Bush cleaning work has been commenced on 23rd April 2020.Land cutting & filling is in progress as per RL.On 06.06.2020, Sub Collector, Sambalpur conveyed meeting with khata holders to obtain consent under section 22 for SC/ ST land registration & two more meetings conducted on 11.06.2020 & 12.06.2020.
Tree felling activities commenced on 06th December 2019. Talabira Mine operation commenced on 11th December 2019. Coal Production commenced on 26th April 2020.
Land compensation to PAPs started on 24th July 2019.Disbursement of compensation for Tenancy Land till 25th June 2020, Payment was made for 143.42 Acres and total value of the cheques disbursed was Rs.53.40Crore. Railway Siding:Package-I:LoA has been issued to M/s Triveni Engicons Pvt Ltd on 13th March 2020. Package-II: LoA has been issued to M/s SMS Ltd on 5th June 2020.
92

Date of approval
Sanctioned Cost
Rs. Crore
Scheduled date of
completion
Anticipated Cost Rs. Crore
Anticipated date of
completion
Cumulative Expenditure
upto 31.03.2020R
s. Crore
Capex 2020-21 Rs. Crore
Cumulative upto30.06.202
0 Rs. Crore
Cumulative Progress (%)upto30.06.2020
Physical Financial
Target /Schedule
Actual Target
/Schedule Actual Target ActualProvl(u
pto30.06.2020)
2X10MW PROJECT AT SOUTH ANDAMAN: 28.05.2018 & 09.10.2018
(Order Value)
130.77 11.03.2020 130.77Cr 30.06.2020 119.82 0.00 0.00 119.82 100.00 98.50 100.00 91.63
Andaman & Nicobar Administration, Electricity Department issued commissioning certificate on 16thJanuary 2019 indicating date of commissioning of 2.5 MWcapacity out of 2x10 MW capacity as 31stDecember 2018.
Balance 17.5 MW capacity of the plant has been commissioned on 30.06.2020 and Commissioning certificate for entire 20 MW is requested and is expected to be received in first week of July 2020.
93

PROJECTS IN PIPELINE
Date of approval
Anticipated Cost
Rs. Crore
Scheduled date of
completion
Anticipated Cost Rs.
Crore
Anticipated date of
completion
Cumulative Expenditure
upto31.03.2020Rs. Crore
Capex 2020-21 Rs. Crore Cumulativ
e upto30.06.
2020 Rs. Crore Actual
Cumulative Progress (%)upto30.06.2020
Physical Financial
Target /Schedule
Actual Target /Schedule
Actual Target ActualProv
l(upto30.06.
2020)
THERMAL POWER STATION II SECOND EXPANSION PROJECT (2X660 MW, Neyveli):
23.03.2015 8,733.49 Unit-I 3/2023
Unit-II- 9/2023 8,733.49
Unit-I 4/2026 Unit-II- 10/2026
55.88 620.0 0.06 55.94 -- -- -- 0.64
Feasibility Report: Consent Obtained from M/s. Desein for the extending the validity of contract upto 30th August 2020. The consultant furnished revised and updated
cost (base level Oct 2019) on 28th October 2019.The EOT of contract was done up to 29th August 2020
An appeal has been filed before Green Tribunal, Southern Zone by Shri. P. Sundaravadhanam against the Environmental Clearance accorded to TPS-II 2nd
Expansion Project (29th October 2018) and the first hearing was held on 22nd May 2019. In the NGT hearing held on 08th November 2019, the application for
condonation of delay was listed. The Bench after hearing all our submissions and perusing the application and counter affidavits on record condoned the delay in
filing the appeal and was inclined to proceed on the merits of the appeal.
Hearing is adjourned to 15th July 2020 due to present lockdown environment. Consent To Establishment (CTE) order for TPS II 2nd Expansion Project was obtained from TNPCB on 07th April 2020.
Steam Generator & Auxiliaries Package (SE-1) & Steam Turbine Generator &Auxiliaries Package (SE-2): Board vide its 494th Meeting held on 13th September 2019, accorded approval for cancellation of Package-wise tender.In principle approval was obtained for executing the project through single package EPC direct tender in November 2019. The process for floating single EPC mode is under way. Preliminary project activities hampered due to restrictions imposed owing to COVID-19.
94

Date of approval
Anticipated Cost
Rs. Crore
Scheduled date of completion
Anticipated Cost
RsCrore
Anticipated date of
completion
Cumulative Expenditure upto31.03.2
020Rs. Crore
Capex 2020-21
Rs. Crore
Cumulative upto30.06.2
020 Rs. Crore
Cumulative Progress (%)upto30.06.2020
Physical Financial
Target /Schedule
Actual Target
/Schedule Actual
Target Actual
(upto30.06.2020)
2400 MW PITHEAD COAL BASED TPP AT ODISHA (NTTPP)
25.01.2017 17,636.78 Unit-I 5/2023
Unit-II 11/2023 Unit-III 05/2024
17,636.78 Unit-I 4/2026
Unit-II 10/2026 Unit-III 04/2027
30.90 1575.0 0.00 30.90 -- -- -- 0.18
Ministry of Revenue, Govt. of Odisha issued Section 4 (1) Notification for acquisition of land in the Jharsuguda District on 8thMarch 2019 and in the Sambalpur District, on 30thMay 2019.
Ministry of Coal was again requested, vide letter dated. 7thMay 2019 to take up with MoP the issue of according approval for supply of power from NTTPP (Phase-I - 3x800 MW) by according exemption to NLCIL from tariff based competitive bidding route and also for allocation of power from this project to the beneficiaries viz., Governments of Tamil Nadu, Kerala, Puducherry and Odisha. CEA vide Lr, dated. 6 thAugust 2019 sought for certain clarifications on power allocation and NLCIL’s reply for the same was submitted on 11th October 2019. A draft letter to be addressed to the Secretary/ Ministry of Power by Secretary/Ministry of Coal on the said subject of seeking exemption from competitive bidding route for sale of power has been prepared and sent to Additional Secretary, MoC for onward submission to Office of the Secretary/MoC, vide dated 17.04.2020.
Public hearing for the land acquisition in the Jharsguda district by SPCB Odisha was held on 13.11.2019 In the meeting of 22ndHLCA meeting held on 19th February 2020, 800MW of power out of 3200MW from NTTPP is allocated to Odisha State in two Phases.
Phase-I is around 400 MW and Phase-II is remaining 400MW. Obtained Consent from Consultant upto 30thAugust 2020, to extend the validity of EIA/EMP study Contract. Form-2 Application along with EIA/EMP report &
Annexures etc. were submitted and uploaded in MoEF PARIVESH Online portal on 19.02.2020.The Application is listed as item No.3 in 39th EAC meeting scheduled on 10.04.2020 through VC mode. On 10.04.2020, EAC presentation was made to EAC members through Video Conference mode.EAC Minutes are received on 1stMay 2020. Revised EIA report was prepared and submitted to MoEF&CC on 19.06.2020.
Vide Lr dated 29.05.2020, Range Officer/Jharsuguda addressed Lr to DFO/Jharsuguda regarding detailed enquiry report in connection with construction of NTTPP (3X800MW) in Jharsuguda District.
Steam Generator & Auxiliaries Package (NTT-1) & Steam Turbine Generator &Auxiliaries Package (NTT-2):
NLCIL board in its 495th meeting held on 08.11.2019 has accorded approval for deferring the multi package tenders (comprising of all the four major works viz., SG, STG, BOP and FGD) and to go in for Single EPC method through EOI method.
In its 438th meeting held on 14.02.2020 the Empowered Committee of Directors of NLCIL, deferred the proposal for revised EPC cost. Note submitted for approval of revised EPC cost to Project Sub Committee of Directors on 19th February 2020 to recommend to NLCIL Board of Directors.
Project Sub Committee of Directors of NLCIL, in its 34thmeeting, vide agenda PSC 34.05 resolution, held on 18th March 2020 desired that more details on the related financials including the feasibility of the project consequent to the increase in the project cost may be put up to the committee for consideration along with the institutional arrangements to ensure execution of the project within the sanctioned cost and time limits.
Theproposal is to be reviewed after obtaining necessary exemptions from MOP for competitive bidding route and followed by PPA. Preliminary project activities hampered due to restrictions imposed owing to COVID-19.
95

Date of approval
Anticipated Cost
Rs. Crore
Scheduled date of
completion
Anticipated Cost
RsCrore
Anticipated date of
completion
Cumulative Expenditure upto31.03.2
020Rs. Crore
Capex 2020-21
Rs. Crore
Cumulative upto30.06.2
020 Rs. Crore
Cumulative Progress (%)upto30.06.2020
Physical Financial
Target /Schedule
Actual Target
/Schedule Actual
Target Actual
(upto30.06.2020)
MINE-III(11.50 MTPA)
-- 2130.30 * 2130.30 * 43.05 87.00 0.00 43.05 -- -- -- -- * Project is under Formulation.
Board of Directors of NLCIL has accorded approval for the expenditure sanction of Rs.7.05 Crores for Phase-I AAP activities. As per instructions from MOEF&CC to go for supercritical boilers (2X660MW) instead of 1000MW earlier, approval was obtained to increase Mine capacity from 9.0 to 11.50 MTPA on 09th August 2016.
Mine Planning: As per MoC Guideline dated 16th December 2019, Director Geology & Mining has to give Letter of Intent to give lease. NLCILofficials and Advisor/LA are following up the works.
Land Acquisition: District Collector (DC) recommended the Land acquisition proposal and forwarded to the CLA (Commissioner of Land Acquisition), Chennai on 31st July 2018. CLA approved the proposal on 05th February 2020. It is forwarded to Govt. for further approval.
Environmental Clearance: Public Hearing was conducted on 11th December 2018. Form-II has been uploaded by the consultant in MoEF&CC portal on 06th March 2020. Again MoEF&CC issued EDS (Essential Details Sought) seeking Letter of Intent and mining Plan approval on 16 th March 2020. MOC also sought Letter of Intent for Mining plan approval. Letter of Intent proposal is pending with Tamilnadu Government. Further works are getting delayed due to various restrictions imposed due to COVID-19.
96

Statement 8.3: Status on On-going Projects of NLCIL
Thereare12 Ongoing Projects in SCCL. For 02 Projects, Board approved Project completion
report. (Status of 6 Projects awaiting reservation is not furnished) as on 30.06.2020 costing
Rs. 20.00 Cr. and above. The Progress in construction of these Projects is furnished
hereunder:
S.No Name of the Project Sanctioned
Capital (Rs. Cr.)
Capacity
(MTPA)
1 Srirampur OCP-II Expn. 272.73 3.500
2 RCE of Indaram OCP 349.28 1.200
3 RCE of MNG OCP 415.70 1.500
4 RCE of Kondapuram UG (Outsourcing) 56.88 0.700
5 RCE of Ramagundam OCP-II Extn. 489.62 4.000
6 RCE of Kistaram OCP 164.04 2.000
7 RCE of JVR OCP – II 473. 22 10.00
8 Kasipet - 2 Incline 60.18 0.470
9 RCE of KK OCP 384.32 1.750
10 RCE of KTK OCP-II 442.42 1.250
11 KTK OCP- III 413.84 2.500
12 Godavarikhani Coal Mine (No.2 & 2A and No. 5) 438.98 3.000
13 RKP OCP (Completed) 209.78 2.500
14 RG OCP-III Extn. (Phase-II) (Completed) 365.01 2.000
8.3(a). SRIRAMPUR OCP-II (Expansion):
A) Date of sanction : FR : 20.10.2004 & RFR : 06.01.2006
: RCE : 16.10.2015 & RCE : 04.11.2016
B) Financial Progress:
1) Sanctioned capital : RFR : Rs. 88.47 Cr. & RCE - I : Rs. 322.98 Cr.
: RCE - II : Rs. 272.73 Cr.
2) Total Capital Outlay : Rs. 384.33 Cr.
3) Cumulative expenditure up to June, 2020 : Rs. 153.75 Cr. (Provisional)
4) Now anticipated cost : Rs. 272.73 Cr.
5) Status of RCE/RFR : RCE - II approved on 04.11.2016
C) Physical Progress:
1) Ultimate Capacity : FR:1.50 MTPA, RFR :2.50 MT PA &
RCE:3.50 MTPA
2) Anticipated year of completion : 2020-21
3) Production in 2020-21 up to June, 2020 : 0.43 MT
4) Overburden removal in 2020-21
up to June, 2020
: 7.25 M. Cum
D) General Status in brief as on 30.06.2020
1. Forest Land (100.82 Ha.): Obtained on 10.07.2009.
97

2. Forest Land (162.45 Ha.) :
Online application uploaded on 27.10.2017.
On 16.07.2019, PCCF requested to furnish comments on ADGF (Central) letter regarding the
violation of EC (increase in production more than stipulated in EC) granted to various projects.
Comments submitted on 02.08.2019 & PCCF forwarded to State Govt. on 23.08.2019. On
27.12.2019, State Govt. forwarded comments to MoEF & CC.
On 20.05.2020, SCCL submitted information on 3 points to PCCF, Hyd.
3. Public Hearing & EC:
ToR obtained on 23.01.2018, Public Hearing conducted on 19.09.2018. Form-II will be submitted
after obtaining FL - Stage-1.
4. Diversion of Private Land (50.21 Ha):
Requisition submitted during Oct, 2017.SD & enjoyment surveys to be taken up.
5. Non-Forest Land acquisition (Thallapalli, Singapuram, Guthedarpalli, & Ramaraopet
Villages):
a. Thallapalli (Ac.60.08½gts.)for dump area: PN published on 17.07.2019.
b. Singapuram: Ac.505.12gts (Agricultural Patta Land) for quarry area, Ac.131.16gts
(Structured Patta Land) for dump area Ac.312.03gts (Assigned Land) for dump area.:
Completed
c. Ramaraopet & Guthedarpalli for quarry area:
Ac.49-07gts, (Assigned land): Completed.
d. NF land (48.92 Ha) for expansion project: Requisition is to be submitted.
e. R&R: Thallapalli-800, Singapur-974, Guthedarpalli-136 Total PDFs =1910
f. R&R of Thallapalli village (800 PDF):
798/800 plots allotted. Allotment of remaining 2 plots is in active stage.
g. R&R of Singapur & Guthedharpalli villages (974 PDF in Singapur & 136 PDF in
Guthedarpalli):Singapur:
934 plots allotted. Issue of balance 40 plots is under process. Guthedarpally: 136 - plots allotted.
h. R&R Dubbapalii (120 PDF): Action is to be initiated (required in 5th year).
6. Indoor & outdoor sub-station: Completed.
7. Bifurcation of SRP 3 & 3A U/G workings beyond 100m depth line:
Development towards project boundary stopped & final extraction will be completed before
commencement of OC works.
8. Drilling of 6 Nos. large dia. (24") boreholes:Completed& two 300 HP pumps working.
9. Shifting of 33KV line: Completed during Jan’19.
10. 2-bay maintenance shed:Completed by Jan’20.
11. CHP: All works completed & PWWLS commissioned on13.01.2020.
12. Procurement of in - Pit Crushers & others:
3 Nos. supplied. P.O released on 12.10.2018, for Erection & commissioning of Feeder Breakers.
Erection commenced from 23.09.2019 &likely to complete by Aug’20.
13. Plough Feeders (2 Nos.):
P.O. released on 08.02.2018, supplied on 08.07.2019 & erection completed by Nov’19.
14. Rly. Line to STPP (21.175Km):
Single track line completed. 1st coal load taken on 01.08.2018
15. OBR: OBR commenced from 01.06.2013.
98

16. Coal Production: Production from the projects has started from 1.8.2009
1. Year 2009-10 = 1.79 MT
2. Year 2010-11 = 2.31 MT
3. Year 2011-12 = 2.94 MT
4. Year 2012-13 = 2.50 MT
5. Year 2013-14 = 1.45 MT
6. Year 2014-15 = 2.541MT
7. Year 2015-16 = 2.70 MT
8. Year 2016-17 = 2.03 MT
9. Year 2017-18 = 2.575MT
10. Year 2018-19 = 2.98 MT
11. Year 2019-20 = 2.97 MT
99

8.3(b). INDARAM OCP PROJECT:
A) Date of sanction : 04.07.2011 & RCE: 19.8.2017
B) Financial Progress:
1) Sanctioned capital : Rs. 162.76 Cr. & RCE: Rs. 349.28 Cr.
2) Total Capital Outlay Rs. 358.43 Cr.
3) Cumulative expenditure up to June, 2020 : Rs. 251.14 Cr. ( Provisional)
4) Now anticipated cost : Rs. 349.28 Cr.
5) Status of RCE : RCE approved on 19.8.2017
C) Physical Progress:
1) Ultimate Capacity : 1.2 MTPA
2) Anticipated year of completion : 2021-22
3) Production in 2020-21 up to June, 2020 :-
4) Overburden removal in 2020-21 up to June,
2020
: 1.09 M Cum
D) General Status in brief as on 30.06.2020:
Project was held up due to Villagers & Political leaders are opposing the OC project. RCE is
approved by Board on 19.08.2017, with changed parameters as socio-political atmosphere is
improved. Land acquisition is under progress. 1.Mining plan:
Approved on 17.09.2017. Integrated (IK-OC & IK-1A) MP was approved by MoC on 23.09.2019. 2.Environmental clearance:
Obtained for 1.50 MTPA (Peak) on 31.07.2008. Revised EC for 2.00 MTPA to be obtained. 3.Private Land-Ac.1048-38gts:
Requisition submitted on 02.11.2016. SD & Enjoyment survey completed for Ac. 1096-17½gts.
PN published on 23.08.2019 for Tekumatala & Kachanapally villages & Indaram village @ Ac.
624-10gts on 08.09.2019. Valuation of Trees & Structures completed.
On 28.12.2019, finalised rate/Acre. PD published on 23.12.2019 for all the 3 villages. Fund of
Rs. 232.89 Cr. deposited to DC on 17.02.2020. Indaram consent award passed on 13.03.2020 to
an extent of Ac. 410.20gts.
Tekumatla consent award passed on 11.03.2020 to an extent of Ac. 304-25½gts. Kachanapally
consent award passed on11.03.2020 to an extent of Ac. 40-21½gts. Total Consent award passed
to an extent of Ac. 755-27gts. Rs.232.89 Cr. disbursed.
For remaining Ac.275-39gts.General Award preparation is under process. 4.Diversion of 400Kv OHT lines (Power grid):
20% funds deposited on 02.01.2020 & tender to be awarded by Power grid. 5. Diversion of 400Kv OHT lines (TS Transco): Completed. 6. Bridge on Highway:
Work for construction of RUB commenced from 23.11.2019 & traffic diverted from 17.02.2020.
Piling work completed. Raft for Bridge & trench cutting for ramp side wall is under progress. 7. Embankment around Quarry:
The embankment of 6.8Km in phase-I up to a height of 838.50m RL is included in the OBR
proposal. 2.27Km length bund, 0.6m depth bottom soil removed and 1.5m depth key trench
completed along the Godavari River.
Filled the Key trench & raised the bund 0.9m above the ground level for half width towards
Godavari side for 1Km. Towards quarry side sand filling commenced from 29.04.2020. Sand
filling completed along Godavari from 3100m to 4950m chainage. Bund raised upto 833.50m RL
all along Godavari. Stone pitching, formation of drains & other works are to be made by civil
department, SRP. 8. Drilling of large dia. BHs: Work awarded on 09.08.2019 & work is under progress (One BH
collapsed & another BH reaming to 32” is in progress).
100

9. CHP: Will be taken up after land acquisition. Mean while Mobile Crusher will meet the
requirement. 10. P&M: Procurement is under progress. 11. Commencement of OBR: OBR commenced from 15.05.2020. 12. Commencement of Production: Coal production is expected from Aug’20.
101

8.3(c). RCE OF MANUGURU OPENCAST PROJECT:
A) Date of sanction : FR: 03.01.2008, RFR: 10.11.2012 & RCE:
13.05.2015
B) Financial Progress:
1) Sanctioned capital : FR: Rs. 431.45 Cr.
: RCE: Rs. 415.70 Cr.
(Excluding WDV of existing facilities & actual
expenditure at the time of RCE).
2) Total Capital Outlay Rs. 380.73 Cr.
3) Cumulative expenditure up to June, 2020 : Rs. 191.25 Cr. (Provisional)
4) Now anticipated cost(RCE) : Rs. 486.27 Cr.
5) Status of RCE : Approved by Board on 13.5.2015
C) Physical Progress:
1) Ultimate Capacity : 1.80 MTPA
2) Anticipated year of completion : 2020-21
3) Production in 2020-21 up to June, 2020 : 0.37 MT
4) Overburden removal in 2020-21 up to June,
2020
: 7.21 M. Cum
D) General Status in brief as on 30.06.2020 :
1. Forest Land (33.58 Ha):Final approval obtained on 3.5.2016.
2. Non Forest land: Completed Possession taken
3. Govt. land (AC.28- 38gts): Collector, KMM issued proceedings on 10.10.2016.
4. Additional Mining Lease (373.90 Ha.):State Govt. granted Mining Lease on 06.02.2015.
5. R&R Tribal (181 PDF): Completed.
6. R&R Non Tribal (1063 PDF) : Completed
7. Flood Protection Bund: Flood protection bund work completed by Oct’19.
8. OBR: OB removal commenced from Jan, 2017.
9. Coal Production: Production commenced from Feb, 2017
i) Year 2016-17=0.45 MT
ii) Year 2017-18=1.50 MT
iii) Year 2018-19=1.50 MT
iv) Year 2019-20= 1.80 MT
10. Note: Project completion Report is under preparation.
102
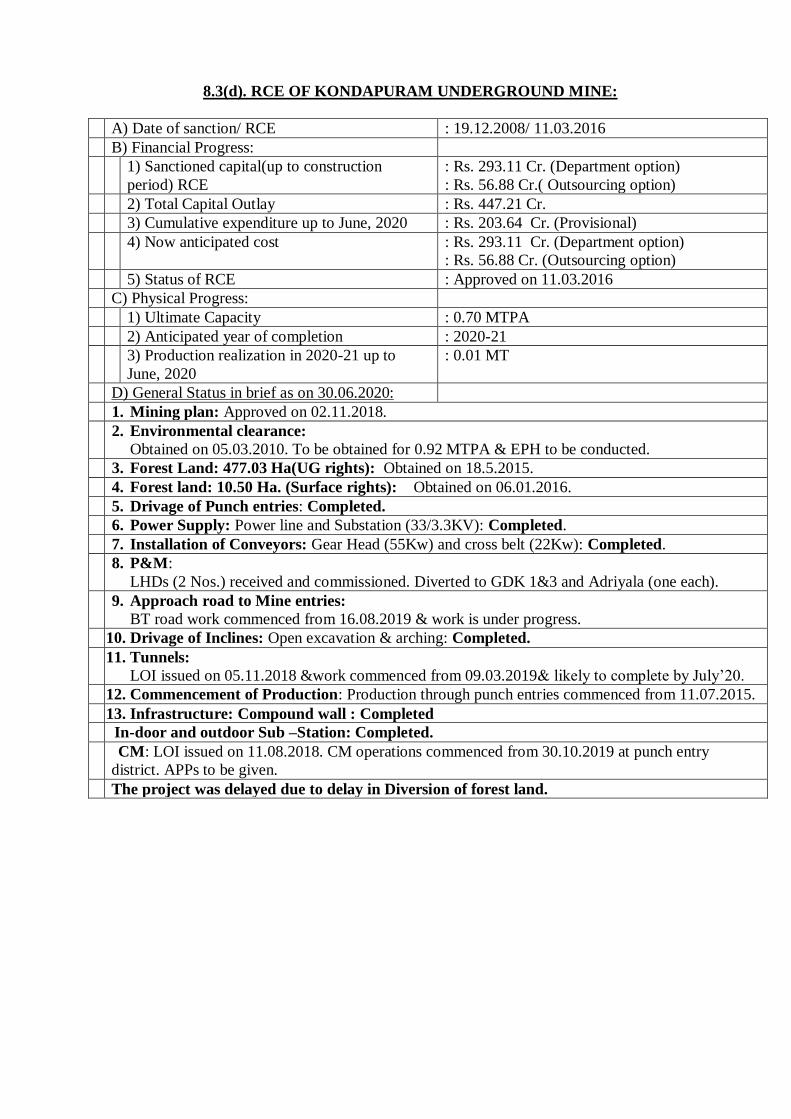
8.3(d). RCE OF KONDAPURAM UNDERGROUND MINE:
A) Date of sanction/ RCE : 19.12.2008/ 11.03.2016
B) Financial Progress:
1) Sanctioned capital(up to construction
period) RCE
: Rs. 293.11 Cr. (Department option)
: Rs. 56.88 Cr.( Outsourcing option)
2) Total Capital Outlay : Rs. 447.21 Cr.
3) Cumulative expenditure up to June, 2020 : Rs. 203.64 Cr. (Provisional)
4) Now anticipated cost : Rs. 293.11 Cr. (Department option)
: Rs. 56.88 Cr. (Outsourcing option)
5) Status of RCE : Approved on 11.03.2016
C) Physical Progress:
1) Ultimate Capacity : 0.70 MTPA
2) Anticipated year of completion : 2020-21
3) Production realization in 2020-21 up to
June, 2020
: 0.01 MT
D) General Status in brief as on 30.06.2020:
1. Mining plan: Approved on 02.11.2018.
2. Environmental clearance:
Obtained on 05.03.2010. To be obtained for 0.92 MTPA & EPH to be conducted.
3. Forest Land: 477.03 Ha(UG rights): Obtained on 18.5.2015.
4. Forest land: 10.50 Ha. (Surface rights): Obtained on 06.01.2016.
5. Drivage of Punch entries: Completed.
6. Power Supply: Power line and Substation (33/3.3KV): Completed.
7. Installation of Conveyors: Gear Head (55Kw) and cross belt (22Kw): Completed.
8. P&M:
LHDs (2 Nos.) received and commissioned. Diverted to GDK 1&3 and Adriyala (one each).
9. Approach road to Mine entries:
BT road work commenced from 16.08.2019 & work is under progress.
10. Drivage of Inclines: Open excavation & arching: Completed.
11. Tunnels:
LOI issued on 05.11.2018 &work commenced from 09.03.2019& likely to complete by July’20.
12. Commencement of Production: Production through punch entries commenced from 11.07.2015.
13. Infrastructure: Compound wall : Completed
14. In-door and outdoor Sub –Station: Completed.
15. CM: LOI issued on 11.08.2018. CM operations commenced from 30.10.2019 at punch entry
district. APPs to be given.
The project was delayed due to delay in Diversion of forest land.
103

8.3(e). RCE of RAMAGUNDAM OC-II EXTENSION PROJECT:
A) Date of sanction : FR: 30.12.2009 & RCE: 16.11.2015
B) Financial Progress:
1) Sanctioned capital : FR: Rs. 418.97 Cr.; RCE: Rs. 489.62
(Excluding WDV
of existing facilities for Rs. 155.43 Cr. & actual
exp. of
Rs. 57.98 Cr.)
2) Total Capital Outlay : FR: Rs. 896.32 Cr. & RCE: Rs. 1200.04 Cr.
3) Cumulative expenditure up to June, 2020 : Rs. 416.066 Cr. (Provisional)
4) Now anticipated cost : Rs. 489.62 Cr.
5) Status of RCE : RCE is approved on 16.10.2015.
C) Physical Progress:
1) Ultimate Capacity : 4.00 MTPA
2) Anticipated year of completion : 2022-23.
3) Production in 2020-21 up to June, 2020 : 0.610 MT
4) Overburden removal in 2020-21 up to
June, 2020
: 8.10 M Cum
D) General Status in brief as on 30.06.2020:
1. Forest Land (333.48Ha.): Completed.
2. Non Forest land (1525-47 Ha): Land acquired - 1102.42 Ha. Land to be acquired - 423.05 Ha.
3. R&R: Rachapalli-572, Akkepalli-780, Ladnapur-721, Vakeelpalli-202, Adivarampet-200,
Budavarampet-800: Total=3275.
Rachapalli Ladnapur & Akkepalli villages:
SES was conducted for Rachapalli, Ladnapur & Akkepalli villages and draft SES published. SES for
Akkapalli is completed.
R&R center for Rachapalli PDF:
Land for R&R Center for Rachapalli village is identified in Govt. & Govt. assigned land
Ac.283.00gts at Bittupalli. Development completed in phase-I for 734 plots. Plots allotment for
Rachapally PDF (209) is in process. Development in Phase-II is to be taken up for Akkepally PDF.
4. R&R Center for Ladnapur PDF:
Private Land Ac 46-08gts and Govt. Land Ac.8-27gts: Instead of this site, PDF are requested to
provide R&R site at SCCL acquired land near CNC. The proposal was approved by competent
authority. Proposal submitted to Corporate for development of R&R site & site leveling is under
progress.
5. Adivarampet & Budavarampet villages:
SES to be conducted for Adivarampet & Budavarampet villages. But villagers are not co-operating
for enumeration and SES. However this land is required at later stages of the project.
6. R&R Development at Bittupally:
Development of 734 plots for Rachapally PDF completed and allotment of plots (209) is in process.
Development in Phase-II for Akkepally PDF: Civil works, tenders opened on 24.06.2020.
7. Diversion of L-6 Canal (Phase-I):Diversion completed & water diverted.
8. Manthani Road Diversion: As the village is not shifted, it is not possible to take up temporary
diversion. Hence a note is approved to drop temporary diversion. Permanent diversion will be
taken up after land acquisition and shifting of Ladnapur Village. R&B department was requested
to return the deposited amount.
9. OBR: OB removal is in progress.
104

10. Coal Production: Coal production commenced from 01.01.2010.
Year 2010-11=3.25 MT
Year 2011-12=2.14 MT
Year 2012-13=1.05 MT
Year 2013-14=0.73 MT
Year 2014-15=0.70 MT
Year 2015-16=1.50 MT
Year 2016-17=1.86 MT
Year 2017-18=1.93 MT
Year 2018-19=2.16 MT
Year 2019-20=2.37 MT
In view of abnormal increase in cost of land and R&R, RCE is approved on 16.10.2015.
105

8.3(f). RCE of KISTARAM OCP:
A) Date of sanction : FR : 01.11.2010 & RCE: 04.03.2017
B) Financial Progress:
1) Sanctioned capital : Rs. 242.29 Cr. & RCE: Rs. 164.04 Cr.
2) Total Capital Outlay : Rs. 143.90 Cr.; RCE: Rs. 360.33 Cr.
2) Cumulative expenditure up to June, 2020 : Rs. 129.58 Cr. (Provisional)
4) Now anticipated cost : Rs. 164.04 Cr.
5) Status of RCE : RCE approved on : 04.03.2017
C) Physical Progress:
1) Ultimate Capacity : 2.00 MTPA
2) Anticipated year of completion : 2020-21
3) Production in 2020-21 up to June, 2020 : 0.07 T
4) Overburden removal in 2020-21 up to June,
2020
: 4.63 M. Cum
D) General Status in brief as on 30.06.2020:
1. Mining plan: Obtained on 21.03.2014.
2. Mining lease: Prior approval given by MoC on 21.03.2014. State Govt. issued GO on 05.07.2019.
3. Environment clearance: EC obtained on 18.06.2019. CFE obtained on 20.07.2019. CFO obtained on 18.10.2019.
4. Forest Land (285.44Ha.): State Govt. issued GO on 20.05.2019.
1. Non - Forest Land Requisitioned: Private land (Ac.91-29gts):
PN published on18.12.2017. Award enquiry completed. On 10.05.2018, Rs. 11.96 Cr. deposited
with Collector, KMM for Land compensation. On 29.01.2019, RDO finalised @ Rs.16.50
Lakh/Acre. Rs. 11.00 Cr. balance funds deposited on 08.05.2019. Compensation disbursed to land
owners for Ac. 69-15gts. Possession taken for Ac. 63-02gts on 28.12.2019. Court cases (Land
owner’s dispute) Ac. 22-14gts.
2. Govt. land (Ac.106-35gts+ Ac 79-30 gts.):
Requisition submitted on 27.03.2015. SD & enjoyment survey completed. Collector issued demand
an Amount of Rs. 24.31 Cr. for Ac. 186-25gts on 02.02.2018. Award enquiry completed.
Compensation finalised @ Rs. 16.50 Lakh/Acre & Rs. 24.34 Cr. was deposited with Collector as an
advance for Ac. 177-29gts. Awards passed for Ac. 157-23¼gts. On 05.08.2019, Rs.21.12 Cr.
disbursed to Land Owners for 128 Acres. Possession taken for Ac. 103-16¼gts on 26.11.2019.
Court cases (land owners dispute) for Ac.14-00gts.Tank/Road/Sikam Land (free from
encroachment) - Ac.20-05¾gts & amount to be disbursed to Land owners - Ac.15.00gts.
3. R&R details (160 PDF): R&R site is identified at Cherukupalli. SES completed on 01.02.2018. Draft R & R Plan is to be
prepared and to be published. PN published on 22.10.2018. Award enquiry completed. DLNC
Meeting held on 16.04.2019 at O/o Collector, KMM & compensation finalised @ Rs. 16.50
Lakh/Acre for Ac. 14.05gts. On 15.05.2019, demand received from Collector for Rs. 2.43 Cr. &
money disbursed to land owners on 11.06.2019. Possession of land taken on 04.07.2019 & tenders
awarded for development works. Site leveling work is in progress. R&R plan approval is pending
with DC. Gramasabha conducted on 19.06.2020.
4. Power supply arrangement:
Rs. 48.00 Lakh deposited to TSNPDCL for temporary power arrangement & power charged on
06.01.2020. Rs. 4.50 Cr. deposited on 14.10.2019 for dedicated power supply from Penuballi 33Kv
Substation to JVR OCPs, Kistaram OCP and SCCL Quarters. Contract awarded by TSNPDCL &
work to be taken up.
5. OBR: OBR Commenced from 18.10.2019.
6. Coal Production:
Coal production commenced from 15.02.2020 & achieved 0.192 MT during 2019-20.
106

8.3(g). RCE of JVR OCP II:
A) Date of sanction : FR : 04.07.2011 & RCE: 26.08.2016; RCE II:
13.03.2019
B) Financial Progress:
1) Sanctioned capital : Rs. 437.51 Cr. & Rs. 473.22 Cr. (RCE II)
2) Total Capital Outlay : Rs. 1261.65 Cr.
2) Cumulative expenditure up to June, 2020 : Rs. 18.60 (Provisional)
4) Now anticipated cost : Rs. 447.06 Cr.
5) Status of RCE/RFR : Approved on 26.08.2016
C) Physical Progress:
1) Ultimate Capacity : 10.00 MTPA
2) Anticipated year of completion : 2020-21
3) Production in 2020-21 up to June, 2020 : 0.66 MT
4) Overburden removal in 2020-21 up to
June, 2020
: 4.07 M Cum
D) General Status in brief as on 30.06.2020
1. Mining Plan: Comprehensive MP for 10MT approved on 11.02.2019.
2. Environment Clearance:
Form-I uploaded on 11.02.2019 for 10 MT. ToR received on 21.05.2019. EPH conducted on
14.02.2020. Minutes submitted to MoEF & CC.
Form-II will be uploaded after clearing JVR OC I violation issue.
3. Mining lease: Obtained on 03.11.2016.
4. Forest Land (776.20Ha): MoEF issued Stage-I on 12.09.2016 & Stage II on 30.5.2017.
State Govt. issued G.O on 07.07.2017. Completed
5. Non Forest land (686.80 Ha as per RCE): Private Land - 563.45 Ha & Govt. land – 123.35
Ha. Acquisition of Private land (Ac. 94-07gts. of Kistaram (dump yard): Completed
6. Acquisition of Private land (Ac. 489-04 gts. of Kommepalli):
09 land owners filed Writ Petition No. 21315/ 2017 on 20.06.2017 in Hon’ble High Court, Hyd.
challenging the Awards passed by Lok Adalat, KMM in respect of certain Survey Numbers.
Hon’ble High Court issued orders to maintain Status-quo.
On 28.11.2017, Hon’ble Prl. Dist. & Sessions Judge, KMM referred the case to Hon’ble High
Court, Hyd. to pass appropriate orders on the Award.
On 30.04.2018, Hon’ble high Court directed Dist. Judge to disburse amounts by 30.06.2018. During
trail hearing on 30.07.2018, Dist. Judge informed that compensation would be disbursed for about
Ac.309-00gts by 16.08.2018 on filing of individual Cheque Petitions.
On 31.07.2018, GM, Kgm & GM(Est) met Dist. Judge, KMM for disbursement of payments.
On 31.8.2018, Dist. Judge, KMM instructed the concerned to withdraw the amount for disbursement
to the land owners for an extent of Ac. 235-00 gts, who got Hon’ble High Court Orders (99 land
owners). Further, for Ac. 110-00gts, land owners have to approach the High Court to get the similar
orders for compensation (28 land owners).
On 30.09.2018 individual writ petitions’ submitted at Dist. Judge, KMM by land owners for an
extent of Ac. 124-00gts. Dist. Judge, KMM disbursed compensation during 2nd week of Jan’19 for
an extent of Ac. 238-00gts of Patta Land of Kommepalli village. Balance Ac. 63-00gts, the land
owners are submitting individual Cheque Petitions in the Dist. Court.
For remaining extent of Ac. 125-10gts Patta Land, award enquiry is under process at Dist. Judge
KMM& expected to be finalized by Aug’20.
7. Kommepalli Village Site (Ac 23-07gts) R&R:Completed.
Remaining land is required in subsequent years in different stages of the Project.
8. Govt. land (Ac 304-27gts): Ac. 260-26gts land is under possession of SCCL.
Remaining land is required in subsequent years at different stages of the Project.
107

9. R&R details (229 PDF) (Kommepalli): R&R approved for 229 PDF by Commissioner, R&R.
On 07.08.2018. R&R amount (Rs. 17.79 Cr.) was deposited with Collector, KMM. RDO, Kallur,
disbursed the R&R entitlements to the PDF of Kommepalli on 28.08.2018 to 30.08.2018.
On 02.10.2018, RDO, Kallur handed over house plots to PDF.
Development of R&R centre is under progress.
10. CHP: Construction of conventional CHP: Work commenced from 18.04.2019 & likely completion by July’20.
Hiring of mobile crushers:PO released on 09.07.2019. Machine commissioned on 11.11.2019.
11. Construction of CHP under EPC mode:
PO released on 19.04.2019. The Firm commenced work from 01.11.’19.
Scheduled completion is 18 months from Zero date i.e. from 01.11.2019 to 30.04.2021.
12. Railway line between Bhadrachalam Road to Sattupalli (53.20Km &Rs. 704.31 Cr.):
SCCL deposited Rs. 356.38 Cr. to SCR. Possession of land was handed over in14/14 villages (783
Acres/850 Acres handed over) to Railways. Earth work of Embankment started in two stretches, i.e.,
between Ch. 0.00 Km to Ch. 25.00Km (Aprx. 30,000 Cu.m) & Ch. 25.00Km to 53.70Km (Aprx.
50,00Cum) and work is in progress.
Railway authorities submitted on Line application in PCCF office on 30.01.19, for 4.3762 ha. from
Km. 49.10 to Km. 49.70 in Mandalapadu Village. Stage I approval accorded by Forest authorities
and an amount of Rs. 1, 46, 70,842/- deposited to Forest authorities. Working permission received
on 13.09.2019 and taking over of possession of land is in process.
On 30.10.2018, tender opened for all 10 Nos. bridges (2 Nos. ROBs across SHR & NHR and 8 Nos.
on other roads). 2 ROBs across National and State Highway- Work is in progress. 8/10 other major
ROBs -work in progress, where land is handed over. 26/34 minor RUBs- work in progress.
4/4 Relay, Battery, Generator rooms and Station buildings -work in progress.
13. OBR: OB removal commenced from 1st Sept, 2017.
14. Coal Production: Production commenced from 31.10.2017.
1. Year, 2017-18 = 0.749 MT
2. Year, 2018-19 = 2.955 MT
3. Year 2019-20 = 4.83 MT
108

8.3(h). KASIPET – 2 Incline:
A) Date of sanction : FR : 04.07.2011
B) Financial Progress:
1) Sanctioned capital : Rs. 60.18 Cr.
2) Total Capital Outlay : Rs. 57.86 Cr.
2) Cumulative expenditure up to June, 2020 : Rs. 47.82 Cr. (Provisional)
4) Now anticipated cost : Rs. 60.18 Cr.
5) Status of RCE/RFR : Not required.
C) Physical Progress:
1) Ultimate Capacity : 0.47 MTPA
2) Anticipated year of completion : 2020-21
3) Production in 2020-21 up to June, 2020 : 0.01 T
D) General Status in brief as on 30.06.2020:
1. Mining Plan: Approved on 01.01.2015.
2. Environment Clearance: Obtained on 11.05.2015.
3. NF Land required (33.08 Ha.). Completed.
4. Tunnels:Completed @ 211.30m & 226.60m. Coal production commenced from 23.01.2019.
5. Power supply – Completed
6. Surface infrastructures: Completed by Aug’19.
7. Surface Bunker: Work commenced from 11.12.2017 &completed.
8. Sinking of Air Shaft: 60m drivage completed by Jan’20. Inset preparation work in progress.
9. Fan house & Fan: TCR approved & order to be placed for construction of permanent Fan house.
10. Stowing Plant: Action to be initiated at later stages.
11. Road Diversion: Completed.
12. Coal production:
Coal production commenced from 23.01.2019 & achieved 0.043 MT during 2019-20.
109

8.3(i). RCE OF KK OCP:
A) Date of sanction FR/ RCE : FR/RCE : 24.07.2012/ 11.03.2016
B) Financial Progress:
1) Sanctioned capital FR/RCE : Rs. 417.33 Cr./ Rs. 384.32 Cr.
2) Total Capital Outlay : Rs. 493.18 Cr.
2) Cumulative expenditure up to June, 2020 : Rs. 120.36 Cr. (Provisional)
4) Now anticipated cost : Rs. 384.32 Cr.
5) Status of RCE/RFR : RCE approved on 11.03.2016.
C) Physical Progress:
1) Ultimate Capacity : 1.75 MTPA
2) Anticipated year of completion : 2020-21
3) Production in 2020-21 up to June, 2020 : 0.25 MT
4) Overburden removal in 2020-21 up to June,
2020
: 3.41 M. Cum
D) General Status in brief as on 30.06.2020:
1. Mining Plan: Approved on 25.11.2014
2. Mining Lease: Covered under NGML valid for further 20 years.
3. Environment Clearance: Obtained on 19.03.2015.
4. NF Land required (799.96 Ha as per FR):
Requisitioned for Ac. 1201-00gts :
On 19.04.16, Akenapalli Village Govt. Land Ac. 44.20gts (Quarry) handed over to SCCL.
On 09.6.2016, Govt. Assigned Ac. 32-34gts (MM), handed over to SCCL.
Ac.125-16gts:On 15.05.2018, land handed over to SCCL.
Ac. 173-06gts:For Ac. 50-21gts, on 05.03.2019, land handed over to SCCL.
Remaining Ac.122.25gts: PN published on 07.07.2019.DC instructed for re-survey & is under
progress.
5. Status of R&R of Dubbagudem Village (350PDF):
Enjoyment & SES completed on 22.05.2019 (Structures land: Ac. 8-20gts & Agriculture land:
Ac.17-13gts i.e. Total land = Ac. 25-33gts & Total houses-243).
PN published on 08.02.2020 to an extent of Ac. 08-20gts of structures land of Dubbagudem.
PN published for agriculture land to an extent of Ac.17-13gts on 24.03.2020.
6. Development of R&R centre:
R&R site identified at Peddanapalli village (Ac. 32-05gts -Govt. assigned agricultural land.)
Requisition given on 12.04.2019. SD & Enjoyment survey completed on 05.06.2019.
PN published & sent letters to departments for valuation of trees, bore wells etc. on 11.01.2020.
7. Diversions of 132KV OHT lines: Completed on 5.03.2017.
8. Diversion of 33Kv OHT lines:
Diversion by NPDCL @ 8.30Km completed on 03.11.2019 & SCCL @ 5.40Km is in progress.
9. Diversion of Nallah: Completed with RCC lining for about 300m.
10. CHP: Completed.
11. Diversion of Road (5.48 Km) Part-A: Work awarded & work is under progress.
12. Diversion of Road (5.57Km) Part-B - R&B accepted to take up the work & land handed over.
DPR submitted along with estimation of Rs. 39.00 Cr.
MoU concluded with R&B on 04.11.2019 & work awarded by R&B. Work to be taken up.
13. Flood protection bund (6.1Km): Will be taken up departmentally.
14. Procurement of HEMM: Required HEMM procured.
15. OBR: OB removal commenced from 21.04.2017.
16. Coal Production: Coal production commenced.
1. Year, 2017-18 = 1.01 MT
2. Year, 2018-19 = 0.80 MT
3. Year 2019-20 = 1.75 MT
110
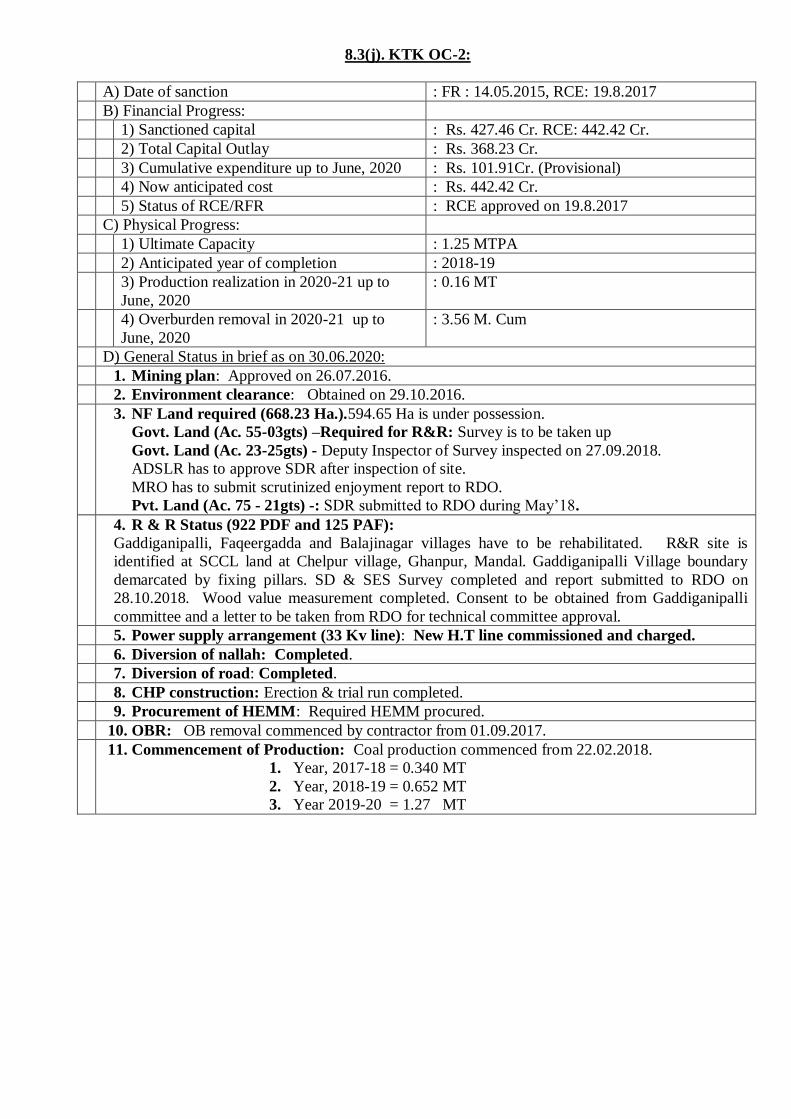
8.3(j). KTK OC-2:
A) Date of sanction : FR : 14.05.2015, RCE: 19.8.2017
B) Financial Progress:
1) Sanctioned capital : Rs. 427.46 Cr. RCE: 442.42 Cr.
2) Total Capital Outlay : Rs. 368.23 Cr.
3) Cumulative expenditure up to June, 2020 : Rs. 101.91Cr. (Provisional)
4) Now anticipated cost : Rs. 442.42 Cr.
5) Status of RCE/RFR : RCE approved on 19.8.2017
C) Physical Progress:
1) Ultimate Capacity : 1.25 MTPA
2) Anticipated year of completion : 2018-19
3) Production realization in 2020-21 up to
June, 2020
: 0.16 MT
4) Overburden removal in 2020-21 up to
June, 2020
: 3.56 M. Cum
D) General Status in brief as on 30.06.2020:
1. Mining plan: Approved on 26.07.2016.
2. Environment clearance: Obtained on 29.10.2016.
3. NF Land required (668.23 Ha.).594.65 Ha is under possession.
Govt. Land (Ac. 55-03gts) –Required for R&R: Survey is to be taken up
Govt. Land (Ac. 23-25gts) - Deputy Inspector of Survey inspected on 27.09.2018.
ADSLR has to approve SDR after inspection of site.
MRO has to submit scrutinized enjoyment report to RDO.
Pvt. Land (Ac. 75 - 21gts) -: SDR submitted to RDO during May’18.
4. R & R Status (922 PDF and 125 PAF):
Gaddiganipalli, Faqeergadda and Balajinagar villages have to be rehabilitated. R&R site is
identified at SCCL land at Chelpur village, Ghanpur, Mandal. Gaddiganipalli Village boundary
demarcated by fixing pillars. SD & SES Survey completed and report submitted to RDO on
28.10.2018. Wood value measurement completed. Consent to be obtained from Gaddiganipalli
committee and a letter to be taken from RDO for technical committee approval.
5. Power supply arrangement (33 Kv line): New H.T line commissioned and charged.
6. Diversion of nallah: Completed.
7. Diversion of road: Completed.
8. CHP construction: Erection & trial run completed.
9. Procurement of HEMM: Required HEMM procured.
10. OBR: OB removal commenced by contractor from 01.09.2017.
11. Commencement of Production: Coal production commenced from 22.02.2018.
1. Year, 2017-18 = 0.340 MT
2. Year, 2018-19 = 0.652 MT
3. Year 2019-20 = 1.27 MT
111

8.3(k). KTK OC III:
A) Date of sanction : 04.03.2017
B) Finan B) Financial Progress:
1) Sanctioned capital : Rs. 413.84 Cr.
2) Total Capital Outlay : Rs. 530.83 Cr.
3) Cumulative expenditure up to June, 2020 : Rs. 126.75 Cr. (provisional).
4) Now anticipated cost : Rs. 413.84 Cr.
5) Status of RCE/RFR
C) Physical Progress:
1) Ultimate Capacity : 2.50 MTPA
2) Anticipated year of completion : 2021-22
3) Production in 2020-21 up to June, 2020 : -
4) Overburden removal in 2020-21 up to
June, 2020
: -
D) General Status in brief as on 30.06.2020:
1. Mining plan: Approved on 19.11.2018.
2. Mining lease:
Application submitted to DMG for 422.69 Ha non coal bearing area. NoC obtained on 11.09.2019 &
submitted to ADMG on 12.09.2019. DGPS completed on 05.10.2019.
ADMG forwarded report to DMG on 18.12.2019. On 20.03.2020, required documents & affidavits
submitted to DMG.DMG forwarded to State Govt. for grant of Memo on 17.06.2020.
3. Environment clearance: EC obtained on 27.04.2020. CFE obtained on 01.07.2020.
4. Non forest land acquisition:
Revised Requisition submitted to Revenue Authorities on 21.04.2018, for Ac.2031-01gts. SD &
enjoyment surveys completed. PN published for Ac. 411-01½gts on 05.05.2019. Consent obtained @
Rs. 15 L/Acre from villagers. Demand received on 10.12.2019. Award enquiry conducted on
19/20.03.2020 & Rs. 64.04 Cr. deposited to DC. Award passed by D.C. & compensation disbursed to
136 Pattadars & is in progress.
PN published for 412 acres on 03.02.2020. Award enquiry was completed on 23.06.2020.
5. R&R:
Plots allotted to all Madhavaraopalli villagers on 25.08.2018. Development of R&R centre
completed. R&R (173 PDF) compensation approved for an amount of Rs.12.83 Cr. & amount
deposited. Draft PDF list finalized by MRO & submitted to RDO. RDO approved for 182 PDF and
file sent to Collector on 20.09.2019. DC approved on 26.02.2020 & file submitted to R&R
Commissioner on 27.02.2020.R&R plan approved by R&R Commissioner @181 PDF.
Final Panchanama completed on 19.06.2020 & demolition of structures is under progress.
6. CHP: Land of Ac. 15-00gts handed over for erection of Mobile Crusher.
Construction of permanent CHP will be taken up later.
7. Diversion of transmission line: Work completed on 20.02.2020.
8. Diversion of Roads for Coal Transportation and Service road (1.80 KM):
Work is under progress.
9. OBR: OBR scheduled from July’20.
10. Coal production: Coal production expected from Oct20.
112

8.3(l). Godavarikhani Coal Mine (No.2 & 2A and No. 5):
A) Date of sanction : FR: 26.07.2019
B) Financial Progress:
1) Sanctioned capital : FR: Rs. 438.98 Cr.
2) Total Capital Outlay : Rs. 607.04 Cr.
3) Cumulative expenditure up to June, 2020 : Rs. 8.65 Cr. (Provisional)
4) Now anticipated cost : Rs. 438.98 Cr.
5) Status of RCE :
C) Physical Progress:
1) Ultimate Capacity : 3.00 MTPA
2) Anticipated year of completion : 2022-23
3) Production in 2020-21 up to June, 2020 : -
4) Overburden removal in 2020-21 up to June,
2020
: -
D) General Status in brief as on 30.06.2020:
1. Mining plan: Approved on 29.03.2019.
2. Environmental clearance: Linked to GDK 1, 2 & 5 EC violations. 2nd EAC held on 04.06.2020 & recommended for EC.
After obtaining EC for violation mines, ToR will be processed for GDK Coal Mine. Linked to
Sivaram ESZ for which draft ESZ notification has to be given by MoEF & CC.
Application submitted to National Board of Wild Life (NBWL) & wild life conservation plan
(WLCP) for Siwaram ESZ submitted to Conservative office, NIRMAL.
4.Mining Lease: Available.
5.Acquisition of NFL (Ac. 186-19gts required for Quarry & Dump yard): SD & Enjoyment survey completed. PN published for Ac. 16-04gts on 05.12.2019.
Remaining land PN is under process.
6.Acquisition of NFL (Ac. 70-38gts required for Road & Nallah): PN published on 30.05.2019
for Ac. 24-13gts. Balance land is govt. land @ Ac. 19-28gts is in process.
7.Diversion of Road:
Work awarded on 01.01.2019. Eucalyptus plantation removed at SCCL land of 1.8Km. 7 Hume
pipe Culverts & 3 Slab Culvert completed and formation of road is in progress at this stretch.
8.Diversion of Nallah: Work awarded on 04.05.2019.Work commenced during Dec’19.
9.Relocation of Main Magazine:
Location finalised along the diverted road near Upparlakesaram. Land acquisition to be done.
10. Shift. of existing Nursery: Fencing & other preparatory works are in progress.
11. Shift. of Gas godown: Work to be taken up.
12. Diversion of 33Kv TSNPDCL OHT Line: To be taken up
13. Diversion of BSNL Tele Communication Cables: To be taken up
14. Shifting of 33Kv outdoor Sub-station: To be taken up
15. Procurement of P&M: Existing MOCP equipment will be utilized for some time.
16. OBR: Commencement of OBR is expected from Oct’20.
17. Commencement of Production: Coal production expected from Dec’20.
113

MINISTRY OF COAL
O/o Deputy Director General
A-Wing, 5th Floor, Lok Nayak Bhavan,
Lok Nayak Bhavan, New Delhi- 110003